Embed Size (px)
Citation preview
Life Cycle Assessment of Reclaimed Asphalt Pavement to Improve Asphalt Pavement
Sustainability
By: Christopher D. DeDene
Advised By: Mihai Marasteanu and Eshan Dave

Background

Asphalt Recycling • 97% of roads are surfaced with asphalt • Most “recycled” resource in the world
– By tonnage and percentage – 50 million tons of RAP generated every
year • Down-cycling vs. recycling • 98% of states allow at least 15% RAP in
new hot-mix asphalt (HMA)

Recycling Process
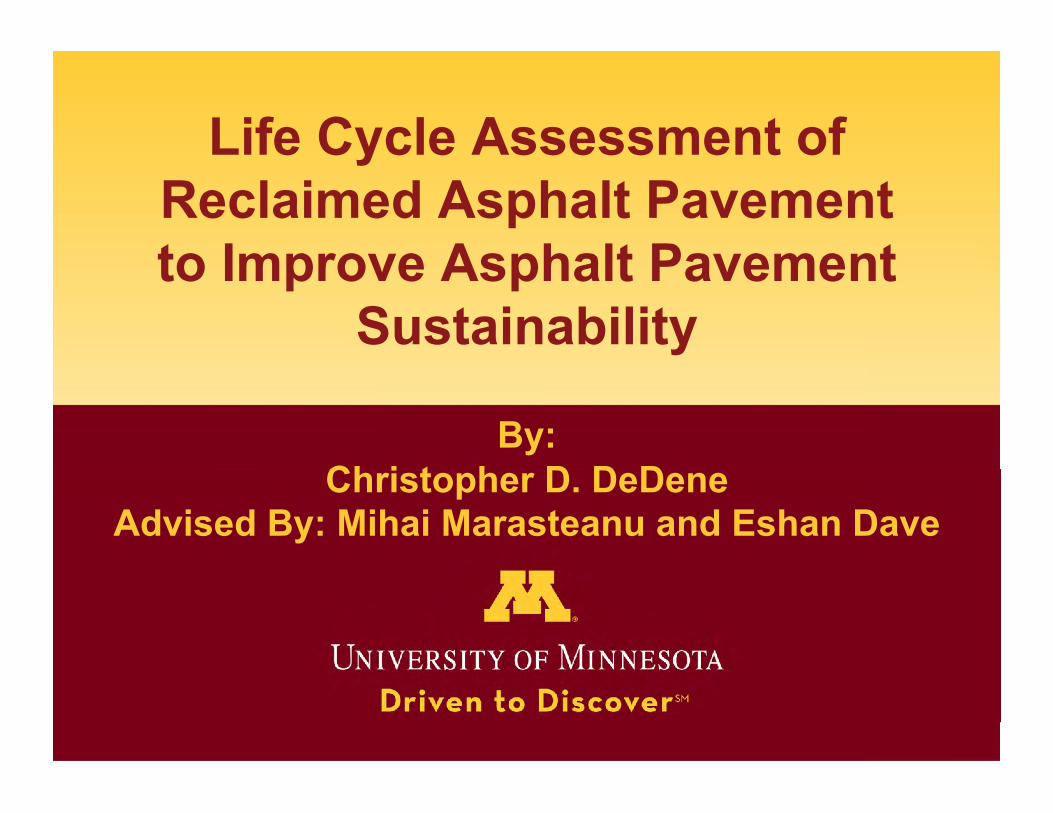
Road Ages
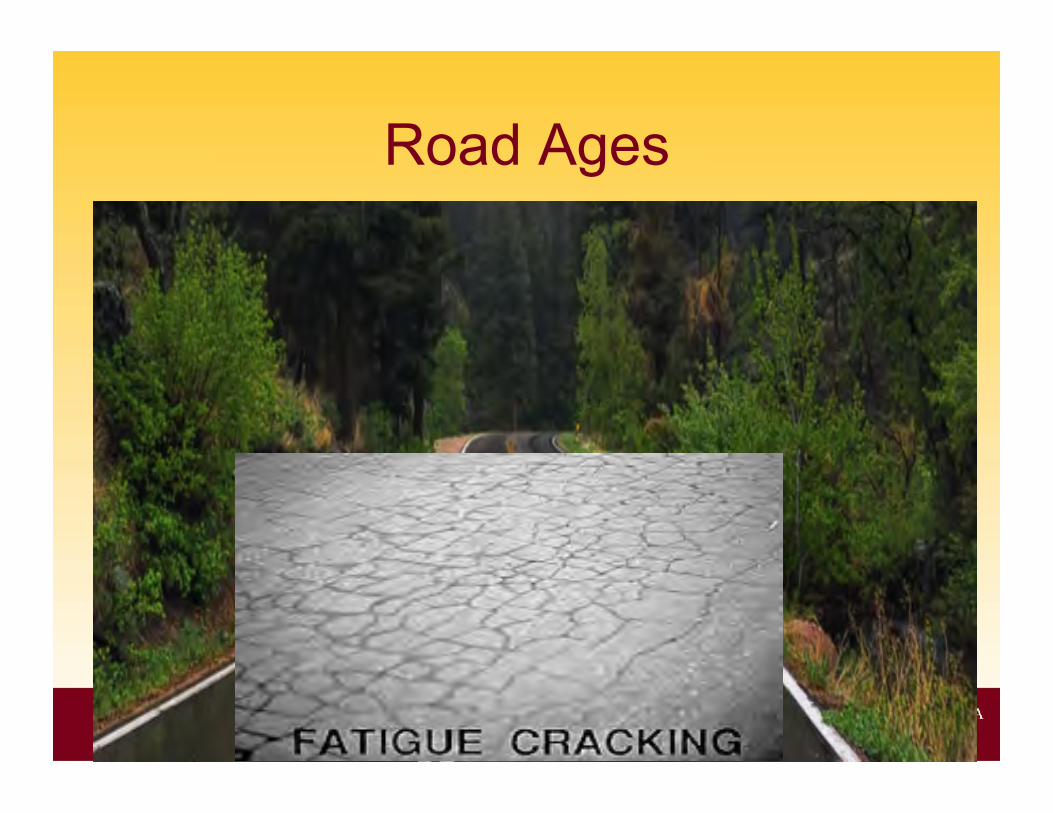
Create Reclaimed Asphalt Pavement (RAP)
Courtesy of http://myconstructionphotos.smugmug.com/
RAP
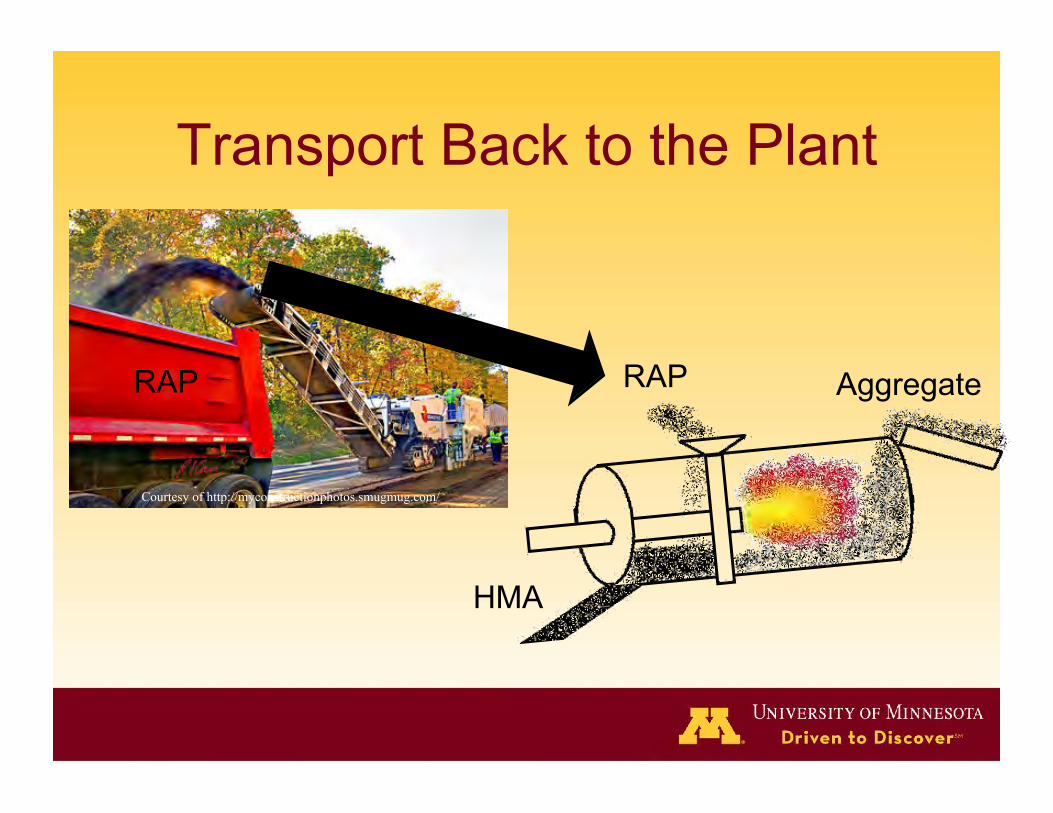
Transport Back to the Plant
Courtesy of http://myconstructionphotos.smugmug.com/
RAP Aggregate RAP
HMA

Factors to Consider
• 3 Legs of sustainability – Socially sustainable
• People – Economically sustainable
• Profit – Environmentally sustainable
• Planet
www.energyeducation.tx.gov

RAP and the Planet
• Environmental considerations of using RAP – Reduce need for virgin material
• Binder • Aggregate
– Greatly increased heating demand • Need to re-melt old binder on the RAP

Life Cycle Assessment (LCA)
•

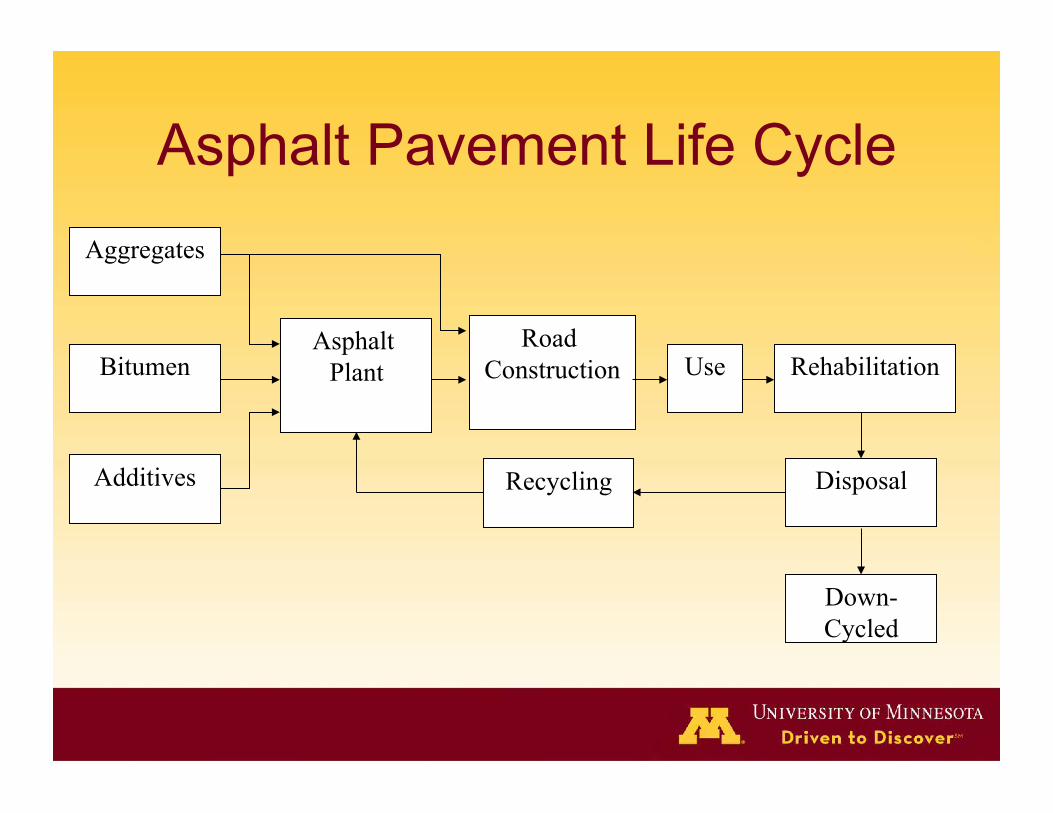
Asphalt Pavement Life Cycle
Road Construction
Aggregates
Additives
Bitumen
Down-Cycled
Asphalt Plant Use
Disposal
Rehabilitation
Recycling

Objective
• Quantify the environmental impacts of 2 pavements – 1 with entirely new materials – 1 with 15% RAP
• Determine if emissions or energy benefits from using RAP exist
• Is paving with RAP environmentally sustainable?
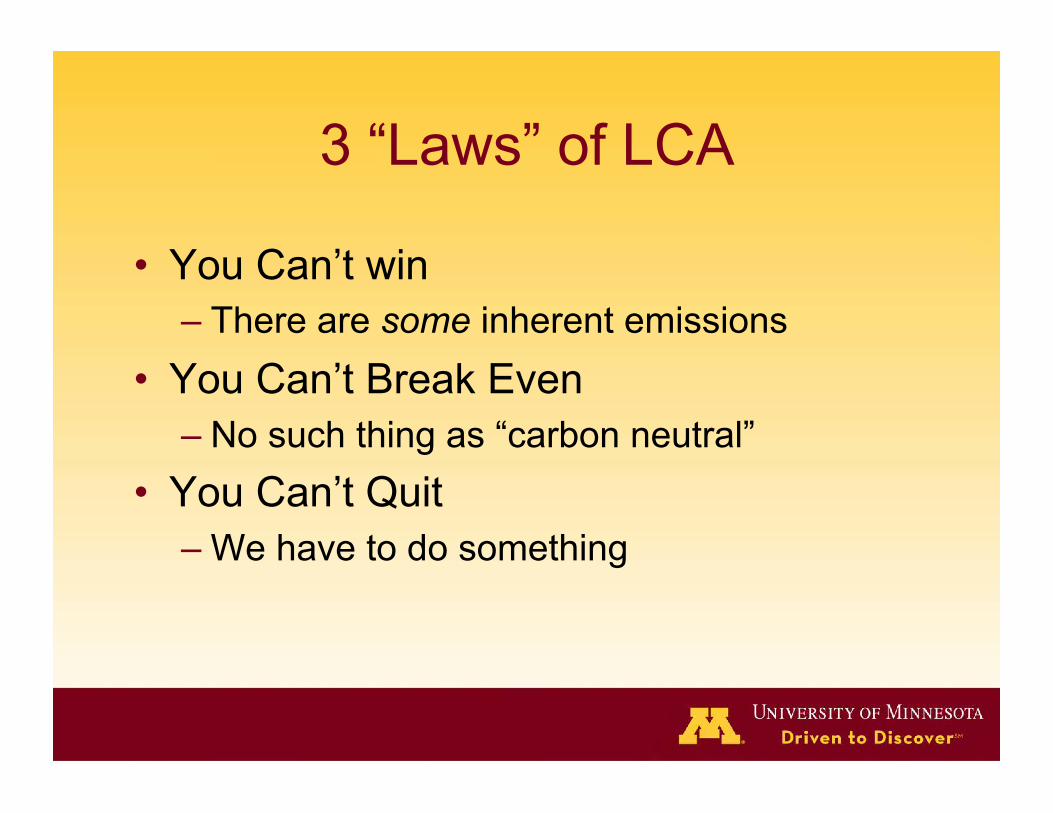
3 “Laws” of LCA
• You Can’t win – There are some inherent emissions
• You Can’t Break Even – No such thing as “carbon neutral”
• You Can’t Quit – We have to do something

Carbon Footprint Perspective
• Asphalt Mixture – 60 g C02e/ kg

Carbon Footprint Perspective
• Asphalt Mixture – 60 g C02e/ kg
• Orange Juice – 1600 g C02e/ kg
Jan Th. van der Zwan

Carbon Footprint Perspective
• Asphalt Mixture – 60 g C02e/ kg
• Orange Juice – 1600 g C02e/ kg
• Cheeseburger – 6,000 g C02e/ kg

My LCA
• Two different pavements – 1 made of virgin materials – 1 made of 15% RAP
• Two transportation scenarios – Rural project (long haul distances) – Urban project (short haul distances - Local)
• Using mid-point indicators – Energy Demand and kg CO2e/kg
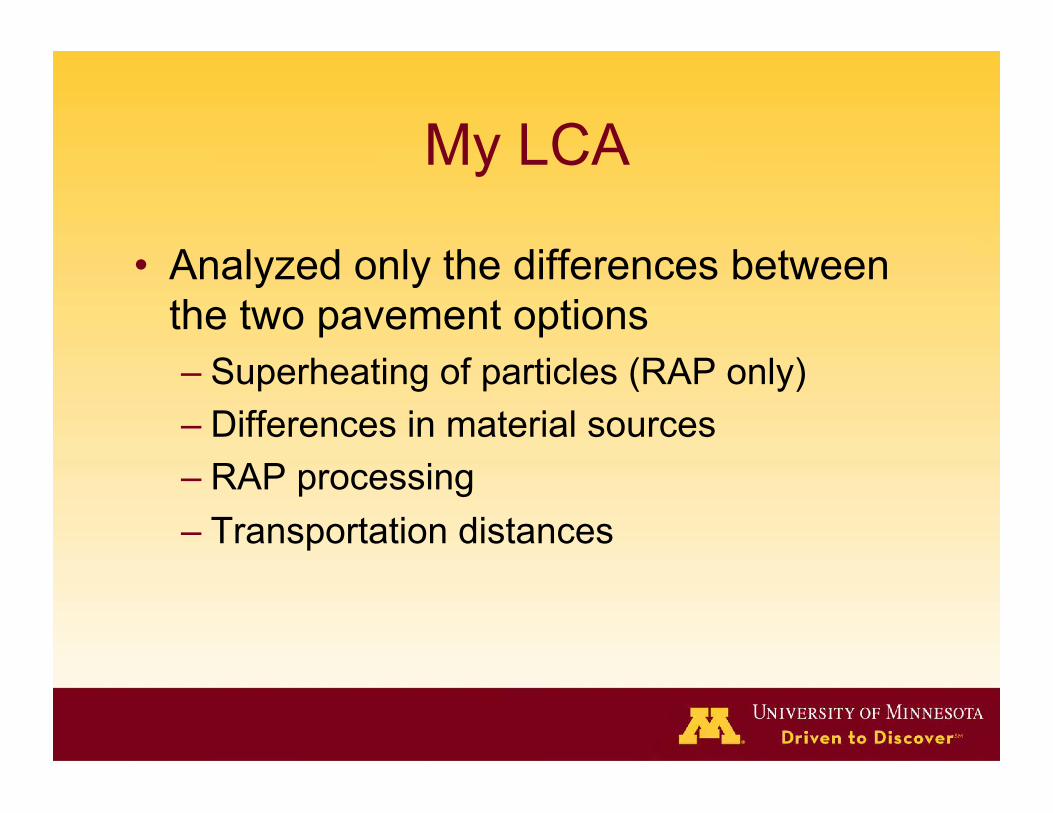
My LCA
• Analyzed only the differences between the two pavement options – Superheating of particles (RAP only) – Differences in material sources – RAP processing – Transportation distances

97%
3%
Traffic Infrastructure
Total Road Emissions

Emissions from Infrastructure 7%
18%
31%
44%
Maintenance
Paving and Compaction
HMA Production
Raw Materials (production and transport)

Model Assumptions
• Similar performance of both roads – Neglect maintenance/rehab
• For simplicity, only the differences were calculated – Omit use phase – Ignore construction – No additives considered
• Pavement is land-filled after use
Asphalt Pavement Life Cycle
Road Construction
Aggregates
Additives
Bitumen
Down-Cycled
Asphalt Plant Use
Disposal
Rehabilitation
Recycling

Asphalt Pavement Life Cycle Aggregates
Bitumen
Landfill
Asphalt Plant Disposal
15 % Recycled
Arrive at site

My LCA Parameters Functional Unit: One Lane-Mile
Virgin Material 15% RAP
Functional Unit 1 Lane-Mile 1 Lane-Mile Subbase 10 inches 10 inches Base 8 inches 8 inches HMA 6 inches 6 inches % RAP in HMA 0% 15% % Binder 5% 5% RAP % Binder N/A 4.5% % Air Voids 4% 4% Mixing Temp 260 °F 370 °F RAP Processing N/A YES
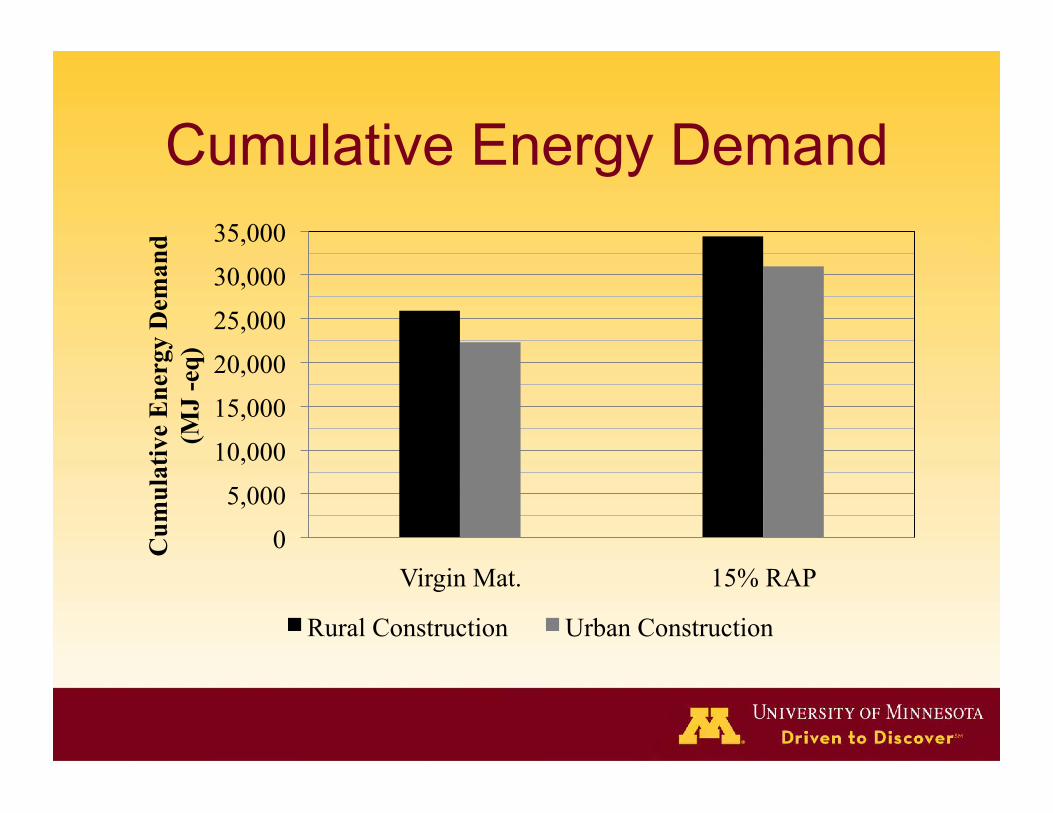
Cumulative Energy Demand
0
5,000
10,000
15,000
20,000
25,000
30,000
35,000
Virgin Mat. 15% RAP
Cum
ulat
ive
Ene
rgy
Dem
and
(M
J -e
q)
Rural Construction Urban Construction

Global Warming Potential
0 200 400 600 800
1,000 1,200 1,400 1,600
Virgin Mat. 15% RAP
Glo
bal W
arm
ing
Pote
ntia
l (k
g C
O2
- eq)
Rural Construction Urban Construction

Emissions Breakdown
41%
10%
6% 0% 0%
42%
1% Virgin Materials
Bitumen Aggregates Transportation Superheating RAP Processing Disposal Other
34%
4% 5%
15% 5%
36%
1% 15 % RAP
Bitumen Aggregates Transportation Superheating RAP Processing Disposal Other

Conclusions
• The inclusion of 15% RAP in an asphalt pavement led to a less environmentally sustainable pavement – 28% more energy – 39% more CO2e emissions

Conclusions
• The inclusion of 15% RAP in an asphalt pavement led to a less environmentally sustainable pavement – 28% more energy – 39% more CO2e emissions
• 85 more cheeseburgers worth of CO2 per lane mile!
Future Work
• Look at the effect of each component – Increase RAP percentages – More accurate superheating values
• SimaPro is licensed software

Questions?
• This material is based upon work supported by the National Science Foundation Graduate Research Fellowship under Grant No. DGE-105103
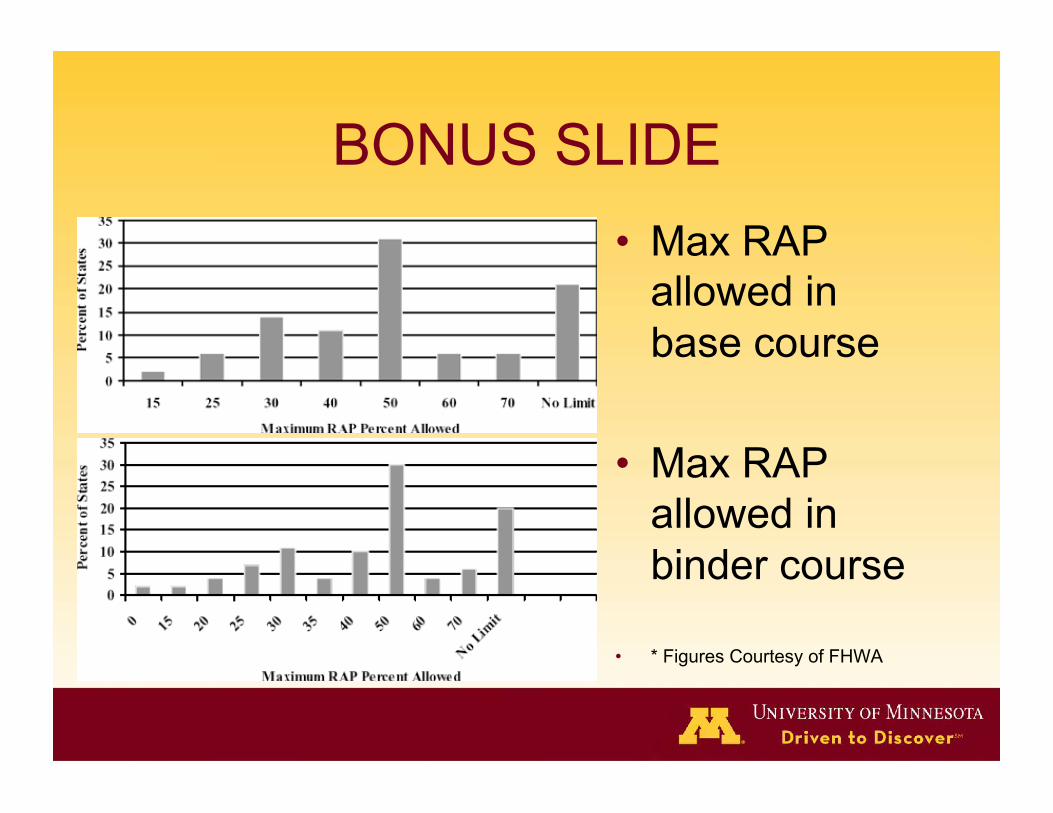
BONUS SLIDE • Max RAP
allowed in base course
• Max RAP allowed in binder course
• * Figures Courtesy of FHWA

References
• Jan Th. van der Zwan – AAPT Presentation. 2013

Material Amounts
SimaPro Input Purpose Virgin Material
Amount 15% RAP Amount Bitumen HMA 172.04 kg 54.84 kg
Coarse Agg. HMA 2,138.00 kg 1,817.30 kg Fine Agg. HMA 5,644.32 kg 4,797.67 kg
Gravel Base 6,770.33 kg 6,770.33 kg Sand Subbase 14,253.33 kg 14,253.33 kg
Heat, nat. gas Superheating N/A 2,886,615.60 KJ 200 KW diesel RAP Processing N/A 200.00 KWh

Transportation Distances
Material to Destination
Rural Transportation Distances (Km)
Urban Transportation Distances (Km)
Virgin Material 15% RAP
Virgin Material
15% RAP
Refinery to HMA Plant 96.56 96.56 1.61 1.61
Aggregate to HMA Plant 197.95 197.95 8.05 8.05 HMA Plant to Road Location 197.95 197.95 8.05 8.05
Base Aggregate to Road Location 16.09 16.09 16.09 16.09
RAP to HMA Plant N/A 197.95 N/A 8.05

SimaPRO Inputs (Urban) Virgin Mat Amount 15% RAP Amount
Bitumen 172.00 kg 155.00 kg
Gravel, crushed 8,910.00 kg 8,590.00 kg
Sand 19,900.00 kg 19,100.00 kg
Transport 3,470.00 tkm 3,470.00 tkm Disposal, pvmt 29,000.00 kg 27,800.00 kg
Superheating (Nat. Gas) N/A 2,890.00 MJ RAP Processing N/A 720.00 MJ

Virgin Pavement

15% RAP Pavement