Embed Size (px)
Citation preview
Life Cycle Assessment of California Tomato Production and Processing
1
November 26, 2018
Sonja Brodt (presenter and project PI)
UC Sustainable Agriculture Research and Education Program
Kiara Winans (lead author) and Alissa Kendall
Dept. of Civil and Environmental Engineering

Research Objective
• Comprehensive quantification of a range of environmental impacts from producing California tomato paste and diced tomato products
• Two time points: 2005 & 2015 to examine trends over time
Funded by:

Processing phase:
Bulk tomato paste
Cultivation phase
Processing phase:
Bulk diced tomato
Greenhouse phase:
Transplant production
What did we include?
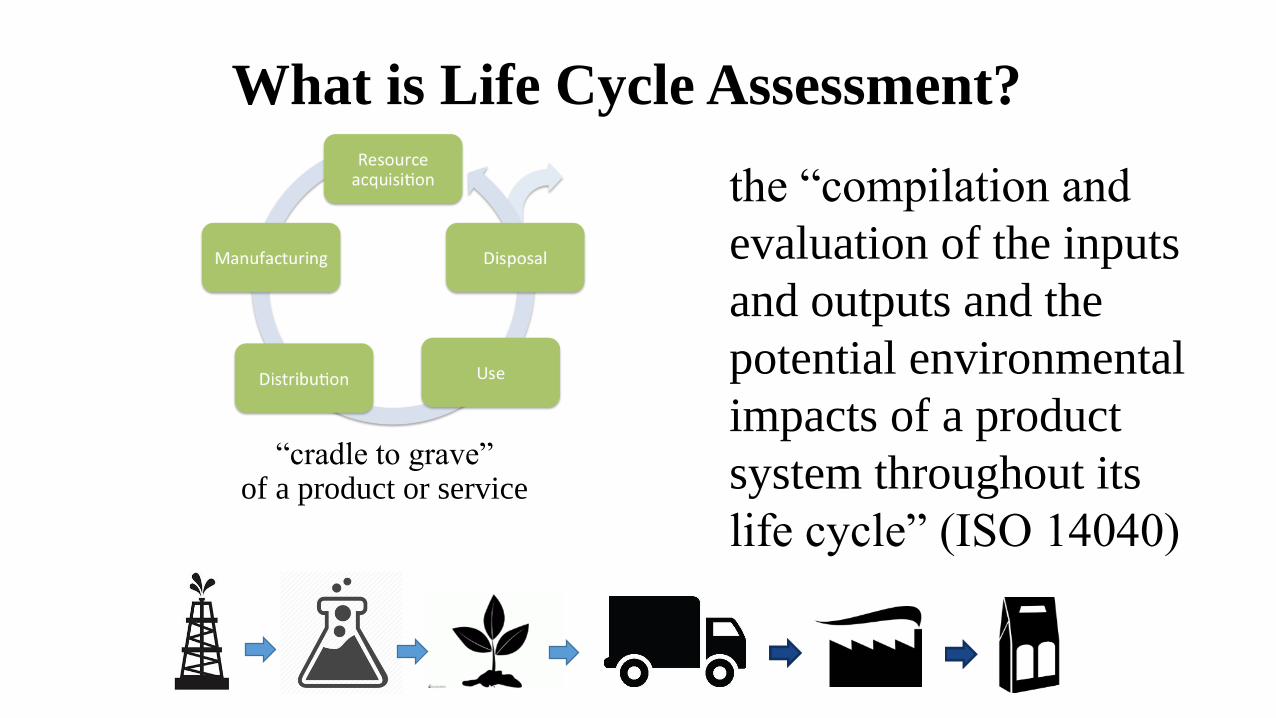
What is Life Cycle Assessment?
the “compilation and
evaluation of the inputs
and outputs and the
potential environmental
impacts of a product
system throughout its
life cycle” (ISO 14040)
“cradle to grave”of a product or service

Environmental Impact Categories
Natural Resource Use
• Primary Energy Use
• Fresh Water Use
Emissions-Related Impacts
• Global Warming Potential (kg CO2
equivalents)
• Acidification Potential (g SO2 equiv)
• Eutrophication Potential (g PO4 equiv)
• Ozone Depletion Potential (kg CFC-11 eq.)
• Photochemical Ozone Creation Potential
(kg C2H4 eq.)
• Ecotoxicity Indicators: air, land, water
(kg DCB eq.)

2005 grower response 2015 grower response
• 46 completed surveys total (only 16 could provide 2005 data)

Key On-Farm Improvements: 2005-2015
Irrigation systemsAccording to our grower survey, 50% of the growers shifted to
drip irrigation, 13% continued to use furrow irrigation, and 13%
used drip irrigation in both 2005 and 2015.
Tomato yields
Increased from 41 to 55 tons/acre
In-field diesel useOn a per acre basis, diesel use increased by 4%
Per U.S. ton of product, diesel use decreased by 23%

Overall Supply Chain Wide Impacts, per Kg Bulk Paste: 2005-2015

Which phases of the supply chain contribute the most to which impacts (on a life cycle basis)?
Impact category Main contributors
across the supply
chain
Percent
contribution -
2005
Percent
contribution -
2015
Phase with the
highest total
contributions
Global warming
potential
Natural gas production &
consumption
69% 64% Processing facility
Total primary energy Natural gas production &
combustion
68% 62% Processing facility
Freshwater use Direct water use 75% 69% Cultivation
Acidification
potential
Diesel production
& combustion
39% 30% Cultivation
Eutrophication
potential
Diesel production
& combustion
30% 23% Cultivation
Photochemical ozone
creation potential
Natural gas production &
combustion
47% 38% Processing facility
-6%
-9%
-7%

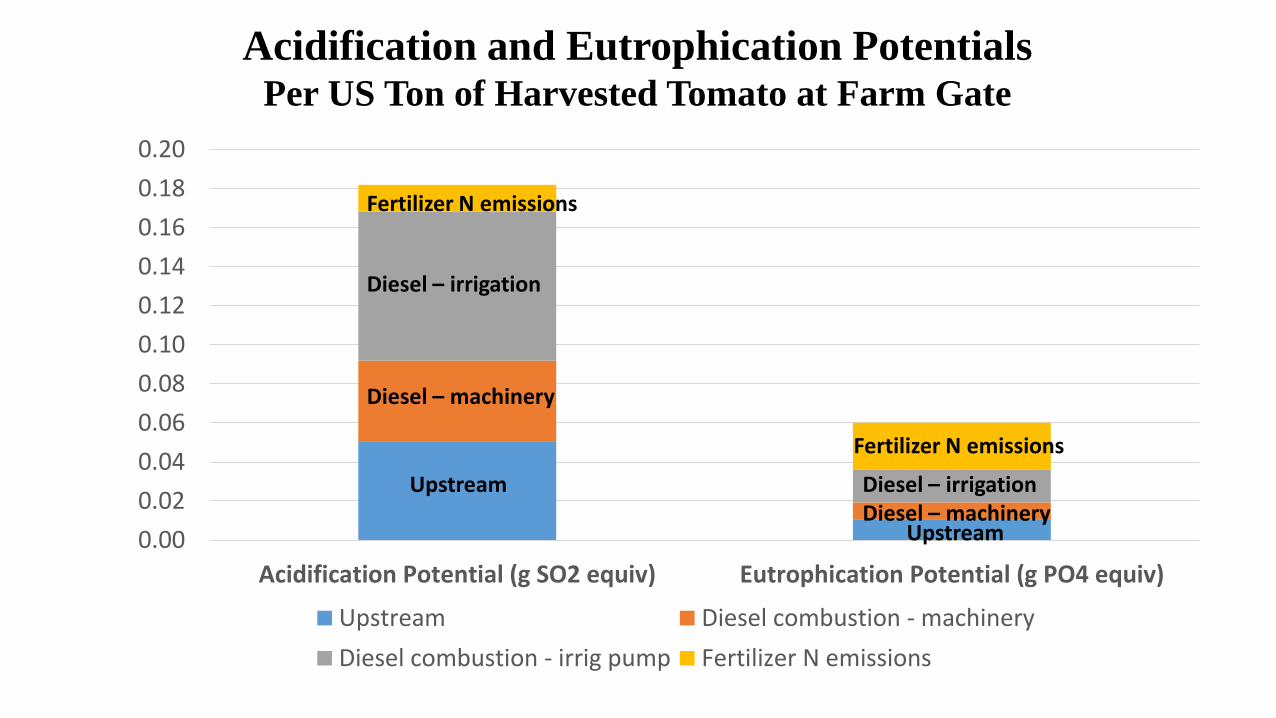
Upstream Vs Onsite Sources of Impacts per US Ton of Harvested Tomato at Farm Gate
0%10%20%30%40%50%60%70%80%90%
100%
100-yr Global WarmingPotential
Total Primary Energy Freshwater Use
Upstream Diesel combustion - machinery
Diesel combustion - irrig pump Water use
Fertilizer N emissions
Upstream
Upstream
Diesel - irrig
Diesel - irrig
Diesel – machineryFertilizer – N emissions
Upstream
Diesel – machinery
Irrigation
0.00
0.02
0.04
0.06
0.08
0.10
0.12
0.14
0.16
0.18
0.20
Acidification Potential (g SO2 equiv) Eutrophication Potential (g PO4 equiv)
Upstream Diesel combustion - machinery
Diesel combustion - irrig pump Fertilizer N emissions
Upstream
Acidification and Eutrophication Potentials Per US Ton of Harvested Tomato at Farm Gate
Upstream
Diesel – machinery
Diesel – machinery
Diesel – irrigation
Diesel – irrigation
Fertilizer N emissions
Fertilizer N emissions

Fertilizer production comparison – GWP100 impacts
0
10
20
30
40
50
60
GWP 100-year with cc fb GWP100 no cc fb
kg C
O2eq
. per
kg N
CAN17 4-10-10 UN32
8-24-6 10-34-0 Aqua ammonia

0
10
20
30
40
50
60
70
80
0 100 200 300 400 500 600
Yie
ld (
tons/
acre
)
N (lbs/acre)
Tomato Yield by Applied N
2015 Yield (tons/acre) 2005 Yield (tons/acre)
Cultivation: Large variability in nitrogen applications

Pesticides: upstream impacts vs post-application impacts
• Pesticide manufacture does not figure prominently in any of the
environmental impact categories studied
• But what about post-application impacts?

Herbicides: Top 5 Active
Ingredients
(from statewide data for
processing tomatoes)
• Trifluralin
• S-Metolachlor
• Glyphosate
• Rimsulfuron
• MetolachlorFigures are ordered by acreage treated
(largest amount in the top left). Rimsulfuron
and metalachlor start at <100K acres
Source: California Department of Pesticide Regulation

Active ingredient in descending order of terrestrial toxicity potential
EPA signal word CalEnviroscreen list of highly toxic and volatile
chemicals
Mancozeb (fungicide) Caution
Chlorothalonil (fungicide) Caution *
Fludioxonil (fungicide) Caution
Rimsulfuron (herbicide) Caution
Metolachlor (herbicide) Caution
Diazinon (insecticide) Caution/Restricted Use *
Glyphosate (herbicide) Caution
The characterization factor for freshwater toxicity of glyphosate can be 10 times larger
when including its transformation products in the environment (Van Zelm et al., 2010).
USES-LCA Results for Terrestrial Ecotoxicity Potential
a multi-compartment fate, exposure and effects model (Huijbregts et al., 2000).

Key Sources of Impacts Across the Supply Chain
Largest Sources of Environmental Impacts (across supply chain)
• Diesel
• Natural gas
• Irrigation water
Secondary Sources of Environmental Impacts
• Electricity use (irrigation and processing)
• Fertilizers (espec.N)
Opportunities for UC ANR? (and how can a company like Barilla help?)• On-farm renewable energy investments – alternative-energy tractors
• Energy efficient irrigation pumping (SWEEP)
• Choose lower-GWP nitrogen fertilizers (UN32 vs CAN17)
• Monitoring, decision tools, and precision application of fertilizers and pesticides

Contact information
Project PI: Dr. Sonja Brodt
UC Sustainable Agriculture Research and Education
Program
Agricultural Sustainability Institute at UC Davis
(530) 754-8547
Project Co-PI: Dr. Alissa Kendall
Department of Civil and Environmental Engineering
Project staff: Dr. Kiara Winans
Department of Civil and Environmental Engineering