Embed Size (px)
Citation preview

Life Cycle Assessment of a Norwegian Bridge
Thomas Charles Edouard Dequidt
Civil and Environmental Engineering
Supervisor: Amund Bruland, BAT
Department of Civil and Transport Engineering
Submission date: June 2012
Norwegian University of Science and Technology


NORWEGIAN UNIVERSITY OF SCIENCE AND TECHNOLOGY
DEPARTMENT OF CIVIL AND TRANSPORT ENGINEERING
Report Title:
Life Cycle Assessment of a Norwegian Bridge
Date: 09/06/2012
Number of pages (incl. appendices): 157
Master Thesis x Project Work
Name: Thomas Dequidt
Professor in charge/supervisor: Amund Bruland
Other external professional contacts/supervisors:
Abstract:
Life cycle assessment (LCA) methodology aims at evaluating the environmental impacts of a product or
system from a holistic approach. In this methodology, all life cycle phases of the product are identified and assessed,
from the raw material acquisition to the end-of-life phase.
This master thesis is dealing with the LCA of a Norwegian bridge. First, a literature review is realized by
going through 14 bridge LCA references. Then, a detailed description of bridge LCA methodology is performed.
Finally, an LCA study is applied on Tverlandsbrua, a Norwegian bridge project, in order to assess the overall global
warming impact of the bridge life cycle.
The conclusions of the literature review are very different according to the goals and scopes of the studies.
Concrete and timber bridges are often more environmentally performing than steel or composite concrete-steel
bridges. Material production is generally the life cycle phase leading to most impacts, followed by the maintenance
& repair phase. Improvements in material design and use of recycled materials are important to bring down the
overall emissions.
The LCA methodology description has been through all elements specified in the ISO standards. The
methodology has been adapted to the needs of the case study but the goal and scope definition has been kept wide
enough to allow comparisons with future bridge assessments. Input data (energy, material flows, etc.) are as much as
possible gathered from the client and subcontractors of the project, but sometimes assumed. Output data
(greenhouse gases emissions) are either directly collected from environmental reports or calculated by an LCA
software.
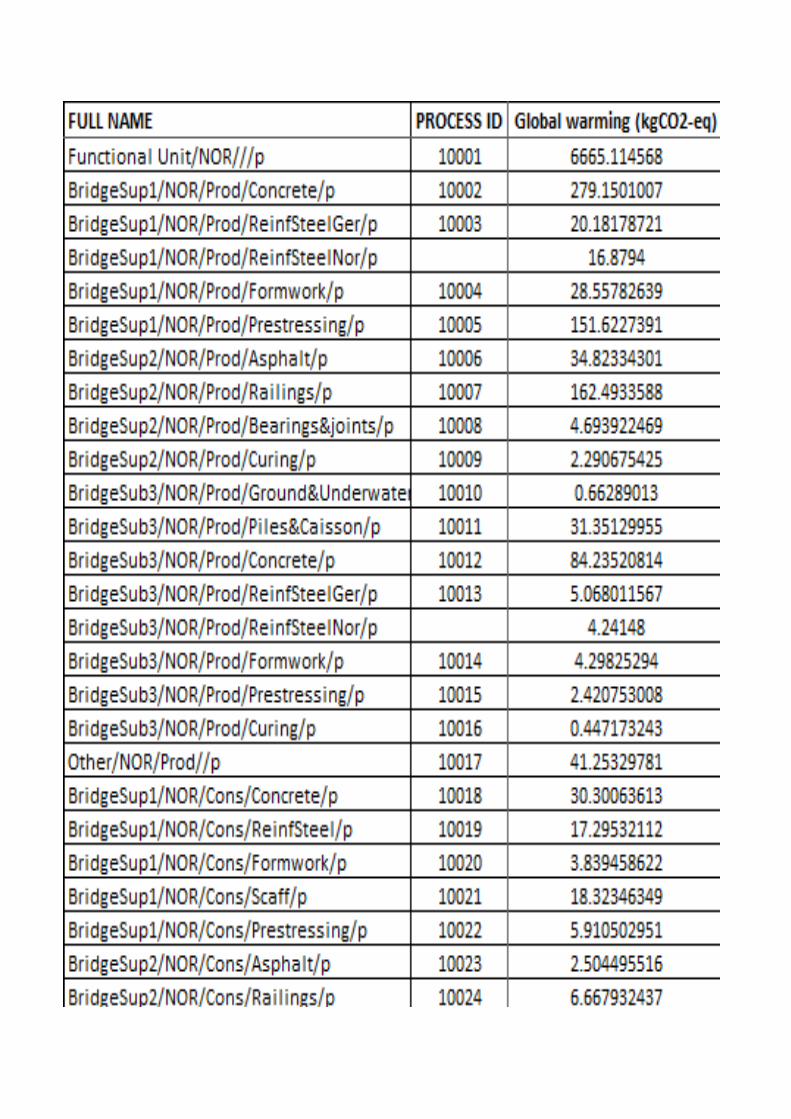
The overall global warming impact of Tverlandsbrua is 6665 kgCO2-eq per functional unit (FU), all life
cycle phases considered. The FU, i.e. the unit to which the emissions are referred, is defined as 1 square meter
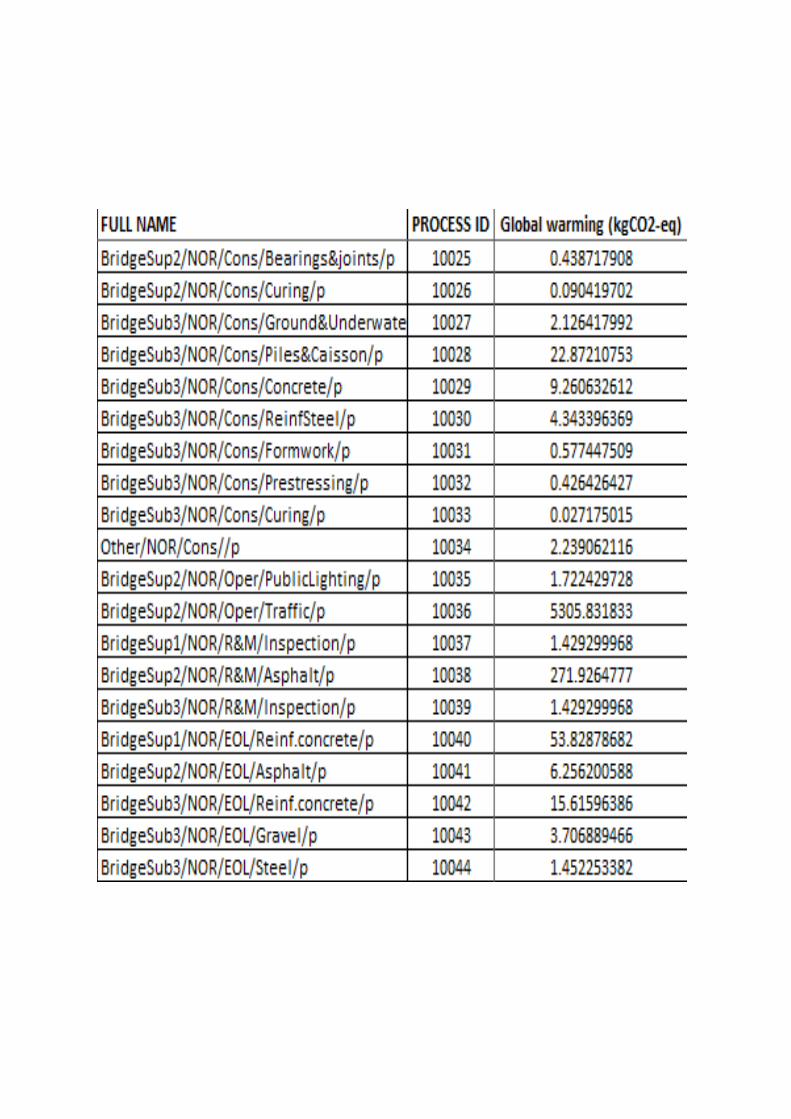
effective bridge deck area through a lifetime of 100 years. When the operation phase (mainly consisting of traffic-
related emissions) is not considered, the emissions are brought down to 1358 kgCO2-eq per FU. Concrete, steel and
asphalt life cycles are identified as the main component contributors. Uncertainty and sensitivity analyses,
discussions and recommendations for further studies are performed in order to give clues for more environmentally
performing solutions.
Keywords:
1. Life cycle assessment
2. Bridge
3. Carbon footprint
4. Norwegian
_________________________________________

Preface
At a time when our civilization is at a level of technology and knowledge that has neverbeen reached before, tremendous issues are threatening the human being. According to theIntergovernmental Panel of Climate Change, global greenhouse gases (GHG) emissions dueto human activities have grown since pre-industrial times, with an increase of 70% between1970 and 2004. The atmospheric concentrations of CO2 and CH4 in 2005 exceeded by far thenatural range over the last 650,000 years. [1] This clearly shows that we contribute somehow toenvironmental changes. Hence, it is our duty to change our behaviour before it is too late.
In such a context, the Norwegian Ministry of Transport and Communications realizes every 4years a National Transport Plan considering measures to reduce climate change. In its latestreport, the Ministry states that new measures in the transport sector will result in a reductionin emissions between 2.5 and 4.0 million tons CO2 equivalents in relation to expected emissionsin 2020. [2] This task is partly entrusted to the Norwegian Public Roads Administration, Statensvegvesen, in order to reduce emissions from road transportation and infrastructures.
As a master exchange student in relation with the department of Civil and Transport Engineer-ing of the Norwegian University of Science and Technology of Trondheim (NTNU), the purposeof my Master Thesis is to assess the climate change (or global warming) impact of the life cycleof a Norwegian road bridge, applying a robust methodology: life cycle assesment (LCA). Thiswork is realized in cooperation with Statens vegvesen and the contractors and subcontractorsof a Norwegian road bridge project. A comprehensive description of this methodology as wellas a large literature review of previous bridge life cycle assessment studies help me ensure thereliability and accuracy of my results.
I would like to thank my NTNU supervisor Amund Bruland, the Norwegian Public Roads Ad-ministration, Reinertsen AS and all the subcontractors related to this bridge project for theirprecious help in this thesis. From Reinertsen AS, I especially thank Nina Oxas, Tom Kvalø,Ole Grindhagen and Øystein Wiggen for their patience and investment in my work.
Norwegian University of Science and Technology.
Trondheim, June 2012.
Thomas Dequidt.
Thomas Dequidt III Masther Thesis NTNU 2012

Abbreviations
AADT : Annual average daily traffic.
ADP : Abiotic depletion potential.
AoP : Area of protection.
AP : Acidification potential.
ASCE : American Society of Civil Engineers.
AUV : Underwater concrete.
BOF : Basic oxygen furnace.
CH4 : Methane.
CO : Carbon monoxide.
CO2 : Carbon dioxide.
CO2-eq : Carbon dioxide equivalent.
EAF : Electric arc furnace.
ECC : Engineered cementitious composites.
EOL : End-of-life.
EPD : Environmental performance declaration.
EVA : Ethylvinylacetate.
FRP : Fiber-reinforced polymer.
FU : Functional unit.
GHG : Greenhouse gas.
GJ : Gigajoules
GWP : Global warming potential.
GWP100 : Global warming potential, 100-year baseline.
HPC : High performance concrete.
Thomas Dequidt V Masther Thesis NTNU 2012

ICE : Institution of Civil Engineers.
IndEcol : Industrial Ecology.
IOA : Input-output analysis.
IPCC : Intergovernmental Panel on Climate Change.
ISO : International Organization for Standardization.
LCA : Life cycle assessment.
LCCA : Life cycle cost analysis.
LCI : Life cycle inventory.
LCIA : Life cycle impact assessment.
MEEDDM : Ministère de l’Ecologie, de l’Energie, du Developpement Durable et de la Mer.
NOx : Nitrogen oxides.
NPC : Normal performance concrete.
N2O : Dinitrogen monoxide or Nitrous oxide.
PC : Prestressed concrete.
PVC : Polyvinyl chloride.
SCM : Supplementary cementitious materials.
SLCA : Social life cycle assessment.
SO2 : Sulfur dioxide.
TFS : Transoceanic freight ship.
tkm : Tonne-kilometre.
TNT : Trinitrotoluene.
TRI : Toxics release inventory.
UHPC : Ultra high performance concrete.
vkm : Vehicle-kilometre.
VOC : Volatile organic compounds.
Thomas Dequidt VI Master Thesis NTNU 2012

Contents
Preface III
Abbreviations V
List of Figures XI
List of Tables XIII
1 Introduction 11.1 Definition and background . . . . . . . . . . . . . . . . . . . . . . . . . . . . . . 11.2 Goal and scope of the study . . . . . . . . . . . . . . . . . . . . . . . . . . . . . 31.3 Life Cycle Inventory (LCI) . . . . . . . . . . . . . . . . . . . . . . . . . . . . . . 41.4 Life Cycle Impact Assessment (LCIA) . . . . . . . . . . . . . . . . . . . . . . . . 51.5 Interpretation phase . . . . . . . . . . . . . . . . . . . . . . . . . . . . . . . . . 5
2 Previous researches 72.1 Literature review . . . . . . . . . . . . . . . . . . . . . . . . . . . . . . . . . . . 72.2 Main findings . . . . . . . . . . . . . . . . . . . . . . . . . . . . . . . . . . . . . 14
2.2.1 Preliminary results . . . . . . . . . . . . . . . . . . . . . . . . . . . . . . 142.2.2 Carbon emissions and energy consumption . . . . . . . . . . . . . . . . . 17
2.3 Conclusions . . . . . . . . . . . . . . . . . . . . . . . . . . . . . . . . . . . . . . 24
3 Bridge Life Cycle Assessment 253.1 Goal and scope definition . . . . . . . . . . . . . . . . . . . . . . . . . . . . . . . 25
3.1.1 Goal of the study . . . . . . . . . . . . . . . . . . . . . . . . . . . . . . . 263.1.2 Scope of the study . . . . . . . . . . . . . . . . . . . . . . . . . . . . . . 27
3.2 Life cycle inventory (LCI) . . . . . . . . . . . . . . . . . . . . . . . . . . . . . . 343.2.1 General requirements . . . . . . . . . . . . . . . . . . . . . . . . . . . . . 343.2.2 Collection and calculation of data . . . . . . . . . . . . . . . . . . . . . . 37
3.3 Life cycle impact assessment (LCIA) . . . . . . . . . . . . . . . . . . . . . . . . 383.3.1 Selection of impact categories, category indicators and characterization
models . . . . . . . . . . . . . . . . . . . . . . . . . . . . . . . . . . . . . 393.3.2 Classification (assignment) of LCI results . . . . . . . . . . . . . . . . . . 413.3.3 Characterization (calculation) of LCI results . . . . . . . . . . . . . . . . 42
Thomas Dequidt VII Masther Thesis NTNU 2012
CONTENTS
3.3.4 ReCiPe life cycle impact assessment methodology . . . . . . . . . . . . . 423.3.5 Optional elements: normalization, grouping, weighting and data quality
analysis . . . . . . . . . . . . . . . . . . . . . . . . . . . . . . . . . . . . 423.4 Interpretation phase . . . . . . . . . . . . . . . . . . . . . . . . . . . . . . . . . 43
3.4.1 Identification of significant issues . . . . . . . . . . . . . . . . . . . . . . 443.4.2 Conclusions, limitations and recommendations . . . . . . . . . . . . . . . 44
4 Case study: Tverlandsbrua 474.1 Bridge description . . . . . . . . . . . . . . . . . . . . . . . . . . . . . . . . . . . 48
4.1.1 Bridge superstructure . . . . . . . . . . . . . . . . . . . . . . . . . . . . . 484.1.2 Bridge substructure . . . . . . . . . . . . . . . . . . . . . . . . . . . . . . 51
4.2 Tverlandsbrua life cycle inventory . . . . . . . . . . . . . . . . . . . . . . . . . . 554.2.1 Material production phase . . . . . . . . . . . . . . . . . . . . . . . . . . 554.2.2 Construction phase . . . . . . . . . . . . . . . . . . . . . . . . . . . . . . 684.2.3 Operation phase . . . . . . . . . . . . . . . . . . . . . . . . . . . . . . . 794.2.4 Maintenance & repair phase . . . . . . . . . . . . . . . . . . . . . . . . . 804.2.5 End-of-Life phase . . . . . . . . . . . . . . . . . . . . . . . . . . . . . . . 83
4.3 Results, interpretation and further analysis . . . . . . . . . . . . . . . . . . . . . 854.3.1 Overall results . . . . . . . . . . . . . . . . . . . . . . . . . . . . . . . . . 854.3.2 Results per function category . . . . . . . . . . . . . . . . . . . . . . . . 864.3.3 Results per life-cycle phase . . . . . . . . . . . . . . . . . . . . . . . . . . 884.3.4 Results per component category and identification of hot spots . . . . . . 934.3.5 Uncertainty analysis . . . . . . . . . . . . . . . . . . . . . . . . . . . . . 964.3.6 Sensitivity analysis . . . . . . . . . . . . . . . . . . . . . . . . . . . . . . 97
5 Discussion 1015.1 Literature review . . . . . . . . . . . . . . . . . . . . . . . . . . . . . . . . . . . 1015.2 LCA methodology . . . . . . . . . . . . . . . . . . . . . . . . . . . . . . . . . . 102
5.2.1 Goal and scope definition . . . . . . . . . . . . . . . . . . . . . . . . . . 1025.2.2 Life cycle inventory . . . . . . . . . . . . . . . . . . . . . . . . . . . . . . 1035.2.3 Life cycle impact assessment . . . . . . . . . . . . . . . . . . . . . . . . . 1035.2.4 Interpretation phase . . . . . . . . . . . . . . . . . . . . . . . . . . . . . 104
5.3 Material production phase . . . . . . . . . . . . . . . . . . . . . . . . . . . . . . 1045.3.1 Concrete production . . . . . . . . . . . . . . . . . . . . . . . . . . . . . 1045.3.2 Reinforcing steel . . . . . . . . . . . . . . . . . . . . . . . . . . . . . . . 1045.3.3 Prestressing elements & railings . . . . . . . . . . . . . . . . . . . . . . . 105
5.4 Construction phase . . . . . . . . . . . . . . . . . . . . . . . . . . . . . . . . . . 1055.4.1 Transportation . . . . . . . . . . . . . . . . . . . . . . . . . . . . . . . . 1055.4.2 Energy consumption on the site . . . . . . . . . . . . . . . . . . . . . . . 106
5.5 Operation phase . . . . . . . . . . . . . . . . . . . . . . . . . . . . . . . . . . . . 1065.6 Maintenance & repair phase . . . . . . . . . . . . . . . . . . . . . . . . . . . . . 1075.7 End-of-life phase . . . . . . . . . . . . . . . . . . . . . . . . . . . . . . . . . . . 107
Thomas Dequidt VIII Master Thesis NTNU 2012
CONTENTS
5.7.1 Recycling . . . . . . . . . . . . . . . . . . . . . . . . . . . . . . . . . . . 1075.7.2 Dismantling and sorting of reinforced concrete . . . . . . . . . . . . . . . 1075.7.3 Transportation . . . . . . . . . . . . . . . . . . . . . . . . . . . . . . . . 108
6 Conclusions 1096.1 General conclusions . . . . . . . . . . . . . . . . . . . . . . . . . . . . . . . . . . 1096.2 Recommendations for future projects . . . . . . . . . . . . . . . . . . . . . . . . 111
References 113
Appendix A Master Thesis contract 117
Appendix B GWP100 values 121
Appendix C Contractors list 125
Appendix D Foreground processes 127
Appendix E Input data inventory 129
Appendix F Output data inventory 139
Appendix G Global warming impacts per foreground process 141
Thomas Dequidt IX Master Thesis NTNU 2012

List of Figures
1.1 Life cycle assessment : "From cradle to grave". [3] . . . . . . . . . . . . . . . . . 21.2 The four parts of Life Cycle Assessment methodology. [4] . . . . . . . . . . . . . 3
3.1 System boundary of Tverlandsbrua (only foreground processes). . . . . . . . . . 293.2 Simplified procedures for inventory analysis. [5] . . . . . . . . . . . . . . . . . . 353.3 Decision-making process for input data source selection for the production and
construction phases. . . . . . . . . . . . . . . . . . . . . . . . . . . . . . . . . . 363.4 Elements of the LCIA phase. [4] . . . . . . . . . . . . . . . . . . . . . . . . . . . 393.5 Climate change impact category. [5] . . . . . . . . . . . . . . . . . . . . . . . . . 413.6 Relationships between elements within the interpretation phase with the other
phases of LCA. [5] . . . . . . . . . . . . . . . . . . . . . . . . . . . . . . . . . . 44
4.1 Localization of Tverlandsbrua project. [6] . . . . . . . . . . . . . . . . . . . . . . 474.2 Tverlandsbrua: construction methods. [7] . . . . . . . . . . . . . . . . . . . . . . 484.3 Tverlandsbrua: cantilevered construction of span 1 (starting from part 1). [7] . . 494.4 Tverlandsbrua: viaduct part. . . . . . . . . . . . . . . . . . . . . . . . . . . . . . 494.5 Tverlandsbrua: overall construction methodology. [7] . . . . . . . . . . . . . . . 504.6 Tverlandsbrua: box-girder varying (upper drawing) and constant (lower drawing)
heights. [7] . . . . . . . . . . . . . . . . . . . . . . . . . . . . . . . . . . . . . . . 504.7 Tverlandsbrua: abutments, axis 1 (left) and axis 8 (right). [7] . . . . . . . . . . . 514.8 Tverlandsbrua: twin solid walls for the cantilevered part (left) and twin simple
columns for the viaduct part (right). [7] . . . . . . . . . . . . . . . . . . . . . . . 524.9 Tverlandsbrua: axis 2: foundation cross-section (left), foundation plan view
(middle) and bored piles (right). [7] . . . . . . . . . . . . . . . . . . . . . . . . . 524.10 Tverlandsbrua: sinked caisson. [7] . . . . . . . . . . . . . . . . . . . . . . . . . . 534.11 Tverlandsbrua: foundation axis 4. [7] . . . . . . . . . . . . . . . . . . . . . . . . 544.12 Tverlandsbrua: axis 5: foundation cross-section (left) and foundation plan view
(right). [7] . . . . . . . . . . . . . . . . . . . . . . . . . . . . . . . . . . . . . . . 544.13 System boundary of the superstructure production phase. . . . . . . . . . . . . . 554.14 System boundary of the substructure production phase. . . . . . . . . . . . . . . 564.15 System boundary of the construction phase. . . . . . . . . . . . . . . . . . . . . 694.16 System boundary of the end-of-life phase. . . . . . . . . . . . . . . . . . . . . . . 834.17 Presentation of the four result categories. . . . . . . . . . . . . . . . . . . . . . . 85
Thomas Dequidt XI Masther Thesis NTNU 2012

LIST OF FIGURES
4.18 Global warming impact per function category. . . . . . . . . . . . . . . . . . . . 864.19 Global warming impact shares within BridgeSup1 and BridgeSup2 categories. . . 874.20 Global warming impact per life cycle phase. . . . . . . . . . . . . . . . . . . . . 884.21 Global warming impacts from the production phase. . . . . . . . . . . . . . . . . 894.22 Global warming impacts from the construction phase. . . . . . . . . . . . . . . . 904.23 Global warming impact shares within the construction phase, means of trans-
portation and elements transported by truck, >16t. . . . . . . . . . . . . . . . . 914.24 Global warming impacts from the operation phase. . . . . . . . . . . . . . . . . 924.25 Global warming impacts from the maintenance phase. . . . . . . . . . . . . . . . 924.26 Global warming impacts from the end-of-life phase. . . . . . . . . . . . . . . . . 934.27 Global warming impact shares between the components life cycle phases. . . . . 944.28 Global warming values per component category. . . . . . . . . . . . . . . . . . . 954.29 Uncertainty analysis on the impact shares of reinforcing steel supply. . . . . . . 964.30 Uncertainty analysis on railings & parapets. . . . . . . . . . . . . . . . . . . . . 974.31 Sensitivity analysis on the production of 1 m3 concrete. . . . . . . . . . . . . . . 984.32 Sensitivity analysis on asphalt course renewal. . . . . . . . . . . . . . . . . . . . 99
Thomas Dequidt XII Master Thesis NTNU 2012
List of Tables
2.1 Concrete bridges . . . . . . . . . . . . . . . . . . . . . . . . . . . . . . . . . . . 202.2 Steel bridges . . . . . . . . . . . . . . . . . . . . . . . . . . . . . . . . . . . . . . 212.3 Steel-concrete composite bridges . . . . . . . . . . . . . . . . . . . . . . . . . . . 222.4 Timber bridges . . . . . . . . . . . . . . . . . . . . . . . . . . . . . . . . . . . . 23
4.1 Total amount, energy consumption and composition of each type of concrete. . . 594.2 Amount of concrete per element category . . . . . . . . . . . . . . . . . . . . . . 614.3 Transportation of meterials . . . . . . . . . . . . . . . . . . . . . . . . . . . . . 724.4 Transportation of equipment . . . . . . . . . . . . . . . . . . . . . . . . . . . . . 734.5 Weight analysis for electricity supply allocation . . . . . . . . . . . . . . . . . . 744.6 Transportation of personnel . . . . . . . . . . . . . . . . . . . . . . . . . . . . . 744.7 Average energy consumption on the site per month . . . . . . . . . . . . . . . . 754.8 Secondary sources of energy consumption during the construction phase . . . . . 764.9 Average amount of sorted material on the site per month. . . . . . . . . . . . . . 784.10 Calculation of the total number of vehicles for the 100-year expected life cycle. . 794.11 Total electricity consumption for public lighting. . . . . . . . . . . . . . . . . . . 804.12 Data for main inspection assessment. . . . . . . . . . . . . . . . . . . . . . . . . 814.13 Data for asphalt course renewal. . . . . . . . . . . . . . . . . . . . . . . . . . . . 82
C.1 List of the bridge contractors and subcontractors. . . . . . . . . . . . . . . . . . 125
Thomas Dequidt XIII Masther Thesis NTNU 2012


Chapter 1
Introduction
1.1 Definition and background
Life cycle assessment (LCA) is a methodology which aims at evaluating the environmental im-pacts of a product or a system during its whole life. In order to do this, each phase of theproduct life must be taken into consideration. For an industrial common product, these phasesare raw material acquisition, transportation, production, use, maintenance & repair and end-of-life treatment (such as reuse, recycling, burning, landfilling, etc.). In a life cycle assessmentanalysis, a product or system is evaluated throughout the identification of all input and outputflows that are responsible for the overall impact. Input flows can be material, water and energyconsumptions for example, and output flows can be identified as material waste, emissions intothe water and the air, etc. Once all those inventory flows have been identified and quantified,the results can be interpreted. Interpretation of results can be used to compare two differentsystems in order to choose the more environmentally performing, or to show which stage of aproduct life is the most polluting in order to improve its overall environmental performance.Figure 1.1 describes the global chart of life cycle assessment.
The LCA methodology has its origins in 1970’s. One of the earliest, if not the earliest, LCAstudy performed was made for a major US soft drink producer in 1969. They wanted tounderstand the environmental aspects of alternatives to the then prevailing glass bottle. Inthis study the importance of having a holistic approach was demonstrated. In was understoodthat it was not sufficient to only include production of glass and plastic. Other elementsin the life cycle were also needed to obtain a fair comparison of the two alternatives. Thisstudy provided motivation for the soft drink producer to further explore the utility of plasticbottles. [8]
Thomas Dequidt 1 Masther Thesis NTNU 2012

CHAPTER 1. INTRODUCTION
Figure 1.1: Life cycle assessment : "From cradle to grave". [3]
Today, LCA is used to assess all types of products and product systems. The importance ofincluding the various life-cycle phases varies. For example, an assessment of a coal fired powerplant will generally find that the majority of the environmental load is associated with the op-eration phase. The quite opposite will be the case for solar power. In that case, the productionphase will cause the majority of the impacts. [8]
The ISO 14040 standards are the first standards dealing with LCA methodology and wereintroduced in 1997. The ISO 14040 standards are included in the ISO 14000 family dealingwith environmental management. ISO 14000 standards provide environmental managementguidelines, tools and methodologies for organizations, such as environmental management sys-tems (ISO 14001 & 14004) or environmental performance evaluation (ISO 14031). ISO 14040provides the general methodology and describes the principles for a life cycle assessment studyand for life cycle inventory (LCI). However, it does not describe a particular technique for theindividual phases of the study.
In 1997, the International Organization for Standardization published the first edition of the ISO14040:1997. After that, the standards 14041:1998, 14042:2000 and 14043:2000 were published.ISO 14041 describes the inventory phase, ISO 14042 the impact assessment phase and finallythe ISO 14043 provides guidance to make the interpretation of the whole life cycle assessment.The subsequent second edition of the ISO 14040 (ISO 14040:2006, Life Cycle Assessment:Principle and Framework [4]) and the ISO 14044:2006 (Life Cycle Assessment: Requirementsand Guidelines [5]) replace all of them, and are currently used.
The standards ISO 14047, ISO 14048, ISO 14049 that will complement the ISO standardseries 14040 are currently in process to be published. The standard ISO 14047 will containillustrative examples of how to apply the ISO 14042 (LCIA); in the same way, ISO 14049 will
Thomas Dequidt 2 Master Thesis NTNU 2012

CHAPTER 1. INTRODUCTION
provide examples to apply the ISO 14041 (LCI); finally, the ISO 14048 will involve the datadocumentation format for developing an LCA.
The main important aspect of the ISO 14040 standards is that they divide LCA methodologyin four fundamental and complementary parts: goal and scope of the study, life cycle inventory(LCI), life cycle impact assessment (LCIA) and interpretation, as shown in figure 1.2. [4]
Figure 1.2: The four parts of Life Cycle Assessment methodology. [4]
1.2 Goal and scope of the study
The first stage of LCA is goal and scope definition. In this section shall be included the detailsof the goal of the study, its hypotheses and its boundaries. This part is fundamental becauseit drafts the global flowchart of the analysis and must hence be comprehensive and well-built.The most important factor in this stage is to know precisely what are the decision makersexpectations so that the LCA analysis can be as accurate as possible. For example, one goalof LCA may be to compare the environmental performances of two different products, servicesor processes. Other studies, however, may aim at determining the stages of the life cycle thatcontribute the most to certain impacts. Hence, different aims influence the way the analysisshould be performed. [5]
The goal and scope of an LCA analysis must provide the context in which the study is made,including the system boundaries and the approximations that need to be taken. The modeland process layout are defined here. It must also provide a detailed description of the studiedproduct including the processes, materials or products needed and the units considered in themodel. Time scale and functional units also have to be established during this stage. [4]
The functional unit is the unit to which the entire system data will be referred to, both forinput and output flows. The reference unit also allows to make comparisons between differentLCA analyses. This unit can provide physical or functional criteria. A physical type of unitmay be the characteristics of the product studied, for example resist a certain carrying load.
Thomas Dequidt 3 Master Thesis NTNU 2012

CHAPTER 1. INTRODUCTION
On the other hand, a functional type unit would provide information about the quantities ofmaterial required to fulfill an objective, for example 50 years of product full service. The level ofprecision of the functional unit depends on the aim of the study and its intended applications.If the analysis is very specific, the functional unit should be very precise. On the other hand,if the results are to be compared with other more general ones, the functional unit definitionshould be vague enough to ensure the comparisons, especially if these results constitute a basisfor further studies.
The scope definition must include the data requirements and the assumptions that are goingto be made, mentioning the limitations of the study. The boundaries chosen in the study aredefined by the processes that are going to be included. Normally the analysis excludes stages,processes or materials of product life that are not going to be significant or that cannot providesufficient accurate data. All these factors will condition the accuracy of the results and have tobe considered in the interpretation phase. [4]
1.3 Life Cycle Inventory (LCI)
The second stage of LCA is the life cycle inventory (LCI). In this stage, the life cycle inventoriesare made by quantifying the different material and energy flows included during the lifetime ofa product or system. This is the most complex and comprehensive phase of an LCA analysis.In order to identify and quantify these inventory flows, each main process of the product orsystem should be subdivided as much as possible in order to obtain unit processes, hencedefining unit inventory flows, considering the system boundaries established in the goal andscope definition stage. Once again, the importance of a clear and well-built goal and scopedefinition is crucial [4].
There are different approaches to calculate a life cycle inventory and to estimate the contributionof each material or process to the impacts on the environment. There are different theories, forinstance, in considering the contribution of recycled or reused materials as a negative factor, inorder to show that they are decreasing the environmental impacts of the product.
There are many databases where the data required to calculate the output flows can be found.These databases include data for specific processes, technologies and materials. It is importantto choose an accurate source of data to build the LCI, because it will influence the quality ofthe results. Some companies make their own inventory databases and have their own values orparameters. These values may change due to variations in measurements, types of materialsinvolved, etc.
Finally, it is also possible to gather data directly from site investigations, in factories or plantsfor example. This source of data can provide very precise and accurate information, but onemust bear in mind that it is often very difficult to obtain it, mainly because this type ofinformation is usually kept private.
Thomas Dequidt 4 Master Thesis NTNU 2012

CHAPTER 1. INTRODUCTION
1.4 Life Cycle Impact Assessment (LCIA)
The impact assessment is the third stage of LCA. During this phase, the potential environmentalimpacts are estimated and classified, characterized, normalized and weighted in order to beinterpreted for the next and final stage of the LCA analysis. [4]
The results obtained in the previous LCI phase are analyzed by calculating the contributions ofeach sub-process to the impact categories stated in the goal and scope definition. The outputdata are first aggregated by impact category, and these impact categories can be aggregatedas well in order to obtain a single environmental value for the entire product analyzed. Themethodology used in the impact assessment phase of an LCA is not well defined yet in thestandards, and there are many different ways available to carry it out. To perform an LCIA,several impact categories exist and there are as well many methodologies available to aggregatethose impact categories. The choice of these parameters depends on which impacts are includedin the study, and this is generally specified by the decision makers. Nevertheless, the globalmethodology is quite similar for all these elements and not all of them are mandatory.
According to the latest ISO 14040:2006 [4] and ISO 14044:2006 [5] standards, an LCIA shouldinclude the selection of impact categories, category indicators and characterization models,classification as well as characterization. Other elements such as normalization, grouping andweighting are not mandatory. A more detailed explanation of each element will be performedlater in this report.
1.5 Interpretation phase
In the interpretation phase, all the results obtained from the inventory and impact assessmentphases of the LCA are compiled and evaluated in order to get a final conclusion. In this phase,the significant aspects of the life cycle can be identified and the alternatives are evaluated orsome activities can be adjusted if required. It is all part of an iterative procedure that leads toachieve the goal of the study and make improvements in the LCA study. [4]
The interpretation must be consistent with the goal and scope definition, and reflects the mainpurposes of the study. Data quality and source must be verified so that the accuracy of theresults and reliability of the study can be ensured, bearing in mind the boundaries, uncer-tainties and limitations of the study. The final conclusions must be consistent with all theprevious phases and consider the subjectivity implied in the elections made in the middle stepsof the LCA. The interpretation phase may also include recommendations for future analysesor researches. Other complementary analyses might be used, such as sensitivity analysis, un-certainty analysis, variation analysis, contribution analysis, dominance analysis or comparativeanalysis; but are not mandatory. [4] Finally, other tools can be useful to help in the decision-making process, and many other aspects aside from the environmental issues can be included
Thomas Dequidt 5 Master Thesis NTNU 2012

CHAPTER 1. INTRODUCTION
in the interpretation. For example, the consideration of cultural, social or economic aspectscould be important as well.
This presentation of the theoretical LCA framework aimed at familiarizing the reader withcommon LCA vocabulary and global methodology. Each stage of the LCA analysis will befurther detailed in this report, adapting the LCA requirements to a Norwegian bridge projectowned by the National Public Roads Administration (Statens vegvesen).
Thomas Dequidt 6 Master Thesis NTNU 2012

Chapter 2
Previous researches
As a basis for a comparison with the case study results, a literature review of previous bridgeLCA analyses has been performed. 14 references are hence presented in this section, datingfrom 1998 to 2011. The first part consists in a description of the different studies performed.In a second part, the main findings are gathered in order to draw a preliminary list of elementsthat are important to focus on when performing an LCA analysis. A comparison between thedifferent studies regarding the major environmental burdens, that are carbon emissions andenergy use, is also performed.
2.1 Literature review
C. Zhang et al. in 2011. [9]
Environmental Evaluation of FRP in UK Highway Bridge Deck Replacement Ap-plications Based on a Comparative LCA Study is taken from the journal AdvancedMaterials Research. An LCA analysis is performed to compare the environmental impacts oftwo bridge deck replacement alternatives: a fiber-reinforced polymer (FRP) deck and a con-ventional prestressed concrete deck. The impacts are evaluated in terms of carbon emissions.Initial demolition, construction and future maintenance are assessed. Construction equipmentuse, end-of-life demolition and materials recovery are not considered. Three sources of carbonemission are considered: embodied carbon of materials, transportation and traffic disruption.The life cycle design is 120 years.
It is found that for the whole service life, the prestressed concrete option is more environmentallyfriendly than the FRP one, even if emissions due to FRP are smaller at initial construction.During maintenance, FRP decks are less advantageous due to higher embodied carbon in thesurfacing material. The demolition phase contributes in very small proportions. The impactof non-structural elements (surfacing, water-proofing and bearing replacement) is found quite
Thomas Dequidt 7 Masther Thesis NTNU 2012

CHAPTER 2. PREVIOUS RESEARCHES
important. The importance of local material sources and disposal sites to minimize impactsfrom transportation is also highlighted. Improvements in the manufacturing of FRP concretecould lead to less impacts in the future.
J. Hammervold et al. in 2011. [10]
Environmental Life-Cycle Assessment of Bridges is taken from the Journal of BridgeEngineering and published by the ASCE Association. This report presents a detailed compar-ative environmental life cycle assessment (LCA) case study of three bridges built in Norway.In order to encompass a wide scale of bridge designs, the analysis dealt with a steel box girderbridge, a concrete box girder bridge and a wooden arch bridge. The material production,transportation, construction, operation (excluding traffic disruption), maintenance, repair andend-of-life phases are included. 6 impact categories are considered, as well as normalizationand weighting.
The study shows that the production of materials for the main load carrying systems (i.e. thebridge superstructure) and the abutments account for the main share of the environmental im-pacts as these parts require large quantities of materials. The three main impact categories areglobal warming potential (GWP), abiotic depletion potential (ADP) and acidification potential(AP). A comparison of the three bridges shows that the concrete bridge alternative performsbest environmentally on the whole, but when it comes to global warming, the wooden bridgeis better than the other two.
L. G. San Martin in 2011. [3]
LCA of a Spanish railway bridge is a Master Thesis realized by a KTH student (Stockholm,Sweden), dealing with the Life Cycle Assessment of a steel arch railway bridge with prestressedconcrete decking. All stages are taken into account: material stage (raw material extraction,production and distribution), construction (including diesel, electricity and water), use andmaintenance (repair and replacing) and the end of life. In the end of life scenario, 70% ofconcrete and 90% of steel are recycled and the wood is land-filled. 6 impact categories areconsidered, as well as normalization and weighting.
The results show that the main contributor to the environmental impacts is the material pro-duction phase, accounting for 64% of the total results. Concrete and steel production share thebiggest part of the overall impacts, followed by timber production. These processes account forgreat amounts of CO2 emissions. The main contributing elements are the temporal structure,the substructure and the superstructure, decreasingly.
Thomas Dequidt 8 Master Thesis NTNU 2012

CHAPTER 2. PREVIOUS RESEARCHES
Z. Lounis et al. in 2010. [11]
Towards sustainable design of highway bridges , published by the National ResearchCouncil of Canada, uses LCA methodology to compare two bridge deck designs: a high per-formance concrete (HPC) bridge deck and a conventional concrete bridge deck. This paperdiscusses some performance indicators, such as safety, serviceability, costs, traffic disruption,greenhouse gas emissions, which can be used for life cycle design of highway bridges. Environ-mental impacts, in terms of greenhouse gas emissions and waste production are estimated forall activities occurring during the life cycle of both concrete deck alternatives. The three majorelements that illustrate the differences between the two alternatives are cement production,additional transportation needed for the SCMs included in the HPC mix and CO2 emittedby cars/trucks delayed by the maintenance, repair and replacement activities. Economic andsocial impacts are also evaluated, but will not be discussed here.
It is found that additional transportation and differences between emissions due to trafficdisruption are not very significant, but cement production shows striking differences. TheCO2 emissions due to cement production are almost three times less important for HPC thanfor a conventional concrete. Furthermore, the shorter service life of the normal concrete deck,which leads to an increase in traffic disruption due to earlier replacement, also contributes tothe higher CO2 emissions of the NPC deck.
Bouhaya et al. in 2009. [12]
Simplified environmental study on innovative bridge structure is taken from the journalEnvironmental Science & Technology. 3 scenarios of a composite wood-ultra high performanceconcrete (UHPC) bridge are studied regarding energy use and GHG emissions. Those 3 scenar-ios differ according to the end-of-life scenarios of the wooden girders. The first one is landfilling,the second one is burning and the third one is reuse of the wood. Material production, trans-portation, construction, maintenance and end-of-life phases are included. The functional unitconsidered is a 25 m span bridge deck.
Calculations show that the main part of the energy comes from the material. Thanks to theCO2 uptakes of the wood during its lifetime, the overall GHG emissions are negative for thescenarios with land filling and reuse of wood. However, the consumption of primary energy islower for the scenario in which wood is burned instead of natural gas.
Gervásio and da Silva in 2008. [13]
Comparative life-cycle analysis of steel-concrete composite bridges is taken from thejournal Structure and Infrastructure Engineering, published by Taylor & Francis. A prestressedconcrete girder bridge and a steel-concrete composite I-girder bridge are compared. Both Life
Thomas Dequidt 9 Master Thesis NTNU 2012
CHAPTER 2. PREVIOUS RESEARCHES
Cycle Assessment (LCA) and Life Cycle Cost Analysis (LCCA) methods are applied, repre-senting an integrated methodology for a life-cycle and sustainability analysis. In the LCA,only different grades of steel and concrete inputs to the bridge and the construction phase areincluded (due to lack of data). 3 types of concrete mixes are assessed.
For total environmental performance the composite bridge is found the best alternative, afternormalization and weighting of the results. However, when looking at Global Warming only,both bridges have roughly the same overall performance. The results of the Life Cycle CostAnalysis are not discussed here.
Collings in 2006. [14]
An environmental comparison of bridge forms is taken from the journal Bridge Engi-neering. Two studies are presented. One (the initial study) is about three alternative bridgedesigns related to the same site (a major creek crossing in the Middle East), the second (theprimary study) is about three alternative bridge forms crossing a river in the UK (river widthapproximate 120 m). The initial study comprises a concrete cantilever bridge, a concrete cablestay bridge and a steel arch bridge. CO2 emissions are found highest for the steel bridge. Paint,waterproofing and plastics are important in spite of small amounts. The primary study consid-ers three basic forms with three material choices for each alternative. This gives 9 alternativesin total; girder, arch and cable stayed bridges using steel, concrete or steel-concrete compositedesign material.
The results show that concrete bridges have lower embodied energy and CO2 emissions. More-over, the differences between steel and concrete bridges appeared insignificant for small struc-tures (20 m). It is also found that a well-engineered longer span (120 m) bridge utilizing localmaterials, recycled steel and cement produced by the dry process (plus some cement replace-ment) can be almost as environmental friendly as a shorter-span (20 m) structure in which noconsideration has been given to environmental issues. More architectural solutions, like leaningor distortion of elements, have larger environmental impact as they require more material andmore complex construction (arch and cable stay bridges versus girder bridges).
Report from the MEEDDM in 2006. [15] (French reference)
Analyse du Cycle de Vie d’un pont en béton is a French report entitled Life CycleAssessment of a concrete bridge, example of application on a common bridge in English. Thishandbook gives general guidelines to assess the environmental impacts of a bridge project. Itis to be applied for prestressed concrete structures. The analysis covers the evaluation of thedeck, piers and foundations, as well as the superstructure equipment. The functional unitis defined as a prestressed concrete bridge used as a highway infrastructure for a life timeof 100 years. The impacts from traffic are not assessed. The loads were designed according
Thomas Dequidt 10 Master Thesis NTNU 2012
CHAPTER 2. PREVIOUS RESEARCHES
to French recommendations (not Eurocodes). The study includes: raw material acquisition,transportation, fabrication of components, construction, maintenance and repair and recyclingof the material after end of life. The material used for the site preparation and installation isalso included in the analysis. 9 environmental impacts are assessed, including global warmingand energy use.
The results show that the material fabrication stage accounts for the most important part of theemissions: for 6 impacts indicators, it represents between 31 and 59% of the total emissions. Thesurveillance, maintenance and repair stage represents the second most important field.
K. Steele et al. in 2005. [16]
Environmental sustainability for bridge management is taken from the journal BridgeManagement 5 and published by Thomas Telford Limited. An LCA analysis is performedto compare the environmental impacts of three bridge designs: a steel through deck, a rein-forced concrete beam bridge and a brick arch structure. These three bridges all had similarservice functionality: a span of approximately ten meters, a 40 ton design load capacity, a120-year design life and a single lane carriage way capacity. The impacts are given in Ecopointindicators.
It was determined that up to the point of bridge completion, the two beam structures had alower environmental impact than the arch bridge. The single biggest cause of environmentalimpact during a bridge life cycle can be attributed to construction. Design efficiency is im-portant and careful use of materials is critical to realize a low impact solution. Considerationof structure service life and construction of an adaptable bridge will minimize life cycle im-pact. Movement of materials to and from the construction site is identified as important asis minimization of construction waste. For existing bridge infrastructure, it is generally envi-ronmentally better to maintain, refurbish, or strengthen the structure rather than demolish itand rebuild again. Finally, the environmental burden of traffic disruption and vehicle diver-sions can make significant contribution to the overall environmental impact of bridge worksactivity.
Keoleian, Kendall et al. in 2005. [17]
Life cycle modeling of concrete bridge design: Comparison of engineered cementi-tious composite link slabs and conventional steel expansion joints is taken from theJournal of Infrastructure system, published by the ASCE association. Two types of deck sys-tems are compared; a steel-reinforced concrete deck with conventional steel expansion joints anda steel-reinforced concrete deck with a link slab design using a concrete alternative; engineeredcementitious composites (ECC). The study includes material production, construction, use and
Thomas Dequidt 11 Master Thesis NTNU 2012
CHAPTER 2. PREVIOUS RESEARCHES
end-of-life management related to the bridge decks. Three reconstruction options are consid-ered; bridge deck replacement, deck resurfacing and repair and maintenance (mainly fixing ofcracks and potholes) including the traffic disruption due to these activities.
The analysis shows that the ECC deck yields significantly lower environmental impacts, forall pollutants (because of less need for maintenance). Traffic disruption due to constructionand repair is significant for the environmental performance for both decks. It is also foundthat predicting maintenance and repair schedules for each system is critical in evaluating theperformance of alternative materials.
Martin in 2004. [18]
Concrete bridges in sustainable development is taken from Proceedings of the ICE. Twocomparisons of bridge deck designs are performed in this study using LCA methodology. Thedecks are evaluated regarding energy use and greenhouse gases emissions, and the whole lifecycle of the construction materials was considered, from raw material extraction to demolitionand recycling. The first one compares a steel-concrete composite deck and a concrete deck(including girders). In the second study, three types of concrete for bridge decks are compared: lightweight, normal density and high-strength concrete (including girders).
In this first study, the concrete alternative gives lower embodied energy and GHG emissions(given as CO2-equivalents) when considering new materials, but the composite solution giveslower GHG emissions when recycled materials are used. In the second one, no significantdifference in energy consumption is found for the three alternatives. However, the high-strengthconcrete is supposed to have longer durability, and might thus be the preferred alternative.
Y. Itoh et al. in 2003. [19]
Using CO2 emission quantities in bridge life cycle analysis is taken from the journalEngineering Structures and published by Elsevier. A modified life cycle methodology is used toevaluate and compare two types of steel bridges; a conventional and a minimized girder bridge.The conventional bridge has 7 longitudinal girders and the minimized girder bridge has only 3,and thus requires less steel. A prestressed concrete deck is required for the minimized girder, asthis shall contribute to structural rigidity. The bridges are compared regarding CO2 emissionsand costs. The life cycle stages included are construction, use and replacement.
The results show that the minimized girder bridge gives both lower CO2 emissions and costs intotal, and also when looking at maintenance only the emissions are the lowest for the minimizedgirder bridge, mainly because the prestressed concrete deck requires far less maintenance thanthe reinforced concrete deck.
Thomas Dequidt 12 Master Thesis NTNU 2012

CHAPTER 2. PREVIOUS RESEARCHES
A. Horvath et al. in 1998. [20]
Steel versus Steel-Reinforced Concrete Bridges: Environmental Assessment , takenfrom the Journal of Infrastructure Systems and published by the ASCE association, presentsan environmental assessment on two bridge alternatives; steel and steel-reinforced concretebridges. In this study, a combination of LCA and economic input-output analysis is applied.This method is predicated on the fact that in a modern economy every sector contributes,directly or indirectly, to every other sector. Economic input-output analysis explicitly accountsfor all of the direct and indirect inputs to produce a product or service by using the input-output matrices of a national economy. For example, cement production and electricity aredirect inputs of concrete production, but many agricultural and service sectors are indirect,or second, third, etc., tier suppliers [8]. This makes the system border very wide as input-output includes all upstream activities in the system (all economic sectors). Three groups ofenvironmental impacts are quantified in this study; TRI chemical emissions, hazardous wastegeneration and conventional air pollutants emissions. Material inputs for the two bridges,including all upstream activities for the production of these are included. For the use phase,only repainting of the steel structure is included.
The concrete design has lower overall environmental effects. Environmental effects throughthe lifetime of the bridge can be highly important, as SO2, NOx, CH4 and VOC emissionsare significantly higher for paint manufacturing than for the production of all girders for theexample bridge. It is stressed that if more environmental effects were included, or if there wereother designs, the results might have been different. It is also pointed out that bridges are oftendemolished due to obsolescence rather than reaching their end of service life. Here is suggestedan argument to choose materials with the lowest environmental impact rather than the highestdurability, as durability becomes irrelevant.
J. Widman in 1998. [21]
Environmental Impact Assessment of Steel Bridges , taken from the Journal of Con-structional Steel Research published by Elsevier, deals with an LCA analysis performed on twotypes of bridges: a steel box girder bridge and a steel I-girder bridge with concrete decking.The inventory includes all state-of-the-art data available (at the time) on the products andprocesses. The studied unit is environmental impact (as kg air emission) per square meterlane.
The concrete in steel bridges contributes to almost 50% out of the environmental impact and thefact that steel bridges need less material than concrete bridges, shows that steel bridges are goodenvironmental choices. The emissions CO2, NOx, SO2 and CO correspond to more than 95%in weight out of the total airborne emissions. As environmental effects from the maintenancepart are very small, it is not important to increase the longevity by using a lot of corrosion
Thomas Dequidt 13 Master Thesis NTNU 2012

CHAPTER 2. PREVIOUS RESEARCHES
protective substances or extra amounts of material to prevent material deterioration.
2.2 Main findings
2.2.1 Preliminary results
This literature review gathered different approaches of bridge environmental assessment. Somereferences focused on the comparison of the life cycle environmental performance of severalbridges, others simply gave recommendations regarding environmental - or even sustainable- issues related to bridge projects, and others did both. Even if different assumptions weremade by the authors, some common recommendations and results can be found. Here is a(non-exhaustive) list of the main issues discussed in the articles:
Goal of the study
Among all the references, 12 perform an LCA analysis in order to compare the environmentalimpacts of different bridge designs and 2 realize a comprehensive general analysis of bridgeLCA with a case study. This shows that LCA methodology is often used as a comparative toolin order to choose the best environmental solution, but it can also be performed in order toassess the overall environmental performance of one type of bridge, which is for example theintended goal of this thesis.
Types of bridges
45 bridges are assessed within the 14 references selected, including 22 concrete, 13 steel (includ-ing steel-concrete non-composite), 5 steel-concrete composite, 4 wood and 1 brick bridges. Thisshows that concrete bridges are predominant in bridge life cycle assessment and that concreteand steel represent the two principal materials used in bridge design, compared to wood orbrick.
Functional unit
Only 5 authors clearly define their functional unit. Most of the time, the results are givenconsidering the overall impact of the bridge or some of its elements, according to the goal andscope definition of the study. This choice of functional unit makes difficult the possibility ofhaving comparisons between the results of different studies, as bridge geometry or selectionof the elements assessed differ, for example. However, one reference [10] defined its functional
Thomas Dequidt 14 Master Thesis NTNU 2012

CHAPTER 2. PREVIOUS RESEARCHES
unit as “1 square meter effective bridge surface area” (i.e. approximately the upper deck surfacearea), which can be a good functional unit to compare analyses dealing with different bridgegeometries.
Life cycle phases considered
Due to limitations in data availability and accuracy, some authors do not include all life cyclestages in their analysis. Material production, transportation, construction and maintenancephases are always taken into consideration. 6 references consider end-of-life treatment. Trafficdisruption due to maintenance activities is evaluated in 2 studies, but regular traffic is never con-sidered. The assumptions regarding which processes are included or not in the life cycle phasesdiffer a lot according to the references. However, a majority of the studies consider the impactsfrom main material processes (concrete, steel or wood production, as well as the constructionand maintenance activities related) including the amount of energy required, transportation tothe site, assembly at site as well as repair, maintenance and replacement activities.
Design service life
8 references consider a design service life of 100 years or more (120 years for 4 references), whichis the average design service life in bridge management. The other studies do not consider theentire bridge (e.g. only a bridge deck replacement) and hence use a shortened design servicelife.
Emissions and impact categories considered
5 references consider more than 6 impact categories in their studies, usually accompanied withweighting and normalization of the results. 8 references use global warming potential in theirstudies while the others just consider CO2 emissions or discarded air pollutants. Energy useis explicitly calculated in 6 references. This is not an impact category as defined in LCA ISOstandards, but it gives representative information about the environmental performance of abridge project.
Life cycle phases contributing to major environmental impacts
For all references, material production (sometimes included in the construction phase of thebridge) is the biggest contributor. The second most contributing phase is either maintenanceand repair (3 references) or traffic disruption due to construction or maintenance and repairactivities (2 references).
Thomas Dequidt 15 Master Thesis NTNU 2012

CHAPTER 2. PREVIOUS RESEARCHES
Bridge components contributing to major environmental impacts
Most of the time, only the bridge superstructure (and more precisely its structural elements) isconsidered in the analyses. Among the 2 references considering a complete bridge assessment,only one finds out that temporal form work and bridge substructure lead to more environ-mental impacts than the bridge superstructure. Most often, as the structural elements of thesuperstructure contain the most important part of total material use, and as material phase isrelated to the biggest share of the environmental impacts, only bridge decks and their support-ing features (girders, arches, cables, etc.) are considered.
Best environmental choice in comparative studies
Among the 12 comparative studies of the literature review, 3 references highlight innovativebridge deck design (ECC link slabs, HPC concrete, minimized number of girders) over conven-tional bridge deck design. Regarding the studies assessing different material choices, concreteis often the best environmental solution regarding the overall impact (5 references). However,for greenhouse gases (GHG) emissions; steel, composite or wooden alternatives are sometimespreferred (3 references), especially if recycled material are used (1 reference).
Other recommendations
A few similar recommendations are given by the authors, mainly considering material anddesign quality, but also LCA recommendations for further studies. It is often stated thatuse of recycled or sustainable material is strongly recommended as it can lower efficientlyburdens from material phase, as well as use of renewable energy. For LCA practitioners, itis important to consider transportation distances and traffic disruption during construction ormaintenance, as they can represent an important share of the environmental impacts. Hence,as this is directly related to bridge owners, designers and contractors, local material sourceis important to minimize transportation related emissions, so are maintenance schedules inorder to limit traffic disruption related emissions as much as possible. 2 references consideringtimber bridges insist on the positive impact of CO2 uptakes during wood life cycle. Anotherone indicates that more architectural solutions (cable-stayed bridges, for example) often leadto more environmental impacts, as they require more material and construction features to berealized.
Thomas Dequidt 16 Master Thesis NTNU 2012

CHAPTER 2. PREVIOUS RESEARCHES
2.2.2 Carbon emissions and energy consumption
In this section, the main results regarding carbon emissions (in terms of kgCO2 or kgCO2-eqemissions) and energy consumption (in GJ) are presented. Within the 14 references selected,33 and 28 out of the 45 bridge case studies show the total amounts of carbon emissions andenergy use, respectively. The other studies simply show the shares of carbon emissions andenergy use within the different life cycle phases. As stated earlier, energy use is not an impactcategory as indicated in the ISO standards, but this category gives a representative idea of theenvironmental performance of a bridge project.
As a recurrent choice in the literature, the reference unit selected to allow comparison of theresults is "1 square meter effective bridge deck area through a lifetime of 100 years". The casestudies are sorted according to the material design choice (concrete, steel, composite concrete-steel or wood) in order to identify the importance of this parameter in bridge design, as oftenstated by the authors in the literature review. Average values are also calculated, first by mixingall design materials and then by taking them individually. However, two references, Bouyahaet al. (2009) [12] and Gervasio et al. (2008) [13], covering 5 case studies, are not included in theaverage values as their scopes and assumptions differ a lot from those of the other studies.
As the references chosen cover a very wide range of bridge and material designs, scopes, invento-ries and assumptions, the purpose of this section is not to realize a comprehensive comparison ofthe results, but to give an average estimation of the carbon emissions and energy consumptionrelated to typical bridge designs. Hence, no investigations have been realized about correlationsbetween the functional unit (effective deck area), carbon emissions and energy use, since thiswould not have been accurate. The results of this work shall not be directly used to draw strictconclusions about carbon emissions and energy use of bridges.
All bridges
When combining all results regardless material design choice and excluding Bouyaha et al.(2009) [12] and Gervasio et al. (2008) [13], the average values for carbon emissions and energyconsumption are 1830 kgCO2 and 23.1 GJ per functional unit (FU), respectively. As the resultsfor carbon emissions mix CO2 emissions and global warming, the calculated average value isslightly overestimated, as global warming takes into account other emissions, such as methaneor nitrous oxide. A sensitivity analysis should be performed to evaluate the importance of thismix-up regarding the accuracy of the results, however this will not be done here due to theabsence of data for these other emissions. The carbon emission and energy consumption valuesrange from 107 to 3720 kgCO2 and from 4.65 to 51.6 GJ per FU, respectively. The bridge deckarea varies from 144 to 3400 m2, with an average value of 2495 m2.
Thomas Dequidt 17 Master Thesis NTNU 2012

CHAPTER 2. PREVIOUS RESEARCHES
Concrete bridges
20 case studies deal with concrete bridges which makes concrete the most common material inbridge construction, in the framework of this literature review.
Table 2.1 displays carbon emission and energy consumption values for each case as well as av-erage values for concrete bridges. As a first conclusion, we can state that in average and in thescope of this review, concrete bridges are more environmentally efficient, both regarding carbonemissions (1590 kgCO2 per FU) and energy consumption (20.5 GJ per FU). One reason is thata lot of improvements are regularly achieved in concrete design regarding its environmental ef-fectiveness. Fiber reinforced concrete (FRC), high performance concrete (HPC) and engineeredcementitious composite (ECC) concrete for link slabs are examples of more durable concretes,even if FRC still needs improvements in its production to be environmentally competitive.
HPC material is the best concrete option for carbon emissions (133 kgCO2 per FU) and a pre-stressed concrete simple box girder bridge scores the lowest energy consumption value for anymaterial design (4.65 GJ per FU). The worst concrete option for both carbon emissions and en-ergy consumption scores 3390 kgCO2-eq per FU and 48.8 GJ per FU, respectively, and consistsin a conventional reinforced concrete deck with steel expansion joints. A concrete arch bridgescores the second worst environmental burdens for both categories. Gervasio et al.(2008) [13]gives significantly lower values for both categories, as only concrete and steel production areincluded in the calculations of carbon emissions and energy use, respectively.
Concrete bridges
ReferenceType ofbridge
Effectivedeck area
(m2)
Carbonemissions(per FU)
Unit
Energyconsump-tion (per
FU)
Unit
Zhang etal., 2011
FRP bridgedeck
144 2670 kgCO2 - -
Zhang etal., 2011
Prestresseddeck
144 2380 kgCO2 - -
Hammervoldet al. 2011
Box girder(wholebridge)
417 600 kgCO2-eq - -
Lounis etal., 2010
HPC deck 597 133 kgCO2 - -
Lounis etal., 2010
Reinforceddeck
597 378 kgCO2 - -
Continue on next page
Thomas Dequidt 18 Master Thesis NTNU 2012

CHAPTER 2. PREVIOUS RESEARCHES
Continued from previous page
ReferenceType ofbridge
Effectivedeck area
(m2)
Carbonemissions(per FU)
Unit
Energyconsump-tion (per
FU)
Unit
Collings,2006
Cantileveredviaduct
4300 1500 kgCO2 18 GJ
Collings,2006
Cable-stayviaduct
4300 1420 kgCO2 18.4 GJ
Collings,2006
Girderbridge
4300 2050 kgCO2 25.5 GJ
Collings,2006
Arch bridge 4300 3340 kgCO2 40.9 GJ
Collings,2006
Cable-staybridge
4300 3110 kgCO2 36.6 GJ
MEEDDM,2006
Prestressedbridge(wholebridge)
495 1370 kgCO2-eq 13.2 GJ
Keoleianet al., 2005
Reinforceddeck withsteel exp.joints
2560* 3390* kgCO2-eq 48.8* GJ
Keoleianet al., 2005
Reinforceddeck withECC link
slab
2560* 2280* kgCO2-eq 29.3* GJ
Martin,2004
Prestressedbridge
330* 621* kgCO2-eq 5.24* GJ
Martin,2004
Post-tensionedbox girderbridge,
lightweightconcrete(B45)
3200* - - 14.5* GJ
Continue on next page
Thomas Dequidt 19 Master Thesis NTNU 2012

CHAPTER 2. PREVIOUS RESEARCHES
Continued from previous page
ReferenceType ofbridge
Effectivedeck area
(m2)
Carbonemissions(per FU)
Unit
Energyconsump-tion (per
FU)
Unit
Martin,2004
Post-tensionedbox girderbridge,normalconcrete(B65)
3200* - - 13.7* GJ
Martin,2004
Post-tensionedbox girderbridge,high-
strengthconcrete(B85)
3200* - - 13.3* GJ
Itoh et al.,2003
Prestressedsimple pre-tensionedT-girderbridge
2250* 120 kgCO2 4.7* GJ
Itoh et al.,2003
Prestressedsimple box
girderbridge
2250* 107 kgCO2 4.65* GJ
Gervasioet al.,2008**
Prestressedbox girder
10862 53.2*** kgCO2 0.912*** GJ
Average - 2287* 1590* kgCO2 20.5* GJ* Estimated values.** Not included in the average values.*** Only concrete production is assessed for carbon emissions and steel for energy use.
Table 2.1: Concrete bridges
Thomas Dequidt 20 Master Thesis NTNU 2012

CHAPTER 2. PREVIOUS RESEARCHES
Steel bridges
7 case studies deal with steel bridges. Table 2.2 displays carbon emission and energy con-sumption values for each case as well as average values. The average values show that steelbridges contributes to significantly higher carbon emissions (2180 kg CO2 per FU) and energyconsumption (31.0 GJ per FU) than concrete bridges. Furthermore, the worst values amongstall bridges are scored by two steel arch bridges; a steel arch with prestessed concrete deck con-tributing the most to global warming (3720 kgCO2-eq per FU), and another steel arch bridgeholding the most important energy consumption value (51.6 GJ per FU).
These values show, in the scope of this review, that steel bridges are much less environmentaleffective than concrete bridges, mainly because steel requires much more energy for its produc-tion than concrete and hence emits more carbon emissions. Furthermore, less improvementshave been achieved to reduce environmental burdens related to steel production, compared toconcrete, whose design improvement already showed its environmental effectiveness.
Steel bridges
ReferenceType ofbridge
Effectivedeck area
(m2)
Carbonemissions(per FU)
Unit
Energyconsump-tion (per
FU)
Unit
Hammervoldet al., 2011
Boxgirder**
321 790 kgCO2-eq - -
SanMartin,2011
Arch withPC deck**
672 3720 kgCO2-eq - -
Collings,2006
Archviaduct
4300 1430 kgCO2 19.6 GJ
Collings,2006
Girderbridge
4300 2340 kgCO2 32.8 GJ
Collings,2006
Archbridge
4300 3610 kgCO2 51.6 GJ
Collings,2006
Cable staybridge
4300 3190 kgCO2 42.2 GJ
Itoh et al.,2003
Box girderbridge
2250* 200* kgCO2 8.98* GJ
Average - 2920* 2180* kgCO2 31* GJ* Estimated values.** Whole bridge.
Table 2.2: Steel bridges
Thomas Dequidt 21 Master Thesis NTNU 2012

CHAPTER 2. PREVIOUS RESEARCHES
Steel-concrete composite bridges
5 case studies deal with steel-concrete composite bridges. Table 2.3 displays carbon emissionand energy consumption values for each case as well as average values. The average values forcarbon emissions (2490 kgCO2 per FU) and energy consumption (32.5 GJ per FU) are slightlyhigher than for steel bridges. We can notice that the steel-concrete composite arch bridge scoresthe highest carbon emission (3720 kgCO2 per FU) and energy consumption (50.7 GJ per FU)values, as it was the case for concrete and steel arch bridges.
Steel-concrete composite bridges
ReferenceType ofbridge
Effectivedeck area
(m2)
Carbonemissions(per FU)
Unit
Energyconsump-tion (per
FU)
Unit
Collings,2006
Girderbridge
4300 2290 kgCO2 30.8 GJ
Collings,2006
Compositearchbridge
4300 3720 kgCO2 50.7 GJ
Collings,2006
Cable staybridge
4300 3190 kgCO2 39.8 GJ
Martin,2004
Girderbridge
330* 752* kgCO2-eq 8.59* GJ
Gervasioet al.,2008**
I-girderbridge
10862 25.2*** kgCO2 1.42*** GJ
Average - 3308* 2490* kgCO2 32.5* GJ* Estimated values.** Not included in the average values.*** Only concrete production is assessed for carbon emissions and steel for energy use.
Table 2.3: Steel-concrete composite bridges
Thomas Dequidt 22 Master Thesis NTNU 2012

CHAPTER 2. PREVIOUS RESEARCHES
Timber bridges
4 case studies deal with timber bridges. However, Bouyaha et al.(2009) [12] and Hammervold etal.(2011) [10] have different assumptions regarding wood in its material production phase. Theformer includes the carbon dioxide uptakes of wood during its lifetime and the latter simplyconsiders wood as carbon-neutral. Hence, in the former study, the overall life cycle carbonemissions are negative whereas in the latter one, the carbon emissions are positive. These twoscopes are too different to enable relevant comparisons and calculations of average values fortimber bridges.
Nevertheless, table 2.4 indicates low carbon emission and energy consumption values, all casestudies considered (550 kgCO2 per FU and 11.3 GJ in the worst case, respectively). The end-of-life treatment of timber leads to very different results, as wood combustion creates morecarbon emissions but saves energy, and vice-versa for wood landfilling/recycling. In any case,timber seems to be an interesting material for bridges thanks to its environmental properties.However, the deck areas taken from the case studies are relatively low, so we cannot concludeabout the suitability of timber for bigger structures.
Timber bridges
ReferenceType ofbridge
Effectivedeck area
(m2)
Carbonemissions(per FU)
Unit
Energyconsump-tion (per
FU)
Unit
Hammervoldet al. 2011
Arch(wholebridge)
229 550 kgCO2-eq - -
Bouyahaet al., 2009
UHPCdecking(wood
landfilling)
250 -6.72 kgCO2 11.3 GJ
Bouyahaet al., 2009
UHPCdecking(woodcombus-tion)
250 101 kgCO2 7.44 GJ
Bouyahaet al., 2009
UHPCdecking(wood
recycling)
250 -71.9 kgCO2 11.3 GJ
Table 2.4: Timber bridges
Thomas Dequidt 23 Master Thesis NTNU 2012
CHAPTER 2. PREVIOUS RESEARCHES
2.3 Conclusions
This literature review considered a wide range of studies with very different scopes. Generally,material production is pointed out as the most polluting life cycle phase, followed by main-tenance. Transportation distances and traffic disruption may also be important factors to beconsidered. By sorting the different bridge case studies according to their main design mate-rial, we could see that timber and concrete offer relative environmentally performing solutions,compared to steel and steel-concrete composite alternatives. Carbon emissions and energy usevalues confirm the importance of material design improvement (especially for concrete andsteel, as they represent the two most wide-spread materials in bridges). More architecturalbridges (arch, cable-stay, etc.) are also likely to increase environmental impacts due to morecomplex construction methods and design materials. However, no general conclusions can bedrawn about the overall impact of the bridges during their lifetime, as important differences inscopes and assumptions were considered.
Thomas Dequidt 24 Master Thesis NTNU 2012

Chapter 3
Bridge Life Cycle Assessment
This chapter deals with a comprehensive methodology description of bridge life cycle assess-ment. All four major phases (goal and scope definition, life cycle inventory (LCI), life cycleimpact assessment (LCIA) and interpretation of results) are described in detail according toISO standards and previous bridge LCA references. This section applies the recommendationsfrom the standards to a case study but the scope, assumptions and limitations remain wideenough to allow comparisons of the results with future bridge assessments.
The construction of the methodology is related to the needs of Statens vegvesen, the NorwegianPublic Roads Administration. As owners of the roads and bridges in Norway, this administra-tion was interested in an environmental assessment of their bridges. Their original wish was toobtain an environmental evaluation of one of their current bridge projects that could serve as abasis for the assessment of future bridge projects. Hence, this methodology must be sufficientlyaccurate and focused on the impact assessment of Norwegian bridge projects, but wide enoughto include the possibility of different bridge designs, geometries, etc. However, as pointed out inchapter 2, the choices of materials or deck designs can lead to very different conclusions regard-ing the environmental burdens of a whole bridge. In order to deal with this issue, limitationswill be stated regarding the scope and interpretation of the methodology.
3.1 Goal and scope definition
This section aims at describing the first stage of LCA methodology, i.e. goal and scope defini-tion. In this part, the purpose of the study, its aim, its boundaries, assumptions and approx-imations will be stated, as well as the model and process layout. A meticulous attention willbe attributed to the boundaries of the study, especially regarding foreground processes relatedto material manufacturing phases and energy production processes.
Thomas Dequidt 25 Masther Thesis NTNU 2012

CHAPTER 3. BRIDGE LIFE CYCLE ASSESSMENT
3.1.1 Goal of the study
According to ISO 14040:2006 standard [4], this phase shall include the intended application,the reason for carrying out the study, the intended audience (to whom this study is to becommunicated and useful) and whether the results are intended to be used in comparativeassertions intended to be disclosed to the public (not included in this report).
Intended application
This study is carried out in cooperation with Statens vegvesen. The bridge project chosen forthe case study is Tverlandsbrua, located near Bodø, Norway. The intended goal of this studyis to identify the overall environmental impact of this bridge and use the results as a basis forfurther bridge projects. Furthermore, the results of the case study will be compared to similarprevious studies.
Reason for carrying out the study
The growing worldwide awareness of climate change and its environmental, social and economicimpacts are not to be proved anymore, and this is even more obvious in the building and con-struction sector. In 2007, according to the Norwegian National Transport Plan 2010-2019, thetransport sector was responsible for approximately 25 per cent of Norway’s total greenhouse gasemissions. The last decades have shown a substantial increase in emissions from the sector, andthe Government’s goal is that existing and new measures in the transport sector will result in areduction in emissions between 2.5 and 4.0 million tons CO2-equivalents in relation to expectedemissions in 2020 [2]. This plan was established by the Norwegian Ministry of Transport andCommunication and Statens vegvesen is responsible for its application in the road transportsector. Hence, the Norwegian Public Roads Administration is carrying out studies in order toestimate the CO2-equivalent emissions from the Norwegian roads, bridges and tunnels.
Life cycle assessment is one of the methodologies intending to assess those impacts. Contraryto other environmental management techniques, such as risk assessment, environmental per-formance evaluation or environmental impact assessment; LCA is historically the first holisticapproach, considering a product in its entire lifetime. This life cycle approach allows to obtainvery detailed and precise results, considering all the processes involved in the realization of theproduct or system.
Thomas Dequidt 26 Master Thesis NTNU 2012

CHAPTER 3. BRIDGE LIFE CYCLE ASSESSMENT
Intended audience
The intended audience of this thesis regroups NTNU university, Statens vegvesen. As this audi-ence might not be familiar with LCA methodology, a complete description of the methodologyis performed in this thesis to help them understand life cycle assessment methodology. Thisstudy can also help LCA practitioners for future bridge LCAs.
3.1.2 Scope of the study
The definition of the scope of the study is the second part of the goal and scope definition. Ac-cording to the ISO 14040:2006 standard [2], the scope of the study shall include the product orsystem to be studied, its functions, the functional unit, the system boundaries, allocation pro-cedures, impact categories selected and methodology of impact assessment, data requirements,assumptions, limitations, initial data quality requirements, type of critical review (excludedhere) and type and format of the report required for the study (excluded here).
Product studied
The product studied here is the Tverlandsbrua bridge. This bridge is located in the Nordlandcounty, 15 km from Bodø. The deck design is a post-tensioned concrete box-girder, with a mainspan of 165 m and a total length of 670 m (abutment to abutment). The effective width is 23.45m. The bridge is designed for a double traffic lane in each direction and a pedestrian/bicyclelane. The works started in early June 2011 and are to be achieved in late September 2013.The mounting method chosen by the contractor is a balanced cantilevered traveling formworksystem. This system is made up of two mobile wagons supporting the bridge deck formwork.The wagons are installed at the top of the columns axis and are moved from a 5 meters maximumdistance each time the in-situ cast concrete part has reached a sufficient strength.
Function
The purpose of this bridge is to link Løding, a coastal city, and Vikan by crossing the Salt fjord,hence shortening the traveling distance between both cities by 3 km and reducing the trafficjams that occur in the morning and in the afternoon. The annual average daily traffic (AADT)estimated by Statens Vegvesen is 8600 veh/day for the bridge opening in 2013 and is assumedto grow up until 15000 veh/day by 2113. [?]
Thomas Dequidt 27 Master Thesis NTNU 2012

CHAPTER 3. BRIDGE LIFE CYCLE ASSESSMENT
Functional unit
According to the ISO 14040:2006 standard, the functional unit is defined as the quantified per-formance of a product system for use as a reference unit (section 3.20). In other words, it helpsquantifying the product identified functions. This aims at providing a reference to which theinputs and outputs are related. The definition of the functional unit is, among other things,primordial to allow comparison of results between different systems. Moreover, if additionalfunctions of any of the systems are not taken into account in the comparison of functional unit,then these omissions shall be explained and documented [5].
In our LCA study, the functional unit must be sufficiently precise to allow the impact assessmentof the Tverlandsbrua bridge, but wide enough to include the possibility of the environmentalassessment of future bridge projects. As described in a French report from the MEEDDM(2006) [15], the functional unit for a specific project shall include criteria about the type ofproduct, its function and its lifetime. However, as we want to include a wide range of bridgedesigns, a simpler functional unit shall be defined. The functional unit selected for thisstudy is: "1 square meter effective bridge deck area through a lifetime of 100years", which is the same as the one chosen for the CO2-equivalent emissions assessment inthe literature review.
This functional unit combines physical and temporal criteria. The choice of an effective bridgedeck area is due to the inaccuracy of a one-dimension physical distance (length or width),whereas the product of both is more significant. Indeed, it would be inaccurate to compare twobridges with the same effective length but different numbers of traffic lanes, for example. Theeffective bridge deck area enables comparison between different bridges despite the fact that theyare built at different locations with different sizes. However, this choice is somehow reductivesince the bridge substructure is not clearly represented through this functional unit. Finally,a 100-year life is currently the most common lifetime attributed to new bridges, maintenanceand repair phases included.
System boundaries
The system boundaries defines the unit processes to be included in the system. Ideally, theproduct system should be modeled in such a manner that inputs and outputs at its boundary areelementary flows. The choice of elements of the physical system to be modeled depends on thegoal and scope definition of the study, its intended application and audience, the assumptionsmade, data and cost constraints, and the cut-off criteria, i.e. the specification of the amount ofmaterial or energy flow or the level of environmental significance associated with unit processesor product system to be excluded from the study. The models used should be described andthe assumptions underlying those choices should be identified. The cut-off criteria used within
Thomas Dequidt 28 Master Thesis NTNU 2012

CHAPTER 3. BRIDGE LIFE CYCLE ASSESSMENT
a study should be clearly understood and described [4].
Material production
Bridge superstructure – structural elements
•Concrete
•Steel
•Formwork
•Prestressing work
•Scaffolding
Bridge superstructure – non-structural elements
•Road infrastructure
•Railings & parapets
•Bearings and joints
•Curing compounds
Bridge substructure
•Ground works
•Underwater works
•Steel piles and casings
•Concrete
•Reinforcing steel
•Prestressing work
•Formwork
•Curing compounds
Other
Construction
Transportation to the site
•Transp. of materials
•Transp. of equipment
•Transp. of personnel
Energy consumption on the site
•Electricity
•Diesel
•Gasoline
•Secondary sources
Waste management
•Transport to recycling plants
•Landfilling
Traffic disruption
Operation
Traffic-related emission (incl. traffic
growth rate)
Traffic jams related to traffic growth rate
Power supply for public (and internal)
lighting and other electrical devices
Maintenance & repair
Scheduled maintenance
Traffic-related emissions due to
maintenance
Scheduled repair
Accidental/unforeseen repair
End-of-Life (EOL)
Reinforced concrete
Asphalt
Steel
Gravel
Other
Included elements Elements not existing in this study Excluded elements
Figure 3.1: System boundary of Tverlandsbrua (only foreground processes).
Figure 3.1 describes the bridge life cycle phases and the associated processes and sub-processes.As many processes are included in this thesis, only foreground processes (i.e. data associatedto the product studied) are shown in this figure. System boundaries including backgroundprocesses (i.e. data taken from generic databases) are realized in the case study, where theproduction and construction life cycle phases are deeply analyzed. The red-colored elementsare excluded from the analysis, whereas the grey-colored ones are not present in this project.A more detailed description of the life cycle phases is performed below.
Material production phase: the production phase includes concrete, reinforcing steel, form-work, prestressing equipment (strands, anchors, ducts, grouting paste), asphalt & water-proofing, railings & parapets, bearings & joints, curing & surfacing measures, bored pilessteel casings, steel pipe piles and products for ground & underwater works. The produc-tion of the rented equipment (such as scaffolding, machines, cantilever traveling formworksystem, etc.) is not always considered in this analysis as this equipment is likely to bereused in other projects and the wearing down of the infrastructures related to a spe-
Thomas Dequidt 29 Master Thesis NTNU 2012

CHAPTER 3. BRIDGE LIFE CYCLE ASSESSMENT
cific project is difficult to assess. However, some product or equipment processes fromthe generic database include infrastructure use, and this will be stated whenever suchprocesses are selected.
Construction phase: the construction phase includes burdens from transportation of mate-rial, equipment and personnel to the bridge construction site, energy consumption onthe site from machinery equipment use, short displacements by boat and waste manage-ment on the site. As the bridge is part of a new road project crossing the Saltfjorden,representing an overall 2.1 km length, no traffic disruption is accounted for the bridgeconstruction. The corresponding traffic disruption would be attributed to the carbonfootprint assessment of the roads from each part of the bridge ends.
Operation phase: the operation phase includes emissions from traffic and power supply forpublic lighting. According to Statens vegvesen, the annual average daily traffic (AADT)expected for the opening of this bridge is 8600 veh/day. With a yearly traffic growth rateof 0.558% expected within the next 100 years, the AADT expected in 100 years is 15000veh/day, which is still well below the actual bridge capacity. Hence, no important trafficjams are considered during the bridge life cycle in the analysis.
Repair and maintenance phase: according to Statens vegvesen handbook n◦136 - Inspec-tion for bridges [22] two inspections are frequently performed: a simple visual inspectionevery year and a main inspection every 5 years (including cable and underwater inspec-tions). The repair and maintenance phase also includes a new asphalt course every 3 years.The bridge is designed for a 100-year life cycle without any important reconstruction work(bridge deck renewal, etc.), hence no important structural repairs are scheduled duringthe bridge life cycle. Accidental events (earthquakes, violent storms, collisions, etc.) canoccur and affect the structural properties badly enough to require structural repairs. How-ever, as no relevant data related to the probability of occurrence of such events and thesubsequent repairs can be found, this is not taken into consideration in the analysis.
End-of-life (EOL): the EOL phase considers the bridge deconstruction and EOL of reinforcedconcrete, asphalt, steel from prestressing works and railings & parapets and gravel used forbackfilling against the abutments and as ballast in the caisson. Those four componentsrepresent all together 98.6% of the overall bridge weight. The end-of-life treatment ofother materials is not considered.
Allocation procedures
Allocation procedures are used to partition the environmental load of a process when severalproducts or functions share the same process. For example, when waste is burnt at the incin-eration factory, the fraction and type of emissions associated to each component is unknownunless the exact composition of the bulk mass is known. Allocation procedures are then used
Thomas Dequidt 30 Master Thesis NTNU 2012

CHAPTER 3. BRIDGE LIFE CYCLE ASSESSMENT
in order to attribute accurately the burdens from incineration to each component.
According to the ISO 14044:2006 standard [5], the inputs and outputs shall be allocated tothe different products according to clearly stated procedures that shall be documented andexplained together with the allocation procedure. The allocation procedure shall be divided inthree steps.
Step 1: wherever possible, allocation should be avoided by dividing the unit process in sub-processes and collecting the input and output data related to each sub-process or expand-ing the product system to include the additional functions related to the co-products.
Step 2: where allocation cannot be avoided, the inputs and outputs of the system should bepartitioned between its different products or functions in a way that reflects the underlyingphysical relationships between them.
Step 3: when physical relationship alone cannot be established or used as the basis for allo-cation, the inputs should be allocated between the products and functions in a way thatreflects other relationships between them, for example their economic value.
Allocation procedures in this analysis are avoided as much as possible. For example, this isavoided for all materials considered in the production phase, as a detailed material compositionis available. However, regarding the energy consumption at site from machinery and otherequipment use (cranes, barracks, loaders, excavators, etc.), as only a bulk amount is availableover the entire bridge construction period, the energy is allocated according to the proportionalweight of each component category. For example, the amount of energy required for formworkhandling on the site is calculated by multiplying the share of the formwork weight in the overallbridge weight by the total amount of electricity consumed by the crane. The same allocationprocedure is used for diesel and gasoline consumption on the site and transport of the craneand personnel to the site.
Impact categories selected and methodology of impact assess-ment
As stated previously, life cycle impact assessment (LCIA) is the third stage of LCAmethodology.It is composed of mandatory and optional elements. Among those mandatory elements, theselection of impact categories and, subsequently, the methodology of impact assessment are ofutmost importance. Those elements must be consistent with the goal and scope definition andthe interpretation phases of the LCA analysis. However, the selection of impact categories andthe methodology of impact assessment are not specified in the ISO standards 14040:2006 and14044:2006. The choice is left to the LCA practitioner, according to the intended purpose ofthe study.
Thomas Dequidt 31 Master Thesis NTNU 2012

CHAPTER 3. BRIDGE LIFE CYCLE ASSESSMENT
In our case study, Statens vegvesen is interested in the carbon footprint assessment of theirbridges. The carbon footprint is defined as the total emissions of greenhouse gases, for a definedunit. The greenhouses gases emissions, responsible for the greenhouse effect, are calculatedas carbon dioxide equivalent (CO2-eq). The related impact category is global warming (orclimate change). In order to calculate the amount of CO2-eq emitted, a characterization modelis used: the global warming potential (GWP). This characterization model determines therelative contribution of each greenhouse gas (carbon dioxide (CO2), methane (CH4), nitrousoxide (N2O), etc.) over a period of time. Usually, a 100-year baseline is chosen: this is called the100-year global warming potential (GWP100). The methodology of impact assessment is thestep coming right after the selection of the impact categories. However, this is not consideredhere since only one impact category is selected here, but a short explanation of the possiblemethodologies of impact assessment will be performed in the description of the life cycle impactassessment (LCIA) phase.
Data and initial data quality requirements
The collection or calculation of data can be one of the most energy and time consuming part ofan LCA analysis. Whether the data are collected or calculated, the choice of the level of dataquality is already a complicated task. How precise must be the data in order to give sufficientlyaccurate results? This is not an easy question to answer, but the ISO 14044:2006 [5] standardgive some recommendations for the collection of data.
• The qualitative and quantitative data for inclusion in the inventory shall be collectedfor each unit process that is included within the system boundary. The collected data,whether measured, calculated or estimated, are utilized to qualify the inputs and outputsof a unit process.
• When data have been collected from public sources, the sources shall be referenced. Forthose data that may be significant for the conclusions of the study, details about therelevant data collection process, the time when data have been collected, and furtherinformation about data quality indicators shall be referenced. If such data do not meetthe data quality requirements, this shall be stated.
• Among other things, the major headings of the classified data may be energy inputs, rawmaterial inputs, ancillary inputs, other physical inputs, products, co-products, waste, re-leases to air, water and soils as well as other environmental aspects.
Data used for this study are mainly directly collected from the different actors involved in theproject, hence constituting a trustful basis for the life cycle inventory (LCI) phase. The bill ofquantities of the entire project is provided by the client, Statens vegvesen [23]. Input data frommaterial and energy consumption for the production and construction phases are provided bythe contractor and the different subcontractors, while data related to operation and repair &
Thomas Dequidt 32 Master Thesis NTNU 2012

CHAPTER 3. BRIDGE LIFE CYCLE ASSESSMENT
maintenance and end-of-life phases are provided by the client. Only data for the end-of-lifephase are based on own assumptions. Output data are generally calculated using the LCAsoftware Arda v.15-education, that includes the generic database EcoInvent v2.2. A few outputdata are collected from environmental performance declarations (EPDs) or similar.
Assumptions and limitations
Assumptions and limitations account for an important part of the goal and scope definition.They allow the study to support the reliability of its scientific results when some aspects aredeliberately omitted or neglected. A list of assumptions and limitations are stated below, di-vided in two categories: general assumptions and limitations, that are valid for the assessmentof future bridge projects using this thesis as guideline, and specific assumptions and limitations,that are related to this project.
General assumptions and limitations:
Preparatory works: consultancy, administrative documentation or all works required beforethe first day of work on the bridge construction site are not considered in this analysis sincethe data inventory would be very energy and time consuming and uncertain. Moreover,burdens from this phase are supposed negligible compared to the complete bridge lifecycle.
Economic and social assessment: this study only deals with the carbon footprint assess-ment of Norwegian bridges, and no guidelines are given in this report regarding economicand social aspects. However, key sustainability elements are underlined in a previousreport, TBA 4530 - Construction Engineering & Project Management, SpecializationReport [24], dealing with LCA methodology for bridges.
Carbonation mechanism: carbonation is a very complex mechanism to model. Dependingon the concrete composition, porosity, weather conditions and many other parameters, theresults over a 100-year life can vary tremendously. Hence, this carbon-saving mechanismis not included in this analysis.
CO2 uptakes from wood: as wood absorbs CO2 particulates during its life, using it as aconstruction material can significantly reduce the overall carbon footprint of a project.However, this is once again a complex mechanism to model and this will not be includedin this analysis.
Specific assumptions and limitations:
Material data limitations: as defined in the system boundaries, some components are con-sidered marginal and are not included in the production and construction phases. The
Thomas Dequidt 33 Master Thesis NTNU 2012
CHAPTER 3. BRIDGE LIFE CYCLE ASSESSMENT
contribution from the production of temporary equipment (scaffolding, machines, etc.)is sometimes not considered. For the repair & maintenance phase, accidental/unforeseenstructural repairs are not considered. For the end-of-life treatment phases, only reinforcedconcrete, asphalt, steel and gravel are considered. The benefits from the recycling pro-cesses (of concrete, reinforcing steel, wood, etc.) are not considered in this analysis asthose recycled products will be used in other projects.
Energy consumption assumptions: for the construction phase, a global assumption of en-ergy use is realized for material handling on the site as it is almost impossible to determinethe amount of energy required to mount each element independently. Moreover, as thecontracting company provides power supply, diesel and gasoline for almost all its subcon-tractors, only a raw sum is provided.
Energy consumption limitations: as stated in the system boundaries, the production phasedoes not consider the contribution from the manufacturing processes of several products.For the construction phase, the power supply of the barracks and other processes requiringsmall energy supply are omitted.
3.2 Life cycle inventory (LCI)
This section deals with the second major step of LCA methodology. During the LCI phase,input and output flows are listed and the type and source of data are specified.
3.2.1 General requirements
The ISO 14040:2006 [4] standard gives the framework and general principles required to per-form an LCI:
• The process of conducting an inventory analysis is iterative. As data are collected andmore is learned about the system, new data requirements or limitations may be identifiedthat require a change in the data collection procedures so that the goals of the studywill still be met. Sometimes issues may be identified that require revisions to the goal orscope of the study.
• Two main processes are identified for the data acquisition: data collection and datacalculation. Requirements about the quality of these data is specified in the section ofGoal and Scope definition named “Data and initial data quality requirements”.
• The calculation of energy flows should take into account the different fuels and electricitysources used, the efficiency of conversion and distribution of energy flow, as well as theinputs and outputs associated with the generation and use of that energy flow.
Thomas Dequidt 34 Master Thesis NTNU 2012
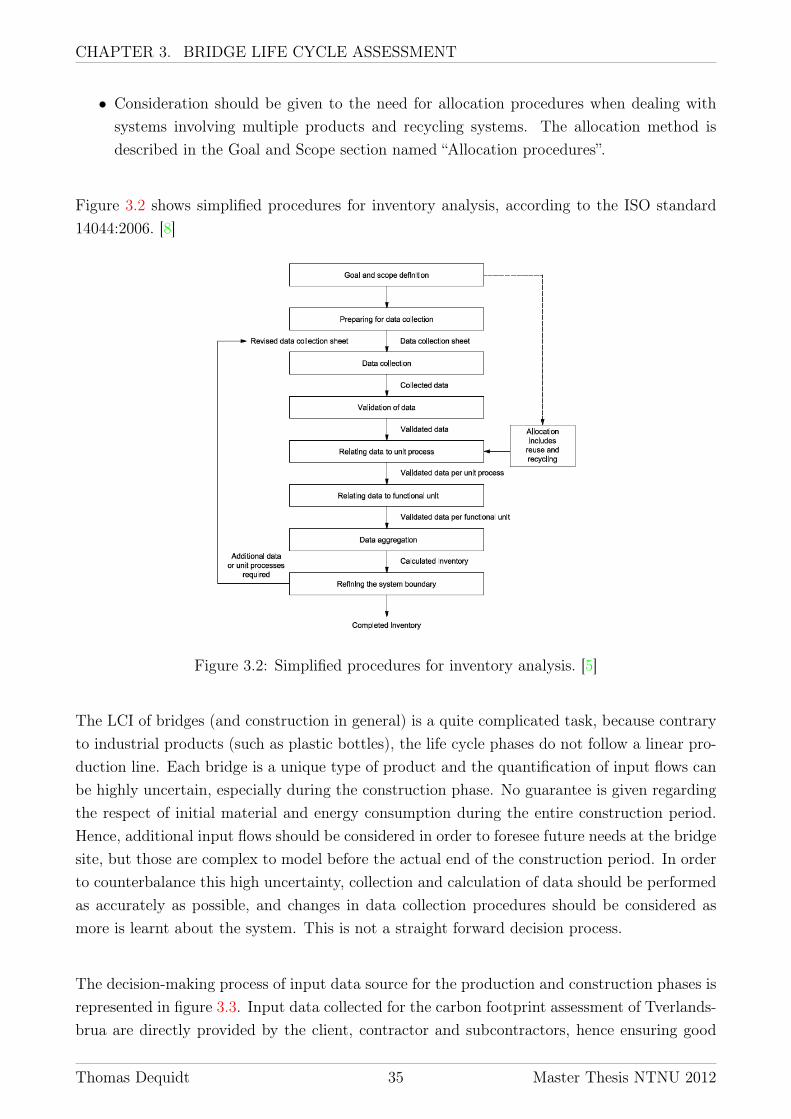
CHAPTER 3. BRIDGE LIFE CYCLE ASSESSMENT
• Consideration should be given to the need for allocation procedures when dealing withsystems involving multiple products and recycling systems. The allocation method isdescribed in the Goal and Scope section named “Allocation procedures”.
Figure 3.2 shows simplified procedures for inventory analysis, according to the ISO standard14044:2006. [8]
Figure 3.2: Simplified procedures for inventory analysis. [5]
The LCI of bridges (and construction in general) is a quite complicated task, because contraryto industrial products (such as plastic bottles), the life cycle phases do not follow a linear pro-duction line. Each bridge is a unique type of product and the quantification of input flows canbe highly uncertain, especially during the construction phase. No guarantee is given regardingthe respect of initial material and energy consumption during the entire construction period.Hence, additional input flows should be considered in order to foresee future needs at the bridgesite, but those are complex to model before the actual end of the construction period. In orderto counterbalance this high uncertainty, collection and calculation of data should be performedas accurately as possible, and changes in data collection procedures should be considered asmore is learnt about the system. This is not a straight forward decision process.
The decision-making process of input data source for the production and construction phases isrepresented in figure 3.3. Input data collected for the carbon footprint assessment of Tverlands-brua are directly provided by the client, contractor and subcontractors, hence ensuring good
Thomas Dequidt 35 Master Thesis NTNU 2012

CHAPTER 3. BRIDGE LIFE CYCLE ASSESSMENT
quality data. However, when the product reference is provided but a part of the informationis missing, a worksheet of the referenced product is searched in order to obtain missing data.When such worksheets can not be found, similar worksheet products are researched. If nosimilar worksheet products are available, generic data from the software database are used. Ifin the meanwhile new information is sent by the client, contractor or subcontractors, the newinformation is analyzed throughout the same decision-making process.
Complete information?
Initial data source: client, contractor &
subcontractors
Yes Input data source: client, contractor &
subcontractor
No
Product reference available?
Yes Search product worksheet
Product worksheet
found?
New information from client, contractor &
subcontractors?
Search similar product worksheet
Similar product worksheet
found?
New information from client, contractor &
subcontractors?
Input data source: similar product worksheet
Input data source: generic data from software
database
Search product reference
Product reference
found?
No
No
No No
Yes
Yes
Yes
Yes
No
Yes
No
Input data source: product worksheet
Figure 3.3: Decision-making process for input data source selection for the production andconstruction phases.
When input data are finally collected, their level of quality is checked to be in accordance withthe goal and scope definition phase. If not, revisions have to be made. Due to time limitations,if missing data are not provided before this master thesis report has to be handed-in (11th ofJune), the closest generic data from the software database are selected. Finally, once all inputdata sources are identified, the closest process available in the software database is attributedto the input data in order to calculate the output data.
Thomas Dequidt 36 Master Thesis NTNU 2012
CHAPTER 3. BRIDGE LIFE CYCLE ASSESSMENT
For the operation, repair & maintenance and end-of-life phases, the input data source is mucheasier to find, as there are less processes considered than in the production and constructionphases. Indeed, for the operation phase, the AADT and growth traffic rate are given by theclient, the public lighting energy consumption is provided by the client and a communicationsystem company. For the maintenance & repair phase, inspection and surface course renewalschedules are provided by the client and the type of asphalt is the same as for the productionphase. Finally, for the end-of-life phase, energy consumption from deconstruction and end-of-life treatment of disposal materials are calculated using generic data from the software database.
Finally, output flow sources are easy to determine in this study, as only carbon footprint isassessed. Hence, only greenhouse gases emissions are calculated.
3.2.2 Collection and calculation of data
Once unit process flows have been listed, they must be quantified, by collection or calculation.As discussed previously, gathering data can be a very energy and time consuming work. Asfar as possible, data should be collected from generic or specific databases, and calculation orestimation of data should be done as a last option. Indeed, data calculation often constitutesan important source of uncertainty and inaccuracy in the data quality and sometimes, evengood data calculation does not lead to more precise results than those obtained with the samedata collected from a database.
The LCA software used for our calculations is Arda v.15-education. This software has been cre-ated for the students of the NTNU Industrial Ecology(IndEcol) program, Trondheim, Norway,in order to perform life cycle assessment exercises. This software, even if produced for educa-tional and not professional goals, is very powerful. It integrates the EcoInvent v2.2 database aswell as the ReCiPe methodology for life cycle impact assessment. The latter will be discussedin the next chapter, dealing with life cycle impact assessment.
The latest version of EcoInvent v2.2 database is from 2009 and compiles a comprehensiverange of process categories such as energy supply, fuels, heat production, electricity generation,wood, building materials or transport (more than 4000 unit processes in total). This databasealso includes capital requirements associated with the various processes, i.e. the part of theimpacts associated with the construction and refurbishment of production facilities. However,this database can be somewhat fragmented in its construction. That is, when you look at theinput structure of a given process you might find that the cooking recipe and emissions aresplit across several different sub-processes, which can be sometimes confusing. Nevertheless,this database is by far the most recent, comprehensive and best quality general LCA databaseavailable today in several LCA software packages [8].
Thomas Dequidt 37 Master Thesis NTNU 2012

CHAPTER 3. BRIDGE LIFE CYCLE ASSESSMENT
For a few production and construction processes, carbon emissions from private databasesare provided by the manufacturers. 70% of reinforcing steel comes from Badische StahlwerkeGMBH in Germany and 30% From Celsa in Mo I Rana, Norway, and the steel pipe piles comefrom Ruukki in Finland. All manufacturers realized environmental reports or environmentalperformance declaration (EPD) spreadsheeets including the greenhouse gases emissions relatedto their products.
A last remark is added to this LCI methodology, related to traditional LCA studies. Whendescribing a system by dividing in its different processes, inputs, outputs and added values, onecan argue that this production chain is often not linear.
To exemplify this, we can take the example of the production of a transportation vehicle. Theproduction requires steel, but the production of this steel requires the input of transportationservices and thereby vehicles, requiring steel for their production, etc. This type of inter-processdependency between industries clearly shows that a hierarchical perspective of a productionsystem is inappropriate [8].
To take into account this interdependence, Nobel Laureate in Economics Wassily Leontiefprovided the basis for this through the invention and development of input-output analysis(IOA). Nowadays, statistical offices around the world develop national accounts which allowfor the development of input-output tables. Other methodologies have been developed to mixtraditional LCA analysis and IOA, named hybrid LCA analysis [8]. IOA and hybrid LCAanalysis will not be here further developed due to lack of time, but this is an interesting aspectto be looked at in further studies.
3.3 Life cycle impact assessment (LCIA)
Life cycle impact assessment is the third stage of LCA methodology. During this stage, thedata from the inventory flows listed during the LCI phase are aggregated to obtain morecomparable values. The type and level of aggregation depends on the methodology and thegoal and scope requirements. However, the ISO 14040:2006 [4] and 14044:2006 [5] standardsgive recommendations to perform an LCIA and to differentiate the mandatory tasks from theoptional ones. According to the ISO standard 14040:2006, an LCIA study should at leastcontain the selection of impact categories, category indicators and characterization models, theclassification of the LCI results and the characterization of the LCI results. Other elements suchas normalization, grouping and weighting are not mandatory, as shown in figure 3.4. [4]
Thomas Dequidt 38 Master Thesis NTNU 2012

CHAPTER 3. BRIDGE LIFE CYCLE ASSESSMENT
Figure 3.4: Elements of the LCIA phase. [4]
3.3.1 Selection of impact categories, category indicatorsand characterization models
As showed in the description of the LCI phase, many input and output data constitute theinventory flows. The results of an LCA study cannot just display a list of disaggregated outputdata, as this would represent a huge number of values and would be neither comfortable toread nor representative of the global environmental impact. This would also make difficult thecomparison between results from different studies and hence complicate the results interpreta-tion. A first step of the LCIA is then to aggregate values in a same category of impact andobtain one representative value per category.
The impact category is the category to which the LCI data will belong, the category indica-tor is the indicator related to the impact category and the characterization model describesin which context (political choices, intergovernmental summits, etc.) the impact category andthe category indicators are defined. Furthermore, there are two types of impact categories:midpoint and endpoint. The midpoint approach models assess the impact categories regardingto the baseline impact categories and its impact to the environment, while the endpoint ap-proach evaluates the damage caused to the areas of protection (AoPs), defined as the resourcesuse, human health and ecological impact [8]. The choice of midpoint or endpoint indicatorsdepends on the scope of the study, since midpoint indicators are easy to calculate but hard to
Thomas Dequidt 39 Master Thesis NTNU 2012
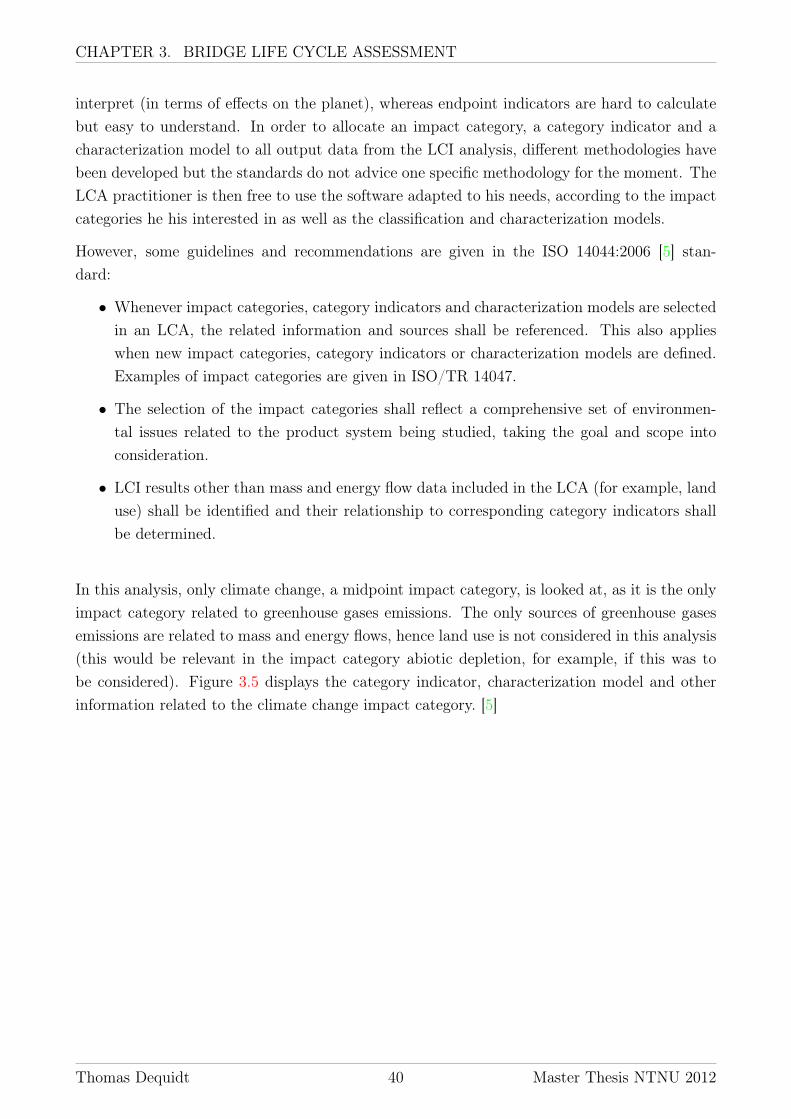
CHAPTER 3. BRIDGE LIFE CYCLE ASSESSMENT
interpret (in terms of effects on the planet), whereas endpoint indicators are hard to calculatebut easy to understand. In order to allocate an impact category, a category indicator and acharacterization model to all output data from the LCI analysis, different methodologies havebeen developed but the standards do not advice one specific methodology for the moment. TheLCA practitioner is then free to use the software adapted to his needs, according to the impactcategories he his interested in as well as the classification and characterization models.
However, some guidelines and recommendations are given in the ISO 14044:2006 [5] stan-dard:
• Whenever impact categories, category indicators and characterization models are selectedin an LCA, the related information and sources shall be referenced. This also applieswhen new impact categories, category indicators or characterization models are defined.Examples of impact categories are given in ISO/TR 14047.
• The selection of the impact categories shall reflect a comprehensive set of environmen-tal issues related to the product system being studied, taking the goal and scope intoconsideration.
• LCI results other than mass and energy flow data included in the LCA (for example, landuse) shall be identified and their relationship to corresponding category indicators shallbe determined.
In this analysis, only climate change, a midpoint impact category, is looked at, as it is the onlyimpact category related to greenhouse gases emissions. The only sources of greenhouse gasesemissions are related to mass and energy flows, hence land use is not considered in this analysis(this would be relevant in the impact category abiotic depletion, for example, if this was tobe considered). Figure 3.5 displays the category indicator, characterization model and otherinformation related to the climate change impact category. [5]
Thomas Dequidt 40 Master Thesis NTNU 2012

CHAPTER 3. BRIDGE LIFE CYCLE ASSESSMENT
Figure 3.5: Climate change impact category. [5]
3.3.2 Classification (assignment) of LCI results
In this step of the LCIA, the different flows included in the inventory are assigned to each impactcategory. According to ISO 14044:2006 [5] standard, the following basic recommendations aregiven:
• assignments of LCI results that are exclusive to one impact category.
• identification of LCI results that relate to more than one impact category, includingdistinction between parallel mechanisms (for example, SO2 is apportioned between theimpact categories of human health and acidification) and assignment to serial mechanisms(for example, NOx can be classified to contribute to both ground-level ozone formationand acidification).
In this analysis, all output data (greenhouse gases emissions) are allocated to one single impactcategory, climate change. The Intergovernmental Panel on Climate Change listed the green-house gases that are relevant to the category indicator infrared radiative forcing (related to theimpact category Climate Change). Some of these greenhouse gases are also allocated to the cat-egory indicator ozone depletion (related to the impact category stratospheric ozone depletion),but this is not a problem since those gases a part of a serial mechanism (i.e., they contributethe same way to both impact category, without being apportioned between them).
Thomas Dequidt 41 Master Thesis NTNU 2012

CHAPTER 3. BRIDGE LIFE CYCLE ASSESSMENT
3.3.3 Characterization (calculation) of LCI results
The category indicator results are calculated for each impact categories using characterizationfactors. These factors are coefficients that are multiplied by each output data related to theimpact category selected in order to aggregate all corresponding data in one single score. Thecharacterization factor values represent the relative importance of each output data comparedto a reference output data. The calculation of the characterization factors also depends on thecharacterization model selected.
In this analysis, as only climate change impact category is selected, the characterization factorassociated is the global warming potential (GWP100) for each greenhouse gas. As a recom-mendation from the IPCC, the baseline chosen for the calculations is 100 years, even if otherbaselines are available (20 and 500 years). GWP100 characterization factors for each greenhousegases and other substances are presented in appendix B.
3.3.4 ReCiPe life cycle impact assessment methodology
Many impact assessment methodologies are implemented in the different LCA softwares anddatabases available in the world. As an LCA study can be performed many different ways,those methodologies aim at simplifying LCA calculations and helping the LCA practitioner tobe coherent throughout his entire analysis. In the LCA software used for this analysis, Ardav.15-education, the ReCiPe LCIA methodology is used. This methodology includes as well theGWP100 characterization factors for greenhouse gases as described by the IPCC, which is themain reference for the life cycle impact assessment phase in this analysis. Other elements thatare not considered in this analysis, such as midpoint and endpoint indicators, normalization,grouping and weighting, are included in the ReCiPe methodology.
3.3.5 Optional elements: normalization, grouping, weight-ing and data quality analysis
Depending on the goal and scope definition of the study, additional elements can be added tothe LCIA phase. Those elements often help the decision makers throughout the calculation ofa unique value indicating the level of environmental impacts of a project when different impactcategories are selected in the analysis. With such a method, all impact category results areaggregated in one single indicator. However, those optional elements are neither well identifiednor controlled by any standard. Hence, the choice of the factors is often subjective and canlead to misinterpretations of the LCIA results. According to the ISO 14044:2006 [5] standard,the different optional elements are defined as following:
Thomas Dequidt 42 Master Thesis NTNU 2012

CHAPTER 3. BRIDGE LIFE CYCLE ASSESSMENT
• Normalization: calculating the magnitude of category indicator results relative to refer-ence information.
• Grouping: Sorting and possibly ranking of the impact categories.
• Weighting: Converting and possibly aggregating indicator results across impact categoriesusing numerical factors based on value-choices; data prior to weighting should remainavailable.
• Data quality analysis: better understanding the reliability of the collection of indicatorresults, the LCIA profile.
Normalization, grouping and weighting are not relevant in this analysis since only one impactcategory is assessed, and hence they will not be further discussed. However, if other bridgeenvironmental assessments taking into account several impact categories are performed in thefuture, these optional elements should be looked at. Regarding data quality analysis, uncer-tainty and sensitivity analyses are performed. The uncertainty analysis deals with data thatare not completely reliable and the consequences of variations in amount or source of inputdata towards the overall impact. The sensitivity analysis tries to evaluate to consequencesof variations in the amount or source of input data related to the processes that account forimportant shares of the overall impact.
3.4 Interpretation phase
The interpretation phase is the last stage of an LCA study. This section links the three pre-vious phases and gives coherence to the entire study. Indeed, as we can see in figure 1.2, theinterpretation phase is not simply coming after the LCIA phase, but is an inherent part of eachphase. More precisely, this phase considers the findings from the inventory analysis and thelife cycle impact assessment together, and establishes a consistency with the goal and scopedefinition. Moreover, according to the ISO [4] 14040:2006 standard, the interpretation phaseshould reflect that the LCIA results are based on a relative approach, that they indicate poten-tial environmental effects, and that they do not predict actual impacts on category endpoints(human health, forest damages, etc.), the exceeding of thresholds or safety margins or risks.
According to the ISO 14044:2006 [5] standard, the interpretation should comprise the followingelements:
• Identification of the significant issues based on the results of the LCI and LCIA phasesof LCA.
• An evaluation that considers completeness, sensitivity and consistency checks (not con-sidered here).
Thomas Dequidt 43 Master Thesis NTNU 2012

CHAPTER 3. BRIDGE LIFE CYCLE ASSESSMENT
• Conclusions, limitations and recommendations.
The relationships between those elements and the other phases of LCA are shown in Figure3.6. [5]
Figure 3.6: Relationships between elements within the interpretation phase with the otherphases of LCA. [5]
3.4.1 Identification of significant issues
This element aims at identifying the significant issues of the LCA study through the structuringof the LCI and LCIA results in accordance with the goal and scope definition. Examples ofsignificant issues can be inventory data (energy, emissions, etc.), impact categories (globalwarming, acidification, etc.) or significant contributions from life cycle stages (raw materialacquisition, production, etc.). The purpose of this interaction between LCA phases is to includethe implications of the methods used, assumptions made, etc. in the preceding phases, suchas allocation rules, cut-off criteria, etc. [5] The results from the uncertainty and sensitivityanalyses are also presented here.
3.4.2 Conclusions, limitations and recommendations
The aim of this section is to draw conclusions, identify limitations and give recommendationsfor the intended audience of the LCA.
Thomas Dequidt 44 Master Thesis NTNU 2012

CHAPTER 3. BRIDGE LIFE CYCLE ASSESSMENT
Conclusions should be done in such a way that the significant issues are identified, the method-ology and results are evaluated (uncertainty and sensitivity analyses) and that the conclusionsare consistent with the requirements of the goal and scope definition, including the identificationof the limitations [5].
Recommendations shall be based on the final conclusions of the study, and shall reflect a logicaland reasonable consequence of the conclusions. Whenever appropriate to the goal and scope ofthe study, specific recommendations to decision-makers should be explained.
Thomas Dequidt 45 Master Thesis NTNU 2012


Chapter 4
Case study: Tverlandsbrua
In this section, an LCA study is performed on a bridge case study. First, a description of thebridge is realized. Then, for each life cycle phase, a detailed inventory list of data is performedstating the sources and methods of data collection or calculation, bearing in mind the systemboundaries and assumptions stated in the goal and scope definition. Finally, the results fromthe LCA software Arda v.15-education are presented, as well as the interpretation of these re-sults and the realization of uncertainty and sensitivity analyses.
Saltfjorden
Tverlandsbrua
Figure 4.1: Localization of Tverlandsbrua project. [6]
Thomas Dequidt 47 Masther Thesis NTNU 2012

CHAPTER 4. CASE STUDY: TVERLANDSBRUA
4.1 Bridge description
As stated earlier, Tverlandbrua is located in Nordland county, 15 km from Bodø, Norway. Thebridge will cross Saltfjorden, and hence is built in a marine environment. The bridge is designedfor a double traffic lane in each direction and a pedestrian/bicycle lane. The works started inearly June 2011 and are to be achieved in late September 2013 and are part of the 2.010 km roadproject Rv.80 Løding-Vikan, owned by Statens vegvesen. All technical drawings are providedby Statens vegvesen and realized by the consultancy company Aas-Jakobsen.
4.1.1 Bridge superstructure
Longitudinal profile
The deck design is a post-tensioned concrete box-girder, with a main span of 165 m and a totallength of 670 m (abutment to abutment). The deck is divided in 7 spans, as shown in figure4.2. Two different construction methods are used for the cast in-situ concrete box-girder. Apart of the bridge superstructure is mounted using a balanced cantilevered traveling formworksystem, totalizing 522 m divided in 4 spans. This system is made up of two mobile wagonssupporting the bridge deck formwork. The wagons are installed at the top of the column axis2, 3 and 4 (see figure 4.2) and are moved from a 5 meters maximum distance each time thein-situ cast concrete part has reached a sufficient strength (see example on figure 4.3).
Figure 4.2: Tverlandsbrua: construction methods. [7]
Thomas Dequidt 48 Master Thesis NTNU 2012

CHAPTER 4. CASE STUDY: TVERLANDSBRUA
Figure 4.3: Tverlandsbrua: cantilevered construction of span 1 (starting from part 1). [7]
The other part of the structure is built as a viaduct cast in a formwork supported by a simplescaffolding, totalizing 148 meters divided in 3 spans. As the construction of the viaduct goeson, the formwork and scaffolding system are moved from the abutment (axis 8) to the columnaxis 5, where they reach the cantilevered constructed part. A temporary underwater structureis built to support the scaffolding, as shown in figure 4.4.
Figure 4.4: Tverlandsbrua: viaduct part.
The spans of the viaduct located between axis 8-7 and 7-6 are built first. Then, a first can-tilevered part is built from both parts of axis 4 simultaneously with the last span of the viaductpart (between axis 6-5), until the cantilevered and viaduct parts meet at axis 5. Finally, thecantilevered parts from axis 2 and 3 are built one after another (see figure 4.5). Post-tensioningis then applied in both longitudinal and transverse directions.
Thomas Dequidt 49 Master Thesis NTNU 2012

CHAPTER 4. CASE STUDY: TVERLANDSBRUA
Figure 4.5: Tverlandsbrua: overall construction methodology. [7]
Figure 4.6: Tverlandsbrua: box-girder varying (upper drawing) and constant (lower drawing)heights. [7]
Thomas Dequidt 50 Master Thesis NTNU 2012

CHAPTER 4. CASE STUDY: TVERLANDSBRUA
Cross-sections
The total deck width is 23.5 m (sometimes a bit less, 23.42 m) divided in 2 double traffic lanes,9.5 m each, a walkway/bicycle lane of 4 m (railings included) and 0.5 m for the other externalrailing. The concrete box-girder of the viaduct part (from axis 5 to 8) has a constant height(2.6 m) and bottom chord width (14 m), whereas the cantilevered part (from axis 1 to 5) hasa varying height (from 2.6 to 9 m), as shown in figure 4.6.
4.1.2 Bridge substructure
Abutments and columns
The abutments, located at axis 1 and 8, are designed as cantilever abutments resting on a rocksupport foundation (no piles). These abutments are quite massive (600 m3 concrete for bothabutments) with a large stem transmitting horizontal forces to a wide footing, acting itself asa cantilever beam to prevent from instability issues due to horizontal and vertical forces (seefigure 4.7).
Figure 4.7: Tverlandsbrua: abutments, axis 1 (left) and axis 8 (right). [7]
Two types of designs are realized for the columns. The columns supporting the cantileveredconstructed part are designed as twin solid walls slightly tapered, while the columns supportingthe viaduct part act as twin simple columns on top of which rests a bridge bearing, as shownin figure 4.8.
Thomas Dequidt 51 Master Thesis NTNU 2012
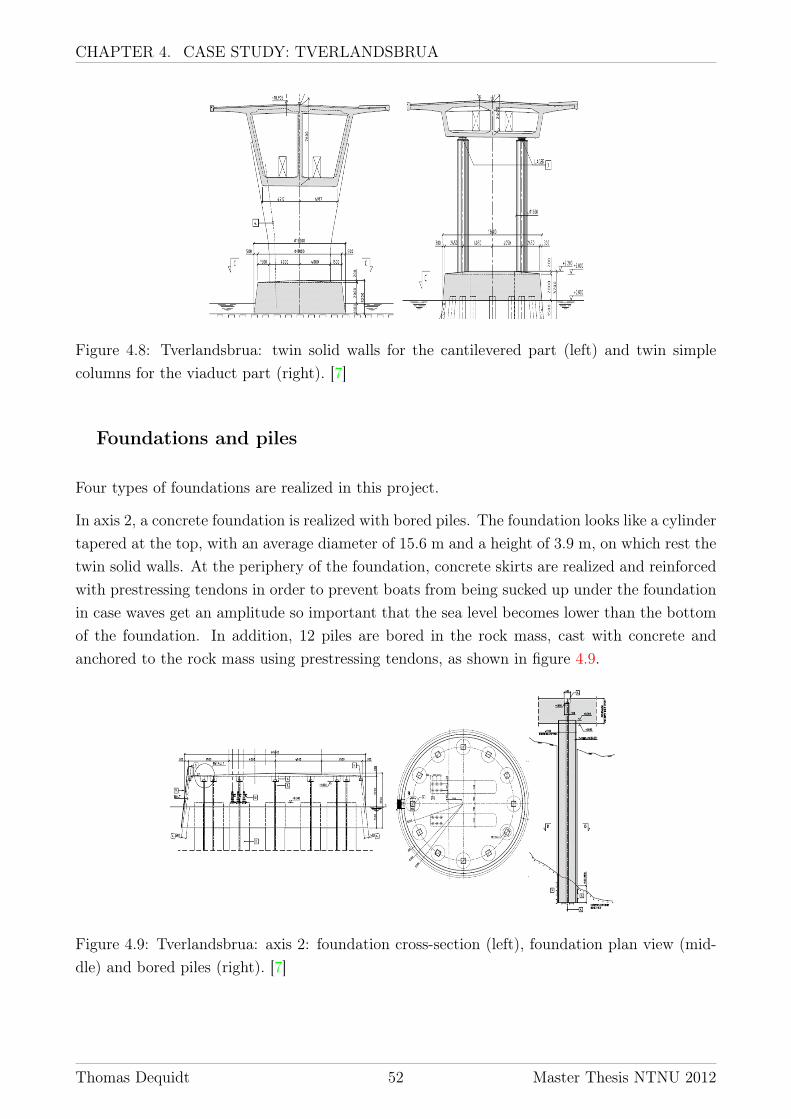
CHAPTER 4. CASE STUDY: TVERLANDSBRUA
Figure 4.8: Tverlandsbrua: twin solid walls for the cantilevered part (left) and twin simplecolumns for the viaduct part (right). [7]
Foundations and piles
Four types of foundations are realized in this project.
In axis 2, a concrete foundation is realized with bored piles. The foundation looks like a cylindertapered at the top, with an average diameter of 15.6 m and a height of 3.9 m, on which rest thetwin solid walls. At the periphery of the foundation, concrete skirts are realized and reinforcedwith prestressing tendons in order to prevent boats from being sucked up under the foundationin case waves get an amplitude so important that the sea level becomes lower than the bottomof the foundation. In addition, 12 piles are bored in the rock mass, cast with concrete andanchored to the rock mass using prestressing tendons, as shown in figure 4.9.
Figure 4.9: Tverlandsbrua: axis 2: foundation cross-section (left), foundation plan view (mid-dle) and bored piles (right). [7]
Thomas Dequidt 52 Master Thesis NTNU 2012
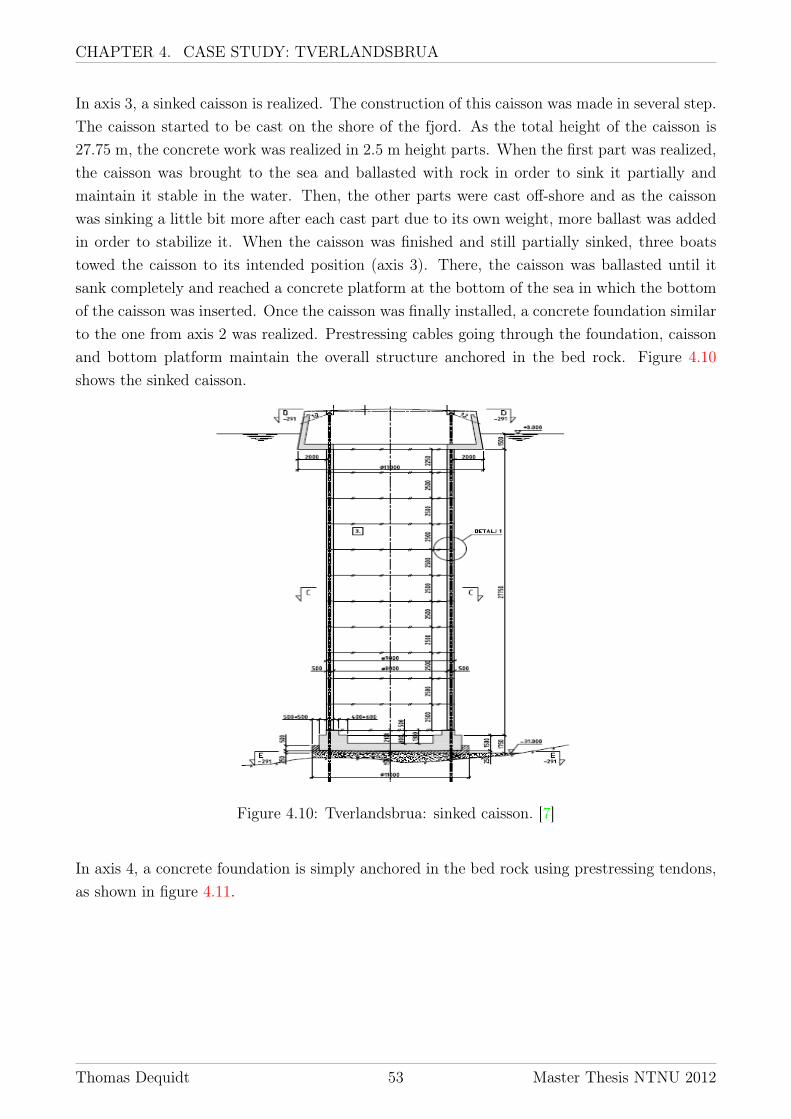
CHAPTER 4. CASE STUDY: TVERLANDSBRUA
In axis 3, a sinked caisson is realized. The construction of this caisson was made in several step.The caisson started to be cast on the shore of the fjord. As the total height of the caisson is27.75 m, the concrete work was realized in 2.5 m height parts. When the first part was realized,the caisson was brought to the sea and ballasted with rock in order to sink it partially andmaintain it stable in the water. Then, the other parts were cast off-shore and as the caissonwas sinking a little bit more after each cast part due to its own weight, more ballast was addedin order to stabilize it. When the caisson was finished and still partially sinked, three boatstowed the caisson to its intended position (axis 3). There, the caisson was ballasted until itsank completely and reached a concrete platform at the bottom of the sea in which the bottomof the caisson was inserted. Once the caisson was finally installed, a concrete foundation similarto the one from axis 2 was realized. Prestressing cables going through the foundation, caissonand bottom platform maintain the overall structure anchored in the bed rock. Figure 4.10shows the sinked caisson.
Figure 4.10: Tverlandsbrua: sinked caisson. [7]
In axis 4, a concrete foundation is simply anchored in the bed rock using prestressing tendons,as shown in figure 4.11.
Thomas Dequidt 53 Master Thesis NTNU 2012

CHAPTER 4. CASE STUDY: TVERLANDSBRUA
Figure 4.11: Tverlandsbrua: foundation axis 4. [7]
Finally, in axis 5, 6 and 7, a concrete foundation is realized with steel pipe piles. A largerfoundation, oblong-shaped, is built for those 3 axis, each supported by 14 steel pipe piles. Thesteel piles are first dig in the soil using a piling rig. The bottom of the piles are designed witha rock shoe in order to prevent the bottom from slipping on the bed rock. Once the steel pipepiles are installed, they are reinforced and filled with concrete and connected to the concretefoundations. The twin simple columns are then cast on the foundation, as shown in figure4.12.
Figure 4.12: Tverlandsbrua: axis 5: foundation cross-section (left) and foundation plan view(right). [7]
Thomas Dequidt 54 Master Thesis NTNU 2012
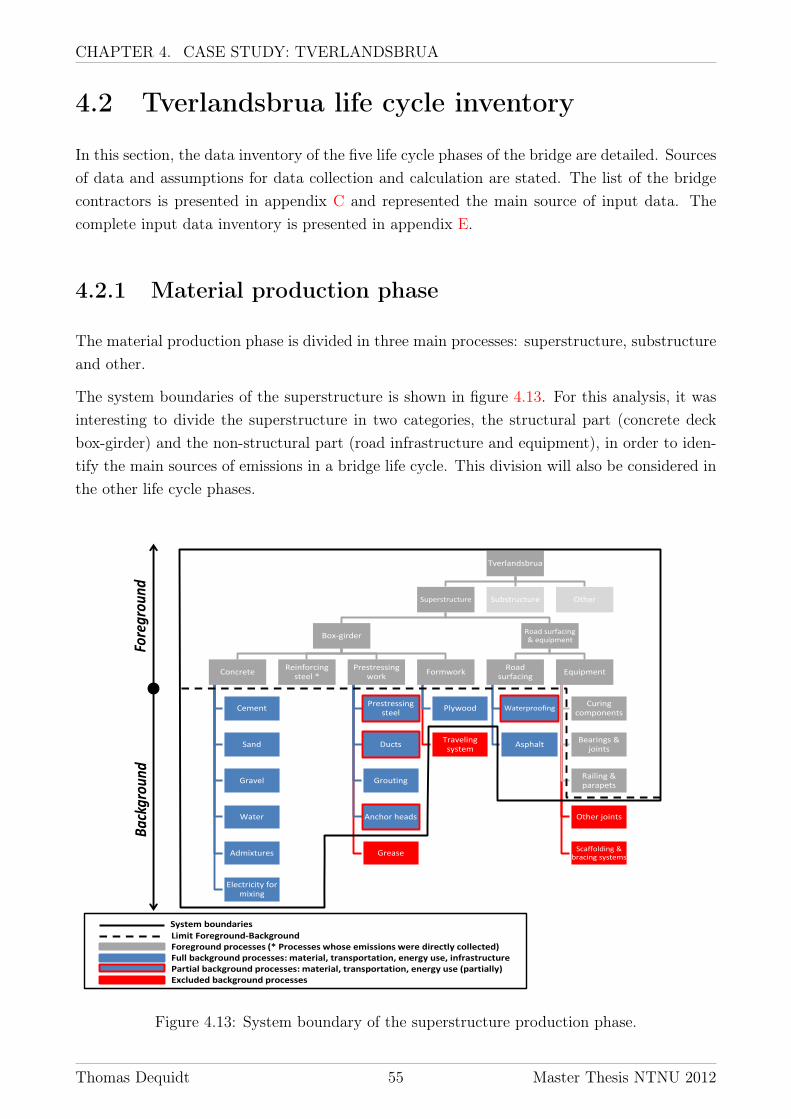
CHAPTER 4. CASE STUDY: TVERLANDSBRUA
4.2 Tverlandsbrua life cycle inventory
In this section, the data inventory of the five life cycle phases of the bridge are detailed. Sourcesof data and assumptions for data collection and calculation are stated. The list of the bridgecontractors is presented in appendix C and represented the main source of input data. Thecomplete input data inventory is presented in appendix E.
4.2.1 Material production phase
The material production phase is divided in three main processes: superstructure, substructureand other.
The system boundaries of the superstructure is shown in figure 4.13. For this analysis, it wasinteresting to divide the superstructure in two categories, the structural part (concrete deckbox-girder) and the non-structural part (road infrastructure and equipment), in order to iden-tify the main sources of emissions in a bridge life cycle. This division will also be considered inthe other life cycle phases.
Tverlandsbrua
Superstructure
Box-girder
Concrete
Cement
Sand
Gravel
Water
Admixtures
Electricity for mixing
Reinforcing steel *
Prestressing work
Prestressing steel
Ducts
Grouting
Anchor heads
Grease
Formwork
Plywood
Traveling system
Road surfacing & equipment
Road surfacing
Waterproofing
Asphalt
Equipment
Curing components
Bearings & joints
Railing & parapets
Other joints
Scaffolding & bracing systems
Substructure Other
Fore
grou
nd
Back
grou
nd
Sand
System boundaries
Limit Foreground-Background Foreground processes (* Processes whose emissions were directly collected) Full background processes: material, transportation, energy use, infrastructure Partial background processes: material, transportation, energy use (partially) Excluded background processes
Figure 4.13: System boundary of the superstructure production phase.
Thomas Dequidt 55 Master Thesis NTNU 2012
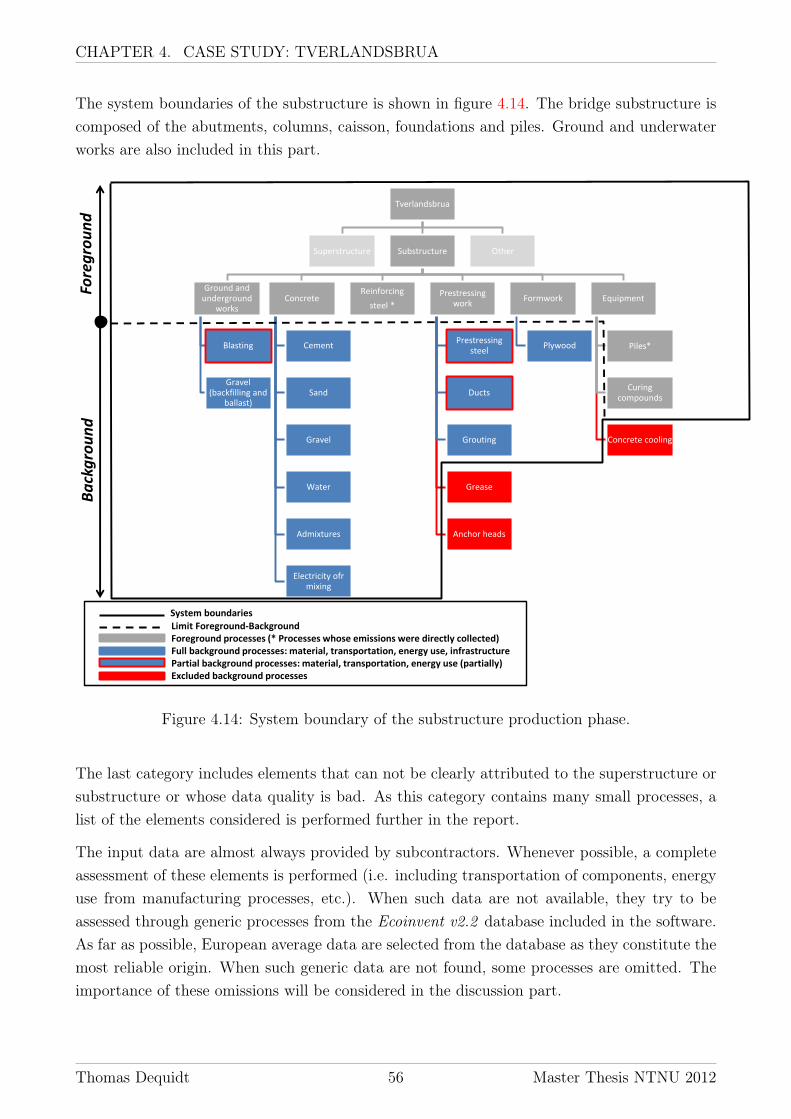
CHAPTER 4. CASE STUDY: TVERLANDSBRUA
The system boundaries of the substructure is shown in figure 4.14. The bridge substructure iscomposed of the abutments, columns, caisson, foundations and piles. Ground and underwaterworks are also included in this part.
Tverlandsbrua
Superstructure Substructure
Ground and underground
works
Blasting
Gravel (backfilling and
ballast)
Concrete
Cement
Sand
Gravel
Water
Admixtures
Electricity ofr mixing
Reinforcing
steel *
Prestressing work
Prestressing steel
Ducts
Grouting
Grease
Anchor heads
Formwork
Plywood
Equipment
Piles*
Curing compounds
Concrete cooling
Other
Fore
gro
un
d
Ba
ckg
rou
nd
System boundaries Limit Foreground-Background Foreground processes (* Processes whose emissions were directly collected) Full background processes: material, transportation, energy use, infrastructure Partial background processes: material, transportation, energy use (partially) Excluded background processes
Figure 4.14: System boundary of the substructure production phase.
The last category includes elements that can not be clearly attributed to the superstructure orsubstructure or whose data quality is bad. As this category contains many small processes, alist of the elements considered is performed further in the report.
The input data are almost always provided by subcontractors. Whenever possible, a completeassessment of these elements is performed (i.e. including transportation of components, energyuse from manufacturing processes, etc.). When such data are not available, they try to beassessed through generic processes from the Ecoinvent v2.2 database included in the software.As far as possible, European average data are selected from the database as they constitute themost reliable origin. When such generic data are not found, some processes are omitted. Theimportance of these omissions will be considered in the discussion part.
Thomas Dequidt 56 Master Thesis NTNU 2012

CHAPTER 4. CASE STUDY: TVERLANDSBRUA
Concrete
5 types of concrete are used in this project: B35 SV-30, AUV B45-SV30 (underwater concrete),B45 SV-30 (Dmax=16 mm), B55 SV-30 (Dmax=16 mm) and B55 SV-30 (Dmax=22mm).According to the concrete supplier, the B55 SV-30 concrete shares are 20% Dmax=16mm and80% Dmax=22mm. The durability class is MF40 for all concretes, except for AUV concretethat has a M40 durability class. The composition is basically the same for all concretes, onlythe amount of components change. The components are:
Cement: two types of cement are used: Norcem Industrisement and Norcem Standard FA.The former is a Portland cement CEM I 42,5 R, containing 90% clinker, 5% additionalmilling substances and 5% gypsum. The latter is a CEM II/A-V 42,5 R cement containing80% Portland cement and 20% fly ash. The cement selected from the database is taken atplant and the process includes the manufacturing processes mixing and grinding, internalprocesses (transport, etc.) and infrastructure (specific machines and plant) [25]. TheNorcem Industrisement is transported to the concrete factory by truck (about 197 km)and then by freight ship (about 28 nautic miles). The Norcem Standard FA cement istransported from Kjøpsvik by freight ship (about 96 nautic miles).
Fly ash is contained in the CEM II/A-V 42,5 R cement (Norcem Standard FA). It is mainlycomposed of silicon dioxide (SiO2), aluminium oxide (Al2O3) and iron oxide (Fe2O3).However, as fly ash is a by-product of the coal-fired power plants, it is considered aswaste without burdens. The fly ash transportation is included in the transportation ofthe Norcem Standard FA cement.
Silica fume , or microsilica, is another cement admixture. It is mainly composed of silicondioxide (SiO2). The product used in this case is Fesil Microsilica. However, as silicafume is a by-product of the production of elemental silicon or ferro silicon alloys, it isconsidered as waste without burdens. The silica fume is transported by truck from Mo IRana (237 km).
Sand constitutes the filler part of the concrete that has a diameter range of 0-8 mm. The sandselected from the database is taken at mine. The sand is transported by freight ship fromGlømmen (220 nm) and Vika (78 nm).
Gravel constitutes the filler part of the concrete that has a diameter range of 8-22 mm. Thegravel selected from the database is taken at mine. The gravel is transported by freightship from Tomma (78 nm).
Cold water is used for mixing concrete. The water selected from the database is cold tapwater. No transportation is considered for water as it is directly taken at the concretefactory.
Superplasticizing admixture are used to have a better concrete workability. The admix-ture used in this case is Dynamon SX-N. Superplasticizers are mainly based on acrylic
Thomas Dequidt 57 Master Thesis NTNU 2012

CHAPTER 4. CASE STUDY: TVERLANDSBRUA
polymers. Acrylic filler is selected from the database. The superplasticizing admixturesare transported by truck on a distance of 1100 km.
Air-entraining admixture are used for concrete frost protection by producing smaller andmore evenly distributed air bubbles. The air-entraining admixture used in this case isMapeair 50. According to a document from the Cement Admixtures Association [26], oneof the synthetic air-admixture components used for air-entraining are diethanolamines.Hence, diethanolamine is selected from the database. The air-entraining admixtures aretransported by truck on a distance of 1100 km.
Set-retarding admixture are used to control the setting of concrete. They are mainly basedon sodium gluconate. The product used in this case is Mapetard R. Sodium carbonate isselected from the database. The set-retarding admixtures are transported by truck on adistance of 1100 km.
Anti-washout admixtures are used in underwater casting to prevent concrete from separat-ing in water. The product used in this case is Rescon T. Anti-washout admixtures can becellulo- or acrylo-based polymers. Carboxymethyl cellulose powder is selected from thedatabase. The anti-washout admixtures are transported by truck on a distance of 1100km.
Energy use for concrete mixing: once all the components are brought to the concrete fac-tory, they must be mixed together. The calculation of the required energy is based onaverage values from the total production of the concrete plant in 2011. An electricitymix from Norway is selected from the database. 99.1% of this electricity is generated byhydro power plants [27].
Table 4.1 shows the total amount of concrete, composition and energy required for mixingconcrete per type of concrete. The amount of concrete is obtained from the bill of quantitiesrealized by Statens Vegvesen [23], and the concrete composition is provided by the concretesupplier of the project. Concrete used for piles and ballast concrete are also included here.The total amount of concrete is 18172.7 m3. A sensitivity analysis is performed later in thisreport, comparing the different concretes used in this project with a reference concrete and alow-carbon concrete.
Thomas Dequidt 58 Master Thesis NTNU 2012

CHAPTER 4. CASE STUDY: TVERLANDSBRUA
B35 SV-30(Dmax=22 mm)
AUV B45SV-30
(Dmax=22 mm)
B45 SV-30(Dmax=22 mm)
B55 SV-30(Dmax=16 mm)
B55 SV-30(Dmax=22 mm)
Total amount(m3)
600 351 4227 2615 10379.7
Density(kg/m3)
2356 2364 2359 2408 2406
Energy use(kWh/m3)
5.089 5.089 5.089 5.089 5.089
0/8 mm(Glommen)
(%)24.54 28.65 28.71 33.86 34.48
0/8 mm(Vika) (%)
10.72 7.12 7.14 0.00 0.00
8/16 mm(Tomma) (%)
12.99 12.95 12.98 39.46 13.80
16/22 mm(Tomma) (%)
25.23 24.38 24.43 0.00 25.31
NorcemStandard FA
(%)18.02 18.33 18.37 14.19 13.99
Norcem In-dustrisement
(%)0.00 0.00 0.00 3.79 3.73
FesilMicrosilica
(%)0.75 0.76 0.77 1.45 1.43
Cold water(%)
7.54 7.31 7.32 7.01 7.02
DynamonSX-N (%)
0.11 0.13 0.13 0.19 0.19
Mapetard R(%)
0.00 0.06 0.06 0.00 0.00
Mapeair 50(%)
0.09 0.10 0.10 0.05 0.05
Rescon T (%) 0.00 0.21 0.00 0.00 0.00
Table 4.1: Total amount, energy consumption and composition of each type of concrete.
Thomas Dequidt 59 Master Thesis NTNU 2012

CHAPTER 4. CASE STUDY: TVERLANDSBRUA
Table 4.2 shows the amount of concrete per type of element and concrete. As previouslypresented in figures 4.13 and 4.14, the concrete is divided in two function categories, the bridgesuperstructure and substructure. The choice of the element subcategories is based on StatensVegvesen element codification from the bill of quantities [23].
Elementcategory
B35SV-30
(Dmax=22 mm)
AUV B45SV-30
(Dmax=22 mm)
B45SV-30
(Dmax=22 mm)
B55SV-30
(Dmax=16 mm)
B55SV-30
(Dmax=22 mm)
Total
Total (m3) 600 351 4227 2615 10379.7 18172.7Total (%) 3.30 1.93 23.26 14.39 57.12 100.00
Superstructure(m3)
- - 878 2615 10380 13873
Superstructure(%)
- - 4.83 14.39 57.12 76.34
Substructure(m3)
600 351 3349 - - 4300
Substructure(%)
3.30 1.93 18.432 - - 23.66
Bridge superstructureD31 - capitalaxis 2,3,4 (m3)
- - - 343.4 1373.6 1717
D32 -cantilevered
part axis 2,3,4(m3)
- - - 1743 6972 8715
D33 - viaductpart axis
5,6,7,8 (m3)- - - 486 1944 2430
D34 - endsection axis 1
(m3)- - - 42.6* 90.4 133
D95 - edgekites and
sidewalks (m3)- - 878 - - 878
Bridge substructureB21 - boredpiles axis 2
(m3)- 170 225.7** - - 395.7
Continue on next page
Thomas Dequidt 60 Master Thesis NTNU 2012

CHAPTER 4. CASE STUDY: TVERLANDSBRUA
Continued from previous page
Elementcategory
B35SV-30
(Dmax=22 mm)
AUV B45SV-30
(Dmax=22 mm)
B45SV-30
(Dmax=22 mm)
B55SV-30
(Dmax=16 mm)
B55SV-30
(Dmax=22 mm)
Total
B22 - steelpipe piles axis5,6,7 (m3)
- - 205 - - 205
C11 -abutments
axis 1,8 (m3)600 - - - - 600
C21 -foundationsaxis 2,4,5,6,7
(m3)
- - 1250 - - 1250
C22 - caissonaxis 3 (m3)
- 181 765*** - - 946
C31 - columnsaxis 2,3,4 (m3)
- - 811 - - 811
C32 - columnsaxis 5,6,7 (m3)
- - 92 - - 92
* Including 20 m3 of ballast concrete** Including 10 m3 for excess consumption*** Including 250 m3 of ballast concrete
Table 4.2: Amount of concrete per element category
Reinforcing steel
The B500NC reinforcing steel used in this project comes from two main manufacturers: 70%from Badische Stahlwerke GMBH in Germany and 30% from Celsa in Mo i Rana. The sharesof reinforcing steel production between both suppliers are provided by the subcontractor of thebridge but are likely to vary according the the stocks availability. SUch variations are consid-ered in an uncertainty analysis later in this report.
An environmental report from Badische Stahlwerke GMBH [28] gives the average CO2 emissionsof a ton of finished reinforcing steel (i.e. at the factory gate) in 2005, 2009 and 2010. All inputs
Thomas Dequidt 61 Master Thesis NTNU 2012

CHAPTER 4. CASE STUDY: TVERLANDSBRUA
and outputs are considered in this analysis, except for power supply. The emissions are 75,63.8 and 62.3 kgCO2 per ton of finished product, respectively, showing a trend of decreasingCO2 emissions over the years. We assume this is due to improvements in steel manufacturingprocesses, use of recycled scrap steel and decrease of energy use. Hence, we can expect evenlower emissions for the reinforcing steel that will be produced in 2011, 2012 and 2013. However,as we do not know the date of production of the steel that will be delivered at Tverlandsbruathroughout the entire construction period, we can simply assume that the steel will be at leastproduced in 2011. As the construction of the bridge started in June 2011, we can expect thatthe production of reinforcing steel delivered this year emitted less than in 2010. If we follow thetrend of 2% reduction of the CO2 emissions from 2009 to 2010 compared to 2010, the averageemissions in 2011 would be 60.8 kgCO2 per ton of finished product, which is the value selectedfor our study. However, one should bear in mind that even if those data are very accuratesince they directly come from an environmental report of the manufacturing plant, only CO2
emissions are assessed, hence other greenhouse gases are not considered.
In order to model the electricity consumption omitted in the environmental analysis, we considerthe power supply of a generic reinforcing steel production process selected from the database.This generic process uses two different steel manufacturing processes: basic oxygen furnace(BOF) and electric arc furnace (EAF). 63% of steel is produced by BOF and 37% by EAF.BOF and EAF require 2.19E-02 kWh and 4.24E-01 kWh of electricity per kg of steel, respec-tively, which makes 1.71E-01 kWh per kg of steel in average. A electricity production mixfrom Germany is then selected from the database to model electricity consumption. The mainsources of electricity production in Germany are fossil (62.2%) and nuclear (30.4%). [27]
An environmental performance declaration (EPD) is provided by Celsa [29]. A cradle-to-gateanalysis is performed, considering all energy supplies (fuel, heat and electricity), steel scrapacquisition, supply of commodities, steel works in Mo I Rana (melting, refining, casting, rolling)and core processes (transportation to the reinforcement steel factories, transportation of waste).The steel products are 100% made up of recycled steel scrap. The electricity required to make1 ton of finished product is 2681 MJ. The source of electricity for the steel works, representing90% of the overall electricity consumption, is almost only hydro power (99.8 %). The overallGWP is 340 kgCO2-eq per ton of finished product (at the factory gate).
Prestressing equipment
Prestressing operations are used for two types of work in this project.
First, prestressing tendons are used in axis 2 for the foundation and bored piles, in axis 3 forthe caisson platform and in axis 4 for the foundation. These tendons are used to anchor theconcrete elements in the bed rock.
The second part of prestressing works is located in the post-tensioned bridge deck. Both
Thomas Dequidt 62 Master Thesis NTNU 2012
CHAPTER 4. CASE STUDY: TVERLANDSBRUA
companies realizing the bed rock anchoring and the post-tensioning provided all data relatedto the material type and amount of their products, but no information about the manufacturingprocesses. The products considered for the prestressing works are:
Prestressing steel: high-strength stressing steel Y1860S7 is used in this project. As this steelis drawn during manufacturing, a wire drawing process is selected from the database,including pre-treatment of the wire rod, dry or wet drawing, heat treatment and finishing[30]. The steel selected from the database is a low-alloyed steel.
Grouting: mortar is used for grouting the ducts. Cement mortar is selected from the database.
Plastic ducts: the prestressing cables for rock anchoring are inserted into plastic ducts. Weassume a linear density of 1 kg/m. A combination of plastic raw material extraction andaverage plastic pipe extrusion is selected from the database. The latter process includesauxiliaries and energy demand [31].
Corrugated steel ducts: the strands used for deck post-tensioning are inserted into corru-gated steel ducts. Low-alloyed steel and an average steel working process are selected fromthe database, the latter including average values for the steel processing by machines aswell as the factory infrastructure and operation. Additional metal input in considered forthe loss during processing [32].
Anchors: active and passive anchor heads are used to stress the strands at their extremities.Only amount of anchors for bridge deck post-tensioning are provided. Low-alloyed steeland an average steel working process are selected from the database.
Formwork
The formwork used is this project is provided by one single subcontractor. The formworkmaterial is plywood. Due to absence of data from the subcontractors, we assume 18 mm thickplywood panels. An outdoor plywood use process in selected from the database, including theinputs to the production process and transport of those inputs [33].
Asphalt and waterproofing layers
This section covers the production of waterproofing and asphalt layers for the road lanes.Only the initial production of asphalt is considered since its maintenance is assessed in themaintenance & repair phase. All data are based on Statens Vegvesen general requirementsand own assumptions since the asphalt subcontractor has not been chosen yet. The productsare:
Waterproofing is based on two compounds: PmBE60 and Topeka 4S. This waterproofingmethod became a wide-spread method in Norway in 1990 and is currently applied and
Thomas Dequidt 63 Master Thesis NTNU 2012
CHAPTER 4. CASE STUDY: TVERLANDSBRUA
regulated by Statens Vegvesen. PmBE60 is an adhesive emulsion applied in very thinlayers (0.3 - 0.5 kg/m3) on the concrete deck surface. Topeka 4S is then applied on thePmBE60 layer, consisting in a mix of bitumen, filler and aggregates. To simplify ouranalysis, we will consider the waterproofing as a 20 mm layer composed of 30% crushedgravel, 60% sand and 10% bitumen, as was designed the initial Topeka mix [34].
Asphalt is laid in two layers: one for leveling and one for the surface course. Mastic asphalt isselected from the database. In this process are also included the laying and compacting ofthe layers with building machines, which should actually be considered in the constructionlife cycle phase [25]. A transportation distance of 100 km is considered between the asphaltsupplier and the construction site.
Curing and chemical compounds
In this section are considered the different concrete curing methods used by the contractor(plastic sheeting, insulation membranes, etc.) as well as gluing of concrete and surface impreg-nation. All data are based on partial information from the contractor and own assumptions.The different items are:
Insulation membrane is used as a first layer on the curing concrete surface. The productused in this case is Pieri Curing Clear, a solvent based liquid that is used to preventa premature evaporation of the water inside the concrete. We assume a density of 200g/m2. An organic solvent is selected from the database.
Plastic sheeting is used as a second layer on the curing concrete surface. The type of plas-tic used is not clearly identified, so EVA (ethylvinylacetate) foils are selected from thedatabase and we assume a density of 950 g/m2.
Polyethylene is used as a third and last layer on the curing concrete surface. As onlygranulate-shaped polyethylene is available from the database, a plastic film extrusionprocess is added, including auxiliaries and energy demand [31]. We assume a density of105 g/m2.
Epoxy resin is used to glue fresh concrete to cured concrete. Epoxy resin from the databaseis selected. We assume a density of 250 g/m2.
Surface impregnation has not been clearly defined yet but corresponds to painting of thecolumns. An acrylic binder is selected from the database. We assume a density of 2kg/m2.
Thomas Dequidt 64 Master Thesis NTNU 2012
CHAPTER 4. CASE STUDY: TVERLANDSBRUA
Bridge bearings and joints
This section covers the bridge bearings used at axis 1, 6, 7 and 8 as well as the steel fingerjoints used at axis 1 and 8. Data are partly provided by the subcontractor but assumptions aremade for the manufacturing processes.
Bearings transmit the loads from the deck (viaduct part) to the columns at axis 6 and 7,as well as the loads from the deck to the abutments at axis 1 and 8. They are mainlymade up of steel, cast iron and natural rubber. These components are selected from thedatabase. Average metal working process is also considered for steel and cast iron.
Finger joints are used at axis 1 and 8. Low-alloyed steel and average metal working areselected from the database.
Railings and parapets
Three types of products are used: outer steel parapets, intermediate steel parapets and pedes-trian guardrails. As the subcontractor in charge of these products has not been chosen yet,all data are based on Statens vegvesen specifications from the bill of quantities [23] and hand-made calculations of steel volumes. As the calculation of steel volume is highly uncertain, anuncertainty analysis is performed later in this report.
Outer steel parapets are used on the external edges of the road lanes. The model Sicuro H2is used in this analysis. Low-alloyed steel and average metal working are selected fromthe database.
Intermediate steel parapets are used between the two traffic lanes. The model Monoline isused in this analysis. Low-alloyed steel and average metal working are selected from thedatabase.
Pedestrian guardrails are used on the external edge of the pedestrian lane. The modelSicuro is used in this analysis. Low-alloyed steel and average metal working are selectedfrom the database.
Piles
Bored and steel pipe piles are considered in this section. Only the steel production and workprocessing are assessed since concrete and reinforcing steel are considered in the previous sec-tions. Data are partly provided by the subcontractors and own assumptions are made formanufacturing processes of the bored piles casings.
Bored piles: steel casings are used as formwork for the concrete bored piles. Low-alloyed steeland average metal working are selected from the database.
Thomas Dequidt 65 Master Thesis NTNU 2012
CHAPTER 4. CASE STUDY: TVERLANDSBRUA
Steel pipe piles: an environmental report from the manufacturer of the steel pipe piles isused to assess the CO2, CH4 and N2O emissions from the steel piles production. Thisstudy is a cradle-to-gate life cycle assessment, which means that all processes are takeninto account from the raw material acquisition to the finished product, and it includesend-of-life recycling rate of 90% for steel [35]. The emissions for 1 ton of finished productare 1.07 tCO2, 0.8 kgCH4 and 6 gN2O. Other greenhouse gases are not considered butthey represent a negligible share of the overall global warming.
Ground and underwater works
This section includes explosives used for rock blasting and gravel. Data are mainly based onown assumptions.
Explosives : a mix of TNT and slurry is used by the subcontractors for blasting. Normally,TNT should be modeled for blasting below water, at it is the only suitable underwa-ter blasting technology. However, only Tovex (partly modeled as a slurry explosive) isavailable and then selected from the database. Raw material provision, mixing process,packaging, internal processes (transport, etc.) and infrastructure are included [25]. Ac-cording to the subcontractors, 70 kg of explosive is required for blasting 360 m3 of rock.
Gravel : crushed gravel is used for backfilling against the abutments and ballast in the caisson.Crushed gravel is selected from the database.
Other products
This section covers all products that could not be clearly attributed to the bridge superstructureor substructure, or whose data quality was too low to be relevant if allocated to one of thepreviously listed categories. The amount of material is either taken from the bill of quantitiesor roughly assumed. The quality of data is said medium when the product can be assessedusing accurate generic data from the database and poor when assumptions have to be madefor input quantifications and selection of data from the database. The elements consideredare:
Extra cement: supplementary cement is ordered by the main contractor in order to have apermanent amount of cement available at site. Portland cement 42.5 is selected from thedatabase. Quality of data: medium.
Electrical cables: the necessary amount of cables for power supply is considered here. 12590m are stated in the bill of quantities. All other electrical devices (Cadweld bolts, switchingboxes, etc.) are not considered. Three-conductor cables are selected from the database.Quality of data: medium.
Thomas Dequidt 66 Master Thesis NTNU 2012

CHAPTER 4. CASE STUDY: TVERLANDSBRUA
Lamp posts: devices used for public lighting. 30 units are ordered. We assume 50 kg of steelper unit. Low-alloyed steel and average steel working are selected from the database.Quality of data: poor.
Hollow rock shoes: devices mounted at the bottom of the steel pipe piles to prevent the pilesfrom slipping against the bed rock. 64 units are ordered. We assume 2000 kg of steel perunit. Low-alloyed steel and average steel working are selected from the database. Qualityof data: poor.
Grouting for bored piles: grouting is used between the rock and the steel casings for boredpiles. We assume 60 kg of grouting for the 12 piles. Cement mortar is selected from thedatabase. Quality of data: poor.
Corrosion protection for anchoring: includes corrosion protection of anchoring cables infoundations and piles. 26 m2 of powder coating are stated in the bill of quantities. Powdercoating is selected from the database. Quality of data: poor.
Supplementary formwork: includes supplementary formwork for recesses, edge beams andall architectural details of the bridge. The bill of quantities states 8073 m2 of extraformwork for the entire bridge. We assume a thickness of 18 mm. Outdoor plywood isselected from the database. Quality of data: poor.
Fixed splicing connections: this type of connections is used for splicing the prestressingcables in the deck. 30 units are ordered. We assume 10 kg of steel per unit. Low-alloyedsteel and average steel working are selected from the database. Quality of data: poor.
Skirts: devices used to prevent boats from being sucked up below the column foundations.270 tons of concrete are stated in the bill of quantities for all skirts. Normal concrete isselected from the database. 8 tons of reinforcing steel are assumed here. Quality of data:poor.
Water runoff systems: pipes are used for water runoff on the bridge deck. 1340 m of plasticpipes are stated in the bill of quantities. PVC and plastic pipe extrusion process areselected from the database. Quality of data: poor.
Additional equipment for inspection: 2 stairs, 2 doors and 2 ladders are mounted for in-specting the foundation at axis 2 and the caisson at axis 3. 6000 kg of steel and 50 m2 ofstainless steel coating are assumed. Low-alloyed steel, average steel working and stainlesssteel coating are selected from the database. Quality of data: poor.
Excluded elements
All products from the bill of quantity not listed previously are considered here. These ele-ments are not assessed in this analysis because no data are available. The elements consideredare:
Thomas Dequidt 67 Master Thesis NTNU 2012

CHAPTER 4. CASE STUDY: TVERLANDSBRUA
Grease: this is used to facilitate the insertion of the different prestressing components. How-ever, as no information is given about grease type and amount, this is not included in theanalysis.
Supplementary wood: wooden planks are used for security installation and other on-siteuses. No information is provided about the amount and type of wood.
Barracks: different features for the personnel are used on the site, such as sleeping accomoda-tions, offices, kitchens, bathrooms and meeting rooms. No information is provided aboutthe production of these features.
Traveling formwork system, scaffolding, temporary bracings and covers: the produc-tion of these elements is not considered as the related products are likely to be reusedin other projects. Furthermore, no data are available to make allocation procedures forassessing the wearing down of the elements in this project.
Cooling of concrete: a cooling system is to be used for the concrete in foundations at axis2, 4, 5, 6 and 7. However, no data are available yet on the type of cooling process(cooling pipes, cooling compound, etc.). The production of this cooling system is thennot considered.
4.2.2 Construction phase
The emissions due to the construction phase of the bridge are listed in three categories: trans-portation to the site, emissions from construction on the site and waste management.
The system boundaries of the construction phase is shown in figure 4.15.
The transportation to the site is divided in three types of transported unit: material, equipmentand personnel. This division is due to very different assumptions made for the transporta-tion assessment of each category (single or round-trip considered, type of transportation unit,etc.).
Emissions from construction on the site are due to three main sources (electricity, diesel andgasoline) and two secondary sources.
Waste management includes transportation of materials to recycling plant except for mixedwaste that is transported to a landfilling area.
Finally, the category Others regroups transportation of the elements classified in the productionphase category Others and construction-related processes that could not be clearly attributedto the bridge superstructure or substructure or to their related subcategories.
Thomas Dequidt 68 Master Thesis NTNU 2012

CHAPTER 4. CASE STUDY: TVERLANDSBRUA
Tverlandsbrua
Transportation to the site
Transportation of material
Transoceanic freight ship
(TFS)
Lorry > 16t, fleet average
Electric freight train
Transportation of equipment
Transoceanic freight ship
(TFS)
Lorry > 16t, fleet average
Transportation of personnel
Plane
Energy consumption on
the site
Electricity
Diesel
Gasoline
Secondary sources
Omissions
Waste management
Wood
Steel
Other
Transport of clean cardboard
Transport of mixed waste
Transport of other materials
Fore
gro
un
d
Ba
ckg
rou
nd
System boundaries Limit Foreground-Background Foreground processes Full background processes: material, transportation, energy use, infrastructure Partial background processes: material, transportation, energy use (partially) Excluded background processes
Figure 4.15: System boundary of the construction phase.
Transportation to the site
Transportation is included in the construction life cycle phase since means of transportationand traveling distances mainly depend on the location of the project, and not on the productionof the transported materials. Almost all data are provided by the subcontractors. When somedata are not available, assumptions are made. Transportation of material and equipment to thesite is mainly performed using two means of transportation: transoceanic freight ship and lorry.A part of the prestressing equipment for the bridge deck is transported by train. Transportationof personnel is only performed by plane. Each type of transported unit, i.e. material, equipmentand personnel, is assessed independently.
Transportation of material. Table 4.3 shows the mean of transportation, route, distance,amount of material transported and amount of kilometre-ton (i.e. the transportation ofone metric ton over one kilometre) of each product category. The processes selected fromthe database are: Transoceanic freight ship (TFS), including operation and maintenanceof the ship as well as construction and maintenance of port facilities; Lorry > 16t, fleet
Thomas Dequidt 69 Master Thesis NTNU 2012
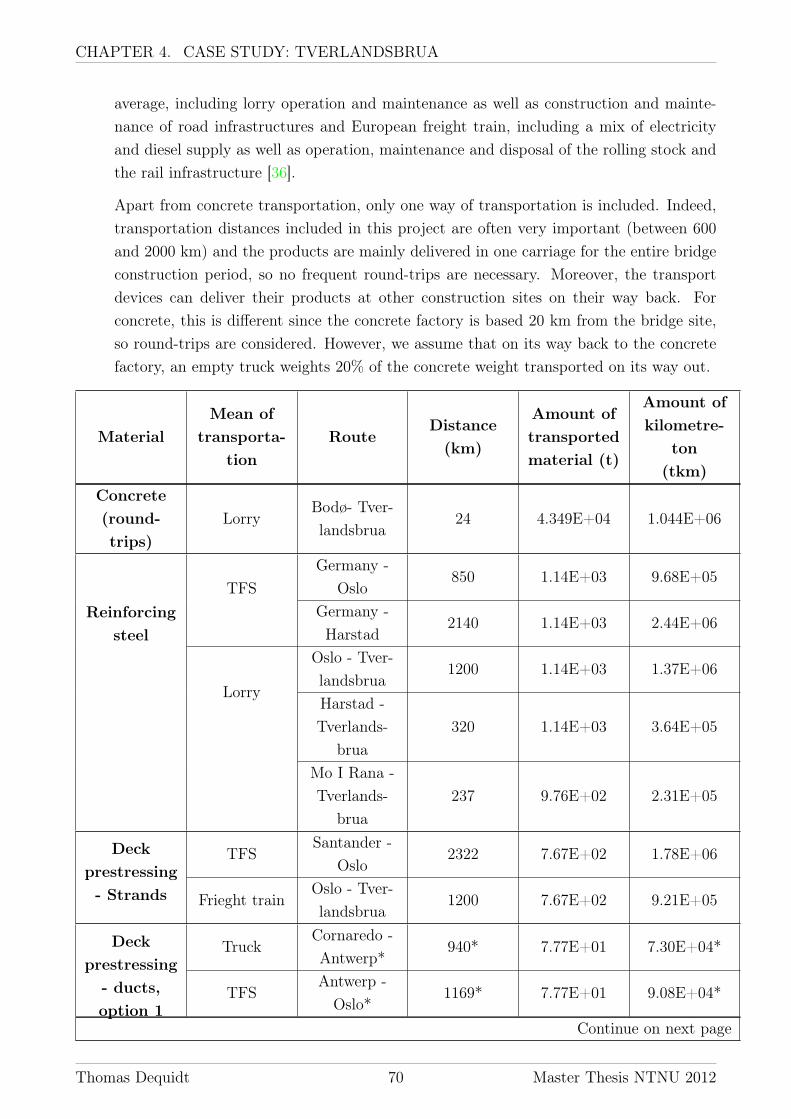
CHAPTER 4. CASE STUDY: TVERLANDSBRUA
average, including lorry operation and maintenance as well as construction and mainte-nance of road infrastructures and European freight train, including a mix of electricityand diesel supply as well as operation, maintenance and disposal of the rolling stock andthe rail infrastructure [36].
Apart from concrete transportation, only one way of transportation is included. Indeed,transportation distances included in this project are often very important (between 600and 2000 km) and the products are mainly delivered in one carriage for the entire bridgeconstruction period, so no frequent round-trips are necessary. Moreover, the transportdevices can deliver their products at other construction sites on their way back. Forconcrete, this is different since the concrete factory is based 20 km from the bridge site,so round-trips are considered. However, we assume that on its way back to the concretefactory, an empty truck weights 20% of the concrete weight transported on its way out.
MaterialMean of
transporta-tion
RouteDistance(km)
Amount oftransportedmaterial (t)
Amount ofkilometre-
ton(tkm)
Concrete(round-trips)
LorryBodø- Tver-landsbrua
24 4.349E+04 1.044E+06
Reinforcingsteel
TFSGermany -
Oslo850 1.14E+03 9.68E+05
Germany -Harstad
2140 1.14E+03 2.44E+06
Lorry
Oslo - Tver-landsbrua
1200 1.14E+03 1.37E+06
Harstad -Tverlands-
brua320 1.14E+03 3.64E+05
Mo I Rana -Tverlands-
brua237 9.76E+02 2.31E+05
Deckprestressing- Strands
TFSSantander -
Oslo2322 7.67E+02 1.78E+06
Frieght trainOslo - Tver-landsbrua
1200 7.67E+02 9.21E+05
Deckprestressing- ducts,option 1
TruckCornaredo -Antwerp*
940* 7.77E+01 7.30E+04*
TFSAntwerp -Oslo*
1169* 7.77E+01 9.08E+04*
Continue on next page
Thomas Dequidt 70 Master Thesis NTNU 2012

CHAPTER 4. CASE STUDY: TVERLANDSBRUA
Continued from previous page
MaterialMean of
transporta-tion
RouteDistance(km)
Amount oftransportedmaterial (t)
Amount ofkilometre-
ton(tkm)
Deckprestressing- ducts,option 1
TrainOslo - Tver-landsbrua*
1200* 7.77E+01 9.32E+04*
Deckprestressing- ducts,option 2
TFSBarcelone -
Oslo4437 7.77E+01 3.45E+05
TrainOslo - Tver-landsbrua
1200 7.77E+01 9.32E+04
Deckprestressing- anchors
TFSBarcelone -
Oslo4437 4.20E+01 1.87E+05
TrainOslo - Tver-landsbrua
1200 4.20E+01 5.04E+04
Deckprestressing- grouting
Truck*Bodø- Tver-landsbrua*
20* 3.50E+02 7.00E+03*
Rockanchoring -tendons
LorryLinkping -Stavanger
1000 1.64E+01 1.64E+04
Rockanchoring -
plasticducts
LorryNordsj -Stavanger
1400 9.56E-01* 1.34E+03*
Rockanchoring -
greaseLorry
Duisburg -Stavanger
1200 5.00E-01* 6.00E+02*
Rockanchoring -anchorheads
LorrySubingen -Stavanger
1700 1.00E+00* 1.70E+03*
Rockanchoring -assembledcables
LorryStavanger -
Bodø1500 1.88E+01* 2.83E+04*
Continue on next page
Thomas Dequidt 71 Master Thesis NTNU 2012
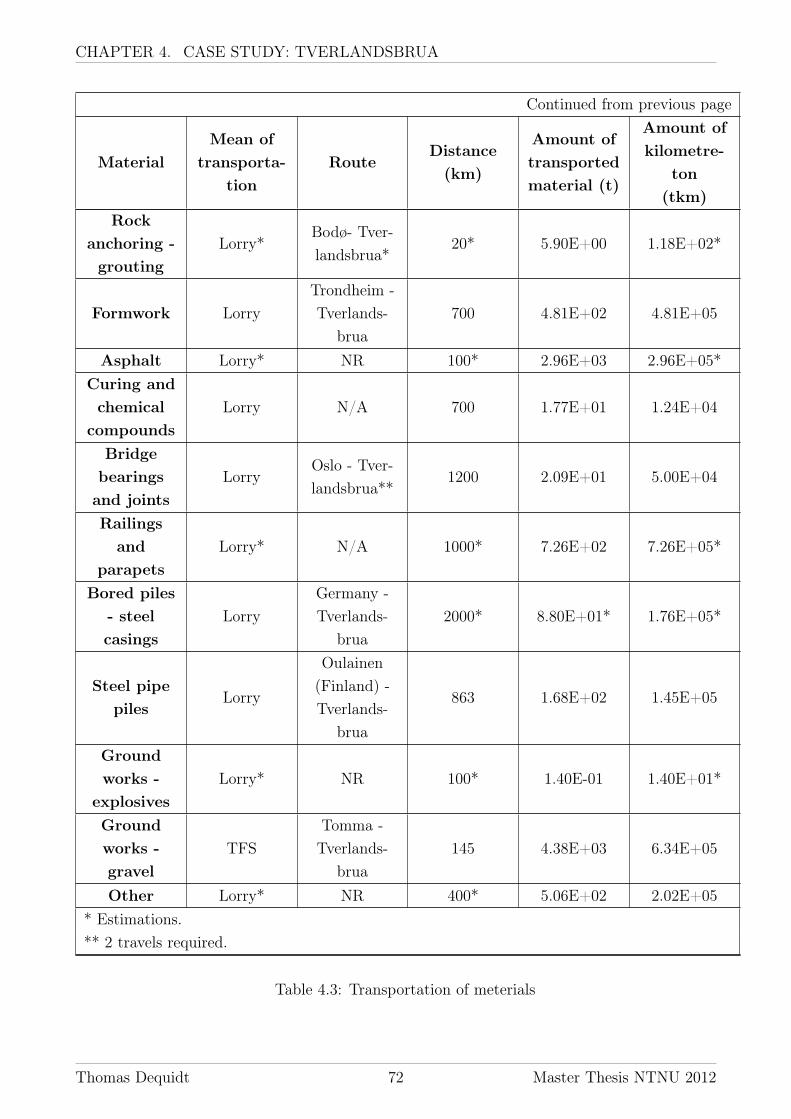
CHAPTER 4. CASE STUDY: TVERLANDSBRUA
Continued from previous page
MaterialMean of
transporta-tion
RouteDistance(km)
Amount oftransportedmaterial (t)
Amount ofkilometre-
ton(tkm)
Rockanchoring -grouting
Lorry*Bodø- Tver-landsbrua*
20* 5.90E+00 1.18E+02*
Formwork LorryTrondheim -Tverlands-
brua700 4.81E+02 4.81E+05
Asphalt Lorry* NR 100* 2.96E+03 2.96E+05*Curing andchemical
compoundsLorry N/A 700 1.77E+01 1.24E+04
Bridgebearingsand joints
LorryOslo - Tver-landsbrua**
1200 2.09E+01 5.00E+04
Railingsand
parapetsLorry* N/A 1000* 7.26E+02 7.26E+05*
Bored piles- steelcasings
LorryGermany -Tverlands-
brua2000* 8.80E+01* 1.76E+05*
Steel pipepiles
Lorry
Oulainen(Finland) -Tverlands-
brua
863 1.68E+02 1.45E+05
Groundworks -
explosivesLorry* NR 100* 1.40E-01 1.40E+01*
Groundworks -gravel
TFSTomma -Tverlands-
brua145 4.38E+03 6.34E+05
Other Lorry* NR 400* 5.06E+02 2.02E+05* Estimations.** 2 travels required.
Table 4.3: Transportation of meterials
Thomas Dequidt 72 Master Thesis NTNU 2012

CHAPTER 4. CASE STUDY: TVERLANDSBRUA
Transportation of equipment. In this section are considered all machinery equipments andtemporary products of the bridge construction phase (scaffolding, etc.). All transportationdistances are hence counted twice since the rented material or equipment will be sent backat the end of the construction phase.
Table 4.4 shows the mean of transportation, route, distance, amount of equipment trans-ported and amount of kilometre-ton per equipment category. TFS and lorry > 16t,average fleet are still selected from the database. Even if some machinery equipment aredirectly driven to the site (drilling rig, piling rig), lorries are the only means of transporta-tion available in the database to model transportation of heavy machines. Transportationof machinery equipment for ground work (excavator, loader and driller) is not includedsince the subcontractor headquarters are based less than 1 km from Tverlandsbrua.
EquipmentMean of
transporta-tion
RouteDistanceone way(km)
Amount oftransportedequipment
(t)
Amount ofkilometre-
ton(tkm)
Scaffolding Lorry NR 1400 7.50E+02* 2.10E+06*
Bored piles- drilling rig
LorryGermany -Tverlands-
brua2000* 1.75E+02* 7.00E+05*
Steel pipepiles -
piling rigLorry
Gteborg -Tverlands-
brua1475 9.50E+01 2.80E+05
Towercrane
TruckKjeller -
Tverlands-brua
1200 2.00E+02 4.80E+05
* Estimations.
Table 4.4: Transportation of equipment
Regarding the tower crane transportation, it is hard to allocate the burdens to specific categoriessince the crane helps handling all elements at site. An allocation based on a weight criteriais performed in table 4.5. The total burdens due to crane transportation (4.80E+05 tkm) isallocated according to the proportional weight of each component category.
Thomas Dequidt 73 Master Thesis NTNU 2012

CHAPTER 4. CASE STUDY: TVERLANDSBRUA
Elementcategory
Weight(tons)
Weight (%)Superstructure- structural
Superstructure- non-
structural
Substructure- structural
Total 5.02E+04 100.00 75.85 1.51 21.67Concrete 4.35E+04 86.58 66.38 0 20.19
Reinforcingsteel
3.25E+03 6.48 5.18 0 1.30
Prestressing 9.88E+02 1.97 1.92 0 0.05Scaffolding 7.50E+02 1.49 1.49 0 0Railings 7.26E+02 1.45 0 1.45 0Formwork 4.81E+02 0.96 0.83 0 0.13Bearings 2.09E+01 0.04 0 0.04 0Curing 1.77E+01 0.04 0 0.03 0.01Other 5.06E+02 1.01 - - -
Table 4.5: Weight analysis for electricity supply allocation
Transportation of personnel. In this section are included the transportation of personnelduring the construction phase of the bridge. This personnel includes all members of theconstruction site team (workmen, drivers, site managers, etc.), representing 20 persons intotal. The personnel works on site 6 weeks in a row and rests for 3 weeks at their homeplace. Travels between home places and construction site are made by plane, with anaverage distance of 1650 km (one way). An allocation of the total transportation basedon the weight analysis showed in table 4.5 is realized.
Table 4.6 sums up information about transportation of personnel.
Item Amount UnitHired personnel 20 pTotal number of
travels (both ways)45 p
Traveling distance(one way)
1650 km
Totaltransportation
1.485E+06 pkm
Table 4.6: Transportation of personnel
Construction on the site
This section covers all processes related to energy consumption on the site. This consump-tion mainly comes from the cranes and other machinery equipments and use of petrol for boat
Thomas Dequidt 74 Master Thesis NTNU 2012

CHAPTER 4. CASE STUDY: TVERLANDSBRUA
transportation on the site (displacements between the abutments and to the column at axis 4).As this bridge is currently being constructed, having an accurate estimation of the total energyconsumption for the overall construction period is a complicated task. Moreover, allocationmethods have to be used since the amount of energy consumed can only be obtained in a bulksum (power supply invoices, total number of gas cans bought, etc.).
There are three permanent sources of energy consumption at site: electricity, diesel and gaso-line. Electricity is used for crane power supply, diesel for building machines and gasoline fordisplacements by boat. The energy is provided by the contractor during the entire construc-tion period. The average energy consumption per month (from August 2011 to April 2012) isdisplayed in table 4.7. The data are provided by the contractor and are used to calculate theenergy consumption for the overall construction period. An allocation procedure for electricity,diesel and gasoline consumption based on the weight analysis from table 4.5 is realized.
Energycategory
Source ofconsump-
tionAmount Unit
Electricity Tower Crane 15000 kWhDiesel Mobile cranes 3000 l
Gasolinetransportation
by boat800 l
Table 4.7: Average energy consumption on the site per month
Electricity : the handling by the tower crane of the following element categories are consideredfor allocation of the power supply: scaffolding, concrete, reinforcing steel, formwork,prestressing work, curing compounds, bearings and joints, railings and parapets and other.Most of these elements are handled and installed by the fixed and mobile cranes, but otherdevices can be used (e.g. strand pushing machine for threading of the strands, hydraulicpump for stressing, etc.); however the infrastructure use is not considered in this analysissince no data are available. A Norwegian production mix is selected from the databaseto model the power supply process.
Diesel : diesel burnt in building machine is considered for mobile cranes. A process modelingthe diesel burnt in building machine is selected from the database, including the machineinfrastructure, lubricating oil and fuel consumption. [25]
Gasoline : gasoline is used for displacements by boat on the site. Heavy fuel oil is selectedfrom the database.
Other temporary sources of energy consumption on the site are the use of tugboats duringthe construction of the caisson, use of boring and piling rigs for the piles and excavation of
Thomas Dequidt 75 Master Thesis NTNU 2012

CHAPTER 4. CASE STUDY: TVERLANDSBRUA
material. Those processes are considered separately since the subcontractors used their ownenergy supply. Data related to the type and amount of energy consumed are provided by thesubcontractors or based on own assumptions and are shown in table 4.8. Heavy fuel oil forthe tugboats (infrastructures not considered) and diesel burnt in machinery (infrastructuresconsidered) are selected from the database.
Energycategory
Source Amount Unit
Marine oildiesel
Tugboats forthe caissonconstruction
28700 l
Diesel Piles boring 28000 lDiesel Piling rig 30000* l
DieselExcavationabove water
3000 l
DieselExcavationbelow water
4125* l
* Estimations.
Table 4.8: Secondary sources of energy consumption during the construction phase
Finally, there are other probable sources of energy consumption during the construction period.However, as these elements are often small processes very complicated to assess, they aredeliberately omitted since their contribution to the overall impact would be insignificant. Theseelements (directly taken from the bill of quantities) are:
Barracks: comprises transportation and power supply of the barracks. No information isprovided about the consumption and assumptions would be very uncertain.
Logs: comprises recording of logs.
Supplementary site investigation: extra time used for site investigation.
Driving procedures for steel pipe piles: comprises driving and splicing (if applicable) ofsteel pipe piles.
Preparatory works for rock footing: comprises rigging and drilling for rock footing.
Chiselling/stop criteria in rock: comprises chiselling of the rock shoe into the bedrock toestablish a rock footing.
Fine scaling of blasted rock surface: comprises fine scaling of blasted rock surface, includ-ing rough scaling.
Core drilling: Comprises drilling, removal, packing, storage and if relevant dispatch of rockand concrete cores, as well as any refilling of drillholes.
Thomas Dequidt 76 Master Thesis NTNU 2012

CHAPTER 4. CASE STUDY: TVERLANDSBRUA
Dynamic control measurements (PDA measurements etc.): comprises all materials, worksand documentation related to dynamic control measurements.
Waiting time and operating time: comprises unforeseen waiting time caused by the ProjectOwner.
Cutting of steel pipe piles: comprises cutting of steel pipe piles as well as delivery andmounting of pile heads.
Location of cables and service pipes: comprises collection of information regarding cablesand service pipes in the ground.
Rigging: comprises all rigging works not considered previously.
Anchoring pipes/inspection ducts: comprises delivery and all works connected with an-choring pipes and inspection ducts fixed to the reinforcement cage of the bored piles.
Grouted bolts in rock above water: comprises installation of bolts/dowels in rock abovethe groundwater level or in a drained construction pit.
Earthing points for corrosion inspections: comprises installation of earthing point forcorrosion protection.
Screeding and trimming of concrete surface: comprises final surface treatment in termsof sealing and smoothing of the concrete surface.
Heating of adjoining structural components: comprises heating of structural compo-nents against which concrete is placed, to avoid large temperature differences betweencast sections.
Injection hose: comprises delivery and installation/embedding of injection hose with acces-sories and actual pressure injection of epoxy or polyurethane.
Connections: comprises special works with waterproofing and surface course at bridge deckside and end edges, connections with kerbing, edge beams or concrete parapets, guardrailposts, water outlets and with asphalt surface courses on abutting roads as well as layingin parapet area.
Anodes for cathodic protection: comprises delivery and installation of sacrificial anodesand anodes with impressed current for cathodic protection and connection to steel andpower supply.
Reference points: comprises delivery and installation/grouting in position of bolts for mea-suring joint movements, levelling and position determination (reading of coordinates).Comprises precise measurement of reference point immediately after establishment andreporting.
Mooring equipment (pullers, bollards): comprises delivery and installation of mooringequipment.
Thomas Dequidt 77 Master Thesis NTNU 2012
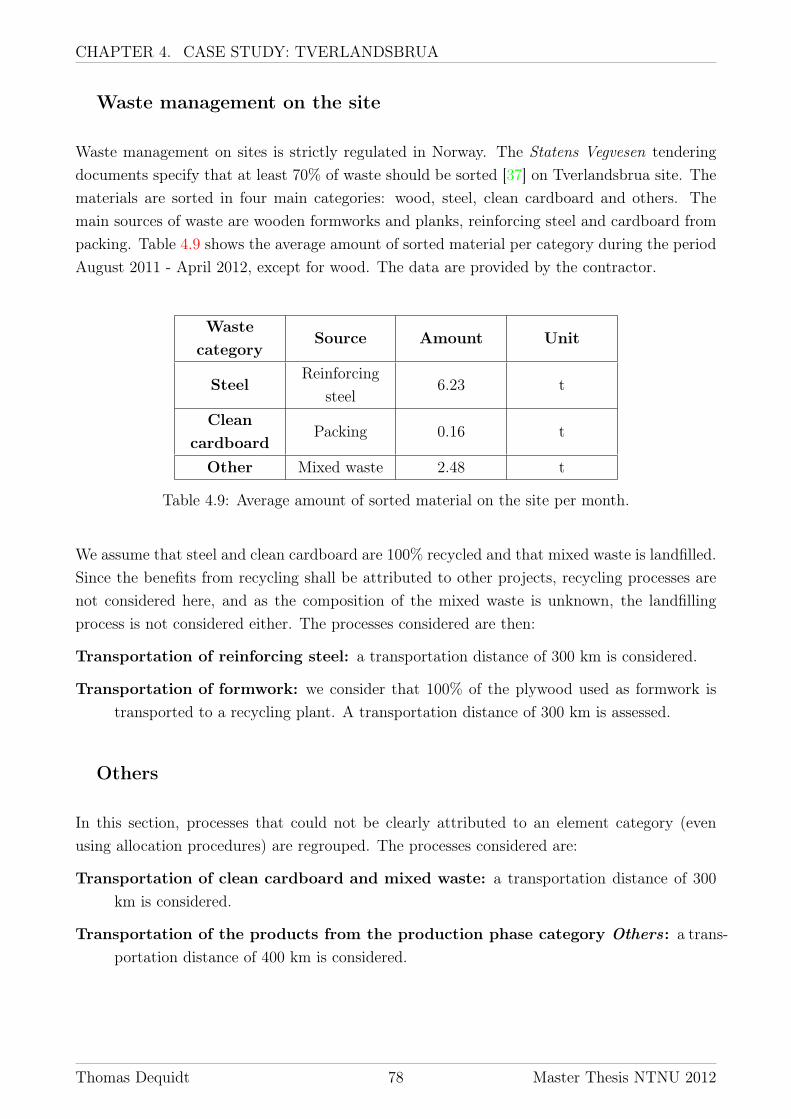
CHAPTER 4. CASE STUDY: TVERLANDSBRUA
Waste management on the site
Waste management on sites is strictly regulated in Norway. The Statens Vegvesen tenderingdocuments specify that at least 70% of waste should be sorted [37] on Tverlandsbrua site. Thematerials are sorted in four main categories: wood, steel, clean cardboard and others. Themain sources of waste are wooden formworks and planks, reinforcing steel and cardboard frompacking. Table 4.9 shows the average amount of sorted material per category during the periodAugust 2011 - April 2012, except for wood. The data are provided by the contractor.
Wastecategory
Source Amount Unit
SteelReinforcing
steel6.23 t
Cleancardboard
Packing 0.16 t
Other Mixed waste 2.48 t
Table 4.9: Average amount of sorted material on the site per month.
We assume that steel and clean cardboard are 100% recycled and that mixed waste is landfilled.Since the benefits from recycling shall be attributed to other projects, recycling processes arenot considered here, and as the composition of the mixed waste is unknown, the landfillingprocess is not considered either. The processes considered are then:
Transportation of reinforcing steel: a transportation distance of 300 km is considered.
Transportation of formwork: we consider that 100% of the plywood used as formwork istransported to a recycling plant. A transportation distance of 300 km is assessed.
Others
In this section, processes that could not be clearly attributed to an element category (evenusing allocation procedures) are regrouped. The processes considered are:
Transportation of clean cardboard and mixed waste: a transportation distance of 300km is considered.
Transportation of the products from the production phase category Others: a trans-portation distance of 400 km is considered.
Thomas Dequidt 78 Master Thesis NTNU 2012

CHAPTER 4. CASE STUDY: TVERLANDSBRUA
4.2.3 Operation phase
The operation phase considers all impacts due to the use of the bridge during its life cycle.Two main processes are considered: traffic-related emissions, including traffic growth rate andpower supply for public lighting. Power supply for internal lighting and other electrical devicesare not considered since it is very complicated to be assessed and no data are available.
Traffic related emissions. Estimation of the annual average daily traffic by Statens vegvesenat the bridge opening in 2013 and closing, estimated to be in 2113, are 8600 and 15000veh/day all lanes considered, respectively. From these data are calculated an annualgrowth traffic rate, assuming a geometric progression, and the total number of vehiclesfor the 100-year expected life cycle. The results are shown in table 4.10.
Value Unit
AADT year 0 8600 veh/day
AADT year 100 15000 veh/day
Common ratio of thegeometric expansion
q = (150008600
)1/100 = 1.00588
Annual growth traffic rate 0.558%
Cumulated AADTc = 8600 ∗ 1−1.00588100
1−1.00588=
1.15E+06veh/day
Total number of vehiclet = 1.14739E + 06 ∗ 365 =
4.19E+08veh
Table 4.10: Calculation of the total number of vehicles for the 100-year expected life cycle.
Operation processes for transportation, quantified in vehicle-kilometres (vkm), are se-lected from the database. We assume 80% of diesel cars, 10% of petrol cars and 10% oflorries > 16t, fleet average. Only vehicle operation is considered, not the vehicle infras-tructure. The wearing down of the road infrastructure is assessed in the maintenance andrepair phase.
Power supply for public lighting. Public lighting for the entire bridge life cycle is the sec-ond operation process considered. Only energy consumption from the lamp posts is as-sessed (no electrical installation or maintenance of the light bulbs considered). Two typesof mix are available in the database: production and supply mix. The production mix onlyconsiders domestic consumption (i.e. no trades with other countries), while the supply
Thomas Dequidt 79 Master Thesis NTNU 2012

CHAPTER 4. CASE STUDY: TVERLANDSBRUA
mix also considers imports and exports of energy [27]. In order to simplify our analysisand results interpretation, a Norwegian production mix is selected from the database.Data are provided by Statens vegvesen and Datek, a company providing communicationsystems for public and private services. Data are shown in table 4.11.
Item Amount UnitNumber of lamp
posts*30 p
Life time 100 yearsType of lamp* 250 WYearly averagelighting time**
4000 hrs/year
Total energyconsumption
3E+06 kWh
* Source: Statens Vegvesen.** Source: Datek.
Table 4.11: Total electricity consumption for public lighting.
4.2.4 Maintenance & repair phase
The maintenance & repair phase considered in this analysis is divided in three main processes:a simple visual inspection every year, a main inspection every 5 years (including cable andunderwater inspections) and a new asphalt course every 3 years. No important structuralmaintenance or repair interventions are considered since the bridge is supposed to be designedfor a 100-year life cycle without repair. Accidental repairs are not considered either because nodata are available.
Simple visual inspection (every year): according to the Statens Vegvesen Handbook n.136 - Inspection for bridges [22], no special equipment is required for this inspection.Hence, we just consider the transportation of the staff to the bridge site (1 vehicle, bothways), assuming a distance of 500 km.
Main inspection (every 5 years): according to the Statens Vegvesen Handbook n. 136 -Inspection for bridges [22], this inspection requires machines for inspection (lifter). Weassume that the machine is rented 200 km from the bridge site and we select a buildingmachine from the database, working for 8 hours. We also consider the transportation ofthe staff to the bridge site (1 vehicle, both ways), assuming a distance of 500 km. Table4.12 shows assumptions made for the main inspection.
Thomas Dequidt 80 Master Thesis NTNU 2012
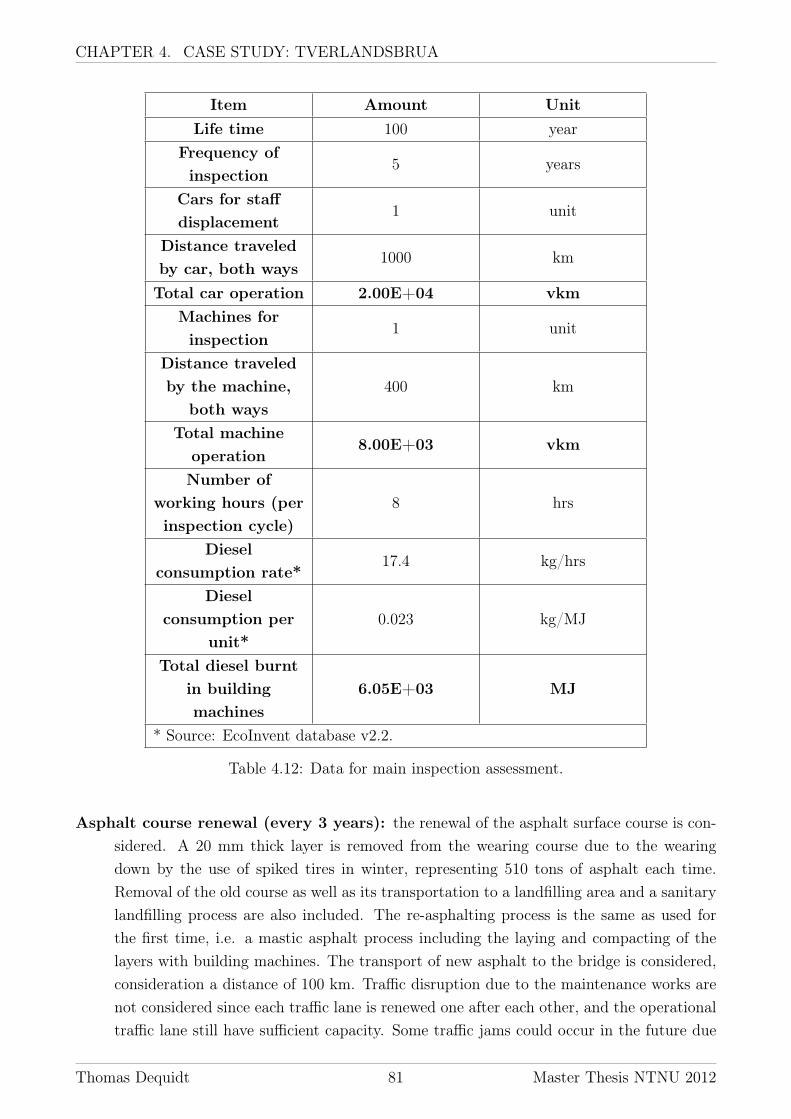
CHAPTER 4. CASE STUDY: TVERLANDSBRUA
Item Amount UnitLife time 100 year
Frequency ofinspection
5 years
Cars for staffdisplacement
1 unit
Distance traveledby car, both ways
1000 km
Total car operation 2.00E+04 vkmMachines forinspection
1 unit
Distance traveledby the machine,
both ways400 km
Total machineoperation
8.00E+03 vkm
Number ofworking hours (perinspection cycle)
8 hrs
Dieselconsumption rate*
17.4 kg/hrs
Dieselconsumption per
unit*0.023 kg/MJ
Total diesel burntin buildingmachines
6.05E+03 MJ
* Source: EcoInvent database v2.2.
Table 4.12: Data for main inspection assessment.
Asphalt course renewal (every 3 years): the renewal of the asphalt surface course is con-sidered. A 20 mm thick layer is removed from the wearing course due to the wearingdown by the use of spiked tires in winter, representing 510 tons of asphalt each time.Removal of the old course as well as its transportation to a landfilling area and a sanitarylandfilling process are also included. The re-asphalting process is the same as used forthe first time, i.e. a mastic asphalt process including the laying and compacting of thelayers with building machines. The transport of new asphalt to the bridge is considered,consideration a distance of 100 km. Traffic disruption due to the maintenance works arenot considered since each traffic lane is renewed one after each other, and the operationaltraffic lane still have sufficient capacity. Some traffic jams could occur in the future due
Thomas Dequidt 81 Master Thesis NTNU 2012

CHAPTER 4. CASE STUDY: TVERLANDSBRUA
to traffic growth rate, but this cannot be accurately quantified and then is not considered.Since the frequency of asphalt course renewal is quite high, a sensitivity analysis consid-ering lower frequencies of asphalt maintenance is performed later in this report. Table4.13 shows the main assumptions for asphalt course renewal.
Item Amount UnitLife time 100 year
Frequency ofinspection
3 years
Amount of asphaltreplaced for cycle
510 tons
Number ofworking hours
100 hrs
Dieselconsumption rate*
17.4 kg/hrs
Dieselconsumption per
unit*0.023 kg/MJ
Total diesel burntin buildingmachines for
removal of asphaltcourse
2.50E+06 MJ
Transportation ofnew asphalt to the
bridge1.68E+06 tkm
Total amount oflandfilled asphalt(transportation
included)
1.68E+07 kg
Total amount ofasphalt renewed
1.68E+07 kg
* Source: EcoInvent database v2.2.
Table 4.13: Data for asphalt course renewal.
Thomas Dequidt 82 Master Thesis NTNU 2012
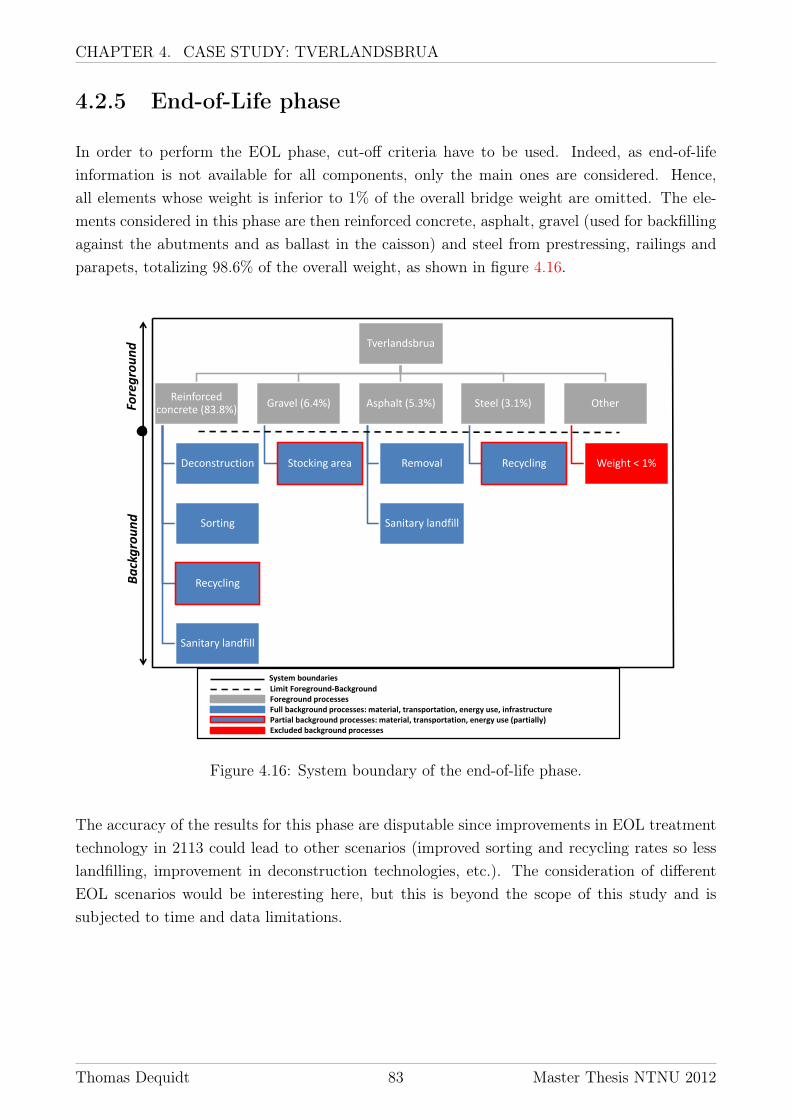
CHAPTER 4. CASE STUDY: TVERLANDSBRUA
4.2.5 End-of-Life phase
In order to perform the EOL phase, cut-off criteria have to be used. Indeed, as end-of-lifeinformation is not available for all components, only the main ones are considered. Hence,all elements whose weight is inferior to 1% of the overall bridge weight are omitted. The ele-ments considered in this phase are then reinforced concrete, asphalt, gravel (used for backfillingagainst the abutments and as ballast in the caisson) and steel from prestressing, railings andparapets, totalizing 98.6% of the overall weight, as shown in figure 4.16.
Tverlandsbrua
Reinforced concrete (83.8%)
Deconstruction
Sorting
Recycling
Sanitary landfill
Gravel (6.4%)
Stocking area
Asphalt (5.3%)
Removal
Sanitary landfill
Steel (3.1%)
Recycling
Other
Weight < 1%
Fore
gro
un
d
Ba
ckg
rou
nd
System boundaries Limit Foreground-Background Foreground processes Full background processes: material, transportation, energy use, infrastructure Partial background processes: material, transportation, energy use (partially) Excluded background processes
Figure 4.16: System boundary of the end-of-life phase.
The accuracy of the results for this phase are disputable since improvements in EOL treatmenttechnology in 2113 could lead to other scenarios (improved sorting and recycling rates so lesslandfilling, improvement in deconstruction technologies, etc.). The consideration of differentEOL scenarios would be interesting here, but this is beyond the scope of this study and issubjected to time and data limitations.
Thomas Dequidt 83 Master Thesis NTNU 2012

CHAPTER 4. CASE STUDY: TVERLANDSBRUA
Reinforced concrete i.e. concrete and reinforcing steel, represents 83.8% of the overall bridgeweight. An EOL treatment from the databse is selected, divided in three main process:deconstruction, sorting and disposal. The Ecoinvent center realized different reports forlife cycle inventories per field of study. A reinforced concrete sorting process is selectedfrom the database. The reinforced concrete is first dismantled, considering energy con-sumption and infrastructure. The infrastructure is built up considering average efficienciesof different dismantling machines (hydraulic rock chisel, concrete claws, concrete saws,etc.). The dismantled reinforced concrete is then transported to a sorting plant, whereit is separated in two disposal categories: 61.2% is to be recycled and 38.8% is to bebrought to a sanitary landfill [38]. For this latter disposal phase, transportation to asanitary landfill and landfilling are included in the database process. For the recycledpart, we consider an average distance of 100 km between the sorting and recycling plants.The recycling process is not considered for the same reasons as waste management on thesite.
Gravel used for backfilling against the abutments and as ballast in the caisson represents6.4% of the overall bridge weight. Only transportation of the gravel to a stocking area isconsidered, assuming a distance of 100 km, since gravel is an inert material that can bedirectly reused in other projects.
Asphalt & waterproofing constitute 5.3% of the overall bridge weight. The process consid-ered here is the same as for maintenance operation, i.e. the waterproofing and asphaltlayers are removed and transported to a sanitary landfill.
Steel from prestressing work, railings and parapets represent 3.1% of the overall bridge weight.The steel is assumed to be recycled and we consider a distance of 100 km to the recyclingplant. The recycling process is not considered.
Thomas Dequidt 84 Master Thesis NTNU 2012

CHAPTER 4. CASE STUDY: TVERLANDSBRUA
4.3 Results, interpretation and further analy-sis
In this section, the results from the LCIA phase are presented and interpreted; and uncertaintyand sensitivity analyses are performed. The results are given for the impact category climatechange and are presented in four different ways: overall results, results per function category,results per life-cycle phase and result per component category. The identification of the fourtypes of presntation is displayed in figure 4.17.
Production Construction Operation Maintenance End-of-life
Scaffolding X
Concrete X X X X X X
Steel X X X X
Formwork X X X X
Prestressing X X X X
Inspection X X
Ground & Underground works X X X
Piles &Caisson X X
Curing X X X X
Asphalt X X X X
Bearings&joints X X
Railings¶pets X X
Public lighting X
Traffic-related emissions X
Others X X
1:
Sup
erst
ruct
ure
- s
tru
ctu
ral
3 :
Su
bst
ruct
ure
2 :
Su
per
stru
ctu
re –
no
n-s
tru
ctu
ral
Life cycle phases Product categories Function categories Complete system Processes included (one X per life cycle phase, product category and function category)
4 : Others
X
Figure 4.17: Presentation of the four result categories.
4.3.1 Overall results
The overall global warming impact, all life cycle phases considered, is 6665 kgCO2-eq per FU(the FU is defined as 1 square meter effective bridge deck area through a lifetime of 100 years).The bridge deck area is 15711.5 m2, which makes an overall impact of 104717 tCO2-eq forthe 100-year expected lifetime of the bridge. The burdens from the operation phase represent
Thomas Dequidt 85 Master Thesis NTNU 2012

CHAPTER 4. CASE STUDY: TVERLANDSBRUA
79.6% of the overall impact, clearly overcoming the other life cycle phases. This is due to hugeimpacts from traffic-related emissions during the 100-year life cycle phase. The considerationof these emissions will be further detailed in the interpretation of the operation phase. If weomit the operation phase, the overall global warming impact is reduced to 1358 kgCO2-eq perFU.
If we compare the overall global warming impact with similar studies and without consideringthe operation phase, we find out that the results are in the same range. The average value fromthe literature review of concrete bridges was 1590 kgCO2 per FU (see table 2.1), while thisstudy scores about 1258 kgCO2 per FU. Comparisons with individual studies will be performedin the discussion part.
4.3.2 Results per function category
Four function categories are identified in this project: the structural part of the superstructure(BridgeSup1), the non-structural part of the superstructure (BridgeSup2), the substructure(BridgeSub3) and Other. If we include impacts from traffic-related emissions, BridgeSup2greatly overcome other categories. This life cycle phase is then omitted in order to show moreclearly the share of impacts between the different function categories but is obviously identifiedas a hot spot of this study. Figure 4.18 shows shares and amounts of global warming impactper function category.
0%
10%
20%
30%
40%
50%
60%
70%
80%
90%
100%
GWP
0
100
200
300
400
500
600
700
GWP (kgCO2-eq)
BridgeSup1
BridgeSup2
BridgeSub3
Other
0%
10%
20%
30%
40%
50%
60%
70%
80%
90%
100%
GWP
0
1000
2000
3000
4000
5000
6000
7000
GWP (kgCO2-eq)
BridgeSup1
BridgeSup2
BridgeSub3
Other
All life-cycle phases considered
Without including the operation phase
Figure 4.18: Global warming impact per function category.
Thomas Dequidt 86 Master Thesis NTNU 2012
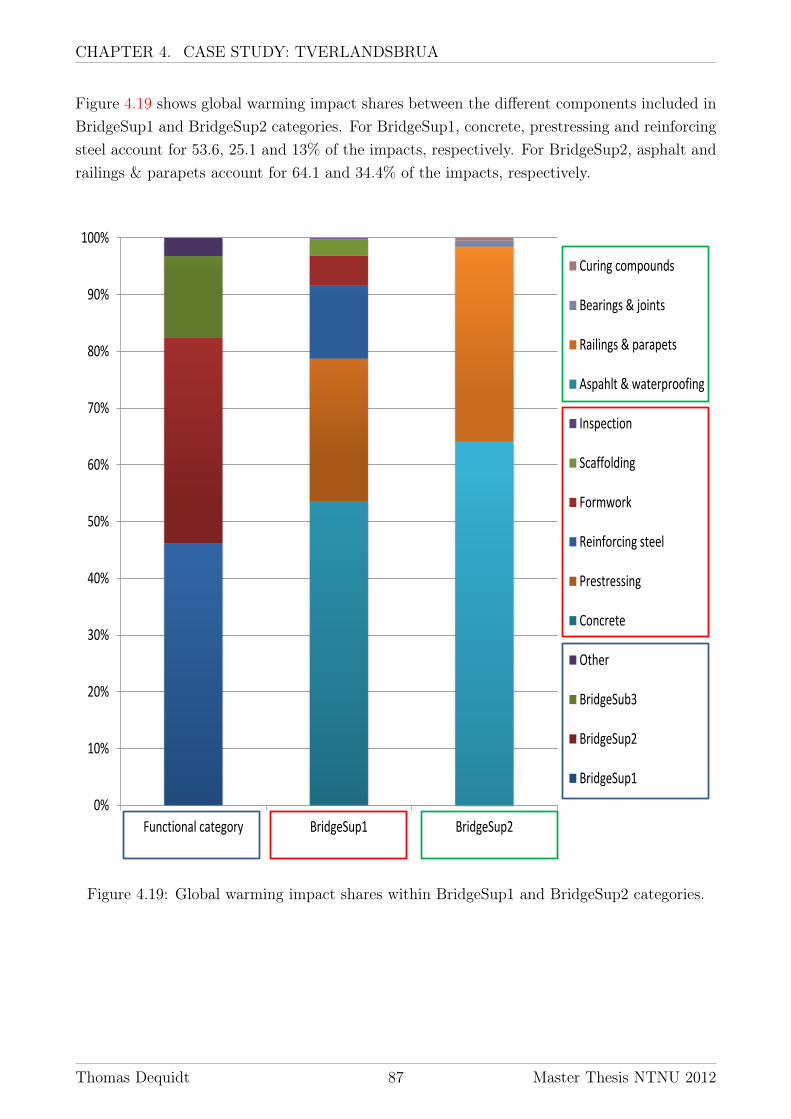
CHAPTER 4. CASE STUDY: TVERLANDSBRUA
Figure 4.19 shows global warming impact shares between the different components included inBridgeSup1 and BridgeSup2 categories. For BridgeSup1, concrete, prestressing and reinforcingsteel account for 53.6, 25.1 and 13% of the impacts, respectively. For BridgeSup2, asphalt andrailings & parapets account for 64.1 and 34.4% of the impacts, respectively.
0%
10%
20%
30%
40%
50%
60%
70%
80%
90%
100%
Functional category BridgeSup1 BridgeSup2
Curing compounds
Bearings & joints
Railings & parapets
Aspahlt & waterproofing
Inspection
Scaffolding
Formwork
Reinforcing steel
Prestressing
Concrete
Other
BridgeSub3
BridgeSup2
BridgeSup1
Figure 4.19: Global warming impact shares within BridgeSup1 and BridgeSup2 categories.
Thomas Dequidt 87 Master Thesis NTNU 2012
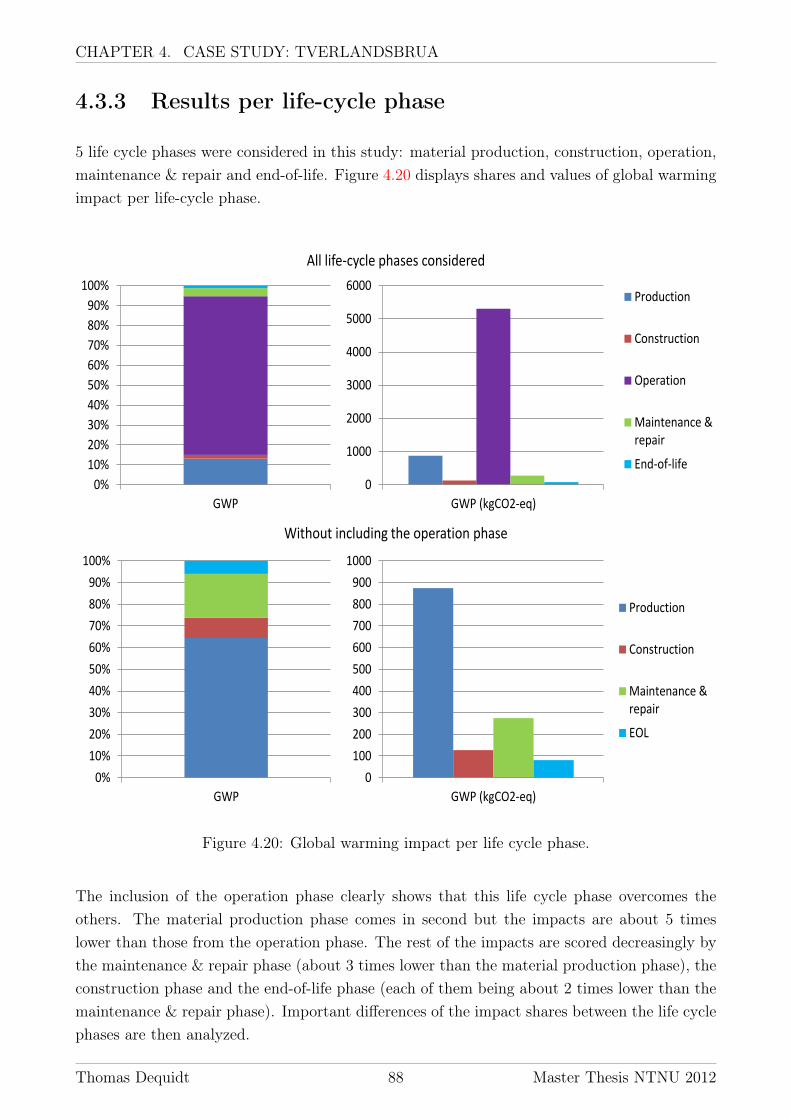
CHAPTER 4. CASE STUDY: TVERLANDSBRUA
4.3.3 Results per life-cycle phase
5 life cycle phases were considered in this study: material production, construction, operation,maintenance & repair and end-of-life. Figure 4.20 displays shares and values of global warmingimpact per life-cycle phase.
0
1000
2000
3000
4000
5000
6000
GWP (kgCO2-eq)
Production
Construction
Operation
Maintenance &repair
End-of-life
0%
10%
20%
30%
40%
50%
60%
70%
80%
90%
100%
GWP
0
100
200
300
400
500
600
700
800
900
1000
GWP (kgCO2-eq)
Production
Construction
Maintenance &repair
EOL
0%
10%
20%
30%
40%
50%
60%
70%
80%
90%
100%
GWP
All life-cycle phases considered
Without including the operation phase
Figure 4.20: Global warming impact per life cycle phase.
The inclusion of the operation phase clearly shows that this life cycle phase overcomes theothers. The material production phase comes in second but the impacts are about 5 timeslower than those from the operation phase. The rest of the impacts are scored decreasingly bythe maintenance & repair phase (about 3 times lower than the material production phase), theconstruction phase and the end-of-life phase (each of them being about 2 times lower than themaintenance & repair phase). Important differences of the impact shares between the life cyclephases are then analyzed.
Thomas Dequidt 88 Master Thesis NTNU 2012

CHAPTER 4. CASE STUDY: TVERLANDSBRUA
Material production phase
The overall impact from the material production phase is 874.7 kgCO2-eq per FU, representing64.4% of the overall impact of the bridge (operation phase excluded).
The elements accounting for the most important shares are: concrete (41.5%), railings & para-pets (18.6%) and prestressing (17.6%). These elements prevail on the others since productionof cement and steel represent huge amounts of material and their production processes leadto large emissions of greenhouse gases. Figure 4.21 shows global warming impacts from theproduction phase.
0%
10%
20%
30%
40%
50%
60%
70%
80%
90%
100%
GWP
0
50
100
150
200
250
300
350
400
GWP (kgCO2-eq)
Concrete
Reinforcing steel
Formwork
Prestressing
Asphalt &waterproofing
Railings ¶pets
Bearings & joints
Curing compounds
Ground &underwater works
Piles & caisson
Others
Figure 4.21: Global warming impacts from the production phase.
Thomas Dequidt 89 Master Thesis NTNU 2012
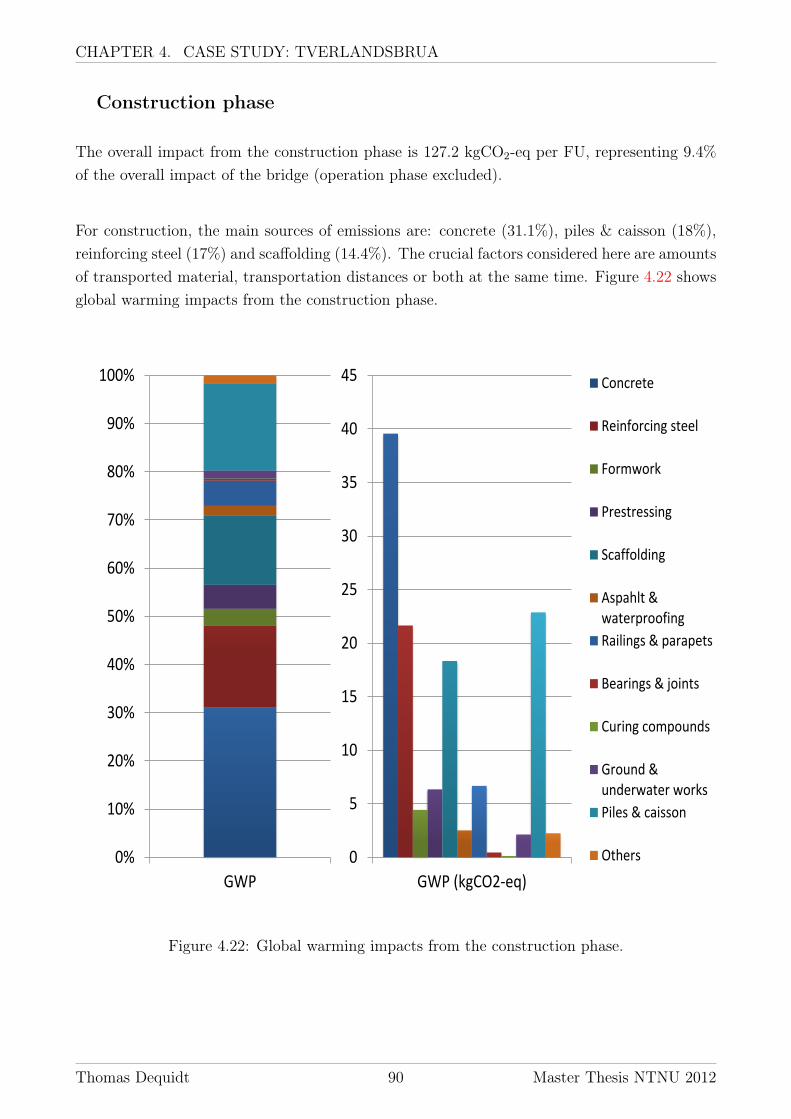
CHAPTER 4. CASE STUDY: TVERLANDSBRUA
Construction phase
The overall impact from the construction phase is 127.2 kgCO2-eq per FU, representing 9.4%of the overall impact of the bridge (operation phase excluded).
For construction, the main sources of emissions are: concrete (31.1%), piles & caisson (18%),reinforcing steel (17%) and scaffolding (14.4%). The crucial factors considered here are amountsof transported material, transportation distances or both at the same time. Figure 4.22 showsglobal warming impacts from the construction phase.
0%
10%
20%
30%
40%
50%
60%
70%
80%
90%
100%
GWP
0
5
10
15
20
25
30
35
40
45
GWP (kgCO2-eq)
Concrete
Reinforcing steel
Formwork
Prestressing
Scaffolding
Aspahlt &waterproofing
Railings & parapets
Bearings & joints
Curing compounds
Ground &underwater works
Piles & caisson
Others
Figure 4.22: Global warming impacts from the construction phase.
Thomas Dequidt 90 Master Thesis NTNU 2012
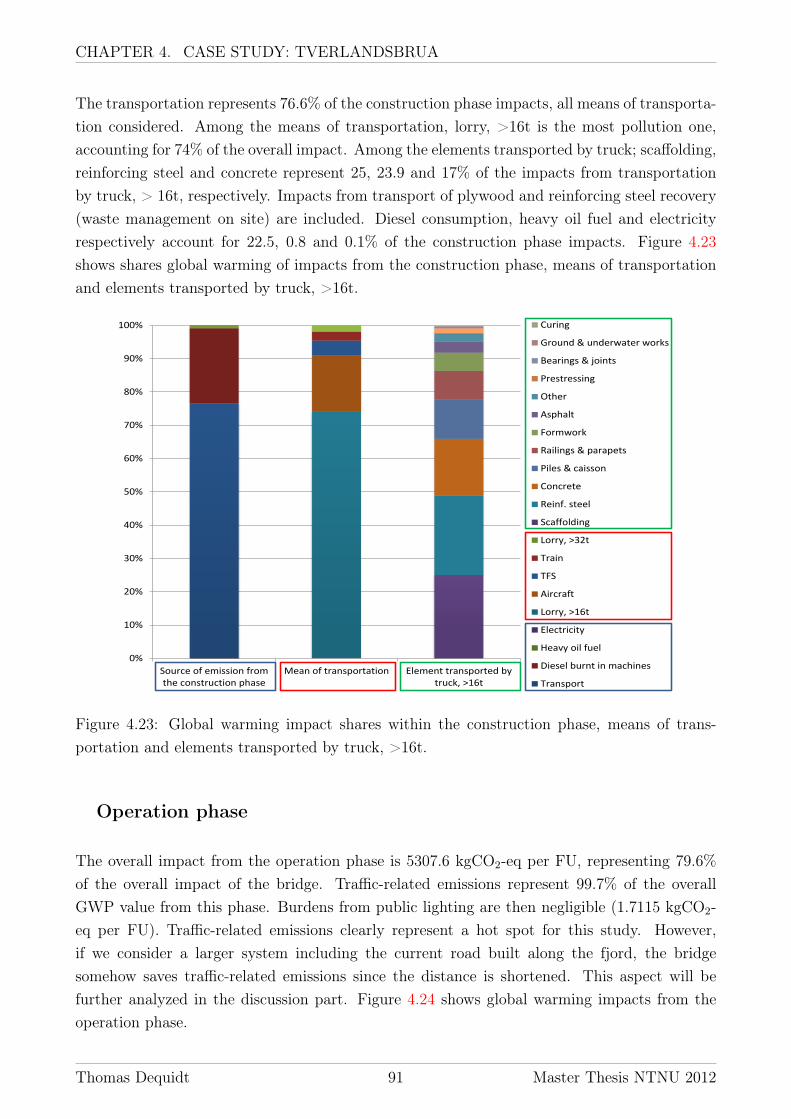
CHAPTER 4. CASE STUDY: TVERLANDSBRUA
The transportation represents 76.6% of the construction phase impacts, all means of transporta-tion considered. Among the means of transportation, lorry, >16t is the most pollution one,accounting for 74% of the overall impact. Among the elements transported by truck; scaffolding,reinforcing steel and concrete represent 25, 23.9 and 17% of the impacts from transportationby truck, > 16t, respectively. Impacts from transport of plywood and reinforcing steel recovery(waste management on site) are included. Diesel consumption, heavy oil fuel and electricityrespectively account for 22.5, 0.8 and 0.1% of the construction phase impacts. Figure 4.23shows shares global warming of impacts from the construction phase, means of transportationand elements transported by truck, >16t.
0%
10%
20%
30%
40%
50%
60%
70%
80%
90%
100%
Source of emission fromthe construction phase
Mean of transportation Element transported bytruck, >16t
Curing
Ground & underwater works
Bearings & joints
Prestressing
Other
Asphalt
Formwork
Railings & parapets
Piles & caisson
Concrete
Reinf. steel
Scaffolding
Lorry, >32t
Train
TFS
Aircraft
Lorry, >16t
Electricity
Heavy oil fuel
Diesel burnt in machines
Transport
Figure 4.23: Global warming impact shares within the construction phase, means of trans-portation and elements transported by truck, >16t.
Operation phase
The overall impact from the operation phase is 5307.6 kgCO2-eq per FU, representing 79.6%of the overall impact of the bridge. Traffic-related emissions represent 99.7% of the overallGWP value from this phase. Burdens from public lighting are then negligible (1.7115 kgCO2-eq per FU). Traffic-related emissions clearly represent a hot spot for this study. However,if we consider a larger system including the current road built along the fjord, the bridgesomehow saves traffic-related emissions since the distance is shortened. This aspect will befurther analyzed in the discussion part. Figure 4.24 shows global warming impacts from theoperation phase.
Thomas Dequidt 91 Master Thesis NTNU 2012
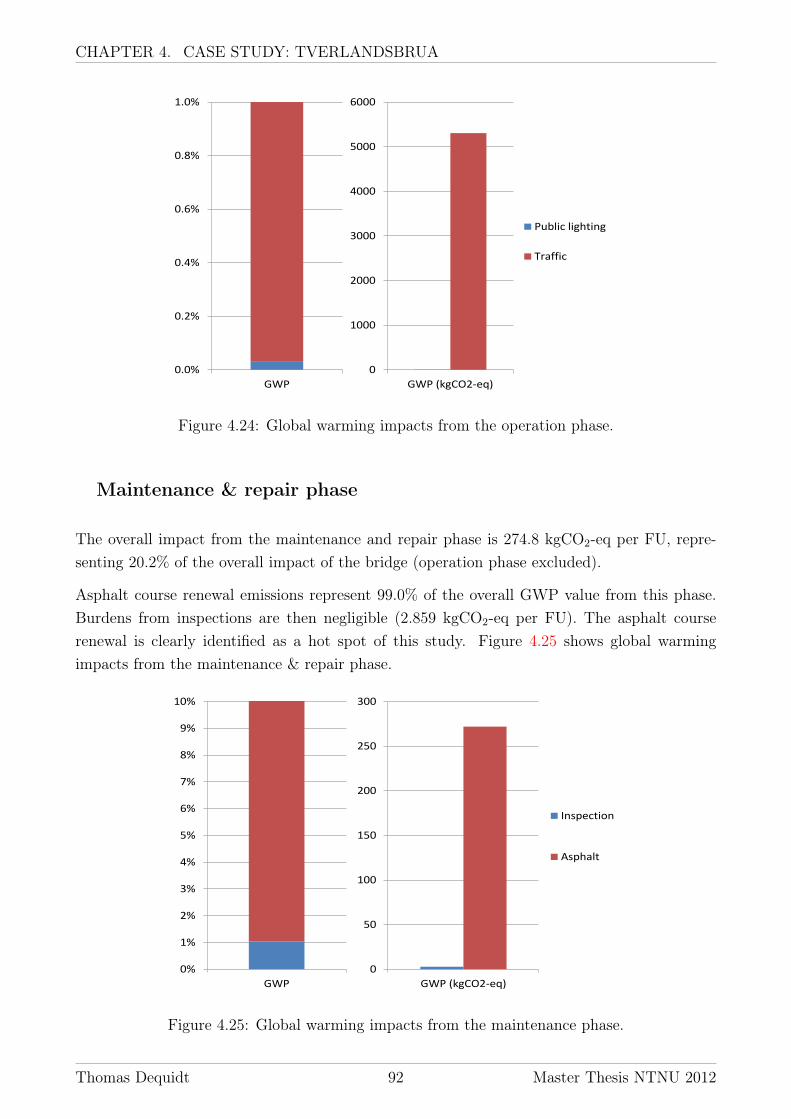
CHAPTER 4. CASE STUDY: TVERLANDSBRUA
0
1000
2000
3000
4000
5000
6000
GWP (kgCO2-eq)
Public lighting
Traffic
0.0%
0.2%
0.4%
0.6%
0.8%
1.0%
GWP
Figure 4.24: Global warming impacts from the operation phase.
Maintenance & repair phase
The overall impact from the maintenance and repair phase is 274.8 kgCO2-eq per FU, repre-senting 20.2% of the overall impact of the bridge (operation phase excluded).
Asphalt course renewal emissions represent 99.0% of the overall GWP value from this phase.Burdens from inspections are then negligible (2.859 kgCO2-eq per FU). The asphalt courserenewal is clearly identified as a hot spot of this study. Figure 4.25 shows global warmingimpacts from the maintenance & repair phase.
0
50
100
150
200
250
300
GWP (kgCO2-eq)
Inspection
Asphalt
0%
1%
2%
3%
4%
5%
6%
7%
8%
9%
10%
GWP
Figure 4.25: Global warming impacts from the maintenance phase.
Thomas Dequidt 92 Master Thesis NTNU 2012

CHAPTER 4. CASE STUDY: TVERLANDSBRUA
End-of-life phase
The overall impact from the end-of-life phase is 80.9 kgCO2-eq per FU, representing 6% of theoverall impact of the bridge (operation phase excluded).
Reinforced concrete accounts for the most important share of the overall global warming impactfrom this phase, i.e. 85.9%. The impact shares between the different processes are: dismantlingand sorting of reinforced concrete (56.7%), transportation (38.8%), asphalt disposal (4%) anddiesel burnt in machine for asphalt removal (0.5%). Figure 4.26 shows global warming impactsfrom the end-of-life phase.
0%
10%
20%
30%
40%
50%
60%
70%
80%
90%
100%
GWP
0
5
10
15
20
25
30
35
40
GWP (kgCO2-eq)
Reinf.concrete
Asphalt
Gravel
Steel
Figure 4.26: Global warming impacts from the end-of-life phase.
4.3.4 Results per component category and identification ofhot spots
The component categories considered are: concrete, reinforcing steel, formwork, prestressing,scaffolding, ground & underwater works, piles & caisson, curing, asphalt, bearings & joints,railings & parapets, inspection and others. Burdens from the operation phase are not consid-ered since public lighting impacts are irrelevant and traffic-related impacts greatly overcomethe overall results and already constitute a hot spot of the study. Figure 4.27 presents globalwarming impact shares between the life cycle phases of the different component categories. Weremind the reader that production of scaffolding equipment is not considered in this analysisand that production of new asphalt related to the maintenance works is considered in the main-tenance & repair life cycle phase.
Thomas Dequidt 93 Master Thesis NTNU 2012
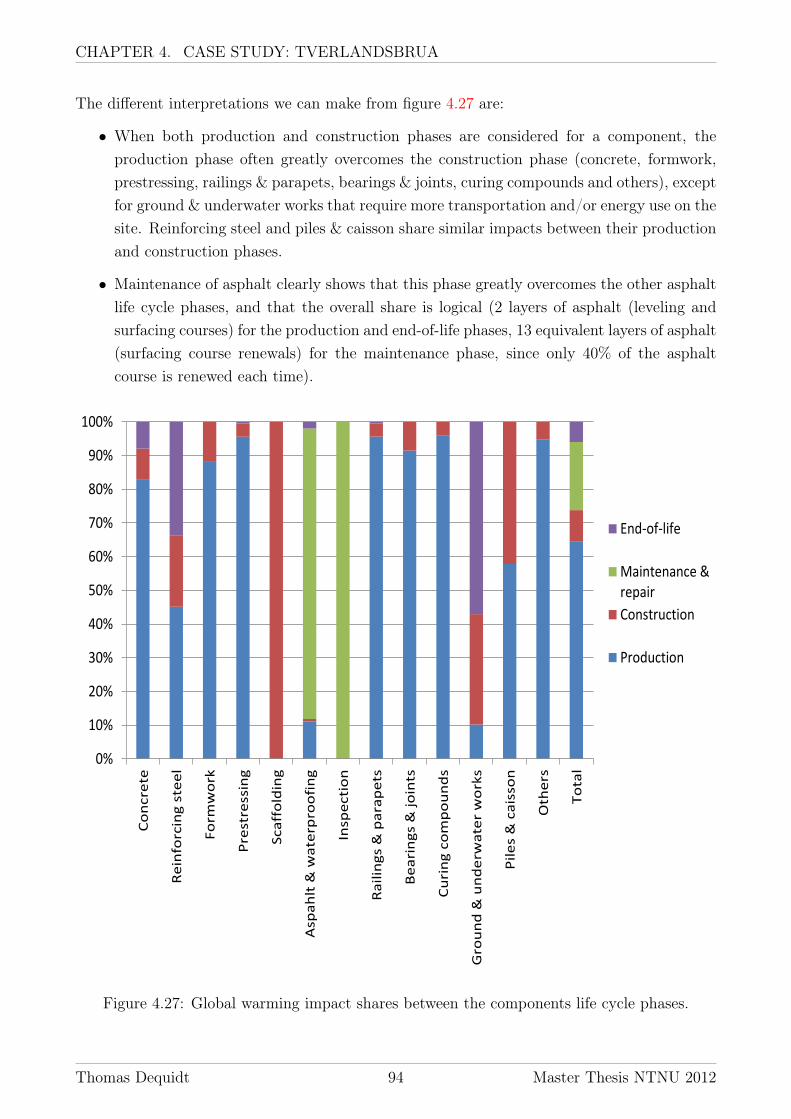
CHAPTER 4. CASE STUDY: TVERLANDSBRUA
The different interpretations we can make from figure 4.27 are:
• When both production and construction phases are considered for a component, theproduction phase often greatly overcomes the construction phase (concrete, formwork,prestressing, railings & parapets, bearings & joints, curing compounds and others), exceptfor ground & underwater works that require more transportation and/or energy use on thesite. Reinforcing steel and piles & caisson share similar impacts between their productionand construction phases.
• Maintenance of asphalt clearly shows that this phase greatly overcomes the other asphaltlife cycle phases, and that the overall share is logical (2 layers of asphalt (leveling andsurfacing courses) for the production and end-of-life phases, 13 equivalent layers of asphalt(surfacing course renewals) for the maintenance phase, since only 40% of the asphaltcourse is renewed each time).
0%
10%
20%
30%
40%
50%
60%
70%
80%
90%
100%
Co
ncre
te
Re
info
rcin
g s
tee
l
Fo
rmw
ork
Pre
stre
ssin
g
Sca
ffo
ldin
g
Asp
ah
lt &
wa
terp
roo
fin
g
Insp
ecti
on
Ra
ilin
gs
& p
ara
pe
ts
Be
ari
ng
s &
jo
ints
Cu
rin
g c
om
po
un
ds
Gro
un
d &
un
de
rwa
ter
wo
rks
Pil
es
& c
ais
son
Oth
ers
To
tal
End-of-life
Maintenance &repair
Construction
Production
Figure 4.27: Global warming impact shares between the components life cycle phases.
Thomas Dequidt 94 Master Thesis NTNU 2012

CHAPTER 4. CASE STUDY: TVERLANDSBRUA
Figure 4.28 presents global warming impact values per component category. The identified hotspots are listed below.
0
100
200
300
400
500
600
700
800
900
1000Co
ncre
te
Rein
forc
ing
stee
l
Form
wor
k
Pres
tres
sing
Scaf
fold
ing
Aspa
hlt &
wat
erpr
oofin
g
Insp
ectio
n
Raili
ngs
& p
arap
ets
Bear
ings
& jo
ints
Curin
g co
mpo
unds
Gro
und
& u
nder
wat
er w
orks
Pile
s &
cai
sson
Oth
ers
Tota
l
Kg C
O2-
eq
Production
Construction
Maintenance &repair
End-of-life
Figure 4.28: Global warming values per component category.
Concrete production accounts for 26.8% of the overall bridge impact and overcomes anyother component production phase. When looking at the subprocesses, clinker productionrepresents 91% of the overall impact. Clinker production is then the hot spot process.
Asphalt maintenance accounts for 20.0% of the overal bridge impact. The impact sharesbetween the subprocesses related to asphalt maintenance are: asphalt production andlaying (83%), asphalt disposal (6.7%), old asphalt course removal (5.3%) and transporta-tion of new asphalt to the bridge (5%). Asphalt production and laying is then clearlyidentified as the hot spot process.
Railings & parapets production accounts for 12% of the overall bridge impact. The sub-processes related to railings & parapets production are average steel manufacturing pro-cess and raw material acquisition of low-alloyed steel, accouting for 48.9% and 51.1% ofthe impacts, respectively. Both processes can then be considered as hot spots.
Prestressing elements production accounts for 11.3% of the overall bridge impact. Pre-stressing production for the bridge superstructure accounts for 98.4%. The impact sharesbetween the subprocesses are raw material acquisition of low-alloyed steel (70.1%), av-erage steel manufacturing process (14.5%), wire drawing process (12.6%) and grouting(2.8%). Raw material acquisition of steel is then the hot spot process.
Thomas Dequidt 95 Master Thesis NTNU 2012

CHAPTER 4. CASE STUDY: TVERLANDSBRUA
4.3.5 Uncertainty analysis
In this section, an uncertainty analysis is performed on data that are not 100% reliable andthat lead to important shares of the overall global warming impact. The elements considered inthis section are shares of reinforcing steel production and amount of steel in railings & parapetsproduction. Regarding steel prestressing elements (strans, anchor heads and steel ducts), onlythe manufacturing process is uncertain (representing 26.6% of the impacts from prestressingproduction for the deck), but since no other more accurate processes are available, not muchcan be done to improve the data quality. Amount and type of steel are accurate data sincethey are provided by the manufacturer.
Shares of reinforcing steel : the shares of reinforcing steel between Badische StahlwerkeGMBH (German supplier) and Celsa (Norwegian supplier) considered in this analysisare 70% and 30%, respectively. However, according to the reinforcing steel subcontractor,the source of the reinforcing steel delivered on the site can somehow vary according tothe stock availability. If sufficient steel is available from the Norwegian supplier, largeramounts could then be provided by this manufacturer in order to reduce transportationcosts, for example. However, if the Norwegian supplier cannot provide enough steel, morewill be ordered to the German supplier. According to the subcontractor, the shares canvary between 80%-20% and 60%-40%.
Figure 4.29 shows the differences in global warming impact according to the shares. Pro-duction and construction phases are considered. From this figure we can state that impactvariations are not very important. The impacts range from 66.73 to 69.28 kgCO2-eq perFU, which makes a variations of 3.7%. However, we notice than even if more transporta-tion is required for the German steel, the overall impact is lower when the German steelaccounts for higher shares. Hence, the German supplier is the prefered option.
0
10
20
30
40
50
60
70
80
80% - 20% 70% - 30% 60% - 40%
kg C
O2-
eq
BadischeStahlwerkeGMBH
Celsa
Total
Figure 4.29: Uncertainty analysis on the impact shares of reinforcing steel supply.
Thomas Dequidt 96 Master Thesis NTNU 2012

CHAPTER 4. CASE STUDY: TVERLANDSBRUA
Amount of steel in railings & parapets : the calculation of the amount of steel in railings& parapets is based on a raw assumption. Since no data are available for the productsconsidered in terms of amount of material, a very uncertain geometrical assumption ismade, multiplying an average steel density by a hand-made calculation of the steel volume.However, this assumption certainly overestimated the burdens from railings & parapets.In this analysis, we consider 40% less amount of steel, hence reducing burdens from bothraw material acquisition and manufacturing processes.
Figure 4.30 shows the results from the uncertainty analysis realized on railings & para-pets. By reducing the inputs of steel by 40%, the related emissions from the production,construction and end-of-life phases are also reduced by 40%. The impacts from railings ¶pets decrease from 169.9 to 101.9 kgCO2-eq per FU, which makes the overall bridgeglobal warming impact decrease by 7.5%. Hence, importance should be attributed to theraw material acquisition and manufacturing processes of these products.
0
20
40
60
80
100
120
140
160
180
Initial 40% imput reduction
kgCO
2-eq
Production
Construction
End-of-life
Total
Figure 4.30: Uncertainty analysis on railings & parapets.
4.3.6 Sensitivity analysis
In this section are considered variations in source and amount of data related to the hot spotsof this study (except for railings & parapets, that were considered in the uncertainty analysis).The elements analyzed are concrete production and asphalt course renewal.
Concrete production : concrete production represents the most important source of emis-sions in the bridge production phase. In order to rank the environmental quality of theconcrete used in this project, the sensitivity analysis will focus on comparisons betweenthe different types of concrete used in this project, a reference concrete and a fictitiouslow-carbon concrete. The reference unit for comparisons is the production of 1 cubicmeter of concrete. A fresh concrete at plant selected from the database is chosen as
Thomas Dequidt 97 Master Thesis NTNU 2012

CHAPTER 4. CASE STUDY: TVERLANDSBRUA
a normal concrete reference, including the whole manufacturing process, internal trans-portation and infrastructure [25]. The fictitious cement is built on the concrete B55 SV-30(Dmax=22 mm) composition, replacing the Norcem Industrisement, Norcem Standard FAand Fesil Microsilica by a cement composed of 70% Portland cement and 30% fly ash,silica fume or other additives without burdens. The ficititous concrete is based on thecomposition of a CEM II/B-V cement, according to NS-EN 206-1 standard.
Figure 4.31 shows the results of the sensitivity analysis on the concrete production.
A first remark is that the higher the strength of the concrete is, the higher the emissionsare because more cement is required.
A second remark can be made about the B45 AUV concrete that contains an anti-washoutadmixture (modeled as carboxymethyl cellulose). The insertion of this additive increasesthe emissions by 6.6% compared to the normal B45 concrete, whereas it only represents0.2% of the concrete mass. Careful interest should then be allocated to the choice of thisanti-washout admixture.
Finally, we see that the reference concrete (strength B35, using 300 kg of Portland ce-ment 42.5R) is less polluting than the concretes modeled in this project, which meansthan critical interest should be attributed to concrete production. The use of this refer-ence concrete would decrease the overall bridge emissions by 4.5%. However, the actualreduction would be lower since this bridge requires mainly B55 concrete strength, whilethe reference concrete is a B35. The fictitious low-carbon concrete would be closer to ourcase study, since the cement and replacement admixtures amounts are the same but lessPortland cement is used, in the limitations of 30% replacement admixtures. The use ofthis ficititous concrete for the overall bridge would decrease the overall global warmingimpact by 2.4%.
0
50
100
150
200
250
300
350
kgC
O2-
eq
B35 SV-30
B45 AUV SV-30
B45 SV-30(Dmax=22mm)
B55 SV-30(Dmax=16mm)
B55 SV-30(Dmax=22mm)
Referenceconcrete
Fictitious low-carbonconcrete
Figure 4.31: Sensitivity analysis on the production of 1 m3 concrete.
Thomas Dequidt 98 Master Thesis NTNU 2012
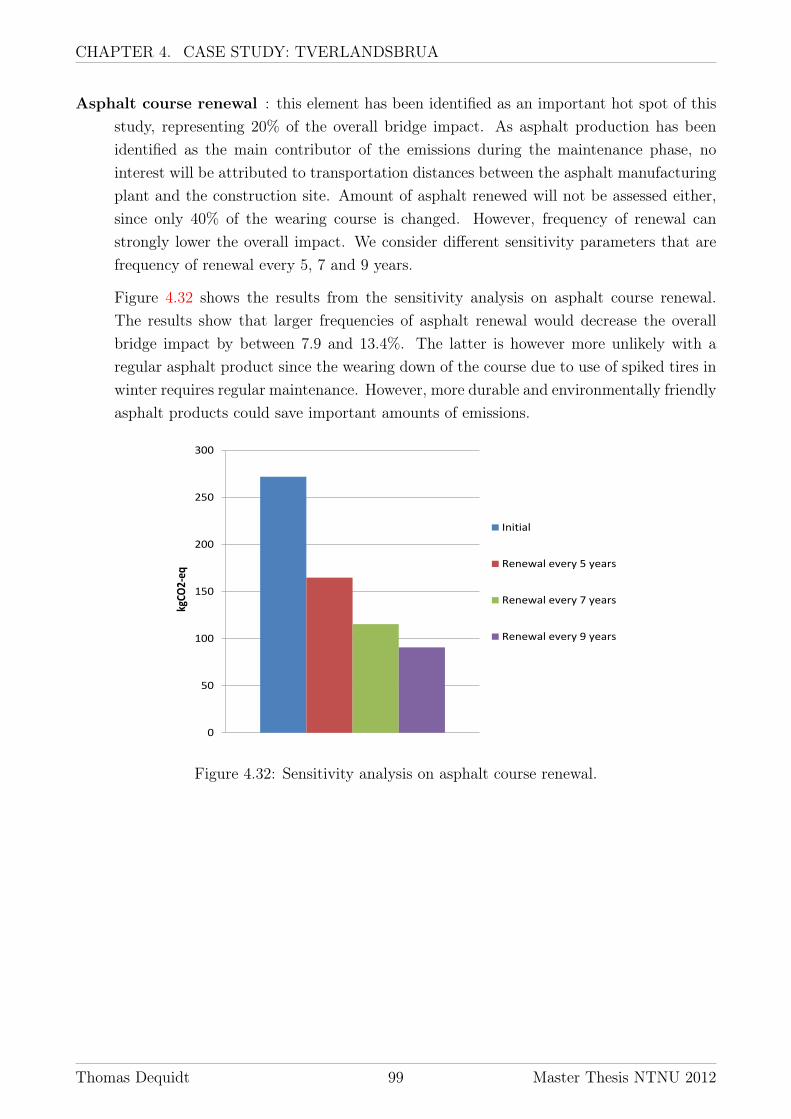
CHAPTER 4. CASE STUDY: TVERLANDSBRUA
Asphalt course renewal : this element has been identified as an important hot spot of thisstudy, representing 20% of the overall bridge impact. As asphalt production has beenidentified as the main contributor of the emissions during the maintenance phase, nointerest will be attributed to transportation distances between the asphalt manufacturingplant and the construction site. Amount of asphalt renewed will not be assessed either,since only 40% of the wearing course is changed. However, frequency of renewal canstrongly lower the overall impact. We consider different sensitivity parameters that arefrequency of renewal every 5, 7 and 9 years.
Figure 4.32 shows the results from the sensitivity analysis on asphalt course renewal.The results show that larger frequencies of asphalt renewal would decrease the overallbridge impact by between 7.9 and 13.4%. The latter is however more unlikely with aregular asphalt product since the wearing down of the course due to use of spiked tires inwinter requires regular maintenance. However, more durable and environmentally friendlyasphalt products could save important amounts of emissions.
0
50
100
150
200
250
300
kgCO
2-eq
Initial
Renewal every 5 years
Renewal every 7 years
Renewal every 9 years
Figure 4.32: Sensitivity analysis on asphalt course renewal.
Thomas Dequidt 99 Master Thesis NTNU 2012


Chapter 5
Discussion
In this section, the results of the literature review, the LCA methodology description andthe case study are gathered and discussed. The purpose of this discussion is to sum up theimportant aspects revealed by the thesis and check the consistency of the overall work. Thediscussion is divided in different topics.
5.1 Literature review
Among the 45 references reviewed, 2 are very similar to this study since they dealt with acomplete LCA of a concrete bridge, i.e. including all life cycle phases and all bridge elements.
J. Hammervold et al. (2011) [10] found out that the emissions of a concrete box girder bridgewere 600 kgCO2-eq per FU for a relatively small bridge (417 m2). The material production,transportation, construction, operation (excluding traffic disruption and regular traffic), main-tenance, repair and end-of-life phases are included; as well as the entire structure (super- andsubstructure).
In this study however, the wearing course is renewed every 10 years with 65% of the initialamount of asphalt. Considering these assumptions for our asphalt course renewal, the emis-sions from Tverlandsbrua would be brought down to 1219.5 kgCO2-eq per FU, hence decreasingby 10.2% the overall impact. The remaining difference of emissions between both studies ispartly explained by the amount of concrete required per FU. The concrete box girder requires0.69 m3 concrete per FU while Tverlandsbrua requires 1.16 m3 concrete per FU. Hence, Tver-landsbrua requires 68% more concrete per FU than the box girder bridge. ined by the hugeamounts of steel required for the prestressing elements and railings of Tverlandsbrua.
The French report from the MEEDDM (2006) [15] found out that the emissions of a prestressedconcrete bridge were 1370 kgCO2-eq per FU. The bridge deck area is 495 m2. As previously,
Thomas Dequidt 101 Masther Thesis NTNU 2012

CHAPTER 5. DISCUSSION
all life cycle phases and bridge elements are included.
The wearing course renewal of the prestressed concrete bridge represents 1.14 tons of asphaltper FU, while Tverlandsbrua requires 0.96 tons of asphalt per FU, i.e. 15.8 % less. In addition,the prestressed concrete bridge requires 1.7 m3 concrete per FU while Tverlandsbrua requires1.16 m3, i.e. 32% less concrete than the prestressed concrete bridge. However, Tverlandbruarequires 0.061 tons of prestressing works per FU for the bridge deck while the prestressed con-crete bridge only requires 0.029 tons per FU, i.e. 52.5% less. The consideration of these threeparameters would bring down the emissions from Tverlandsbrua to 1279 kgCO2-eq per FU.However the emissions from railings & parapets would be higher for Tverlandsbrua than forthe prestressed concrete deck since the latter uses concrete parapets, much less polluting.
The results of both reviews are quire consistent with our case study. The amount of concreteper FU for Tverlandsbrua is found higher compared to the concrete box girder since no pre-stressing is used and the bridge deck area is much more important, requiring a thicker boxgirder. However, the prestressed concrete bridge requires much more concrete per FU for thesubstructure part than Tverlandbrua. The overall results are found quire similar when consid-ering close assumptions for asphalt renewal and steel and concrete production.
Finally, the impacts of Tverlandsbrua are found lower than the average impact of steel bridges(2180 kgCO2 per FU) or steel-concrete composite bridges (2490 kgCO2 per FU) identified inthe literature study. This is in accordance with other concrete bridge studies and shows thatconcrete as a design material can be chosen for its environmental properties.
5.2 LCA methodology
The complete description of LCA methodology performed in this thesis aimed at building arobust framework of study for the application of this methodology on the case study Tverlands-brua. A discussion is conducted for each main phase of LCA methodology.
5.2.1 Goal and scope definition
The initial reason for carrying out the study is the carbon footprint assessment of a Norwegianbridge using LCA methodology in order to compare the results with future bridge environmen-tal assessments. Although the case study performed is somehow restrictive since it includesspecific processes, the results constitute a rigid basis for comparisons with other studies. Thedefinition of the system boundaries and the functional unit was chosen to allow future com-parisons. The definition of the functional unit somehow skews the results for the entire bridge,
Thomas Dequidt 102 Master Thesis NTNU 2012
CHAPTER 5. DISCUSSION
as the substructure is not clearly represented in the FU. However, the consideration of a two-dimensional physical parameter, i.e. the bridge deck area, allowed the consideration of bothlength and width of the bridge superstructure. As this structural element was identified asthe most polluting one, the choice of a one-dimensional physical parameter would have beeninaccurate. The system boundary excluded all uncertain elements, such as traffic disruptionfrom construction and maintenance activities or foreseeing of accidental repairs, that mainlydepend on the bridge project. Allocation procedures were sometimes used to share the burdensof a process between its related subprocesses in order to avoid as much as possible the creationof independent subprocesses. The category Others is however an exception and could havebeen allocated to the super- or substructure elements with more time and information.
5.2.2 Life cycle inventory
The inventory of input flows was realized as precisely and accurately as possible. The source ofinput data mainly comes directly from the client or contractors, especially for the productionphase. Hand-made calculations and assumptions were avoided as much as possible. Omittedinput flows are composed of small additional products (grease, supplementary wood and con-crete cooling), production of temporary equipments (barracks, scaffolding, traveling formworksystem, bracings, temporary covers and cranes) and additional energy consumption on the sitefrom the barracks and other identified processes. As these processes are not directly relatedto the hot spots of this study, we can assume that their omissions do not have an importantimpact on the results. Output flows are either collected from the subcontractors or calculatedthroughout a reliable generic database. More accuracy could have been brought to the resultsby using more EPD declarations or similar for the hot spot elements of this study instead ofgeneric processes, but such documents have not been found.
5.2.3 Life cycle impact assessment
Only global warming impact category is considered in this study. All output data are col-lected or calculated using CO2-eq units, except for the steel pipe piles (only CO2, CH4 andN2O) and a part of the German reinforcing steel (only CO2). The other greenhouses gasesemitted by these processes are however negligible because of small amounts and low GWP100.Weighting, grouping and normalization were not considered to keep the transparency of theresults for the project owner. Uncertainty and sensitivity analyses were performed to assessthe consequences of variations in the data. This showed that large amounts of emissions couldbe saved by switching a component with a more sustainable one, especially for concrete, steeland asphalt.
Thomas Dequidt 103 Master Thesis NTNU 2012

CHAPTER 5. DISCUSSION
5.2.4 Interpretation phase
The results of the impact assessment were presented different ways in order to show the mostimportant sources of emissions per function, life cycle and component category and identifythe hot spots. This allowed us to identify the bridge superstructure, production phase, mainte-nance phase, concrete, steel and asphalt as major contributors. The completeness, sensitivityand consistency checks (that were not explicitly included in the analysis) are briefly identifiedthroughout the interpretation of the uncertainty and sensitivity analyses results.
5.3 Material production phase
This phase was one of the most complicated to assess since it included many processes andrequired a huge attention as it was expected to be a life cycle phase accounting for a large shareof the emissions. Consequently, the input data of this phase are the most accurate and preciseof all phases since they were almost entirely provided by the client and subcontractors of thebridge.
5.3.1 Concrete production
Concrete production (and subsequently clinker production) is responsible for the main shareof the impacts. The sensitivity analysis showed that the environmental performance of theconcretes used in this project could be improved. A low-carbon concrete modeled with 70%Portland cement and 30% cement replacement admixtures indicated that up to 2.4% of theoverall emissions can be saved. The composition of this cement is however beyond the projectowner concrete regulations about additives, since SV-30 concretes with a durability MF40should not hold more than 11% and 5% silica fume for CEM I and CEMII/A-V cements,respectively [23]. Hopefully, changes in regulations in the future years will allow the use of suchlow-carbon concretes that are a first step towards the environmental performance improvementsof concrete structures.
5.3.2 Reinforcing steel
The emissions from reinforcing steel production in this study are very low since the manufactur-ing process is mainly based on electric arc furnace (EAF), which is much more environmentallyfriendly than the other common process, basic oxygen furnace (BOF). Even if the transporta-tion distance required for the German steel (about 2000 km in average) in much more importantthan for the Norwegian steel (237 km), the production of the German steel (about 170 kgCO2-eq
Thomas Dequidt 104 Master Thesis NTNU 2012

CHAPTER 5. DISCUSSION
per ton of steel) is twice less polluting than the production of the Norwegian steel. Further-more, the uncertainty analysis showed that consideration of both steels for the production andconstruction phases always favors the German steel in spite of bigger shares of steel products.Hence, both production and construction phases are important to consider before choosing oneproduct instead of another.
5.3.3 Prestressing elements & railings
The production of the prestressing elements and the railings & parapets is certainly overesti-mated due to an average manufacturing process chosen by default and due to the absence ofaccurate data for the amount of steel from the railings & parapets production. The results ofthe uncertainty analysis show that the overall bridge impact could be actually decreased by7.5%.
5.4 Construction phase
5.4.1 Transportation
The main source of emissions within the construction phase is transportation. The meanof transportation lorry, >16t accounts for 74% of the emissions from transportation. Theinput data are very accurate since they were almost always provided by the subcontractors ofthe project and the process selected from the database to model lorry transportation is quiterepresentative of the actual mean of transportation.
Allocation procedures for the crane and personnel transportation were made by default but arenot really representative of the actual impacts of these processes. Transportation of personnelby aircraft is clearly identified as the second most polluting mean of transportation, representing1.2% of the overall impact. Moreover, only a small team (20 persons) is working on this project.Reductions in the number of travels, choice of local personnel or use of alternative means oftransportation (train, car, boat) could lower these emissions.
A careful attention should be attributed to transportation by lorry, >16t of the scaffolding,reinforcing steel and concrete, representing 1.33, 1.27 and 0.9% of the overall bridge impact,respectively. The scaffolding is rented in Sweden and a local supplier could shorten the trans-portation distance. The reinforcing steel was considered more performing when produced inGermany, even if transportation distances are higher, but alternative means of transportationcan be used instead of lorry (train or TFS). The concrete is produced locally (20km), so theburdens from its transportation can not be easily lowered.
Thomas Dequidt 105 Master Thesis NTNU 2012
CHAPTER 5. DISCUSSION
Finally, in spite of large amounts (4380 tons), the transportation of gravel used for backfillingagainst the abutments and as ballast in the caisson did not account for many emissions (0.3%of the emissions from the construction phase), which means that transoceanic freight ship is anenvironmentally performing mean of transportation.
5.4.2 Energy consumption on the site
The assessment of energy consumption on the site was somehow uncertain due to a high num-ber of assumptions on the input data. Indeed, the consumption of diesel, heavy fuel oil andelectricity was really approximative and subjected to allocation methods based on the relativeweight of each bridge component. However, as impacts from transportation greatly overcomethose from energy consumption on the site, the uncertainties regarding these processes arethen marginal, especially when we consider that the total impacts from the construction phaserepresent less than 10% of the overall bridge impact. Nevertheless, as diesel burnt in buildingmachine is the second most important source of emissions from the construction phase, repre-senting 2.1% of the overall bridge impact, the actual consumption at the end of the constructionphase should be checked and alternative sources of energy could be considered (electricity orlow carbon diesel).
5.5 Operation phase
This section will focus on the consideration of traffic-related emissions.
Traffic-related emissions in this analysis lead to tremendous changes regarding the overall globalwarming impact of the bridge. When included in the analysis, this process accounts for 79.6%of the overall impact, greatly overcoming any other life cycle phase. However, the inclusion ofthe operation phase in our case study depends on the considered approach.
Stricly sticking to the functional unit defined in this project, the emissions from traffic-relatedemissions should not be included in the life cycle of 1 square meter of deck since the traffic is notpart of the bridge itself. However, a consequential approach would consider that the realizationof the bridge will result in the circulation of vehicles on it. If we consider that the related trafficremains almost constant over the 2-year construction period, the impacts from the traffic onthe current road passing along the fjord should decrease since part of this traffic is deportedon the bridge. This would require a larger system considering both life cycle assessments ofthe current road and the new bridge, but this is beyond the scope of this study. Moreover,the intended purpose of this work was to realize a life cycle assessment of a Norwegian roadbridge in order to use the results as a basis for future bridge projects, but traffic is an externalfactor of the bridge, mostly depending on the bridge location and not on the bridge design.This last point reveals that we should blame our cars and not our road infrastructures for such
Thomas Dequidt 106 Master Thesis NTNU 2012

CHAPTER 5. DISCUSSION
emissions, and focus our mind in alternative means of transportation. The latest aspect isclearly identified in the National Transport Plan 2010-2019. [2]
5.6 Maintenance & repair phase
This section will focus on the burdens from asphalt course renewal.
Asphalt course renewal was identified as a hot spot of the study, representing 20% of the overallimpact. The production of new asphalt has been identified as the main contributor of theemissions (83%). The results of the sensitivity analysis showed that up to 67% of the emissionsfrom asphalt renewal can be saved when the wearing course is renewed every 9 years. The maincause of the wearing down of the asphalt course is the use of skiped tires in winter.
Alternative solutions such as use of more environmentally friendly asphalts or de-icing agentscould be considered. However, the use of such agents are often responsible for an early degrada-tion of concrete structures due to chloride ingress. Hence, patching repairs, use of anti-corrosivesubstances or additional cathodic protection could be necessary and might counterbalance theemissions saved from asphalt course renewal.
5.7 End-of-life phase
The end-of-life phase mainly considered the sorting process of reinforced concrete, the landfillingprocess of asphalt and transportation of the elements to their disposal sites (whether recyclingplants, landfilling areas or stocking areas). This life cycle phase was identified as the lesspolluting of all (6% of the overall impacts).
5.7.1 Recycling
Recycling processes were not considered since the related benefits are attributed to other prod-ucts. However, the benefits from previous recycling processes were included in the assessmentof the reinforcing steel and the steel pipe piles. Use of recycled steel could have been includedin the production of the prestressing elements and the railings & parapets, but this has notbeen considered since no data related to amounts of recycled steel were available.
5.7.2 Dismantling and sorting of reinforced concrete
This process accounts for 56.7% of the end-of-life emissions, i.e. 3.4% of the overall impact.Hopefully, improvements in dismantling and sorting processes within the next 100 years will
Thomas Dequidt 107 Master Thesis NTNU 2012
CHAPTER 5. DISCUSSION
reduce the burdens.
5.7.3 Transportation
This process accounts for 37.7% of the end-of-life emissions. As the transportation distances tothe disposal sites were only based on assumptions, alternative means of transportation (freightship, train) should be considered.
Thomas Dequidt 108 Master Thesis NTNU 2012

Chapter 6
Conclusions
This chapter draws the final conclusions on this master thesis, considering the findings fromthe literature review, the LCA methodology description and the case study Tverlandsbrua;and gives recommendations for further studies dealing with life cycle assessment of Norwe-gian bridges. These recommendations are especially addressed to the project owner, Statensvegvesen.
6.1 General conclusions
This master thesis has been realized in several steps. A literature review has first been per-formed considering 14 references dealing with life cycle assessment in order to identify the mainaspects that are important to consider when realizing a bridge LCA analysis. A comprehensivedescription of LCA methodology based on ISO standards 14040:2006 [4] and 14044:2006 [5] hasthen been realized in order to build a robust framework applied on a case study. Finally, thecarbon footprint assessment of Tverlandsbrua using LCA methodology has been realized, andthe results of this LCA analysis are to be used by Statens vegvesen as a basis for the assessmentof future bridge projects.
The literature review allowed to identify the main findings from previous bridge LCAs as wellas average values for carbon emissions and energy use. Material production is often consideredas the biggest contributor. The second most contributing phase is generally either maintenance& repair or traffic disruption due to construction or maintenance & repair activities. Regulartraffic is never considered. The bridge superstructure is almost always found as the biggestcontributor, especially the structural part. Innovative bridge deck design (ECC link slabs,HPC concrete, minimized number of girders) is preferred than conventional bridge deck design.More architectural designs also often lead to more emissions.
Regarding the studies assessing different material choices, concrete is often the best environ-
Thomas Dequidt 109 Masther Thesis NTNU 2012

CHAPTER 6. CONCLUSIONS
mental solution regarding the overall impact. However, for greenhouse gases emissions; steel,composite or wooden alternatives are sometimes preferred, especially if recycled material areused. The average carbon emissions for concrete design is 1590 kgCO2, while those from steeland composite steel-concrete designs are 2180 and 2490 kgCO2, respectively. Timber designcan be interesting for small structures (about 250 m2 deck area) but no conclusions can begiven for larger structures.
The LCA methodology description has been through all elements specified in the ISO stan-dards. The methodology has been adapted to the needs of the case study but the goal andscope definition have been kept wide enough to allow comparisons with future bridge assess-ments.
Allocation procedures are avoided as much as possible, but a physical criteria (weight) is appliedwhen no other choice is possible. Data quality requirements specify that the main sources ofinput data come from the client and the bridge contractors, and that output data are eithercollected from EPDs (or similar) or calculated using an LCA software, but never assumed.General and specific assumptions and limitations of the study are clearly stated.
The LCI phase is conducted using a decision making-process for input data source selection.When such data are missing or not provided on time, assumptions are made. The processesselected from the database for output data calculations are chosen as accurately as possibleaccording to the information provided by the actors of the project or using a process by de-fault.
The impact assessment focused on the global warming impact category, as carbon footprint isthe principal concern of the client.
Finally, the interpretation phase is conducted by presenting the impacts throughout differentcategories (overall impact, functional categories, life cycle categories and component categories)in order to identify the main sources of emissions. Uncertainty and sensitivity analyses are per-formed for uncertain or critical data. A discussion is then conducted to consider all findingstogether and suggest some recommendations.
The overall impact of Tverlandsbrua is 6665 kgCO2-eq per FU (1 FU = 1 square meter effectivebridge deck area through a lifetime of 100 years), all life cycle phases considered. The impactsare brought down to 1358 kgCO2-eq per FU when the operation phase (mainly traffic-relatedemissions) is not considered. The inclusion of the operation phase somehow depends on theapproach of the study and the choice is left to the decision makers whether they want to considerit or not. The rest of the results are presented excluding this life cycle phase.
The structural part of the bridge superstructure accounts for 46.2% of the overall impacts,mainly due to concrete, prestressing and reinforcing steel life cycles. The non-structural partsof the bridge superstructure accounts for 36.3% of the overall impacts, mainly due to asphalt
Thomas Dequidt 110 Master Thesis NTNU 2012
CHAPTER 6. CONCLUSIONS
and railings & parapets life cycles. The bridge supestructure is then clearly identified as thehot spot element of the study.
The production phase is responsible for 64.4% of the overall impact. Concrete is identifiedas the main contributor, and a sensitivity analysis shows that a low-carbon concrete (using acement containing 30% additives without burdens, such as fly ash, etc.) would decrease theoverall impact by 2.4%. However, current concrete regulations in Norway do not allow suchamounts of replacement admixtures. The other main contributors identified are prestressingdevices (strands, anchor heads, steel ducts) and railings & parapets production, but use of 40%less amount of steel in the railings & parapets would decrease the overall impact by 7.5%. Useof recycling steel would also decrease burdens from both elements. Finally, the burdens fromthe German reinforcing steel are found unexpectedly low (170 kg CO2-eq) but correspond tothe information provided by the supplier.
The construction phase is responsible for 9.4% of the overall impact. Transportation by lorry,>16t is identified as the biggest process contributor and concrete as the main componentcontributor. Transportation distances could be shortened for some elements (the scaffoldingequipment could be rented in Norway, for example) and alternative means of transportation(TFS or train) could be considered. Reduction of transportation distances for concrete ishowever very unlikely for this project (20km) but should be considered in future projects.
The repair & maintenance phase is responsible for 20.2% of the overall impact. Asphalt main-tenance is the single biggest contributor. Division of asphalt maintenance schedules by 3 woulddecrease the overall impact by 13.4%. Use of de-icing agents or more environmentally friendlyasphalts could also be interesting solutions.
The end-of-life phase is responsible for 6% of the overall bridge impact. Dismantling andsorting of concrete and transportation of the disposal materials are the main contributors.Improvements in dismantling and sorting processes within the next 100 years and use of alter-native means of transportation are possible solutions to reduce the impacts from this life cyclephase.
6.2 Recommendations for future projects
From the previous conclusions, recommendations can be given for future bridge LCAs. Theserecommendations are addressed to the intended public of this study, that are NTNU university,LCA practitioners and Statens vegvesen, but should be especially considered by the decisionmakers.
Requirements for future comparisons: comparisons of the results of this study with futureenvironmental assessments of bridges should first require the investigation of input datasimilarities with the hot spots of this study, that are concrete production, prestressingand railings & parapets production and asphalt maintenance.
Thomas Dequidt 111 Master Thesis NTNU 2012

CHAPTER 6. CONCLUSIONS
Initial and final LCA analyses: in order to benefit completely from the results of LCAstudies, two bridge environmental assessments should be realized. An initial study (beforethe material production phase) could be performed in order to make an early selection ofenvironmentally performing processes. A final study (after the end-of-life phase) wouldaim at checking the accuracy of the data inventoried during the whole bridge life cycle.
Selection of impact categories: global warming impacts are often the main focus of in-stitutions but other impact categories can be investigated to make a complete bridgeenvironmental impact assessment.
EPDs: use of environmental performance declarations, environmental reports, etc. are advisedsince the output data are directly collected and the risk of using a wrong or inaccurategeneric process in avoided. This should especially be considered for processes leading toimportant shares of the overall impact.
Low-carbon concretes: low-carbon concretes are strongly recommended but changes in theconcrete regulations are required to allow the use of such products in future Norwe-gian bridge projects. For instance, the Norwegian cement producer Norcem provides aCEMII/B-V low-carbon cement composed of 60% clinker, 30% fly ash, 5% gypsum and5% of other additives that only produces 488 kgCO2-eq per ton of product (i.e. approxi-mately 200 kgCO2-eq per m3 concrete). [39]
Recycled steel: if the use of recycled steel is now common in reinforcing steel products, thisis much less common for other steel products, such as prestressing strands, parapets orbearings. The consideration of recycled steel in these products could however stronglyreduce the impacts from their production.
Carbonation: carbonation process is a very long process, but its consideration over a 100-yearlifetime could result in interesting saves in CO2 emissions.
Uptakes from wood: in wooden construction projects, the consideration of CO2 uptakesfrom wood during its life could strongly bring down the emissions, as presented in theliterature review [12].
Economic and social impacts: even if this thesis focused on carbon footprint assessment,economical and social factors should be considered to keep in mind the idea of sustainabil-ity. Life cycle cost analysis (LCCA) and social life cycle assessment (SLCA) are existingmethodologies considering a product from a holistic approach and could be investigated.
Preliminary works: all works required before the actual construction of the bridge (consul-tancy, investigations, administrative works, etc.) represent years of works during whichemissions are released. An assessment of such emissions, even if probably very low com-pared to the overall bridge life cycle impact, could be carried out.
Thomas Dequidt 112 Master Thesis NTNU 2012
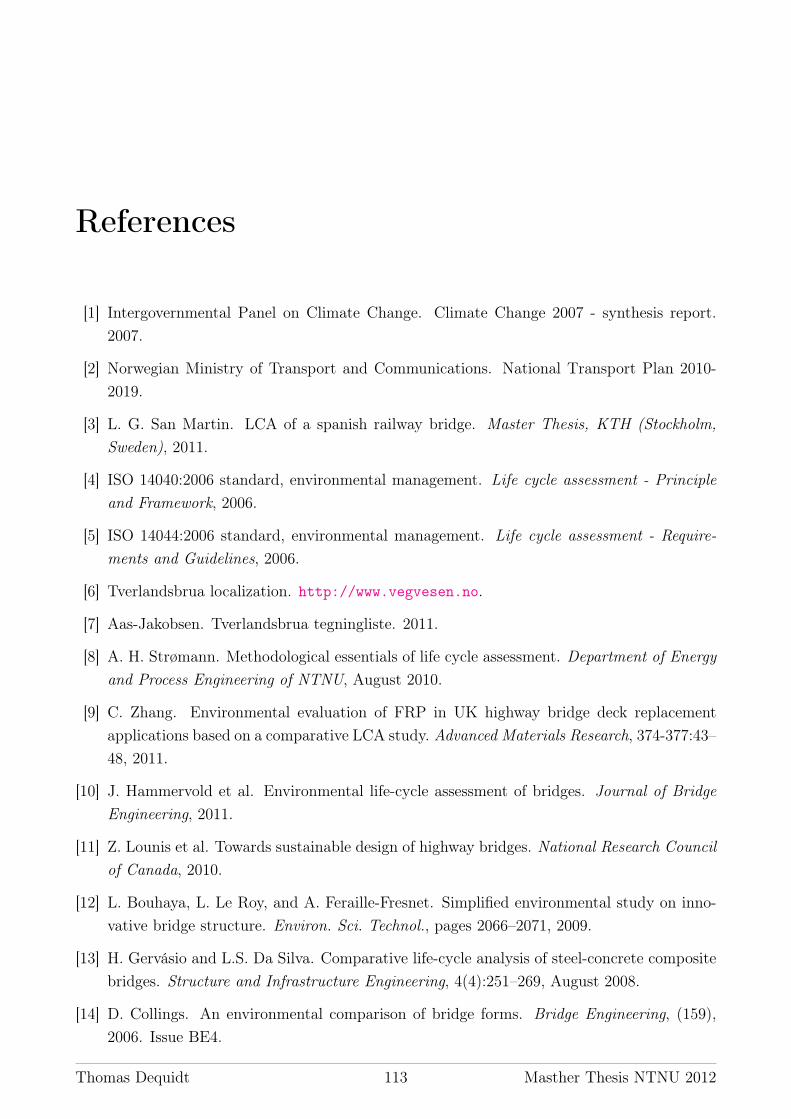
References
[1] Intergovernmental Panel on Climate Change. Climate Change 2007 - synthesis report.2007.
[2] Norwegian Ministry of Transport and Communications. National Transport Plan 2010-2019.
[3] L. G. San Martin. LCA of a spanish railway bridge. Master Thesis, KTH (Stockholm,Sweden), 2011.
[4] ISO 14040:2006 standard, environmental management. Life cycle assessment - Principleand Framework, 2006.
[5] ISO 14044:2006 standard, environmental management. Life cycle assessment - Require-ments and Guidelines, 2006.
[6] Tverlandsbrua localization. http://www.vegvesen.no.
[7] Aas-Jakobsen. Tverlandsbrua tegningliste. 2011.
[8] A. H. Strømann. Methodological essentials of life cycle assessment. Department of Energyand Process Engineering of NTNU, August 2010.
[9] C. Zhang. Environmental evaluation of FRP in UK highway bridge deck replacementapplications based on a comparative LCA study. Advanced Materials Research, 374-377:43–48, 2011.
[10] J. Hammervold et al. Environmental life-cycle assessment of bridges. Journal of BridgeEngineering, 2011.
[11] Z. Lounis et al. Towards sustainable design of highway bridges. National Research Councilof Canada, 2010.
[12] L. Bouhaya, L. Le Roy, and A. Feraille-Fresnet. Simplified environmental study on inno-vative bridge structure. Environ. Sci. Technol., pages 2066–2071, 2009.
[13] H. Gervásio and L.S. Da Silva. Comparative life-cycle analysis of steel-concrete compositebridges. Structure and Infrastructure Engineering, 4(4):251–269, August 2008.
[14] D. Collings. An environmental comparison of bridge forms. Bridge Engineering, (159),2006. Issue BE4.
Thomas Dequidt 113 Masther Thesis NTNU 2012

REFERENCES
[15] MEEDDM. Analyse du cycle de vie d’un pont en béton. 2006.
[16] K. Steele. Environmental sustainability for bridge management. Bridge Management 5,2005.
[17] G. A. Keoleian, A. Kendall, J. E. Dettling, V. M. Smith, R. F. Chandler, M.D. Lepech,and V. C. Li. Life cycle modeling of concrete bridge design: Comparison of engineeredcementitious composite link slabs and conventional steel expansion joints. Journal ofinfrastructure systems, (51), March 2005. ASCE.
[18] Martin. Concrete bridges in sustainable development. Proceedings of the ICE, 2004.
[19] Y. Itoh et al. Using CO2 emission quantities in bridge life cycle analysis. EngineeringStructures, (25):565–577, 2003.
[20] A. Horvath et al. Steel versus steel-reinforced concrete bridges: Environmental assessment.Journal of Infrastructure Systems, September 1998. ASCE.
[21] J. Widman. Environmental impact assessment of steel bridges. Journal of ConstructionalSteel Research, 46:291–293, 1998. Elsevier.
[22] Statens Vegvesen. Håndbok 136 - Inspeksjonhåndbok for bruer. 2000.
[23] Statens Vegvesen. Konkurransegrunnlag, Rv. 80 Løding - Vikan, Tverlandsbrua. E -Beskrivelse og mengdefortegnelse, 2011.
[24] Thomas Dequidt. TBA 4530 - Construction Engineering & Project Management, Special-ization Report, NTNU. 2011.
[25] Daniel Kellenberger, Hans-Jorg Althaus, Tina Kunniger, Martin Lehmann, Niels Jung-bluth, and Philipp Thalmann. Life cycle inventories of building products - Data v2.0(2007). Ecoinvent center, 2007.
[26] Cement Admixtures Association. Admixture sheet ATS 5 - Concrete air-entraining admix-tures. 2006.
[27] Roberto Dones, Christian Bauer, Rita Bolliger, Bastian Burger, Thomas Heck, AlexanderRoder, Mireille Feist Hemmenegger, Rolf Frischknecht, Niels Jungbluth, and MatthiasTuchschmid. Life cycle inventories of energy systems - Data v2.0 (2007). Ecoinvent center,2007.
[28] Badische Stahlwerke GMBH. Umwelterklarung (Environmental report). 2011.
[29] Celsa Steel Service AS. EPD: Steel reinforcement products for concrete. 2012.
[30] Mischa Classen, Hans-Jorg Althaus, Silvio Blaser, Wolfram Scharnhorst, Matthias Tuch-schmid, and Niels Jungbluth. Life cycle inventories of metals - Data v2.1 (2009). Ecoinventcenter, 2009.
Thomas Dequidt 114 Master Thesis NTNU 2012

REFERENCES
[31] Roland Hischier. Life cycle inventories of packaging and graphical papers - part II: Plastics.Data v2.0 (2007). Ecoinvent center, 2007.
[32] Roland Steiner and Rolf Frischknecht. Metal processing and compressed air supply - Datav2.0 (2007). Ecoinvent center, 2007.
[33] FrankWerner, Hans-Jorg Althaus, Tina Kunniger, and Klaus Richter. Life cycle inventoriesof wood as fuel and construction material - Data v2.0 (2007). Ecoinvent center, 2007.
[34] Torbjørn Jørgensen. Seminar om fugtisolering af broer - Mastiksisolering med topeka 4S.Statens Vegvesen, 2009.
[35] Ruukki. Environmental product declaration and safety information sheet - Tubular prod-ucts, steel sections and piles. 20011.
[36] Michael Spielmann, Christian Bauer, and Roberto Dones. Transport services - Data v2.0(2007). Ecoinvent center, 2007.
[37] Statens Vegvesen. Konkurransegrunnlag, Rv. 80 Løding - Vikan, Tverlandsbrua. A3 -Orientering, 2011.
[38] Gabor Doka. Life cycle inventories of waste treatment services - Part V: Building materialdisposal - Data v2.1 (2009). Ecoinvent center, 2009.
[39] Norcem. Norcem Lavkarbonsement (EN 197-1, CEM II/B-V). The Norwegian EPD foun-dation, 2011.
Thomas Dequidt 115 Master Thesis NTNU 2012


Appendix A
Master Thesis contract
Thomas Dequidt 117 Masther Thesis NTNU 2012


Appendix B
GWP100 values
Thomas Dequidt 121 Masther Thesis NTNU 2012
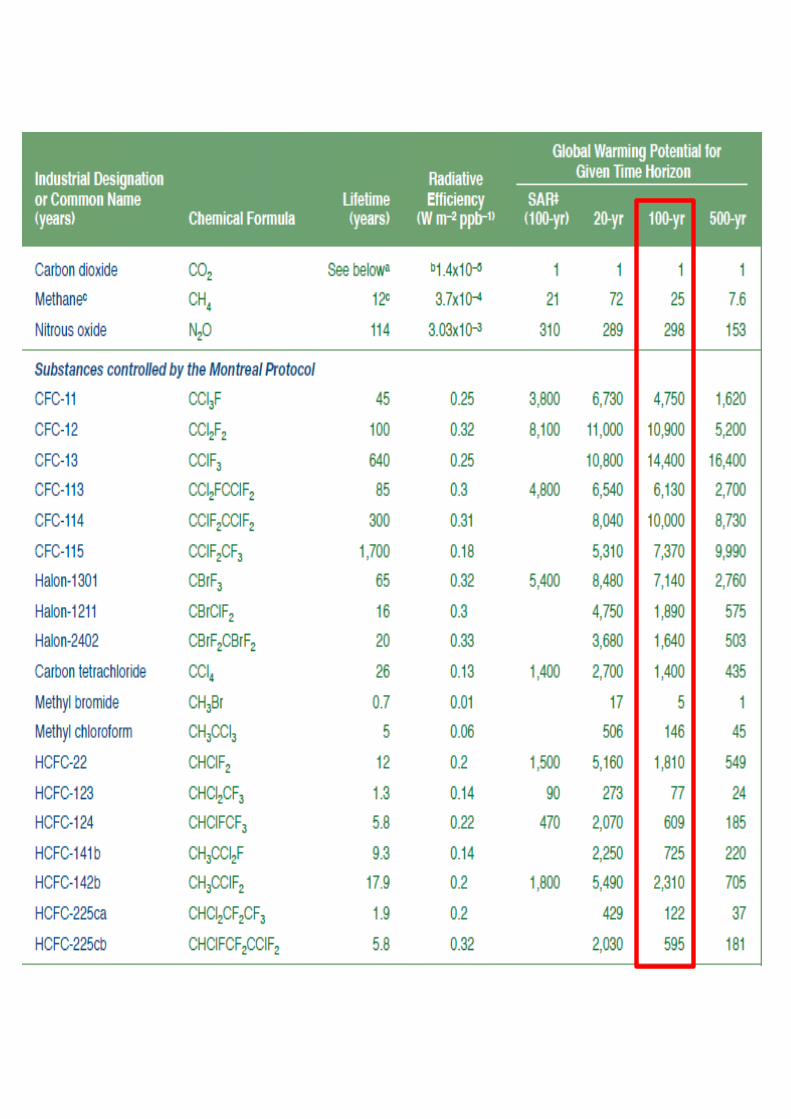


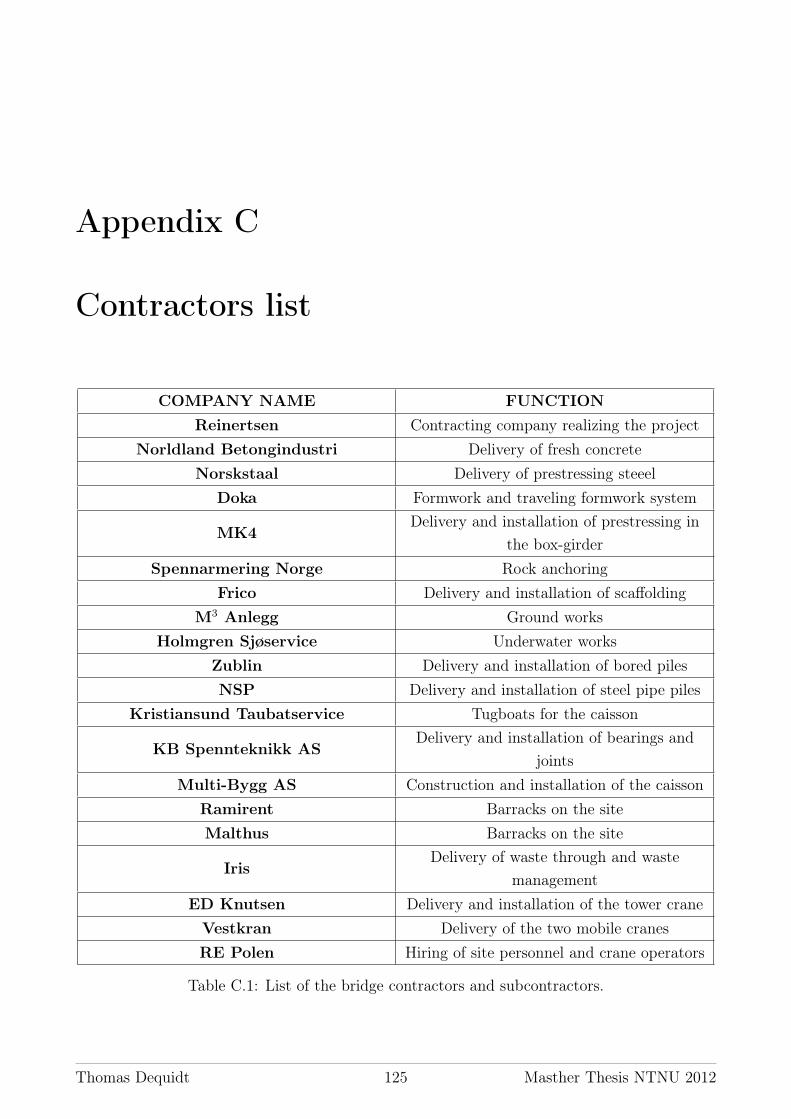
Appendix C
Contractors list
COMPANY NAME FUNCTIONReinertsen Contracting company realizing the project
Norldland Betongindustri Delivery of fresh concreteNorskstaal Delivery of prestressing steeel
Doka Formwork and traveling formwork system
MK4Delivery and installation of prestressing in
the box-girderSpennarmering Norge Rock anchoring
Frico Delivery and installation of scaffoldingM3 Anlegg Ground works
Holmgren Sjøservice Underwater worksZublin Delivery and installation of bored pilesNSP Delivery and installation of steel pipe piles
Kristiansund Taubatservice Tugboats for the caisson
KB Spennteknikk ASDelivery and installation of bearings and
jointsMulti-Bygg AS Construction and installation of the caisson
Ramirent Barracks on the siteMalthus Barracks on the site
IrisDelivery of waste through and waste
managementED Knutsen Delivery and installation of the tower craneVestkran Delivery of the two mobile cranesRE Polen Hiring of site personnel and crane operators
Table C.1: List of the bridge contractors and subcontractors.
Thomas Dequidt 125 Masther Thesis NTNU 2012


Appendix D
Foreground processes
Foreground processes (1/2)
NB: The Norwegian reinforcing steel foreground processes (ReinfSteelNor) do not hold an IDsince the global warming impacts were directly collected and not calculated by the LCA soft-ware. The process Functional Unit designates the entire bridge.
Thomas Dequidt 127 Masther Thesis NTNU 2012

APPENDIX D. FOREGROUND PROCESSES
Foreground processes (2/2)
Thomas Dequidt 128 Master Thesis NTNU 2012

Appendix E
Input data inventory
NB: The values are given for the whole bridge.
Thomas Dequidt 129 Masther Thesis NTNU 2012
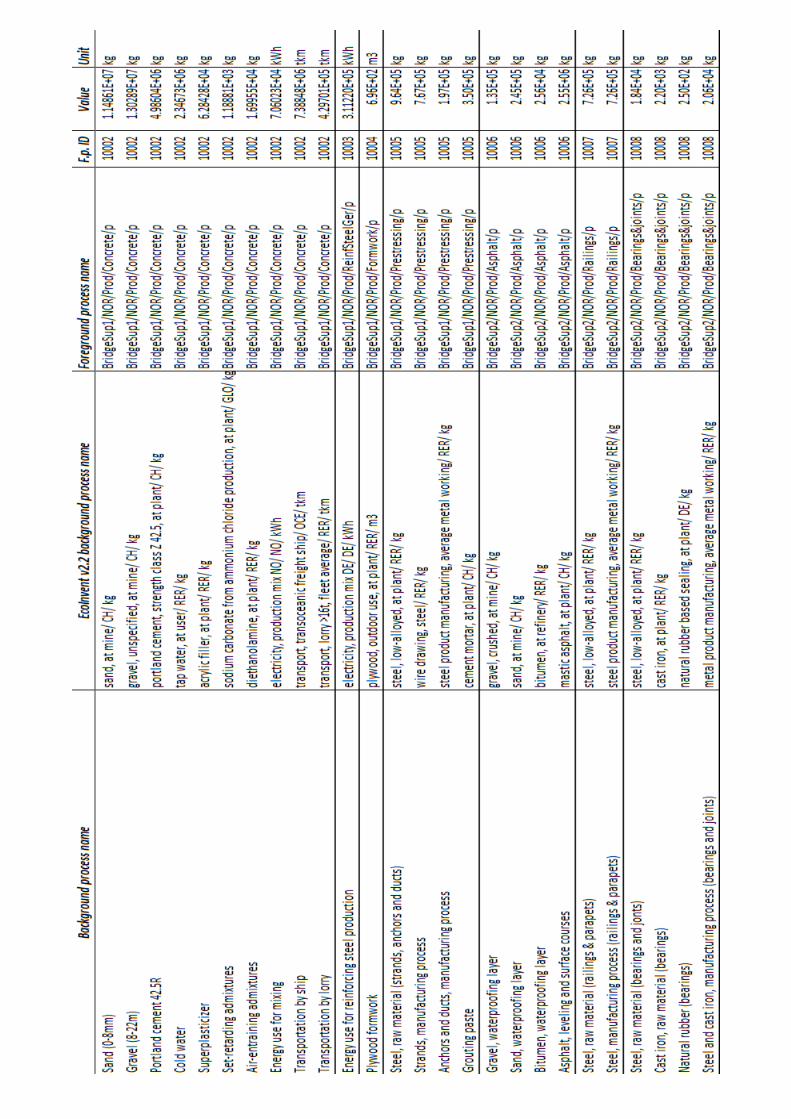


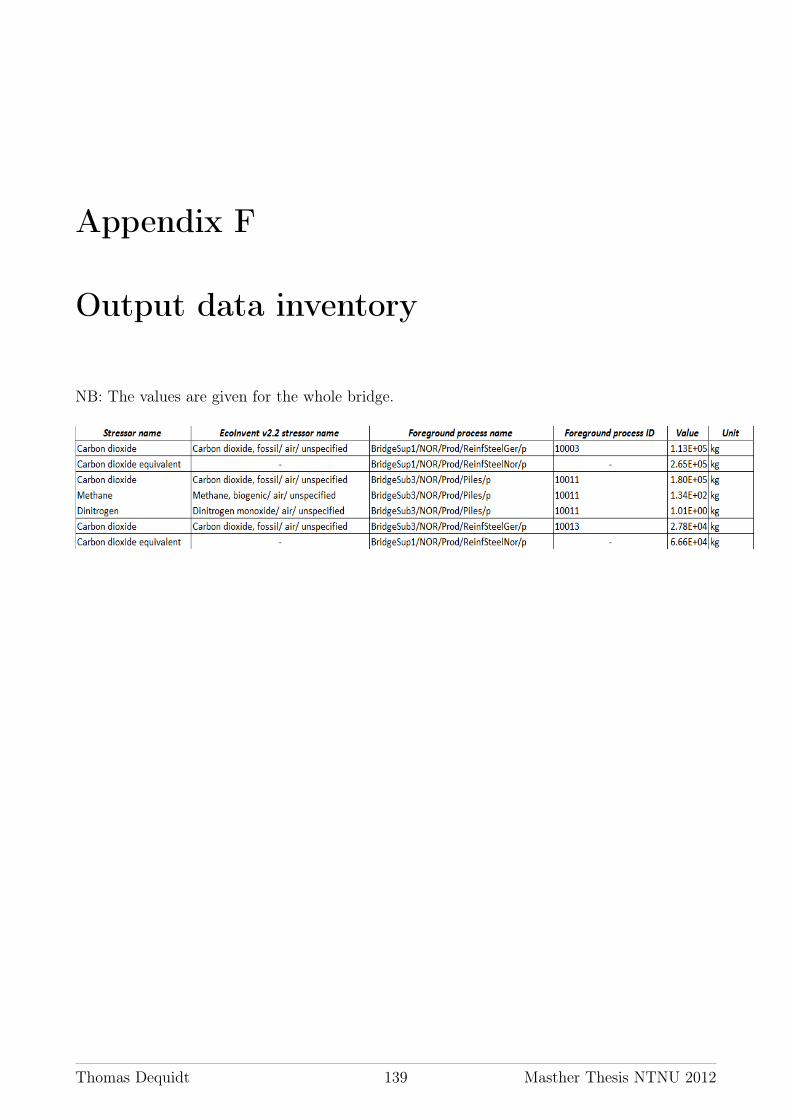
Appendix F
Output data inventory
NB: The values are given for the whole bridge.
Thomas Dequidt 139 Masther Thesis NTNU 2012


Appendix G
Global warming impacts per foregroundprocess
NB: The values are given per functional unit.
Thomas Dequidt 141 Masther Thesis NTNU 2012