Embed Size (px)
Citation preview

WPS 576 Lecture December 5, 2013
Life Cycle Assessment and Biofuels
Brandon Jones
North Carolina State University Department of Forest Biomaterials
1

• Introduction • Background
– Petroleum Consumption – Peak Oil
• Biofuels – What are Biofuels – Biofuels Demand – Conversion Pathways (Difference between 1st gen vs 2nd gen) – Benefits and Drawbacks/Concerns – RIN's, GHG reduction, Carbon footprint Carbon trading
• How LCA fits into facilitating commercialization • Key Issues • Calculation - basic CO2 emissions of petro vs biofuel (GREET) • Case Study - LCA overview • Summary/Glossary of Terms
Outline 2

Demand for Oil • 2009 oil consumption around the world
3
http://www.ritholtz.com/blog/2010/06/oil-consumption-around-the-world/

Top Petroleum Consumers by Continent • Total petroleum consumption (‘000 bbls/day) from 1980-2012 • World consumption is continually increasing
4
http://www.eia.gov/cfapps/ipdbproject/IEDIndex3.cfm?tid=5&pid=5&aid=2
0
10000
20000
30000
40000
50000
60000
70000
80000
90000
100000
1980 1985 1990 1995 2000 2005 2010 2015
Thou
sand
Bar
rels
Per D
ay
World
Asia & Oceania
North America
Europe
Middle East
Central & South America
Eurasia
Africa

Highest Consuming Countries • Sorted by 2012 consumption (US on rt side secondary axis-2X primary)
5
http://www.eia.gov/cfapps/ipdbproject/IEDIndex3.cfm?tid=5&pid=5&aid=2
0
4000
8000
12000
16000
20000
24000
0
2000
4000
6000
8000
10000
12000
1980 1985 1990 1995 2000 2005 2010 2015
Thou
sand
Bar
rels
Per D
ay
Total Petroleum Consumption
ChinaJapanIndiaRussiaSaudi ArabiaBrazilGermanyKorea, SouthCanadaMexicoFranceIranUnited KingdomIndonesiaSingaporeItalySpainAustraliaUnited States
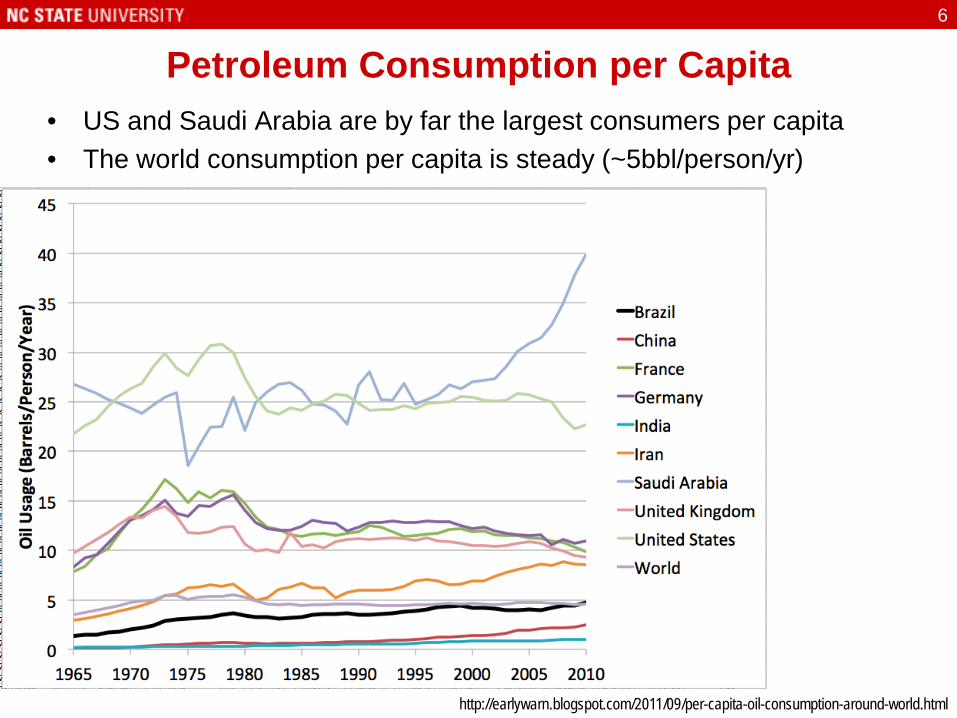
Petroleum Consumption per Capita • US and Saudi Arabia are by far the largest consumers per capita • The world consumption per capita is steady (~5bbl/person/yr)
6
http://earlywarn.blogspot.com/2011/09/per-capita-oil-consumption-around-world.html

Peak Oil • Time when the maximum rate of petroleum extraction is reached • Does not mean all of petroleum is consumed • Peak oil depletion scenarios from different studies
7
http://www.theoildrum.com/story/2006/11/13/225447/79

Proven Oil Reserves • Where are the oil reservoirs?
• 2012 OPEC share of oil reserves
8
Summary of Proven Reserve Data as of 2012[2]
— Country Reserves
[17] 109 bbl
Reserves 109 m3
Production[18]
106 bbl/d
Production
103 m3/d
Reserve/ Production Ratio1 years
1 Venezuela 296.5 47.14 2.1 330 387
2 Saudi Arabia 265.4 42.20 8.9 1,410 81
3 Canada 175 27.8 2.7 430 178 4 Iran 151.2 24.04 4.1 650 101 5 Iraq 143.1 22.75 2.4 380 163 6 Kuwait 101.5 16.14 2.3 370 121
7 United Arab Emirates
136.7 21.73 2.4 380 156
8 Russia 80 13 10 1,600 22
9 Kazakhstan 49 7.8 1.5 240 55
10 Libya 47 7.5 1.7 270 76 11 Nigeria 37 5.9 2.5 400 41 12 Qatar 25.41 4.040 1.1 170 63 13 China 20.35 3.235 4.1 650 14
14 United States 26.8 4.26 7 1,100 10
15 Angola 13.5 2.15 1.9 300 19 16 Algeria 13.42 2.134 1.7 270 22 17 Brazil 13.2 2.10 2.1 330 17
Total of top seventeen reserves
1,324 210.5 56.7 9,010 64 http://www.opec.org/opec_web/en/data_graphs/330.htm
http://en.wikipedia.org/wiki/Oil_reserves

What are biofuels? • EPA defines biofuels as any fuel derived from renewable biological
materials (biomass) which means it contains energy from geologically recent carbon fixation
• ‘First-generation’ or conventional biofuels are made from sugar, starch, or vegetable oil to produce ethanol or biodiesel
• Advanced biofuels are not yet produced commercially – ‘Second generation’ biofuels, or cellulosic biofuels, are made from cellulose,
which is available from non-food crops and waste biomass such as corn stover, corncobs, straw and other herbaceous crops/grasses, wood, and wood byproducts
– ‘Third generation’ biofuels use algae as a feedstock
• The conversion process from biomass to biofuels can include thermal, chemical, or biological methods to produce a liquid, gas or solid fuel
9
http://www.epa.gov/ncea/biofuels/basicinfo.htm

Biofuels Pathways 10
First Generation (Conventional)
http://www.c2es.org/docUploads/images/Fig2-BiofuelsPathways.preview.GIF
Second Generation (Advanced)

US Biofuels Demand • Energy Independence and Security Act (EISA) 2007 • Renewable Fuels Standard (RFS) program governed by EPA
– Updated annually to adjust and enforce yearly goals (RFS2-Mar 26, 2010) – Mandates 36 billion gallons min. vol. requirement of renewable fuel by 2022
• Conventional biofuels (corn ethanol) capped at ~15 billion gallons • Advanced biofuels (Noncellulosic- sugarcane ethanol; Biomass-based
diesel; soy, waste oil, algae) • Cellulosic biofuels (ethanol, diesel) 16 billion gallons by 2022
• 40 CFR Part 80 - Regulation of Fuels and Fuel Additives: 2013 Renewable Fuel Standards
11
http://http://www.biotimes.com/en/articles/2011/March/PublishingImages/fig-1.jpg

Blend Wall • Blend Wall = total amount of ethanol that can be blended into gasoline
– Increased from E10 to E15 (for passenger cars 2001 or later) – Puts a cap on the total ethanol demand (based on petroleum consumption) – Increased demand for E85 (85% ethanol, 15% gasoline) will allow for the
US to fulfill the RFS2 cellulosic ethanol goal
12
http://www.bydanjohnson.com/articleart/1681_1.jpg

Petroleum GHG Emissions • Total U.S. Greenhouse Gas (GHG) Emissions by Economic Sector in 2011
– 6,702 million tonnes of CO2 equivalent (total) – 1,877 million tonnes of CO2 equivalent from Transportation – Majority CO2, small amounts CH4, N2O, and hydrofluorocarbon (HFC)
• Emits anthropogenic GHG – human induced emissions that originate from non-renewable resources
13
http://www.epa.gov/climatechange/ghgemissions/sources/transportation.html
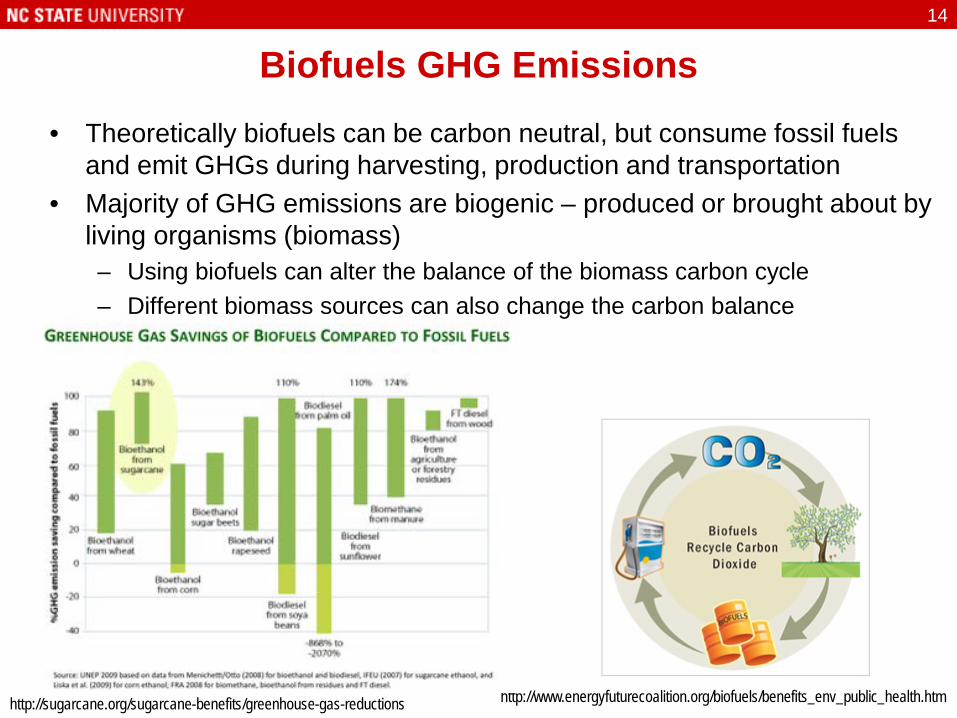
Biofuels GHG Emissions • Theoretically biofuels can be carbon neutral, but consume fossil fuels
and emit GHGs during harvesting, production and transportation • Majority of GHG emissions are biogenic – produced or brought about by
living organisms (biomass) – Using biofuels can alter the balance of the biomass carbon cycle – Different biomass sources can also change the carbon balance
14
http://www.energyfuturecoalition.org/biofuels/benefits_env_public_health.htm http://sugarcane.org/sugarcane-benefits/greenhouse-gas-reductions

GHG Comparison
http://www.geni.org/globalenergy/library/articles-renewable-energy-transmission/graphics/biofuels_compare.gif
15

Relating RFS2 and GHG emissions • Impacts of Renewable Fuel Volumes Required by RFS2 in 2022
– Reduce GHG emissions by 138 million metric tons – Equivalent to removing 27 million cars off the road – Reduce dependence on foreign oil (save $41.5 billion in 2007 dollars) – Increase domestic farming income (generate $13 billion in 2007 dollars)
• In addition to fuel switching, the EPA has identified other reduction
opportunities within the transportation sector – Improving fuel efficiency by sing advanced technologies, design, and
materials to develop more fuel-efficient vehicles (hybrid and electric vehicles, reducing weight and aerodynamic resistance)
– Improving operating practices that minimize fuel use through EPA’s SmartWay program that encourages sensible driving and more efficient travel
– Reducing travel demand by employing urban planning via pubic transportation and building sidewalks and bike paths
16
http://nepis.epa.gov/Exe/ZyPDF.cgi?Dockey=P1006DXP.PDF http://www.epa.gov/climatechange/ghgemissions/sources/transportation.html

Renewable Identification Number • RIN - a serial number assigned to a batch of biofuel for the purpose of
tracking its production, use, and trading • Helps facilitate and enforce the RFS in the US Total Available RINs to Date (as of November 7, 2013)
17
Fuel Category Assignments Total Generated Total Retired Total Available Locked Unlocked
Cellulosic Biofuel (D3)
Assigned Separated
294,554 NA
0 0
0 0
36,480 258,074
Biomass-Based Diesel (D4)
Assigned Separated
2,115,362,278 NA
25,023,854 20,419,305
17,249,456 19,749,172
204,387,419 1,828,533,072
Advanced Biofuel (D5)
Assigned Separated
514,847,899 NA
1,885,066 5,079,718
22,616,949 40,279,160
12,322,627 432,664,379
Renewable Fuel (D6)
Assigned Separated
10,940,469,288 NA
42,154,761 123,217,076
21,162,455 284,661,724
709,006,038 9,760,267,234
Cellulosic Diesel (D7)
Assigned Separated
277,592 NA
0 8,332
0 0
0 269,260
Total RINs Assigned and Separated
13,571,251,611
217,788,112
405,718,916
12,947,744,583
http://www.epa.gov/otaq/fuels/rfsdata/2013emts.htm
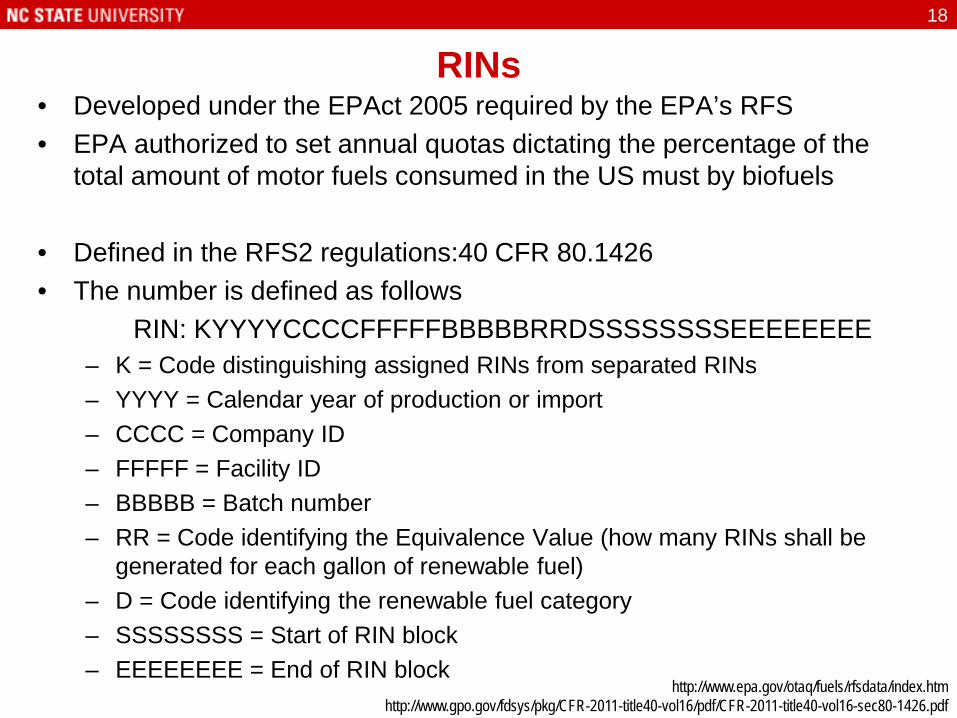
RINs • Developed under the EPAct 2005 required by the EPA’s RFS • EPA authorized to set annual quotas dictating the percentage of the
total amount of motor fuels consumed in the US must by biofuels
• Defined in the RFS2 regulations:40 CFR 80.1426 • The number is defined as follows RIN: KYYYYCCCCFFFFFBBBBBRRDSSSSSSSSEEEEEEEE
– K = Code distinguishing assigned RINs from separated RINs – YYYY = Calendar year of production or import – CCCC = Company ID – FFFFF = Facility ID – BBBBB = Batch number – RR = Code identifying the Equivalence Value (how many RINs shall be
generated for each gallon of renewable fuel) – D = Code identifying the renewable fuel category – SSSSSSSS = Start of RIN block – EEEEEEEE = End of RIN block
18
http://www.epa.gov/otaq/fuels/rfsdata/index.htm http://www.gpo.gov/fdsys/pkg/CFR-2011-title40-vol16/pdf/CFR-2011-title40-vol16-sec80-1426.pdf

RINs • Function as form of a government sanctioned environmental ‘currency’ • Anyone registered with the EPA can buy and sell RINs
– Example: A RIN credit is earned when a petroleum refiner blends the required amount of renewable fuel into their gasoline. Petroleum refiners can get around blending renewables into gasoline themselves by purchasing excess RINs from refiners who have used more renewable fuel than was required of them.
• It is a simple idea, but the technical aspects are intricate and complex • Renewable Volume Obligations (RVO) issued to refinery or imported fuel
19
http://www.eia.gov/todayinenergy/detail.cfm?id=11511

Biofuels LCA • Different types of LCA’s can be applied to different areas of the biofuels
production process – Biomass Feedstock Production (cradle-to-gate) – Delivered Biomass to Biofuel Conversion Pathway (gate-to-gate) – Full Biofuel Conversion (cradle-to-gate) also called Well-to-Pump (WTP) – Biofuel Production and Use (cradle-to-grave) also called Well-to-Wheel
(WTW)
• These differences allow certified LCA practitioner to target the important environmental impacts for different audiences – Biomass Farmer (plantation owner) – Biofuels Producer (biofuel refinery) – Biofuels End User (driver of biofuel-powered vehicle) – Supply Chain Owners (fueling station, transportation)
20
http://www.corrim.org/presentations/video/2012/FPS_WADC/pdf/05_Daystar.pdf

Biofuels and LCA • Must prove that biofuels provide economical benefit to get investors and
build demand for production • Must prove biofuels provide environmental benefit over traditional
petroleum fuels (gasoline) and corn ethanol (food v fuel debate)
• Possible objectives: – Identify feedstock production scenarios with lowest environmental impact – Evaluate the impacts of land use change – Determine conversion technologies with lowest environmental impacts – Evaluate impacts of biofuel combustion compared to gasoline – Determine environmental impacts of total biofuel production process – Identify hotspots for the environmental impacts of biofuel production
21
http://www.life.illinois.edu/delucia/Publications/Davis%20LCA%20TiPS.pdf
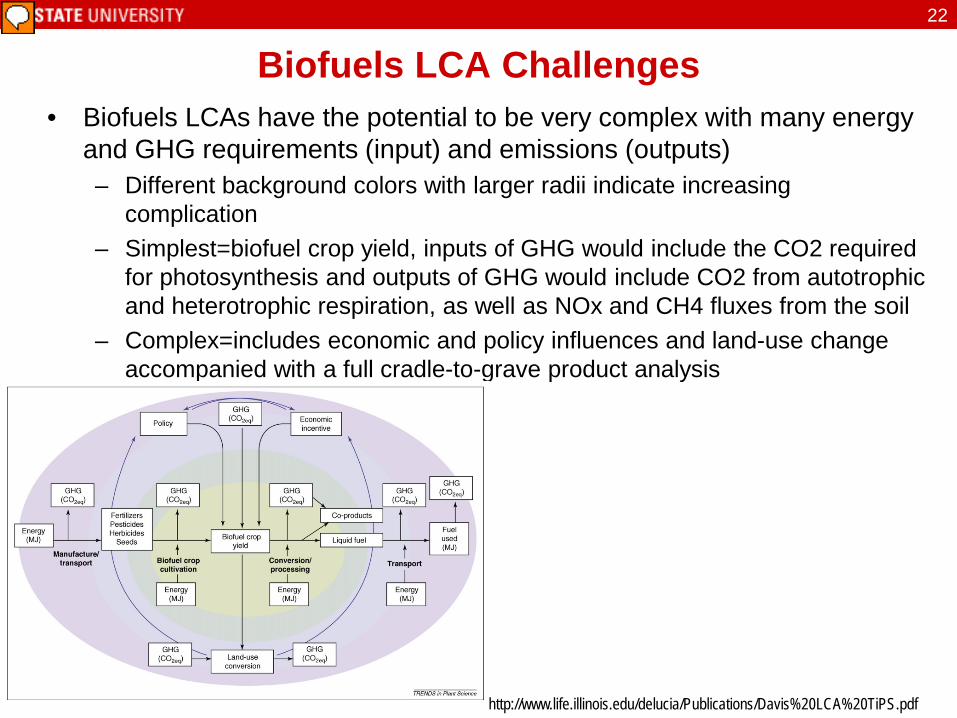
Biofuels LCA Challenges • Biofuels LCAs have the potential to be very complex with many energy
and GHG requirements (input) and emissions (outputs) – Different background colors with larger radii indicate increasing
complication – Simplest=biofuel crop yield, inputs of GHG would include the CO2 required
for photosynthesis and outputs of GHG would include CO2 from autotrophic and heterotrophic respiration, as well as NOx and CH4 fluxes from the soil
– Complex=includes economic and policy influences and land-use change accompanied with a full cradle-to-grave product analysis
22
http://www.life.illinois.edu/delucia/Publications/Davis%20LCA%20TiPS.pdf

Biofuels LCA Challenges • The sustainability of biofuels is challenged by the varied perspectives of
diverse disciplines that contribute to biofuels research • Most LCAs are performed by practitioners whose expertise does not
cover the full range of the product chain and the wide range of specialists interested in the assessment of biofuels – Biomass growth and harvesting – ecologists, plant scientists, biological and
agricultural engineers – Conversion technologies – engineers – Use and distribution – economists and policy-makers
• Most biofuels LCAs recognize that plant growth consumes some GHG emissions, but do not consider this holistic approach
• Accurate data on conversion yields and predictions of future system parameters can be very difficult and can greatly impact the LCA results
• More collaboration required basic scientists and LCA practitioners to incorporate LCA concepts in early phases of technology evaluation
23
http://www.life.illinois.edu/delucia/Publications/Davis%20LCA%20TiPS.pdf

7 Grand Challenges for LCA of Biofuels • By applying the LCA approach McKone and Horvath identified the
following challenges that biofuels face: – Understanding farmers, feedstock options, and land use – Predicting biofuel production technologies and practices – Characterizing tailpipe emissions and their health consequences – Incorporating spatial heterogeneity in inventories and assessments – Accounting for time in impact assessments – Assessing transitions as well as end states – Confronting uncertainty and variability
• Remember LCA is an iterative process and can be a very useful tool in
making decisions on where to allocate resources, where to make investments, what process information to collect, risk assessment
24
http://newscenter.lbl.gov/feature-stories/2011/02/08/lca-challenges-for-biofuels/ dx.doi.org/10.1021/es103579c Environ. Sci. Technol. 2011, 45, 1751–1756 http://pubs.acs.org/doi/pdf/10.1021/es103579c

Class Exercise: GREET • Greenhouse gases, Regulated Emissions, and Energy use in Transportation • Developed by Argonne National Laboratory, sponsored by the U.S.
Department of Energy's Office of Energy Efficiency and Renewable Energy (EERE); first model introduced in 1996
• Free to public, allows to evaluate over 100 fuel pathways and vehicle cycle • Calculates separately for each fuel and vehicle combination
– Consumption of total energy (energy in non-renewable and renewable sources), fossil fuels (petroleum, natural gas, and coal together), petroleum, coal and natural gas.
– Emissions of CO2-equivalent greenhouse gases - primarily carbon dioxide (CO2), methane (CH4), and nitrous oxide (N2O).
– Emissions of six criteria pollutants: volatile organic compounds (VOCs), carbon monoxide (CO), nitrogen oxide (NOx), particulate matter with size smaller than 10 micron (PM10), particulate matter with size smaller than 2.5 micron (PM2.5), and sulfur oxides (SOx).
25
http://greet.es.anl.gov/

Class Exercise: GREET • Compare the energy and emissions from well-to-wheel:
– Conventional gasoline from conventional crude oil – Corn ethanol – Cellulosic ethanol from forest residues
26
http://greet.es.anl.gov/
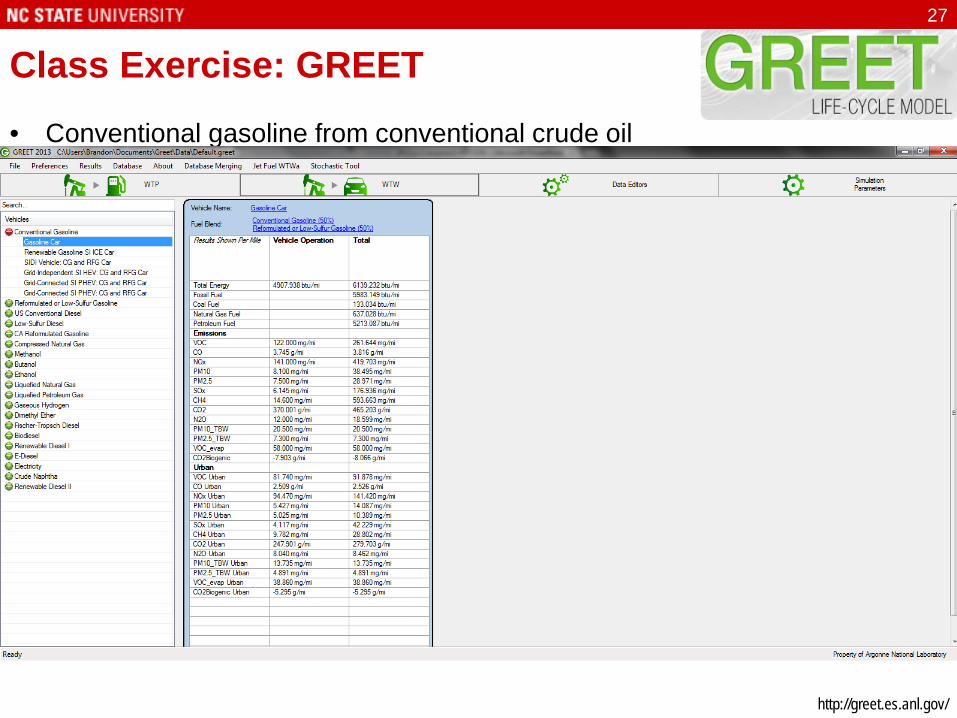
Class Exercise: GREET • Conventional gasoline from conventional crude oil
27
http://greet.es.anl.gov/

Class Exercise: GREET • Corn ethanol
28
http://greet.es.anl.gov/
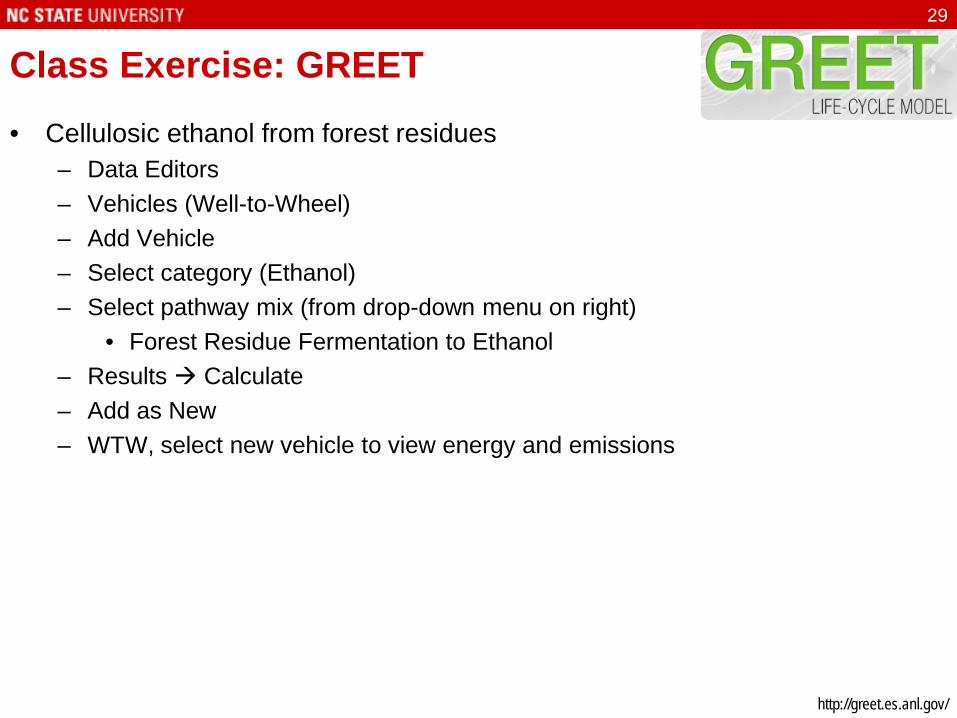
Class Exercise: GREET • Cellulosic ethanol from forest residues
– Data Editors – Vehicles (Well-to-Wheel) – Add Vehicle – Select category (Ethanol) – Select pathway mix (from drop-down menu on right)
• Forest Residue Fermentation to Ethanol – Results Calculate – Add as New – WTW, select new vehicle to view energy and emissions
29
http://greet.es.anl.gov/

LCA Case Study Life Cycle Assessment of Wood Chips for Biofuels Production in Northeast Region of US Binod Neupane and Anthony Halog (Ph. D.) School of Forest Resources, Forest Bioproducts Research Initiative University of Maine, Orono ME 04469 (2009)
• Eco-indicator 99 based cradle-to-gate analysis (from trees to woodchips)
30
http://www.lcacenter.org/LCA9/presentations/47.pdf

LCA Case Study • Goal and Scope The primary goal and scope of this study is to assess the potential environmental life cycle impacts and resource consumptions in producing wood chips for biofuels production. We are interested to know: 1. Which are the activities in the life cycle that contribute the most to the environmental impact associated with woodchips? 2. Where the improvement possibilities are in the life cycle of woodchips production?
• Functional Unit The functional unit is 4m3 of hardwood woodchips composed of 42.6% cellulose, 29.7% hemicellulose, 27.5% lignin and 0.2% ash on dry weight basis. This functional unit was chosen to align with The Greenhouse Gases, Regulated Emissions, and Energy Use in Transportation (GREET) model to produce to one million BTU of energy
• Assumptions 1. Co-products allocation in processing woodchips is based on Rural Technology Initiatives calculations (bark 20%, saw dust 8% and shavings 5%) 2. Primary transportation from felling site to facility is assumed 90km which is considered economically feasible in Maine [8]
31
http://www.lcacenter.org/LCA9/presentations/47.pdf

LCA Case Study • System Boundary
32
http://www.lcacenter.org/LCA9/presentations/47.pdf

LCA Case Study • Life Cycle Impact Assessment (LCIA) for artificial regeneration
33
http://www.lcacenter.org/LCA9/presentations/47.pdf

LCA Case Study • Normalized artificial regeneration
34
http://www.lcacenter.org/LCA9/presentations/47.pdf

LCA Case Study • Natural regeneration LCIA
35
http://www.lcacenter.org/LCA9/presentations/47.pdf

LCA Case Study • Normalized natural regeneration
36
http://www.lcacenter.org/LCA9/presentations/47.pdf

LCA Case Study • Conclusions
– Dominant environmental impacts for both cases are the fossil fuel use and respiratory inorganics created
– The life cycle phases of transportation and harvesting/processing contributed to the most to the environmental impacts
– Acidification/eutrophication and climate change had relatively small contributions
– The recommendation for reducing these impacts is to increase the fuel efficiency associated with harvesting and transportation
37
http://www.lcacenter.org/LCA9/presentations/47.pdf
Summary • Petroleum consumption • Peak oil • Biofuels • First generation • Second generation • EPA • RFS • Blend Wall • GHG • Anthropogenic • Biogenic • RIN • RVO • GREET • Biofuels LCA, Hot Spots
38