Embed Size (px)
Citation preview

Life Cycle Analysis of Plastic:Case Study of Plastic Carrying Bags
Dr. Alvin B. Culaba, Ph.D.Academician, National Academy of Science and Technology
Professor of Mechanical Engineering, De La Salle University

“ The Philippines is the
world’s third-largest
ocean polluter next to
China and Indonesia.”
Jambeck, J.R., Geyer, R., Wilcox, C., Siegler, T.R., Perryman, M., Andrady, A., Narayan, R., Law, K.L. (2015). Plastic waste inputs from land into the ocean. Science347(6223): 768-771.

Source: Jambeck, J.R., Geyer, R., Wilcox, C., Siegler, T.R., Perryman, M., Andrady, A., Narayan, R., Law, K.L. (2015). Plastic waste inputs from land into the ocean. Science347(6223): 768-771.

Forecast of
plastic marine
debris in million
tons by the year
2025
Source: Jambeck, J.R., Geyer, R., Wilcox, C., Siegler, T.R., Perryman, M., Andrady, A., Narayan, R., Law, K.L. (2015). Plastic waste inputs from land into the ocean. Science347(6223): 768-771.

source: Image by Judgefloro via Wikimedia Commons.
Metro Manila alone
spends Seven Billion
Pesos a year to
dispose of waste –
garbage that big
corporations are
making money with.
Source: www.scmp.com

March 07, 2019. According to
NGO GAIA, “Filipinos
use more than 163
million plastic sachet
packets, 48 million
shopping bags and 45
million thin film bags
daily.”
Source: www.no-burn.org

Single-use plastic carrying bag is commonly made from
Polyethylene which consists of long chains of ethylene monomers.
Ethylene is derived from natural gas and petroleum. The polyethylene
used in most carrying bags is either low-density or, more often, high-
density (HDPE). Color concentrates and other additives are often used
to add tint to the plastic. Plastic shopping bags are commonly
manufactured by blown film extrusion.

What are Plastics?
Plastics are synthetic polymers consisting of carbon,hydrogen, oxygen, chloride and nitrogen. It is derived from fossilsources such as oil, coal and natural gas.
Examples are polyethylene (PE), polyethyleneterephthalate (PET), nylons, polypropylene (PP), polystyrene(PS), polyvinyl chloride (PVC) and polyurethane (PU). Due toinefficient disposal methods for these materials, they often endup as environment pollutants, posing an ever-increasingecological threat to all inhabitants of our planet.

Sources of Plastic Material
• Fossil-Based Plastics• Fossil- or petrochemical-based plastics utilize fossil feedstock like
petroleum and natural gas. About 7% of all petroleum is converted intoplastics. Examples of fossil-based plastics are polyethylene (PE),polypropylene (PP), polyethylene terephthalate (PET) and polystyrene(PS).
• Bio-Based Plastics/Bioplastics• These are defined as “plastics” in which 100% of the carbon is derived
from renewable agricultural and forestry resources, such as cornstarch, soybean protein and cellulose

Categories of Plastics
• Thermoplastics • These are polymers that do not change their chemical composition when
heated and can, therefore, undergo molding multiple times. These include the common plastics polyethylene(PE), polypropylene(PP), polystyrene(PS), polyvinyl chloride(PVC) and polytetrafluoroethylene(PTFE) with molecular weights in the range of 20,000 to 500,000 AMU(atomic mass unit).
• Thermoset Plastics• These are polymers that remain solid and can not be melted nor modified.
The chemical change here is irreversible, and hence these plastics are not recyclable because they have a highly cross-linked structure, whereas thermoplastics are linear. Examples include phenol-formaldehyde, polyurethanes, etc.

Biodegradable Plastics
• Biodegradable
• Biodegradable materials can be broken down by microorganisms (bacteriaor fungi) into water carbon dioxide (CO2) and methane (CH4) and microbialbiomass.
• Compostable bioplastics
• These are bioplastics that are decomposed biologically in a compostingprocess at a similar rate to other compostable materials, without leavingvisible toxic remainders. A plastic is designated bio-compostable based onstandard measurements of its total biodegradability and disintegrationdegree, as well as ecological toxicity of its degraded materials.
Clarifications • Compostable plastics are a subgroup of biodegradable plastics
• Not all bioplastics are biodegradable

Global Plastics Production
381 million tons (MT) of plastic was produced in 2015.
Geyer et al. (2017)

Global Plastic Production
7.81 billion tons of plastics was produced cumulatively in the world as of 2015
Geyer et al. (2017)

Global Plastic Waste by Disposal
In 2015, plastics were disposed in the following methods
• Discarded (55%)
• Incinerated (25%)
• Recycled (20%)
Geyer et al. (2017)

The Fate of Plastics
All the plastics produced from 1950 to 2015 went to the following
• Straight to landfill (55%)
• Still in use (30%) • Incinerated (8%)• Recycled (6-7%)
Only 9% of the plastics no longer in used was recycled.
Geyer et al. (2017)

Disposal Method and Fate of Plastics Summary
55%25%
20%
Plastics Disposal Method (2015)
Discarded Incinerated Recycled
55%30%
8%7%
Fate of Plastics (1950 - 2015)
Straight to Landfill Still in Use Incinerated Recycled

Plastic Production by Industrial Sector
Packaging is leading at 146 million tons in 2015
Geyer et al. (2017)

Plastic Waste Generation by Industrial Sector
Packaging is leading at 141 million tons in 2015 in waste generation
Geyer et al. (2017)

Global Mismanaged Plastics by Region
East Asia has the biggest share of mismanaged plastics at 60%in 2010.
Jambeck et al. (2015)

Top Ocean-Polluting Countries
The Philippines is among top ocean polluting countries with a total of 1.9 million metric tons of mismanaged plastic wastes and 750, 000 metric tons of plastic marine debris
Jambeck et al. (2015)

Plastic Ocean input from Top 20 Rivers
Pasig river is one top 20 polluting rivers around the world.
Pasig river’s annual plastic input to the oceans is around 38,800 tons.
Lebreton et al. (2018)

Other Facts on Plastic Bags
• Around 100, 000 marine animals are killed each year due to plastic bags.
• Around 46, 000 plastic pieces are found in every square mile of ocean.
• 4.3 billion gallons of crude oil used each year for plastic bag production.
• Around 1 trillion single use plastic bags are used every year.
• It takes around 1000 years for 1 plastic bag to fully degrade.
• Total of 3.5 million tons of plastic bags are discarded every year.
Source: Greener Ideal (2018)

Life Cycle Assessment (LCA)
“LCA is a process to evaluate theenvironmental burdens associated with aproduct, process or activity by identifyingand quantifying energy and materialsused and releases to the environment; andto identify and evaluate opportunities toeffect environmental improvements.”
Source: (SETAC, 1993)

Components of LCA
• Goal & Scope Definition (ISO 14041)
• Inventory Analysis (ISO 14041)
• Impact Assessment (ISO 14042)
• Interpretation (ISO 14043)

Product Life Cycle: A Cradle-to-Grave Analysis

A paradigm that provides a holistic picture of an entire product system covering resources extraction, material processing, transportation, manufacturing, distribution, use, disposal and reuse/recycling.
Source: Culaba & Purvis, 1999

Life Cycle Impact Assessment
• Classification: What specific impacts (e.g., global warming, acid rain) do the material and energy flows contribute to?
• Characterization: How much do the M&E flows contribute to these impacts?
• Valuation: How much does each impact category contribute to over-all damage?

Global Warming Potential
Acidification
Ozone Depletion
Human Toxicity
Eutrophication
Photochemical Ozone Creation
Ecotoxicity
Fossil Energy Use
Flooding
Landfill Volume
Life Cycle
Inventory
Outputs:
Airborne &
Waterborne
Emissions,
Solid Wastes
Inputs:
Raw Materials,
Energy Carriers,
Water
Weighing and
Interpretation
Model
Processes
& Activities
Define Scope &
System
Boundary
Build ModelLife Cycle Impact
Assessment

Impact Area Reference Unit Description
Global Warming Potential
kg CO2-eqThis impact is related to the continued rise in the average temperature of the earth’s climaticsystem. This is also concerned with climate change and the greenhouse effect.
Ozone Depletion kg CFC11-eq
This is the environmental impact related to the thinning of the ozone layer caused by ozonedepleting substances emitted by different forms of human activities. The depletion of ozone inthe stratosphere makes it ineffective to screen out much of the UV rays from the sun and cancause serious damages to plants, animals, and humans.
Acidification m2
This impact is associated with the apparent decrease in the pH level of terrestrial and aquaticecosystems caused by releases of hydrogen cations (or protons) from acidifying substanceswhich leads to damages in ecosystem populations. This is measured in terms of the land areaof an ecosystem with exceeded limits of acidification.
Ozone Formation person.ppm.h
This impact category is related to the photochemical ozone creation potential. In the groundlevel, ozone acts as a secondary pollutant formed by a highly-complex reaction betweensunlight, NOx and volatile organic compounds (VOCs) including methane. At certainconcentrations, ozone causes damages to vegetation and human health.

Eutrophication kg N-eq
This impact category covers the negative effects of excess nutrients,
particularly Nitrogen present in soil (terrestrial eutrophication) or turbidity-
causing nutrients in water (aquatic eutrophication) which are, in turn, caused by
present atmospheric input of nutrients, from human and industrial activities.
These imbalances in nutrients cause changes in species composition as
adaptation becomes advantageous to a limited number of species
Human Toxicity person
This is the impact to the level of functional state of a person to adequately
cope with his/her daily activities by the absence of diseases and impairment.
This is also the impact factor which can represent the social aspect of
sustainable production.
Ecotoxicity m3
A combination of the words ecology and toxicity, this impact factor refers to the
potential for physical stressors (whether biological, chemical or physical) to
affect ecosystems
Fossil Energy Use MJ This impact factor quantifies the fossil fuel used in terms of energy equivalent

Life Cycle Interpretation
• What do the results mean?
• Have high-impact areas or hot spots been identified?
• Has a best environmental option (BEO) been identified?
• Is further in-depth evaluation necessary?

Interaction of LCA Components
GOAL
DEFINITION
INVENTORY
ANALYSIS
IMPACT
ASSESSMENT
CLASSIFICATION
CHARACTERIZATION
VALUATION
S
C
O
P
I
N
G
I
M
P
R
O
V
E
M
E
N
T

Why is LCA important?
• LCA gives an indication of total environmental impacts
• LCA can reveal environmental impacts that are overlooked in conventional assessments
• LCA gives a true measure of environmental performance
• Rationalizes the structure of a decision-support mechanism that considers the interaction of both environmental and productivity parameters.

Life Cycle Analysis of Plastic:Case Study of Plastic Carrying Bags

To determine the environmental performance of the
production of plastic carrying bags. The bag is made of
high density polyethylene (HDPE).
Functional Unit: 1000 kg of carrying plastic bags
produced.

LCA
FrameworkCradle-to-grave
approach

Households
Eco-aide
Junkshop
Landfill
City garbage
collector
Burned Waterways Buried
Extruder Circular Die
Air Ring / Air bubble
Collapsing frame (guide)
Nip Rollers
Roll of film
Layflat form
Printing Cutting
Utilization
Hopper Monomer Production
Polymer Production
Crude oil Productio
Natural Gas Production
Ethylene PE Distillation,
Desalting and
Hydrotreating
Natural Gas Processing
Recycled/Shredded
Transportation
Fuel Production Power Production
Preparation
Extraction
Production
Utilization
Disposal
Water Production
Pre-combustion
Transport On-Site
System Boundary
Primary Energy Product Raw Material Air Emissions Water Effluents Solid Waste
Raw Material Extraction
Raw Material Preparation
Production
USE
Disposal

UnitsCrude Oil
ExtractionPetroleum Refining
Natural Gas
Extraction
Natural Gas
Processing
Ethylene
Production
Polyethylene
ProductionPlastic Bag Production
Output Product Crude Oil Refined Petroleum Natural GasProcessed Natural
Gas
Olefins
(Ethylene)Polyethylene Plastic bags
Reference Flow kg 1000 1000 1000 1000 1000 1000 1000
Input
Crude oil kg 1035 1018 - - - - -
Natural Gas kg - - 1038 1005 - - -
Refined Petroleum Products kg - - - - 186 - -
Processed Natural Gas kg - - - - 830 - -
Olefins (Ethylene) kg - - - - - 990 -
Water liters - - - - 1627 1494 -
Polyethylene resins kg - - - - - - 1005
Ink Kg - - - - - - 65
colorants kg - - - - - - 60
Process Energy Input
Electricity kWh 39 143 39 21.3 78.8 178 1501.5
Natural gas cu.m. 32.8 11.1 32.8 34.6 142 35.5 -
Residual oil liters 0.80 27.2 0.80 0.050 - 6.01 -
Distillate/Diesel oil liters 1.29 - 1.29 0.050 0.079 - -
Gasoline liters 0.68 - 0.68 0.048 0.091 - -
LPG liters - 1.15 - - - 0.038 -
Recovered Energy MJ - - - - 29 - -
Maintenance oil Kg - - - - - - 0.0075
Lube oil kg - - - - - - 0.1
Transportation Energy
Diesel Combination truck liters - 1.2 - 0.44 - - -
Diesel Rail liters - 0.18 - 0.10 - - -
Diesel Barge liters 0.0025 0.49 - - - - -
Residual Oil Barge liters 0.0083 1.64 - - - - -
Diesel Ocean Freight liters 2.33 - - - - - -
Residual Oil Ocean Freight liters 21.00 - - - - - -
Natural Gas Pipeline cu.m. - - - 21.5 - - -
Electricity Pipeline kwh 9.42 5.15 - - 2.88 - -
Production PreparationRaw Material Extraction

Global Warming Potential
Acidification
Ozone Depletion
Human Toxicity
Eutrophication
Photochemical Ozone Creation
Ecotoxicity
Fossil Energy Use
Flooding
Landfill Volume
Life Cycle
Inventory
Outputs:
Airborne &
Waterborne
Emissions,
Solid Wastes
Inputs:
Raw Materials,
Energy Carriers,
Water
Weighing and
Interpretation
Model
Processes
& Activities
Define Scope &
System
Boundary
Build ModelLife Cycle Impact
Assessment

0%
10%
20%
30%
40%
50%
60%
70%
80%
90%
100%
PERCENT OF LIFE CYCLE STAGES IN EACH IMPACT CATEGORY
Disposal
Utilization
Production
RawMaterialPreparation
RawMaterialExtraction

0
1000
2000
3000
4000
5000
6000
Raw Material Extraction Raw Material Preparation Production Utilization Disposal
Global warming 100a

0
50
100
150
200
250
300
350
400
450
500
Raw Material Extraction Raw Material Preparation Production Utilization Disposal
Acidification

0
0.00002
0.00004
0.00006
0.00008
0.0001
0.00012
0.00014
0.00016
0.00018
Raw Material Extraction Raw Material Preparation Production Utilization Disposal
Ozone depletion

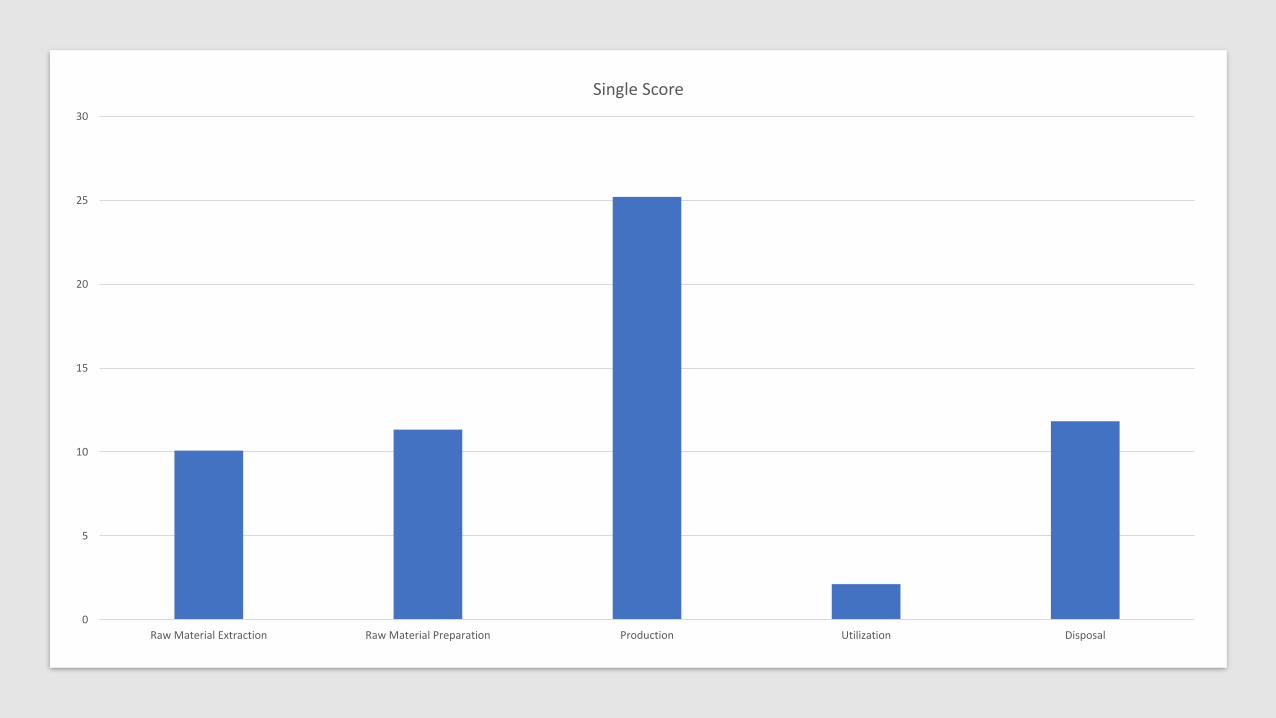
Single score allows you to easily compare theenvironmental impact of different products or scenarios, orstage in the life cycle. It is much easier to explain a singlescore for environmental impact than it is to explain 3 to 18different scores per product or scenario.
All environmental impact scores are converted with asingle unit and then added to determine a single scoreamount.
Single Score
0
5
10
15
20
25
30
Raw Material Extraction Raw Material Preparation Production Utilization Disposal
Single Score

• Production stage has the biggest damage amongthe life cycle stages of producing single-use plasticcarrying bags.
• It is encouraged to adapt to reusable bags.
Conclusion

Based from a study (Biona, 2017), Reusable bags has considerably less environmental impact compared to plastic bags and paper bags.
Conclusion
0.00E+00
1.00E-01
2.00E-01
3.00E-01
4.00E-01
5.00E-01
6.00E-01
7.00E-01
Sin
gle
Sco
re
GWP AP ODP HTP NP PCOP EP Flooding Landfill Fossil Energy Use
Total Local External Total Local External Total Local External
Plastic Paper Non-Wooven PP
Source: Biona, 2017
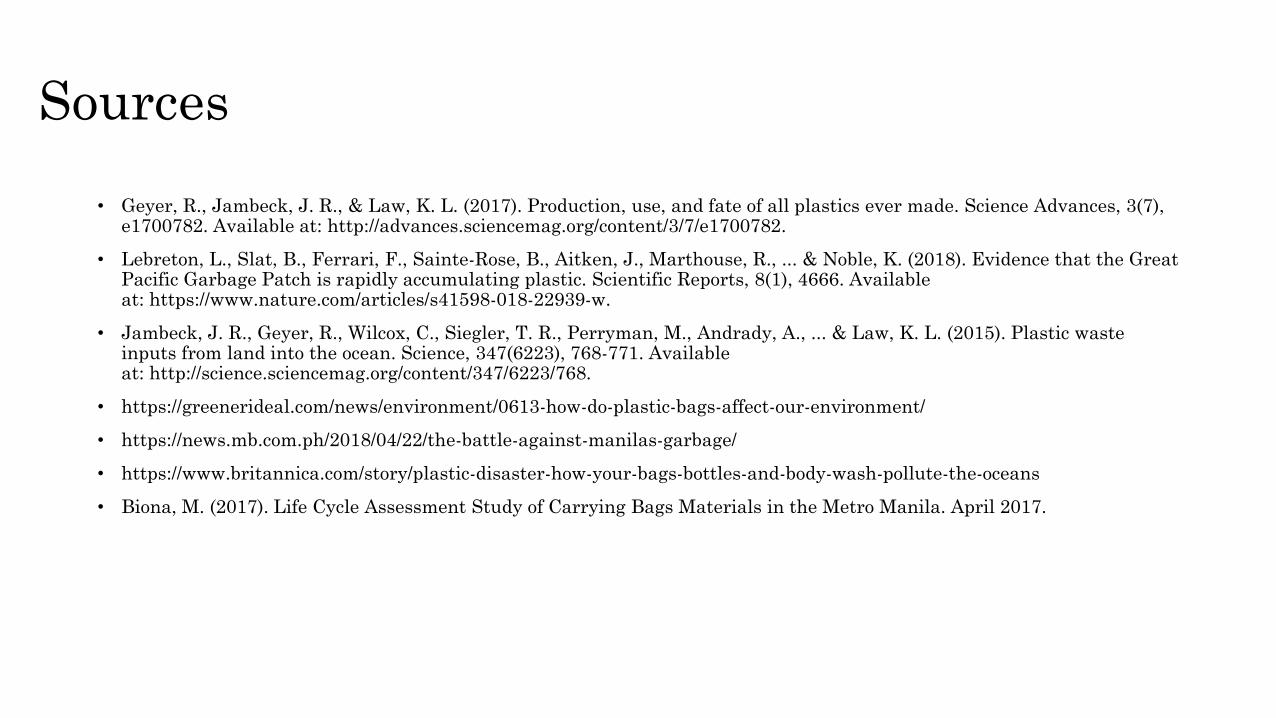
Sources
• Geyer, R., Jambeck, J. R., & Law, K. L. (2017). Production, use, and fate of all plastics ever made. Science Advances, 3(7), e1700782. Available at: http://advances.sciencemag.org/content/3/7/e1700782.
• Lebreton, L., Slat, B., Ferrari, F., Sainte-Rose, B., Aitken, J., Marthouse, R., ... & Noble, K. (2018). Evidence that the Great Pacific Garbage Patch is rapidly accumulating plastic. Scientific Reports, 8(1), 4666. Available at: https://www.nature.com/articles/s41598-018-22939-w.
• Jambeck, J. R., Geyer, R., Wilcox, C., Siegler, T. R., Perryman, M., Andrady, A., ... & Law, K. L. (2015). Plastic waste inputs from land into the ocean. Science, 347(6223), 768-771. Available at: http://science.sciencemag.org/content/347/6223/768.
• https://greenerideal.com/news/environment/0613-how-do-plastic-bags-affect-our-environment/
• https://news.mb.com.ph/2018/04/22/the-battle-against-manilas-garbage/
• https://www.britannica.com/story/plastic-disaster-how-your-bags-bottles-and-body-wash-pollute-the-oceans
• Biona, M. (2017). Life Cycle Assessment Study of Carrying Bags Materials in the Metro Manila. April 2017.