Embed Size (px)
Citation preview
Keith W. Cunningham, PhDAlaska Satellite Facility
November 13, 2009
LiDAR for Urban Change Detection

3rd ALOS Joint PI Symposium, 9-13 Nov. 2009 Keith W. Cunningham, PhD 1
LiDAR
• LiDAR – Light Detection and Ranging
• Building Footprints – GIS outlines (planimetrics)
• GIS – Geographic Information System
• Planimetrics – GIS data of buildings & curbs
• Change Detection – Comparing differences in data

3rd ALOS Joint PI Symposium, 9-13 Nov. 2009 Keith W. Cunningham, PhD 2
Laser Sweeps the groundScan perpendicular to flight line
LiDAR Scanning
0.10 cm
50 cm25 cm
2,000 meters
1,000 meters
0.10 cm
70 cm
The laser beam divergesMore divergence with distance
The laser “samples” the groundOblique samples are larger

3rd ALOS Joint PI Symposium, 9-13 Nov. 2009 Keith W. Cunningham, PhD 3
First Return
Last Return
One Return
Second Return
Third Return
LiDAR Returns
3rd ALOS Joint PI Symposium, 9-13 Nov. 2009 Keith W. Cunningham, PhD 4
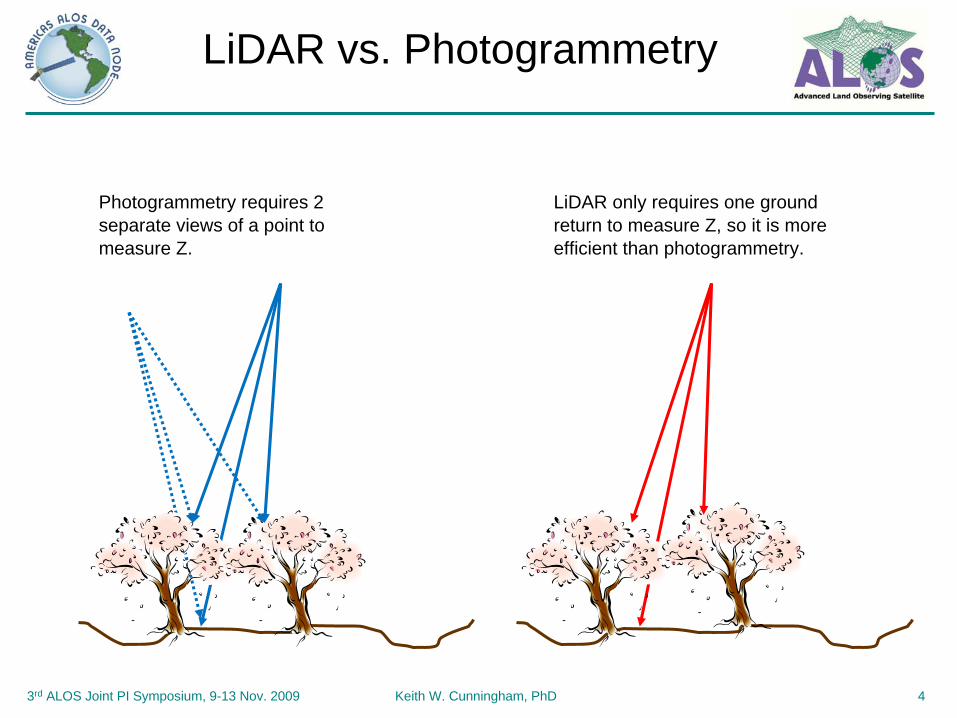
LiDAR only requires one ground return to measure Z, so it is more efficient than photogrammetry.
Photogrammetry requires 2 separate views of a point to measure Z.
LiDAR vs. Photogrammetry

3rd ALOS Joint PI Symposium, 9-13 Nov. 2009 Keith W. Cunningham, PhD 5
LiDAR Data & “Postings”
ASCII data with XYZ posting values – same data rendered in a GIS layer.

3rd ALOS Joint PI Symposium, 9-13 Nov. 2009 Keith W. Cunningham, PhD 6
LiDAR “Postings”
Postings are not a regular grid, rather an irregular sampling.
3rd ALOS Joint PI Symposium, 9-13 Nov. 2009 Keith W. Cunningham, PhD 7
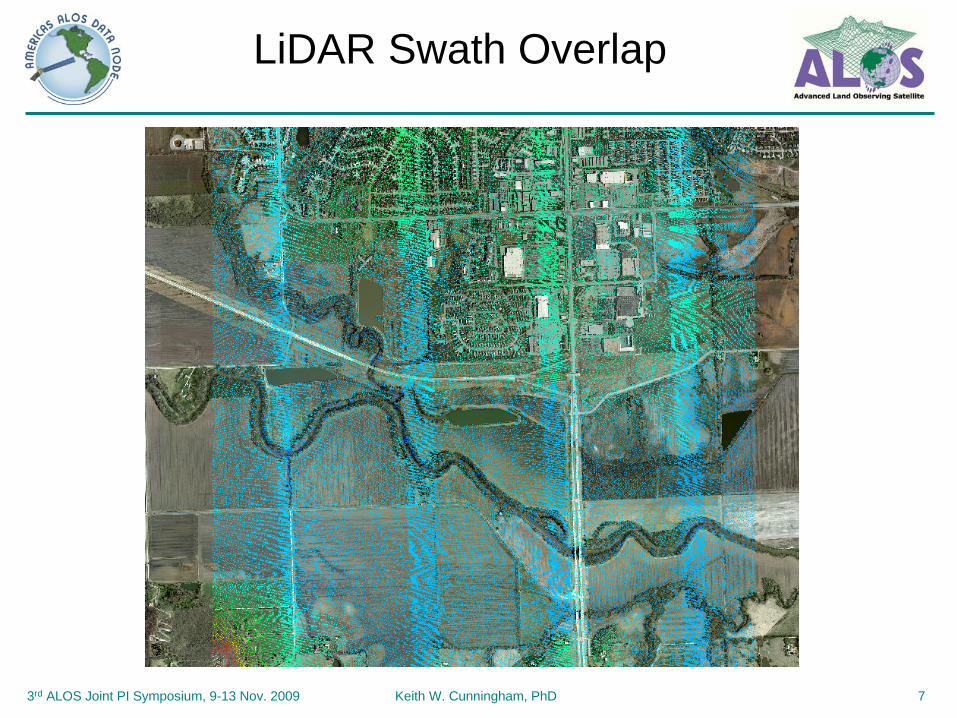
LiDAR Swath Overlap

3rd ALOS Joint PI Symposium, 9-13 Nov. 2009 Keith W. Cunningham, PhD 8
LiDAR Point Cloud
3rd ALOS Joint PI Symposium, 9-13 Nov. 2009 Keith W. Cunningham, PhD 9
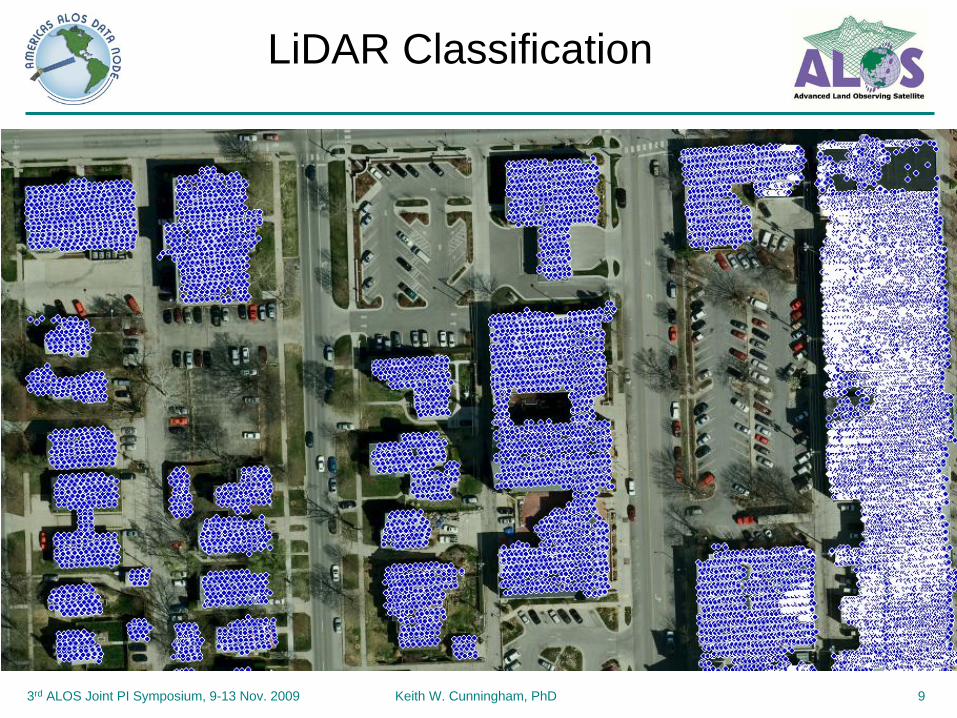
LiDAR Classification

3rd ALOS Joint PI Symposium, 9-13 Nov. 2009 Keith W. Cunningham, PhD 10
Feature Extractiona) Aerial image. b) Elevations as gray value image. c) Gradient magnitude image. d) LiDAR postings & TIN e) Edge & Corner DetectionMartin Huber, et al 2007
LiDAR Modelling
(a) (b) (c)
(d) (e)

3rd ALOS Joint PI Symposium, 9-13 Nov. 2009 Keith W. Cunningham, PhD 11
LiDAR Edges & Corners

3rd ALOS Joint PI Symposium, 9-13 Nov. 2009 Keith W. Cunningham, PhD 12
Masking Example
3rd ALOS Joint PI Symposium, 9-13 Nov. 2009 Keith W. Cunningham, PhD 13
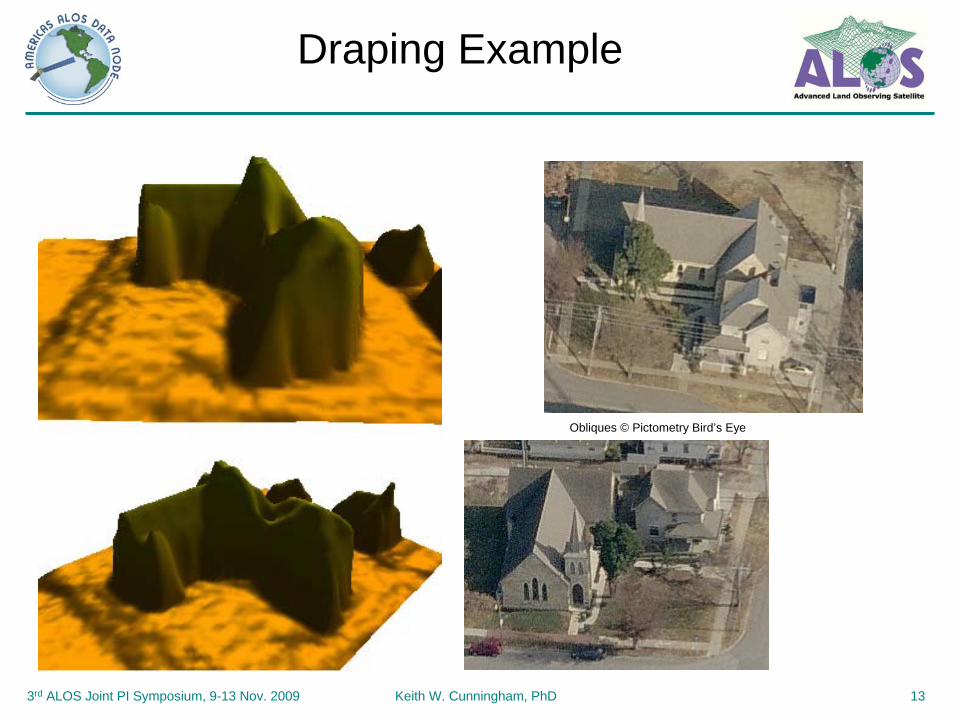
Draping Example
Obliques © Pictometry Bird’s Eye

3rd ALOS Joint PI Symposium, 9-13 Nov. 2009 Keith W. Cunningham, PhD 14
LiDAR Mask Dilation

3rd ALOS Joint PI Symposium, 9-13 Nov. 2009 Keith W. Cunningham, PhD 15
LiDAR Footprint Extraction
3rd ALOS Joint PI Symposium, 9-13 Nov. 2009 Keith W. Cunningham, PhD 16
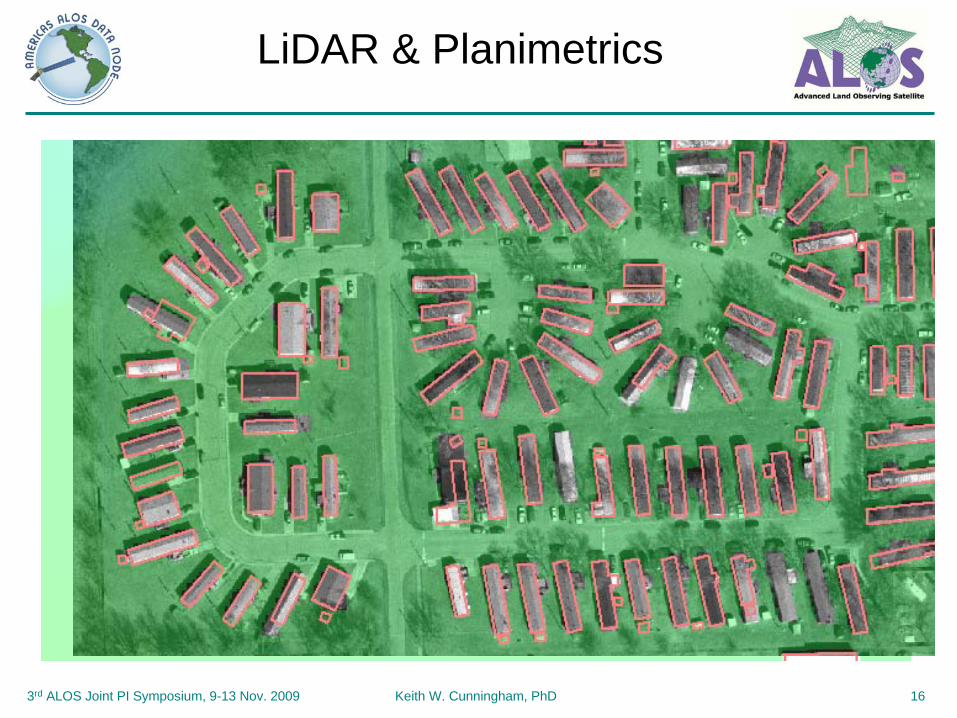
LiDAR & Planimetrics

3rd ALOS Joint PI Symposium, 9-13 Nov. 2009 Keith W. Cunningham, PhD 17
Id Roof Lidar Diff0 1526 1490 97.6%
1 1371 1360 99.2%
2 1566 1910 122.0%
3 2519 2460 97.7%
4 1648 1610 97.7%
5 1767 1790 101.3%
6 1746 1760 100.8%
7 2071 1990 96.1%
8 1506 1670 110.9%
9 2495 2240 89.8%
10 1965 1690 86.0%
11 809 1030 127.3%
12 378 na
13 1828 1680 91.9%
14 1888 1670 88.5%
15 1508 1530 101.5%
16 1531 1380 90.1%
17 1782 1490 83.6%
18 2050 2100 102.4%
19 1677 1630 97.2%
20 1815 1700 93.7%
21 1528 1410 92.3%
22 1287 1080 83.9%
23 781 658 84.3%
24 1388 1590 114.6%
25 1197 1240 103.6%
26 2285 2280 99.8%
27 2160 2070 95.8%
28 1630 1710 104.9%
Average % 98.4
LiDAR vs. Heads-Up Digitizing

3rd ALOS Joint PI Symposium, 9-13 Nov. 2009 Keith W. Cunningham, PhD 18
• Create LiDAR structure “Mask”
• Compare Structure Footprint with Mask
• Automated Change Detection– In a spreadsheet– Map Algebra
LiDAR Change Detection

3rd ALOS Joint PI Symposium, 9-13 Nov. 2009 Keith W. Cunningham, PhD 19

3rd ALOS Joint PI Symposium, 9-13 Nov. 2009 Keith W. Cunningham, PhD 20
1.8 meter postingsStructure MaskingAuto Change Detection using Ratio Analysis
LiDAR Ratio Analysis
3rd ALOS Joint PI Symposium, 9-13 Nov. 2009 Keith W. Cunningham, PhD 21
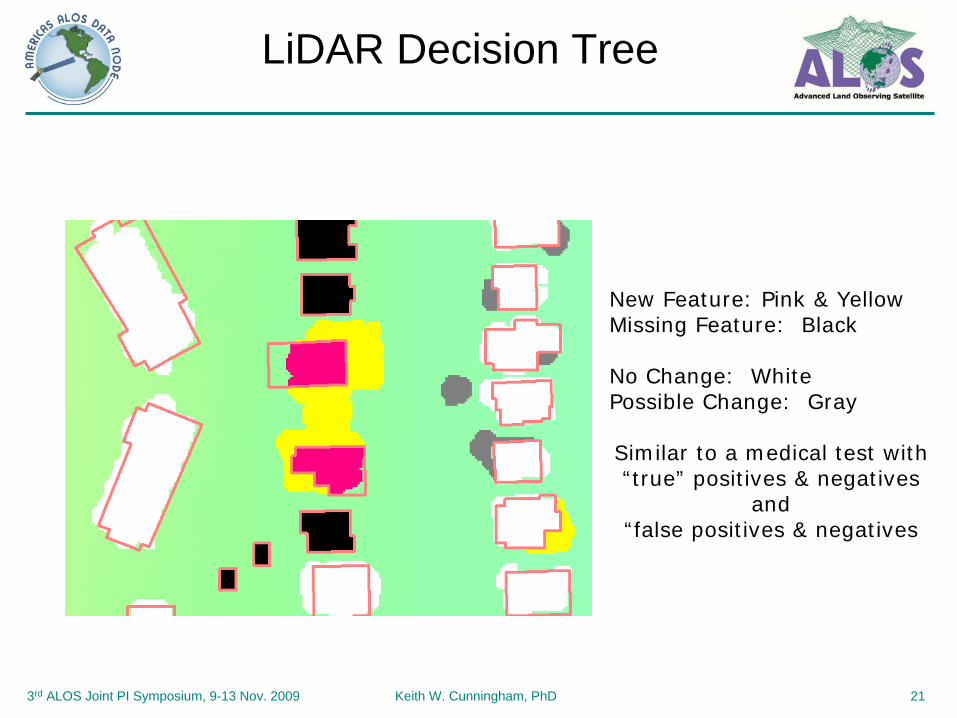
New Feature: Pink & YellowMissing Feature: Black
No Change: WhitePossible Change: Gray
Similar to a medical test with “true” positives & negatives
and “false positives & negatives
LiDAR Decision Tree

3rd ALOS Joint PI Symposium, 9-13 Nov. 2009 Keith W. Cunningham, PhD 22
Change Validation
3rd ALOS Joint PI Symposium, 9-13 Nov. 2009 Keith W. Cunningham, PhD 23
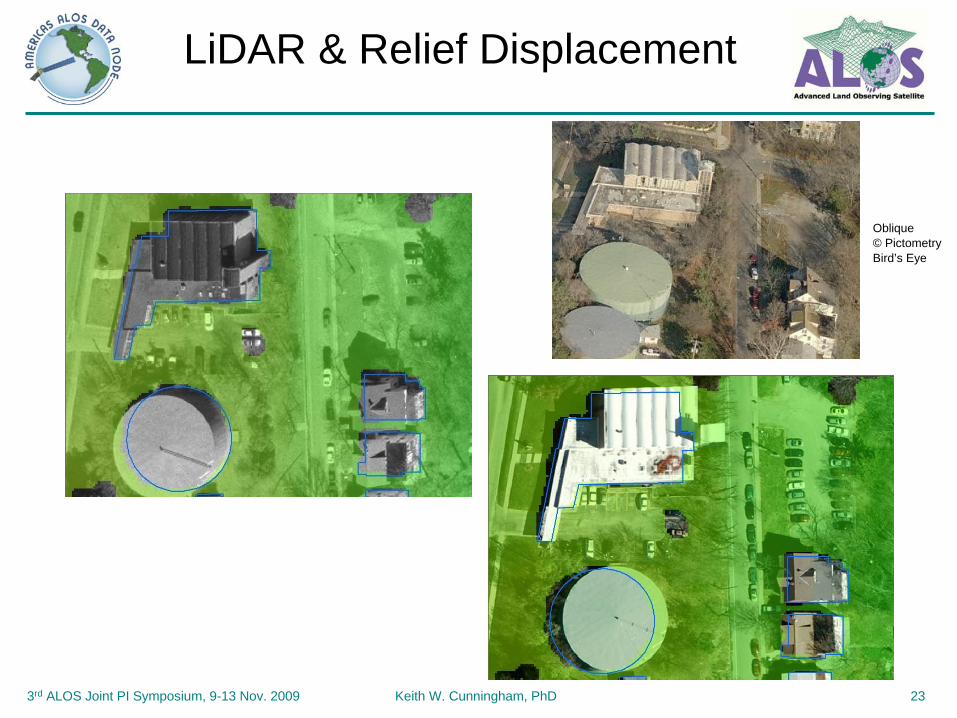
LiDAR & Relief Displacement
Oblique© PictometryBird’s Eye

3rd ALOS Joint PI Symposium, 9-13 Nov. 2009 Keith W. Cunningham, PhD 24
Thank You
Keith W. Cunningham, PhD– Alaska Satellite Facility