Embed Size (px)
Citation preview

!?iscus~ion papertn
LIBHAR(
L~~!4 J GIA ~I\IINI FOUIJDA 10, OF
AGRlCUUURAL ":CONQr/!!fS
Ecological Economics Series Editor Dr. Chlle L. Spash
94/2
THE BENEFITS OF PREVENTING CROP LOSS DUE TO TROPOSPHERIC OZONE
CLIVE L SPASH
MARCH 1994
Environmental Economics Research Grol!QJ --Departfllent of Economics
JIniversity of Stirling I

STIRLINC DISCUSSION PAPERS IN ECOLOGICAL ECONOMICS
1994 SERIES
94/1 Preferences, Information and Biodiversity Preservation Clive L Spash and Nick Hanley, March 1994
94/2 The Benefits of Preventing Crop Loss Due to Tropospheric Ozone Clive L Spash, March 1994
94/3 Sources of Energy and the Environment Clive L Spash and A Young, March 1994
94/4 Economic Instruments and Waste Minimization: the Need for Discard- and Purchase-Relevant Instruments Nick Hanley and R Fenton (University of Winnipeg), March 1994
94/5 The Effects of Information in Contingent Markets for Environmental Goods Nick Hanley and Alistair Munro (University of East Anglia), March 1994
94/6 Cost-Benefit Analysis and the Greenhouse Effect Clive L Spash and Nick Hanley, March 1994
Copies available from Departmental Secretary, Department of Economics, University of Stirling, Stirling FK9 4LA. The series is circulated on an exchange basis to academic and other institutions, while single copies are available at £3. Cheques/money orders in sterling should I Ie made payable to The University of Stirling.
THE BENEFITS OF PREVENTiNG CROP LOSS
DUE TO TROPOSPHERIC OZONE
by
Clive L. Spash
INTRODUCTION
The topic of this paper is ozone smog or tropospheric ozone pollution and the assessment of
one aspect of this problem: impacts on agricultural crops. However, the techniques and their
problems are applicable to a wide range of impacts from materials damages to human health
effects. In addition, the methods explained have been applied to agricultural damages related
to both acid deposition (see Adams and McCarl, 1985a) and global climate change (Adams
et aI., 1988). The concentration here is on the estimation of the tangible benefits from
policies 10 reduce tropospheric ozone concentrations.
TROPOSPHERIC OZONE POLLUTION
Ozone at the tropospheric level (the lowest 10-15 kilometres of the atmosphere) is a separate
issue from ozone holes in the upper atmosphere (the stratosphere). All references to ozone
here are to tropospheric ozone, unless otherwise stated. While perhaps a less dramatic issue,
tropospheric ozone is a well-documented cause of a range of environmental impacts, and is
commonly associated with the urban pollution problems of cities such as Los Angeles, Tokyo
and Athens. Photochemical oxidants, of which ozone is the most prevalent, are capable of
causing plant damage, affecting human health, disrupting ecosystem structures and stability,
and reacting with a number of non-biological materials (e.g., rubber), as well as forming a
visibility-reducing blue haze. As the most prevalent photochemical oxidant, ozone has been
studied extensively and is commonly used as the basis for photochemical oxidant air quality
standards.
Injury to plants from photochemical smog was first noted in 1944 when stippling and glazing
or bronzing of the leaves of vegetables were discovered in the Los Angeles basin, California.
1
Tropospheric ozone concentrations alone or in combination with sulphur dioxide and nitrogen
dioxide have since been identified as the major source of crop losses caused by air pollution
in the United States (Heck et aI., 1982). The scientific evidence is growing that both ozone
and acid depositi~n are causing extensive damage to vegetation in both Europe and the U.S.
(see MacKenzie and EI-Ashry, 1989).
Sources of Ozone
Ozone is formed in the atmosphere from "precursor emissions". Non-methane hydrocarbons,
nitrogen dioxide and nitric oxide are the main precursor emissions causing oxidant formation.
Naturally occurring, background tropospheric ozone varies seasonally and with latitude, but
is normally assumed constant, e.g., 0.025 ppm (parts per million) measured over seven hours
of daylight during the growing season (i.e., 7 hours/day seasonal) in U.S. experiments on
plant response (Heck et aI., 1984). Recognition of the existence of a background level
implies a base concentration which policies designed to control anthropogenic sources will
leave unaffected.
The basic process of ozone formation is a part of the nitrogen dioxide photolytic cycle.
Oxygen atoms (0) are derived principally from the dissociation of nitrogen dioxide (N02) by
solar radiation: N02 + ultra-violet radiation = NO + O. This atomic oxygen reacts rapidly
with molecular oxygen (02) to form ozone (0): 0 + O2 = OJ. Ozone in turn reacts with
nitrogen oxide (NO) to form nitrogen dioxide again: NO + OJ = N02 + O2•
The transportation sector is normally the primary source of anthropogenic ozone precursors.
Hydrocarbons released from vehicle exhausts unbalance the naturally occurring nitrogen
2

dioxide cycle by converting nitrogen oxide to nitrogen dioxide without consuming an
equivalent amount of ozone. The resulting concentration of ozone varies with temporal
variations in precursor emissions (e.g., rush-hour traffic), atmospheric dispersion capacity, and
the intensity of solar radiation. The multiple input of pollutants (cumulative loading) as a
parcel of air moves across a region can cause downwind (e.g., rural) areas to receive high
ozone concentrations absent from upwind (e.g., urban) monitoring stations. For example,
there is clear evidence of the effects of such cumulative loading on areas downwind of the
London plume (Varey et aI., 1980).
Primary and Secondary Standards
The approach to ozone regulation taken by the United States consists of a primary standard
designed to protect human health, and a secondary standard to protect other aspects of human
welfare (e.g., materials, crops, visibility). The primary standard aims to protect the health of
even the most sensitive members of the public with a safety margin. The initial U.S. national
ambient air quality standard for ozone was set in 1971 at 0.8 ppm for both standards, not to
be exceeded more than one hour per year. Review of the standards in 1979 relaxed both to
0.12 ppm, with the standard not to be exceeded on an average of three days over three
consecutive years. While economic information has no role in setting these standards,
economists have attempted to measure the social costs of pollution to assess whether a
particular standard should be supported. In this respect the relaxation of the ozone standard
from 0.08 ppm to 0.12 ppm led to several studies of the economic implications for crop
production. In addition, there is good reason to have different primary and secondary
standards and to adopt alternative measures of concentration for each, given the different
damages society is trying to prevent in each case.
3

[n Europe ozone itself is uncontrolled. This might imply that ozone is either below levels at
which damages occur or that current controls of precursor emissions are sufficient. However,
the persistence of ozone smogs in cities such as Athens suggests othelWise. The trend
towards hot dry 'summers implied by global warming will increase the concentration of
tropospheric ozone from available precursors. [n addition, precursor emissions will increase
with the volume of traffic, which is rising with both population and car ownership per capita,
as well as with sales to the previously unexploited market of the former Eastern bloc. Thus,
ozone control is likely to be a policy issue across Europe in the near future.
DEF[NING DOSE
The effects of air pollution on vegetation are influenced by biotic, climatic and edaphic (i.e.,
soil) variables. Inherent genetic resistance has been cited as probably the most important
factor influencing plant response to air pollutants. Plant response to ozone varies among
species of a given genus (e.g., potato) and varieties or cultivars within a given species
(Linzon, et aI., [984).
Ozone, as with other air pollutants, damages a plant after entering the stomatal leaf opening
(Holdgate, 1979). Thus, factors affecting stomatal size and opening determine pollutant
uptake and the potential for damage. For example, reduced moisture or increased temperature
can cause reduced stomatal apertures and higher resistance to air pollution. Plants under no
such stresses, growing under favourable conditions, may therefore be more susceptible to
damage. [n general, plants are better able to cope with exposure to ozone at night (because
stomata are closed), and at lower temperatures and relative humidity; they are more
susceptible to ozone damage when the leaves are mature, due to the increase in cell gaps
4

(Medeiros and Moscowitz, 1983).
Farm practices may also alter plant response to air pollution. For example, attempts to
improve growing conditions (e.g., irrigation) and reduce plant stress could increase ozone
susceptibility. The mixture of production inputs is a factor often ignored in the derivation of
dose-response functions under experimental conditions (Adams and Crocker, 1984). Cultural
and input variations between regions make dose-response functions which have been derived
in one area inappropriate for use in another area. Even when the same inputs and cultivars
are used in two different regions, all the other factors would have to concur before a dose
response function derived in one region could be used accurately to predict the yield loss in
the second region. This problem is an important criticism of current dose-response methods.
The ambient ozone concentration, the length of time a particular concentration persists and
the frequency of occurrences combine to form a measure of the dose of an air pollutant to
which a plant is exposed: the "exposure dose". Other characteristics of plant exposure may
also be important determinants of the nature and magnitude of the effects of ozone on plants:
the length of time between exposures, the time of day of exposure, their sequence and pattern,
and the total flux of ozone to the plant as it is affected by canopy characteristics and leaf
boundary layers. However, as Table I shows, ozone studies into crop productivity have
largely defined exposure dose in terms of concentration, duration and frequency to the
exclusion of other factors.
5
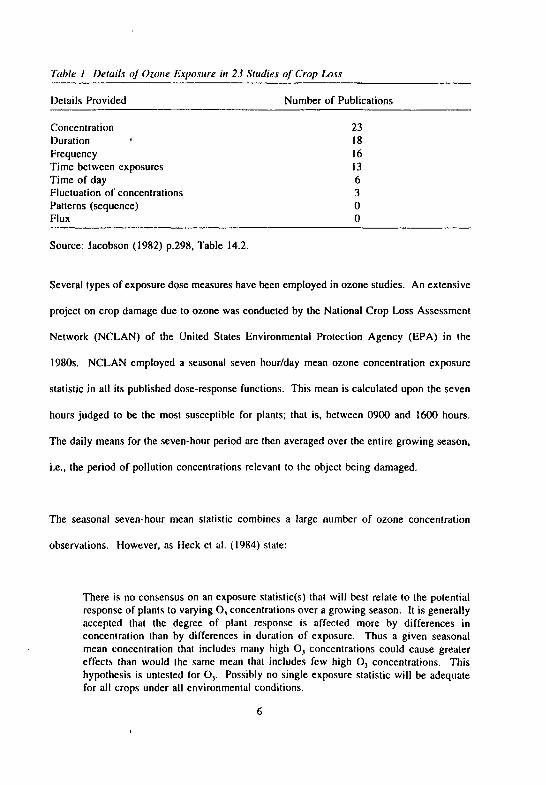
Table I Details of Ozone Exposure in 23 Studies of Crop Loss
Details Provided Number of Publications
Concentration Duration Frequency Time between exposures Time of day Fluctuation of concentrations Patterns (sequence) Flux
Source: Jacobson (1982) p.298, Table 14.2.
23 18 16 13 6 3 o o
Several types of exposure dose measures have been employed in ozone studies. An extensive
project on crop damage due to ozone was conducted by the National Crop Loss Assessment
Network (NCLAN) of the United States Environmental Protection Agency (EPA) in the
1980s. NCLAN employed a seasonal seven hour/day mean ozone concentration exposure
statistic in all its published dose-response functions. This mean is calculated upon the seven
hours judged to be the most susceptible for plants; that is, between 0900 and 1600 hours.
The daily means for the seven-hour period are then averaged over the entire growing season,
i.e., the period of pollution concentrations relevant to the object being damaged.
The seasonal seven-hour mean statistic combines a large number of ozone concentration
observations. However, as Heck et al. (1984) state:
There is no consensus on an exposure statistic(s) that will best relate to the potential response of plants to varying 0, concentrations over a growing season. It is generally accepted that the degree of plant response is affected more by differences in concentration than by differences in duration of exposure. Thus a given sea~onal mean concentration that includes many high 0) concentrations could cause greater effect~ than would the same mean that includes few high 0) concentrations. This hypothesis is untested for 0). Possibly no single exposure statistic will be adequate for all crops under all environmental conditions.
6

The implication is that high ozone concentrations may be lost in the statistic but could be an
important explanation of crop loss and therefore need to be taken into account. Thus,
NCLAN discussed the use of alternative exposure statistics such as the peak (maximum) daily
seven-hour mean ozone concentration occurring during the growing season; the seasonal mean
of the daily maximum one-hour mean ozone concentrations; and the peak (maximum) one
hour mean ozone concentration occurring during the season.
The measure of dose used must be compatible with ambient air quality data to enable the
development of useful predictive models (Heck et aI., 1980). Typically, ozone standards are
set where the primary concern is with the threshold for acute damage to human health, and
may therefore be inappropriate for dose-response studies. In order to use a different exposure
statistic for a standard and a response model, the distribution of ozone in the ambient air
needs to provide a basis for using one statistic as a surrogate for another. For example,
assume that a seasonal average concentration is discovered at which there is no crop loss, and
that this seasonal average is never exceeded when a certain hourly peak ozone concentration
is not exceeded. Under these circumstances the analyst can reasonably assume that crops are
protected when the hourly peak is not exceeded. Unfortunately, the seasonal mean can vary
widely, while the peak value remains constant and is unlikely to always remain at or below
a certain value. The implication for ozone standards is that they should employ concentration
measures which relate to chronic, as well as acute, damage.
DERIVING DOSE-RESPONSE FUNCTIONS FOR CROPS
Three main approaches have been employed to derive dose-response relationships for ozone:
(a) foliar injury models, (b) secondary response data and (c) experimentation.
7

(a) Foliar Injury ModelS
Early studies assumed a threshold below which no damage was presumed to occur and related
this to visible, normally foliar, injury. These foliar injury models can be misleading' a~ signs
I
of yield loss because tubers, roots and dry weight, among other factors, can be affected
without visible damage. Conversely foliar injury may overestimate damage because some
plants can suffer severe leaf damage without loss of photosynthetic ability, and recovery from
visible injury can be quick (Leung, et aI., 1978). Generally, three types of response to air
pollution can be defined; visible injury symptoms, growth responses and quality changes.
Foliar injury models ignore "hidden injury" which may occur with the laller two responses.
Medeiros and Moscowitz (1983, p.506) note that:
Hidden injury may include: (I) reduced photosynthetic activity, (2) accumulation of a pollutant or its byproducts within a leaf, (3) an overall unhealthy appearance without necrotic lesions, (4) reduced growth or yield, and (5) increased susceptihility to disease, particularly insect invasion.
Studies with soybeans, tomatoes, annual rye grass, spinach, wheat, lettuce and potatoes have
demonstrated that folia~-symptom production is an unreliable index of ozone effects on plant
growth or yield (Jacobson, 1982).
(b) Secondary Response Dalll
Cross-sectional analysis of crop yield data is used to obtain dose-response functions via
regression techniques. Information is required on the existing outdoor variations in air
pollution, actual crop yields and other environmental factors. Such an approach can save time
and moncy compared to the use of chamber studies under the experimental approach,
discussed below.
8

Leung et al. (1982) obtained statistically significant results for nine crops using this technique;
however, the results were sometimes inconsistent when compared to experimental chamber
studies, and ozone levels in the study region were high. Rowe and Chestnut (1985) attempted
to derive dose-response functions for 10 crops but could only obtain significant results for
four of these. They found that the success of the approach was generally dependent upon the
effort made to measure and incorporate non-air pollution variahles in the yield functions.
Generally, their results suggested that ozone was causing yield losses, but the secondary data
regression approach captured the effects for only the most sensitive crops, i.e., those which
experienced high rates of damage at low ozone levels such as dry beans. cotton, grapes and
potatoes.
(c) Experimentation
Several experimental approaches have been developed in studies of ozone effects on crops;
these include the use of greenhouses, field chambers (open-top or close-top). unenclosed field
plots and the pollution gradient approach. Each approach varies in design or exposure system
but, for use in economic assessments, the environmental and exposure conditions occurring
on actual farms should be replicated, with only air pollution concentration being modified
(Unsworth, 1982). While general responses to ozone of plants grown in different
environments may be similar, the quantitative relationships between dose and response are
clearly affected by environmental conditions.
RESPONSE FUNCfIONS IN ECONOMIC ASSESSMENTS
Response functions derived from a variety of methodologies have been applied in economic
assessments of air pollution damage to agricultural crops. Early work in this area depended
9

upon trained field observers using their judgement to estimate crop damage from visible
symptoms (US EPA, 1974). These subjective estimates (often arbitrarily converted into
monetary values) were replaced by foliar injury models. In turn, foliar injury models have I
been found deficient in several aspects, and response functions derived from scientific field
experimentation are now commonly applied in economic assessments.
As Table 2 shows for the U.S., to out of 15 studies since 1982 have relied upon NCLAN
response data, derived from field experiments, as their main source. Of the six studies
recently carried out at the national level (for the U.S.), all used the NCLAN data. At the
regional level a mixture of data sources is often used. For example, the two studies using
secondary data, discussed above, also made use of experimental data for some crops.
NCLAN data is a primary source of response information but has so far been restricted to
major U.S. agricultural crops. Thus the research of other scientists is employed for important
regional crops.
Table 2: Main Source(s) of Response Functions Used in /5 Recent Economic Studies of Ozone Effects on Agrimlture
Source of Dose-Response Data
Experimentation:
Secondary Foliar injury Field observation
NCLAN Other
Source: Spash (1987), Table II.
Number of Publications
10 3 2 I o
While the derivation of response functions used in economic assessments has improved, the
application of the functions has sometimes been both technically and economically deficient.
10

Serious errors can arise from extrapolating from a limited data base. For example, the
Organization for Economic Cooperation and Development (OECD, 1981) performed a cost
benefit analysis of sulphur oxide which included the benefits expected from crop loss
reductions under various scenarios. A dose-yield relationship was developed from information
on the response to sulphur dioxide of rye grass (Lolium perenne) and applied to all crops
throughout Europe. Barnes et al. (1983) have made the following major criticisms of this
study:
(i) It ignored crop and cultivar sensitivities: rye grass is one of the crops most sensitive
to sulphur dioxide, resulting in over-estimation of damages.
(ii) It ignored differences in soil sulphur conlenl: lhe rye grass sludies used gave the planl
nutritionally adequate supplies, again leading to over-estimation of damage because
nutrient-deficient soils actually benefit from sulphur deposition.
(iii) Over-estimation was created by extended extrapolation beyond plant threshold and
background pollutant levels, thus creating the illusion of damages when they would
be absent or irrelevant to the control of anthropogenic sources.
(iv) The research into rye grass used was mostly from laboratory or greenhouse
experiments. This can give results varying widely from plant response to sulphur
oxide under field conditions.
This kind of extrapolation and use of response functions ignore the limits of the data base.
11

The application of one set of results to other crops, cultivars, regions or countries abstracts
from variations in plant sensitivity and environmental conditions. However, a certain amount
of extrapolation can be justified. In the case of ozone, data are unavailable for many
I
regionally important crops and cultivars; so far, experimental results are largely derived for
the major crop-growing regions of the U.S. In the absence of alternative data, "surrogate"
response functions have been used for crops judged to be of similar sensitivity. For example,
Howitt et al. (1984) studied the economic effects of ozone on \3 crops. They used NCLAN
data for 7 crops and derived 5 "surrogate" response functions. Such use of response data
relies upon the judgement of researchers and implicitly involves the subjective estimation of
uncertainty. This type of probabilistic estimation requires explicit explanation of the areas
of uncertainty so that the accuracy of, and possible bias in, the final results are clear.
REGIONAL ECONOMIC ASSESSMENTS OF CROP LOSS
The majority of recent economic assessments of ozone damage to crops have been at the
regional level, and these have employed a range economic modelling techniques (Adams et
aI., 1984b gives a review of some national level studies). The work done in this area before
circa 1982 was scientifically orientated and concentrated upon the accuracy of physical
estimates of ozone damage to crops. Where monetary values of damages were given, the
traditional model was employed without regard for the over-estimation this technique can
cause. Published studies have concentrated on two main regions of the U.S.; namely. the
Corn Belt (Illinois. Indiana. Iowa. Ohio and Missouri) and California. These areas have a
good supply of data on crop response and air quality. and are nationally important crop-
growing regions.
12

A Traditional Study
Linzon et al. (1984) analysed 15 crops grown in two regions of Ontario. Canada. Yield
reductions were estimated for each crop using the experimental results of other researchers.
No damage was assumed to occur at ozone levels of 0.03 ppm or lower (seven hour seasonal
average). The traditional model was used to calculate monetary equivalents of the
approximated crop losses. Increased yields. due to pollutant reduction, were multiplied by
the current market price to give a producer benefit estimate equal to total revenue; extra
production costs were deemed too small for subtraction. The constancy of price assumption
was justified (a) by the small magnitude of crop production from the region relative to total
market production, and (b) by the existence of supply management and Marketing Boards.
The fact that aggregate supply curves are normally positively sloped was ignored by Linzon
et al.; thus the disjointed function of the traditional model was implicitly accepted. As has
been discussed, the traditional model seems certain grossly to over-estimate the gain to
producers from ozone reductions. This study estimated the average gain to producers of
reducing ozone from current levels (the highest regional category being 0.05 ppm, 7hr
seasonal mean) to 0.03 ppm as $15 million per annum, with a range of $9 to $23 million
(1980 dollars). Five crops accounted for over 80% of the estimate due to their sensitivity to
ozone - namely, potatoes, soybeans, tobacco, wheat and white beans.
Quadratic Programming Approaches
Four economic regional studies of ozone crop losses published since 1982 have used the price
endogenous QP approach. Three of these were based on the agricultural cro~-growing regions
of California and employed similar models. The fourth study generated welfare estimates via
13

a micro-macro model, using farm models to derive the effects of regional production changes
on national markets.
Adams et al. (1982) studied 14 field crops in four regions of southern California. The dose
response functions are a major weakness of the study, being calculated from foliar injury
models which have been converted to reflect yield loss. This approach showed broccoli,
cantaloupes, carrots, cauliflower and lettuce to be ozone resistant, with little or no damage
occurring. Lettuce in particular seems to be incorrectly classified, with evidence existing
which states it to be an ozone sensitive crop. The optimal crop mix after ozone
concentrations were reduced showed a very significant decrease in the production of these air
pollution tolerant crops, due to their substantially reduced profitability relative to crops that
were more sensitive to ozone.
Linear inverse demand functions were assumed for each crop, i.e., price as a function of
quantities. The supply functions for all production inputs were assumed to be perfectly price
elastic. The Willig approximation conditions were invoked so that any differences between
ordinary and compensated consumers' surplus were assumed to be trivial. This invocation
was justified because neither income elasticities nor expenditures as a percentage of income
seemed likely to be large for the crops being studied.
The model (calibrated to 1976) was set up to maximize the sum of producers' and consumers'
surpluses. Reducing ozone levels to 0.08 ppm, the state standard, would have increased 1976
producer quasi-rents by $35.1 million and consumers' surplus by $10.1 million. Production
changes induced hy altering ozone concentrations were assumed to leave the input mix
14

constant. Changes in ozone concentrations from 1976 levels were reflected by changes in the
optimal mix of outputs. Due to the variety of demand price elasticities across crops. the
distribution of benefits was a function of the mix of demand curves and resultant crop
proportions in the solution. For example. the removal of cotton from the study caused the
balance between consumers' and producers' surpluses to be reversed. Cotton has an elastic
demand curve. so that the benefits from ozone reduction were largely in terms of a producers'
surplus. The exclusion of cotton reduced the producers' gain to $9 million and left the
consumers' gain almost unchanged at $10 million.
Although mitigation was allowed for by cross-crop substitution. the authors felt that the use
of fixed 1976 production coefficients and resource levels potentially constrained the possible
producer mitigative adjustments on the input side. Thus. they warned that the subsequent
programming results and welfare effects might be over-estimated. They also suggested.
among other things. that improvements could be made by allowing for non zero cross-price
elasticities. widening the scope to include effects in other regions and markets and studying
a greater variety of crops.
Howitt et al. (1984) studied 13 crops. also in the state of California. They employed the
NCLAN experimental results to derive dose-response functions for seven of the crops and
other experimental results for one other crop. The remaining five crops were given
"surrogate" response functions. The California Agriculture Resources Model (CARM) was
used to calculate consumers' and producers' surpluses. This QP model allowed for
constrained cross-crop substitution and included 27 other crops which, were assumed
unaffected by ozone concentrations. The model was similar to that used by Adams et al.
15

(1982) above but was calibrated to 1978 instead of 1976.
Three ozone scenarios were compared with a base case for 1978. The total welfare gain from
a reduction in ambient ozone of approximately 25 per cent (to 0.04 ppni, seasonal seven-hour
average) was $35.8 million per annum, and the welfare loss from an increase in ozone levels
by approximately 33% (to 0.08 ppm, seasonal seven-hour average) was $157.3 million. (These
percentage estimates are given in Adams et aI., 1984, p.IO.) Reductions in ozone
concentrations cause a "downward shift" of the supply function, which is shown graphically
as a rotation, i.e., the price intercept remains the same.
Rowe and Chestnut (1985) used the CARM, as utilised by Howitt et al. (1984), to study 16
crops in the San Joaquin Valley, California. Although 33 crops were included in the
economic model, only 16 were judged to be affected by ozone or could be supplied with
dose-response functions. The study analysed the use of field data regression to derive dose
response functions, but obtained statistically significant results for only four crops: dry beans,
cotton, grapes and potatoes. As a result, NCLAN functions were used for six other crops,
while a further six were derived from other sources and by the use of "surrogate" functions.
Three ozone scenarios were studied (0.12, 0.10 and 0.08 ppm seasonal hourly maximum) and
results were given for both consumers and producers. Sulphur dioxide was also included in
the study, but over 98% of the economic value of the agricultural damages was attributed
to ozone. If an ozone standard at which little or no crop damage was expected (defined as
0.08 ppm seasonal hourly maximum) had been met in 1978, the estimated gain to consumers
would have been $30.3 million and the gain to producers $87.1 million.
16
Adams and McCarl (1985b) studied three crops in the Corn Belt region of the U.S. with a QP
model calibrated to 1980. The dose-response functions were taken from NCLAN results for
1980-1982 and were Illinois specific. The model analysed the changes occurring throughout
the agricultural sector at the national level as a result of the adjustments in Corn Belt output,
ceteris paribus. This was achieved by characterizing regional agricultural production using
12 representative farm models. These representative farms were then used to generate supply
adjustments in the national level model. Consumers' and producers' surpluses were calculated
under two scenarios. An improvement in air quality of 25% (a reduction of ozone from 0.12
ppm to 0.08 ppm one hour seasonal average) gave total benefits of $688 million (1980), a
loss to producers of $1,411 million and a gain to consumers of $2,079 million. The other
scenario took a 50% degradation in air quality (an increase in ozone from 0.12 ppm to 0.16
ppm one hour seasonal average) and gave a total loss of benefits of $2,225 million, a
reduction of consumers' surplus by $4,986 million and an increase of producers' surplus by
$2,761 million. Increases in crop supply were found to favour consumers while reductions
in crop supply favoured producers. These distributional consequences are a result of supply
shifts in the face of a price inelastic demand curve. That is, output increases but farmers lose
out as the price falls by a relatively large amount.
Econometric Approaches
Several eC,onometric approaches have been applied to the assessment of crop damage due to
ozone pollution, including a dual model. First a model which analyses producers' surplus
changes is discussed. Published research shows variation bctween models, for cxample
concerning assumptions about the nature of agricultural crop supply curves and production
responses (see Leung et aI., 1982; Page et aI., 1982; and Spash, 1987).
17

Benson et at. (1982) studied four crops in Minnesota. Originally, six crops were to have been
studied but since dose-response functions could not be calculated for soybeans and oats, they
were dropped. Dose-response for the four remaining crops was calculated using experimental
data reported by other researchers. The dose-response functions allowed for episodic (as
opposed to chronic or acute) exposure by breaking the exposure into multiple time periods
over the growing season. The functions were applied to Minnesota using actual or simulated
county-level ozone data. This was used to derive a range of yield losses under different
ozone concentrations.
The economic analysis, using a comprehensive econometric model of U.S. agriculture, was
carried out under two separate conditions: (a) crop loss was restricted to Minnesota alone, and
Minnesota and U.S. production levels were estimated; (b) the same rate of loss as occurred
in Minnesota was assumed to occur over the entire U.S., and again Minnesota and national
production levels were estimated. A range of producer welfare estimates was derived, with
the worst case ozone level (0.12 ppm hourly concentration with ten occurrences per week)
causing a loss of $30,366,409 under assumption (a) compared to 1980 production. The worst
case estimate under assumption (b) gave a gain to producers of $67,540,745 compared to
1980 production.
The explanation for the gain under (b) is that price rises as output is restricted and the "price
effect" dominates, whereas under (a) the "production effect" dominates. The increase in the
total value of production as ozone increases is due to the price inelastic nature of demand for
the commodities studied. This "gain" to producers is in fact misleading in that: (I) costs
have risen due to ozone pollution, and so a loss of comparative advantage is suffered by all
18

affeCled farmers (the gain is al besl a short-run phenomenon as compel it ion from other
sources would drive high-cos I producers oul of Ihe industry; as Ihe authors note, scenario (a)
is more likely in the long run). (2) focusing on the "gain" to producers ignores the dynamics
of consumer and producer welfare. Benson et al. do not calculate consumers' surplus;
therefore the net change in societal welfare and the distribution of welfare changes, are
unknown. In addition, scenario (b) is highly dubious. because of the assumption that regional
dose-response/ozone estimates can be extrapolated to the national level.
Although a detailed national-level model was used, Benson's economic analysis is similar to
that of the traditional model. A comprehensive econometric model of the U.S. agricultural
sector (calibrated to 1980) was used to capture crop supply and demand across multiple
domestic and foreign markets. Despite accounting for national-level changes, the regional
model remains simplistic in that quantity is being multiplied by price in order to estimate the
"value" of production (namely producer quasi-rents). Also, cross-crop substitution is ignored
as a mitigative strategy.
A Duality Study
Mjelde et al. (1984) employed the neo-c1assical econometric model with a profit function.
Duality models are not dependent on an explicit dose-response function to estimate the
welfare c~anges from a change in crop yield. However, experimental data are required to
frame the initial hypothesis and to cross-check the resulting estimates. The profit function,
which includes ordinary economic variables and environmental variables (as fixed inputs),
shows the effects of varying ozone con\=entrations on farm profits.
19
Pollution, which is deleterious to the production process, will exert an exogenous force upon
producer decisions. Producers may respond by varying input mixes, even if they are unaware
of the phenomenon causing the observed effects. As Dixon et al. (1985, p.404) state:
A profit function that has air quality as an input can be used directly to determine the producer's loss in profit and how other inputs are adjusted in response to a change in air quality. A dose-response function, while useful in establishing cause and effect relationships, does not provide this latter type of information. Furthermore, the change in the supply of a crop can be computed directly and this response is the net effect in agricultural output, i.e., the response incorporates producer adjustments triggered by price yield effects.
Part of this theoretical advantage may be lost in the case of ozone as producer adjustments
should exclude a change of input mix. In order to compare the results of a dual study with
experimental results, such as those of NCLAN, the mix of variable inputs is assumed
constant. However, producers may adjust their output mix, but are prevented from doing so
in this study.
The study analysed three crops in lIIinois. Detailed farm level cost and production
information was made available by the lIIinois Association of Farm Business Farm
Management which provided a rich source of individual farmer data unavailable in many
other states. The study found that increased ozone levels depressed output and reduced the
marginal productivity of variable inputs so that less were used. Ozone resulted in an
aggregate loss in profits to lIIinois farmers of approximately $50 million (1980). The
assumption of a constant price ignores consumers' surplus and may be unjustified because
Illinois is a major grain producer. Also, if ozone reduction improved crop yields throughout
the Corn Belt. both consumers and producers would be expected to benefit. As the study
states (Mjelde et aI., 1984. p.361):
20
These loss ligures should be interpreted with extreme caution. They are computed under the assumption that price remains constant. Such an assumption is not valid if ambient ozone levels increased in other grain producing regions. If this latter case occurs then the supply curve of feed grains would shift to the left. Given an inelastic demand curve (which is typical of demand in the short run), the corresponding price rise may leave producers better off thim before the ozone increase. However, consumers would be worse off lhan before. This illustrates the importance of analyzing both producer and consumer interactions in drawing conclusions about the impact of any pervasive environmental change.
ECONOMICALL Y IMPORTANT ASPECTS OF RESPONSE FUNCTIONS
In performing an economic assessment of crop loss, the response changes of interest are those
related to both the costs of production and the marketability of a product (Adams et aI.,
1985). That is, there are two routes via which pollution-induced crop damage can influence
the welfare of consumers and producers. First, a reduction in crop damage, expressed as an
increase in yield, will reduce costs and therefore reduce the minimum price the producer must
receive to supply a given quantity. Secondly, altered levels of air pollution may affect the
attributes of a crop, thus changing the consumer's willingness to pay and the welfare derived
from the consumption of a given quantity of a crop_ The change in cost implies a supply
response, while the change in quality a demand response.
Studies conducted on ozone crop damage have tended to concentrate upon yield, and therefore
are only relevant to the supply response. Research into potential crop quality changes has
received little emphasis. Yet there is evidence that such quality changes do result from ozone
pollution. Examples of quality changes which have been found are shrivelling in kernels of
corn, reduction in the size of tomatoes, and alterations in chemical composition that affect
cooking quality of potatoes and nutritional values of alfalfa (Jacobson, 1982). Table 3 clearly
shows that there is a wide range of possible crop responses to ozone. Research is required
21
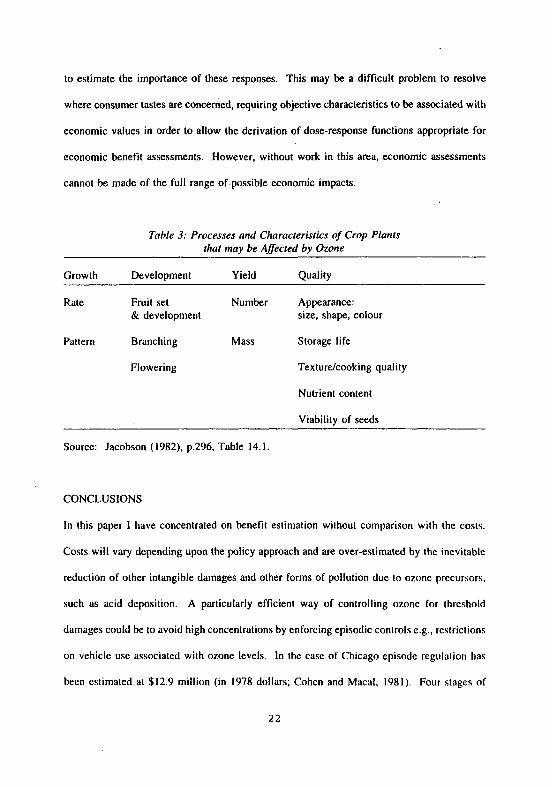
to estimate the importance of these responses. This may be a difficult problem to resolve
where consumer tastes are concerned, requiring objective characteristics to be associated with
economic values in order to allow the derivation of dose-response functions appropriate for
economic benefit assessments. However, without work in this area, economic assessments
cannot be made of the full range of possible economic impacts.
Table 3: Processes and Characteristics of Crop Plants that may be Affected by Ozone
Growth Development Yield Quality
Rate Fruit set Number Appearance: & development size, shape, colour
Pattern Branching Mass Storage life
Flowering Texture/cooking quality
Nutrient content
Viability of seeds
Source: Jacobson (1982), p.296, Table 14.1.
CONCLUSIONS
In this paper I have concentrated on benefit estimation without comparison with the costs.
Costs will vary depending upon the policy approach and are over-estimated by the inevitable
reduction of other intangible damages and other forms of pollution due to ozone precursors,
such as acid deposition. A particularly efficient way of controlling ozone for threshold
damages could be to avoid high concentrations by enforcing episodic controls e.g., restrictions
on vehicle use associated with ozone levels. In the case of Chicago episode regulation has
been estimated at $12.9 million (in 1978 dollars; Cohen and Macal, 1981). Four stages of
22

episode ure defined: udvisory 0.07 ppm, yellow alert 0.17 ppm, red alert 0.30 ppm and
emergency 0.5 ppm. The frequencies of occurrence were 60, 4, 0.5 and 0.056 days per year
respectively. The temptation to transfer such estimates to other regions should be avoided
as the cost of control varies with specific concentrations, e.g., I hr/day annual (to prevent
human health effects) versus 7hr/day seasonal mean (to prevent crop damages); it is also
highly region specific due to meteorological conditions.
The dose which a particular crop will receive in a given growing season is a function of
precursor emission levels, as well as of meteorological, climatological and topographical
factors. When certain meterological conditions prevail, high ozone concentrations may result.
The highest ozone levels occur during the spring and summer months coinciding with the
growing season for many agricultural crops.
Crop damage is a function of the ozone dose, crop species and cultivar, and biological,
climatic, edaphic, production and other factors. The interaction of these variables makes
accurate crop loss assessment, especially over large areas, an error prone task. Results from
field experiments, especially those of NCLAN, have increased the accuracy with which the
economic consequences of plant damage caused by ozone can be estimated. Where crop or
region specific information is lacking, qualified approximations to actual responses can be
made using surrogate functions. Current economic assessments of crop loss from ozone are
restricted by a lack of information as to the importance of crop quality responses and must
therefore concentrate upon supply response alone.
Several methodologies are available for crop loss assessment and have been applied to the
23

analysis of welfare changes due to alterations in ozone pollution levels. Among these the
microtheoretic econometric models provide a theoretically rigorous structure and have become
a common approach to studying the agricultural sector. In conceptualizing agricultural crop
production changes, neutral factor productivity enhancement is unanimously accepted (Le. no
input is favoured or harmed more than any other by ozone concentrations), while output
substitution will depend upon particular circumstances. Demand functions must be'estimated
if credible welfare measures are to be obtained. Finally, the supply function characteristics
used in recent studies have not been fully explained and may cause unjustified bias in benefit
estimates.
REFERENCES
Adams R M (1983) "Issues in assessing the economic benefits of ambient ozone control:
some examples from agriculture" Environment International 9: 539-548.
Adams R M, Callaway J M and McCarl B A (1984a) "Pollution, agriculture and social
welfare: The case of acid deposition" Canadian Journal of Agricultural Economics 34
(March): 3-19.
Adams R M and Crocker T D (1984) "Economically relevant response estimation and the
value of information: Acid deposition" in T D Crocker (editor) Economic Perspectives
of Acid Deposition Control London: Butterworth.
Adams R M and Crocker T D (1980) "Analytical issues in economic assessments of
vegetation damages" in P S Teng and S V Krupa (editors) Assessment of Losses which
Constraill Production and Crop Improvement in Agriculture and Forestry. Proceedings
of E C Stakman Commemorative Symposium, Misc Publication No.7, Agricultural
Experimentation Station, University of Minnesota.
24

Adams R M, Crocker T D and Katz R W (1985) "Yield response data in benefit-cost analyses
of pollution-induced vegetation damage" in W E Winner, H A Mooney and R A
Goldstein (editors) Sulphur Dioxide and Vegetation: Physiology, Ecology lind Policy
Issues Stanford, California: Stanford University Press.
Adams R M, Crocker T D and Thanavibulchai N (1982) "An economic assessment of air
pollution damages to selected annual crops in Southern California" Journal of
Environmental Economics and Management 9: 42-58.
Adams R M, Hamilton S A and McCarl B A (l984b) "The economic effects of ozone on
agriculture" Corvallis, Oregon: Environmental Research Laboratory, US Environmental
Protection Agency.
Adams R M and McCarl B A (1985a) "The effects of acid deposition on agriculture:
Summary and recommendations" Corvallis: Department of Agricultural and Resource
Economics, Oregon State University.
Adams R M and McCarl B A (l985b) "Assessing the benefits of alternative ozone standards
on agriculture: the role of response information." Journal of Environmental Economics
and Management 12, 246-276.
Adams R M, McCarl B A, Dudek D J and Glyer J D (1988) "Implications of global climate
change for western agriculture" Western Journal of Agricultural Economics 13 (2):
348-356.
Barnes R A, Parkinson G S and Smith A E (1983) "The costs and benefits of sulphur oxide
control" Journal of Air Pollution Control Association 33: 737-741.
Benson E J, Krupa S, Teng P S and Welsch P E (1982) "Economic assessment of air
pollution damages to agricultural and silvicultural crops" Final report to Minnesota
Pollution Control Agency.
25

Cohen A Sand Macal C M (1981) "Cost effectiveness of a photochemical oxidant episode
regulation" Journal of Air Pollution Control Association 31 (6): 651-660.
Dixon B L, Garcia P, Mjelde J Wand Adams R M (1984) Estimation of the Cost of Ozone
on Illinois Cash Grain Farms: An Application of Duality. Urbanna: Agricultural
Economics Staff Paper No.84 E-276, University of Illinois.
Dixon B L, Garcia P and Mjelde J W (1985) "Primal versus dual methods measuring the
impacts of ozone on cash grain farms" American Journal of Agricultural Economics
67(2): 402-406.
Hamilton S A, McCarl B A and Adams R M (1984) "The effect of aggregate response
assumptions on environmental impact analysis" Corvallis: Department of Agricultural
and Resource Economics, Oregon State University.
lIeck W W, Cure W W, Rawlings J 0, Zaragoza L J, Heagle A S, Heggestad H E, R J
Kohut, Kress L Wand Temple P J (1984) "Assessing impacts of ozone on agricultural
crops: I" Journal of Air Pollution Control Association 34(7).
lIeck W W, Taylor 0 C, Adams R, Bingham G, Miller J, Preston E and Weinstein L (1982)
"Assessment of Crop Loss from Ozone" Journal of Air Pollution Control Association
32(4).
Heck W W, Larsen R 1 and Heagle A S (1980) "Measuring the acute dose-response of plants
to ozone" Presented at E C Stakman Commemorative Symposium, University of
Minnesota, Minneapolis.
Holdgate M W (1979) A Perspective of Environmental Pollution Cambridge: CUP.
1I0witt R E, Gossard T E and Adams R M (1984) "Effects of alternative 07:one levels and
response data on economic assessments: The case of California crops" Journal oj Air
Pollutioll Control Association 34: 1122-1127.
26
Ilowill R E. Go~sard T E and Adams R M (1985) "The economic effects of air pollution on
annual crops" California Agriculture March/April: 22-24.
Jacob~on J S (1982) "Ozone and the growth and productivity of agricultural crops" in M H
lJn~worth and D P Ormond (editors) Effects of Gaseous Air Pollutants in Agriculture
lind Horticulture London: BUllerworths.
Ju~t R E. Hueth D L and Schmitz A (1982) Applied Welfare Economics and Public Policy
London: Prentice-Hall International Inc.
Leung S K. Reed W. Cauchois Sand Howill R (1978) "Methodologies for valuation of
agricultural crop yield changes: A review" Sacramento. California: Eureka
Laboratories; Corvallis, Oregon: US, EPA, EPN600/5-78/018, NTISIPB-288.
Leung S K, Reed Wand Geng S (1982) "Estimation of ozone damage to selected crops
grown in Southern California" Journal of Air Pollution Control Association 32: 160-
164.
Linzon S N, Pearson R G. Donnan J A and Durham F N (1984) "Ozone effects on crops in
Ontario and related monetary values" Ontario: Ministry of Environment.
MacKenzie J J and EI-Ashry M T (1989) Air Pollution's Toll on Forests & Crops New
Haven: Yale University Press.
Medeiros W Hand Moscowitz P D (1983) "Quantifying effects of oxidant air pollutants on
agricultural crops" Environment International 9.
Mjelde J W. Adams R M, Dixon BLand Garcia P (1984) "Using farmers' actions to
measure crop loss due to air pollution" Journal of Air Pollution Control Association
31: 360-364.
Organization for Economic Cooperation and Development (1981) The Costs and Benefits of
Sulphur Oxide Control Paris. France: OECD.
27
Page W P, Arbogast G, Fabian R G and Ciecka J (1982) "Estimation of economic losses to
the agricultural sector from airborne residuals in the Ohio River Basin region" Journal
of Air Pollution Control Association 32: 151-154.
Rowe R D and Chestnut L G (1985) "Economic assessment of the effects of air pollution on
agricultural crops in the San Joaquin Valley" Journal of Air Pollution Control
Association 35: 728-734.
Smith M and Brown D (1982) "Crop production benefits from ozone reduction: An economic
analysis" Indiana: Agricultural Experimentation Station, Purdue University, Station
Bulletin No.388.
Spash C L (1987) Measuring the Tangible Benefits of Environmental Improvement: An
Economic Appraisal of Regional Crop Damages due to Ozone. Unpublished M.Sc.
dissertation, University of British Columbia, Canada.
United States, Environmental Protection Agency (1985) "Air quality criteria for ozone and
other photochemical oxidants: Draft" Research Triangle Park, North Carolina 7-190.
United States, Environmental Research Centre, Environmental Protection Agency (1974) "The
economic damages of air pollution" EPA-600/5-74-012.
Unsworth M H (1982) "Exposure to gaseous pollutants and uptake by plants" in M H
Unsworth and D P Ormond (editors) Effects of Gaseous Air Pollutants in Agriculture
and Horticulture London: Butterworths.
Varey R H, Ball D J, Crane A J, Laxen PH and Sandalls F J (1988) "Ozone formation in the
London Plume" Atmospheric Environment 22(7): 1335-1346.
Willig R D (1976) "Consumer's surplus without apology" The American Economic Review
66(4): 589-597.
28


Departrnent of Econotnics University of Stirling
Stirling FK94LA