Embed Size (px)
Citation preview
1
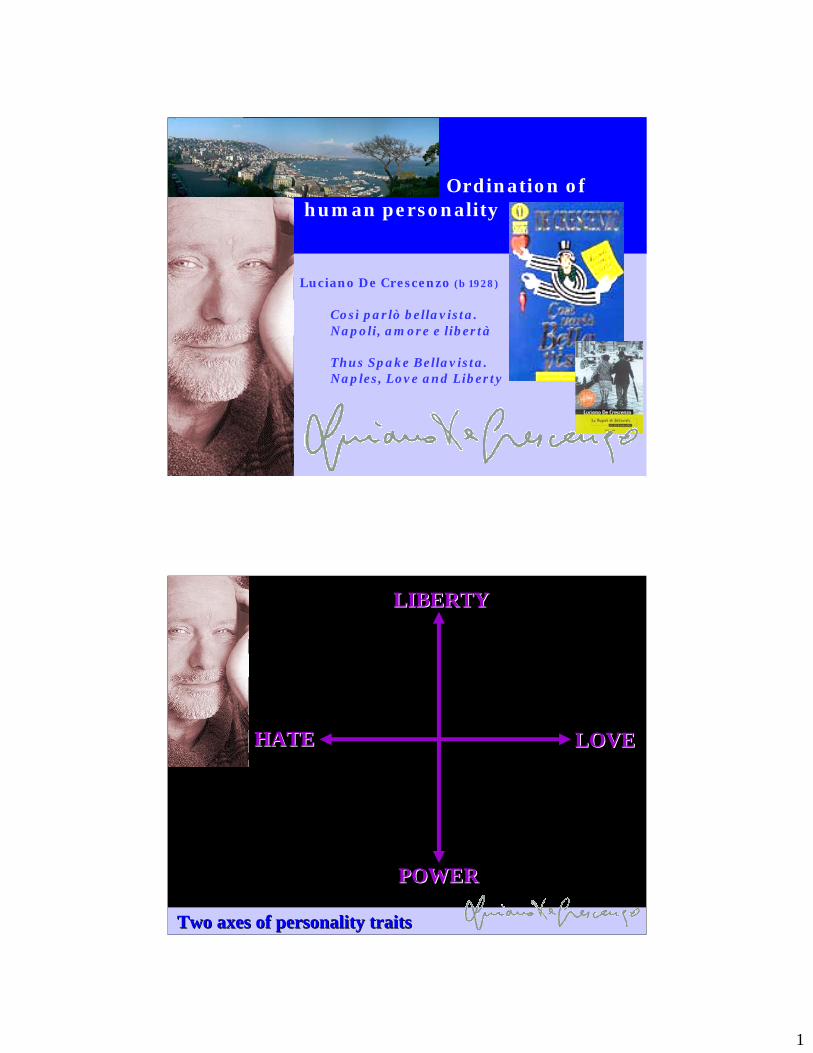
Luciano De Crescenzo (b 1928)
Così parlò bellavista. Napoli, amore e libertà
Thus Spake Bellavista.Naples, Love and Liberty
Ordination ofhuman personality
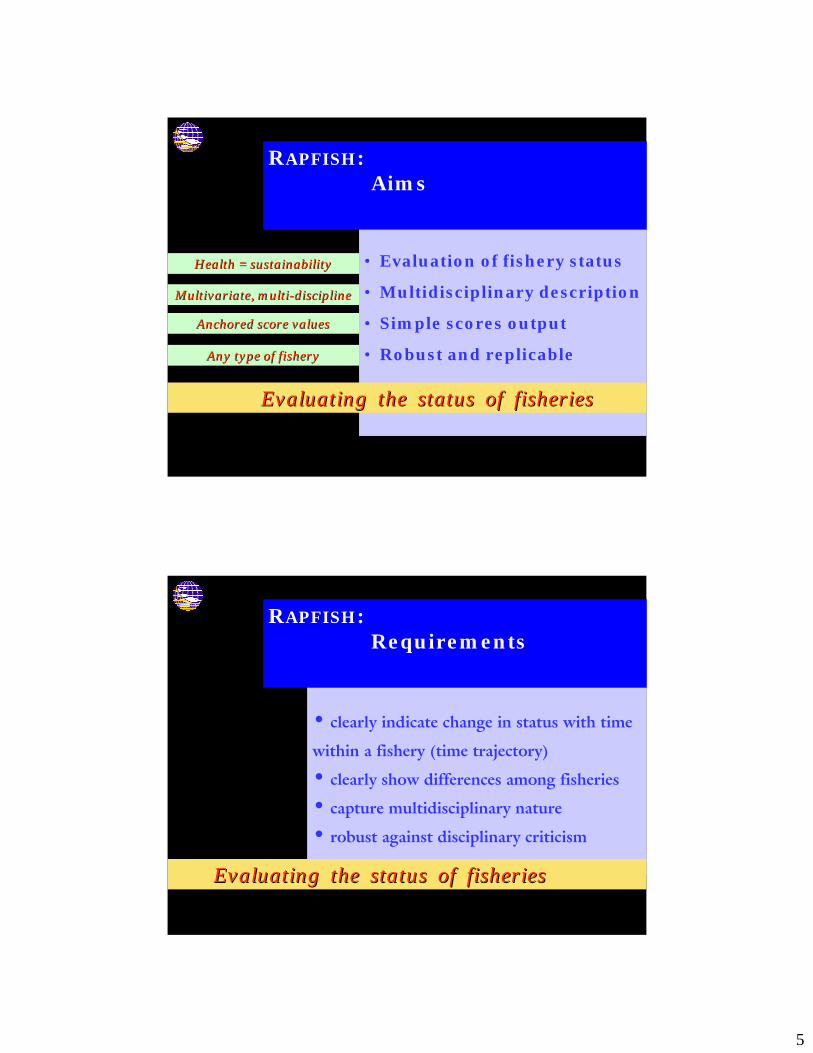
Two axes of personality traits Two axes of personality traits
LIBERTYLIBERTY
POWERPOWER
HATE HATE LOVE LOVE

2
The Compass of the Sixteen Callings The Compass of the Sixteen Callings
Plotting historical figures Plotting historical figures

3
A Rapid AppraisalA Rapid AppraisalTechnique Technique
for Fisheries:for Fisheries:RapfishRapfish
Tony J. PitcherTony J. PitcherFisheries Centre, University of British Columbia, Vancouver, CaFisheries Centre, University of British Columbia, Vancouver, Canadanada
Towards Ecosystem-Based Management Rapid Appraisal of Status
RAPFISH 1
1. Why do we need it?
2. Anchor points and ordination
3. Evaluation fields and attributes
4. Scoring, killers, documentation
5. Testing the Rapfish method
Towards Ecosystem-Based Management Rapid Appraisal of Status
RekyavikRekyavik, February 2006, February 2006

4
Developed by:Tony J. Pitcher, Pat Kavanagh,Jacqueline Alder, David Preikshot
With the help of: Alida Bundy, Trevor Hutton, Kristin Kaschner,, Bridget Ferris, Steven Mackinson, Leif Nøttestad, Daniel Pauly, Melanie Power, Marcelo Vasconcellos, Rashid Sumaila
updated May 2005
Rapid appraisal of the Rapid appraisal of the ‘‘healthhealth’’ status of fisheries status of fisheries
using multivariate,using multivariate,multidisciplinary ordinationmultidisciplinary ordination
RRAPFISHAPFISH
Measuring Measuring the the
unun--measurablemeasurable
Stock Assessment requires extensive Stock Assessment requires extensive data, elaborate analysis, data, elaborate analysis, quantification of riskquantification of risk
Lost of data, cost means it cant be Lost of data, cost means it cant be done on majority of stocksdone on majority of stocks
How to address quantitatively major How to address quantitatively major policy of ecology, economics or policy of ecology, economics or social concerns ?social concerns ?
Policy decisions often taken without Policy decisions often taken without objective, quantitative support objective, quantitative support
RAPFISH – Why do we need it?
How to evaluate the status of fisheries ?How to evaluate the status of fisheries ?
5
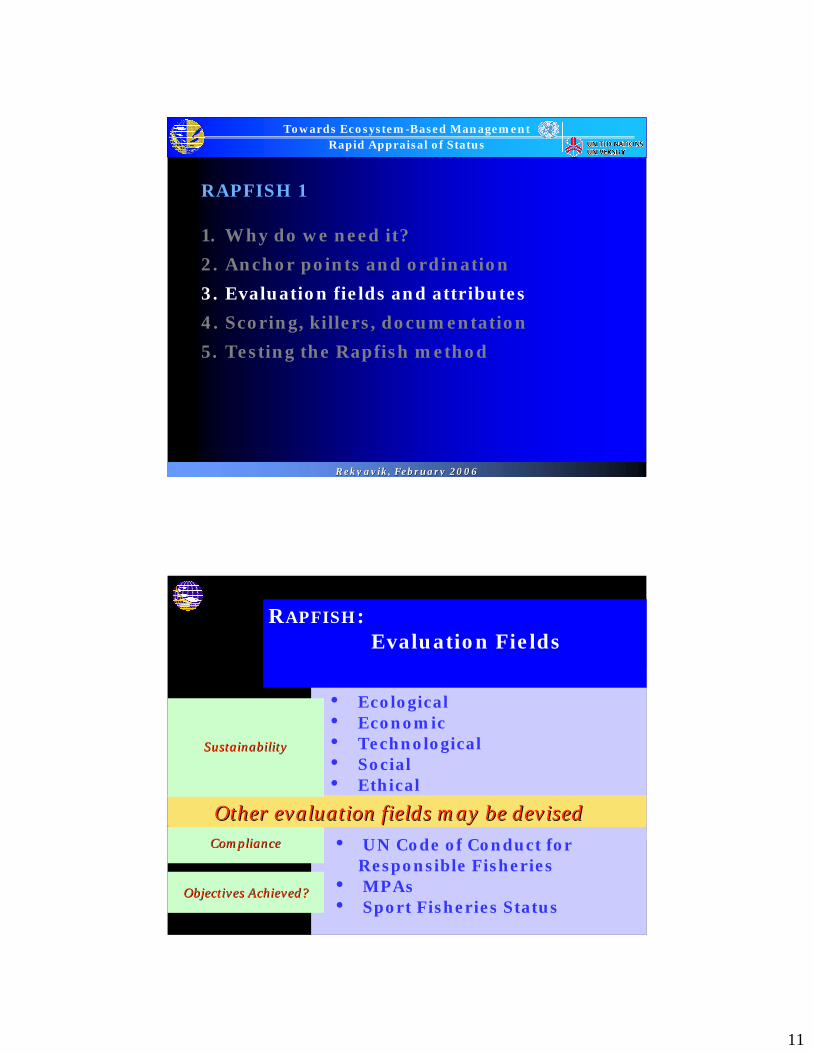
• Evaluation of fishery status
• Multidisciplinary description
• Simple scores output
• Robust and replicable
RAPFISH: Aims
Evaluating the status of fisheriesEvaluating the status of fisheries
Health = sustainabilityHealth = sustainability
Multivariate, multiMultivariate, multi--disciplinediscipline
Any type of fisheryAny type of fishery
Anchored score values Anchored score values
• clearly indicate change in status with time
within a fishery (time trajectory)
• clearly show differences among fisheries
• capture multidisciplinary nature
• robust against disciplinary criticism
RAPFISH: Requirements
Evaluating the status of fisheriesEvaluating the status of fisheries

6
Apply to Apply to any type any type of fishery of fishery
…………
Analysis by Analysis by ……FleetFleetSectorSectorGear typeGear typeIndividual vessel Individual vessel ………………by by PortPortRegionRegionCountryCountryFAO areaFAO area……..
•Triage
•Broader than stock assessment
•Simpler that stock assessment
RAPFISH: Uses
Evaluating the status of fisheriesEvaluating the status of fisheries

7
•easily scored objectively
• easily available for most fisheries
•easily refined without disruption
•easily ascribed to GOOD/BAD
RAPFISH: Attribute Qualities
Within one evaluation field Within one evaluation field …………..
Group technique: refinementGroup technique: refinement
Literature, experts, choice data Literature, experts, choice data
Test attribute with this Test attribute with this
Can add/refine new scoresCan add/refine new scores
RAPFISH 1
1. Why do we need it?
2. Anchor points and ordination
3. Evaluation fields and attributes
4. Scoring, killers, documentation
5. Testing the Rapfish method
Towards Ecosystem-Based Management Rapid Appraisal of Status
RekyavikRekyavik, February 2006, February 2006

8
•Multidimensional scaling (MDS – 2d)
•Non-parametric (non-metric)
•Easily refined without disruption
•Include fixed anchor points
RAPFISH: Ordination Engine
MDS BENEFITS MDS BENEFITS
Preserves map Preserves map distancesdistances
Can be rotated Can be rotated and shiftedand shifted
MDS COSTS MDS COSTS
Impossible mathImpossible math
Flips easilyFlips easily
Anchor points Anchor points ……....

9
• GOOD
• BAD
• UGLY
RAPFISH: Anchor Points
Entered as Entered as ‘‘imaginary fisheriesimaginary fisheries’’ in data in data
Highest possible (maximum) score on all attributesHighest possible (maximum) score on all attributes
Lowest possible (minimum) score on all attributesLowest possible (minimum) score on all attributes
Anchor Points of extreme score combinations Anchor Points of extreme score combinations
• scale all evaluations between 0% and 100%
• lock flips from MDS algorithm
RAPFISH: Anchor Points
Advantages of RAdvantages of RAPFISHAPFISH Anchor points Anchor points
Hence: all analyses are comparable & can be Hence: all analyses are comparable & can be overlayedoverlayed

10
RAPFISH: Anchor Points: plot
RRAPFISHAPFISH Anchor points: pattern for Anchor points: pattern for ‘‘ugliesuglies’’
GoodBad
0 20 40 60 80 100Good and BadGood and Bad
Lock yLock y
Ring of anchorsRing of anchors
Lock yLock y
Ring of anchorsRing of anchors
RAPFISH: Anchor Points: data
RRAPFISHAPFISH anchor points: pattern for good, bad & uglyanchor points: pattern for good, bad & ugly
A B C D E F G H I JGOOD 0 0 0 0 0 0 0 0 0 3
BAD 4 2 2 2 3 2 2 2 2 0
mid 1 0 0 0 0 0 2 2 2 2 0mid 2 4 2 2 2 3 0 0 0 0 3
ugly 1 0 0 0 0 0 0 0 0 0 0ugly 2 0 0 0 0 0 0 0 0 2 0ugly 3 0 0 0 0 0 0 0 2 2 0ugly 4 0 0 0 0 0 0 2 2 2 0ugly 5 0 0 0 0 0 2 2 2 2 0ugly 6 0 0 0 0 3 2 2 2 2 0ugly 7 0 0 0 2 3 2 2 2 2 0ugly 8 0 0 2 2 3 2 2 2 2 0ugly 9 0 2 2 2 3 2 2 2 2 0
ugly 10 4 2 2 2 3 2 2 2 2 3ugly 11 4 2 2 2 3 2 2 2 0 3ugly 12 4 2 2 2 3 2 2 0 0 3ugly 13 4 2 2 2 3 2 0 0 0 3ugly 14 4 2 2 2 3 0 0 0 0 3ugly 15 4 2 2 2 0 0 0 0 0 3ugly 16 4 2 2 0 0 0 0 0 0 3ugly 17 4 2 0 0 0 0 0 0 0 3ugly 18 4 0 0 0 0 0 0 0 0 3
Attributes
Lock x: Good and Bad Lock x: Good and Bad (x =100; 0)(x =100; 0)
Lock y:Lock y:(y= (y= ––50; + 50 )50; + 50 )
Lock x & yLock x & y
Ring of anchorsRing of anchors
11
RAPFISH 1
1. Why do we need it?
2. Anchor points and ordination
3. Evaluation fields and attributes
4. Scoring, killers, documentation
5. Testing the Rapfish method
Towards Ecosystem-Based Management Rapid Appraisal of Status
RekyavikRekyavik, February 2006, February 2006
• Ecological• Economic• Technological• Social• Ethical
RAPFISH: Evaluation Fields
= = ““DisciplinesDisciplines””
• UN Code of Conduct for Responsible Fisheries
• MPAs• Sport Fisheries Status
Sustainability Sustainability
Compliance Compliance
Other evaluation fields may be devisedOther evaluation fields may be devised
Objectives Achieved? Objectives Achieved?

12
Economic Evaluation
Economic attributes reflect how fisheries Economic attributes reflect how fisheries management practices impact the economic management practices impact the economic sustainability of the fishery and related human sustainability of the fishery and related human communities, as ultimately predicated on communities, as ultimately predicated on ecological sustainability.ecological sustainability.
In a In a RapfishRapfish analysis, scores at analysis, scores at ‘‘goodgood’’ end of the scale end of the scale reflect economic sustainability and are not a risk to reflect economic sustainability and are not a risk to the fishery or ecosystem, whereas the the fishery or ecosystem, whereas the ‘‘badbad’’ end of the end of the scale may indicate a risk. A fishery where the average scale may indicate a risk. A fishery where the average wage of a fisher is above the average national wage wage of a fisher is above the average national wage scores towards the scores towards the ‘‘goodgood’’ end because there is an end because there is an incentive or likelihood that fishers will manage for incentive or likelihood that fishers will manage for sustainability to ensure that their wages remain high sustainability to ensure that their wages remain high or improve.or improve.
Profitability; Fisheries in GDP; Average wage; Limited Profitability; Fisheries in GDP; Average wage; Limited entry; Marketable right; Other income; Sector entry; Marketable right; Other income; Sector employment; Ownership/Transfer; Market; Subsidyemployment; Ownership/Transfer; Market; Subsidy
Death
Social Evaluation
Social attributes reflect how fisheries management Social attributes reflect how fisheries management practices impact the sustainability of the society practices impact the sustainability of the society or community associated with that particular or community associated with that particular fishery, as ultimately predicated on ecological fishery, as ultimately predicated on ecological sustainability.sustainability.
In a In a RapfishRapfish analysis, the analysis, the ‘‘goodgood’’ end of the scale of an end of the scale of an attribute reflects social sustainability but l0w risk to attribute reflects social sustainability but l0w risk to the fishery or ecosystem, whereas scores at the the fishery or ecosystem, whereas scores at the ‘‘badbad’’end may reflect a risk. Therefore a fishery where end may reflect a risk. Therefore a fishery where fishers can influence fishery regulations scores fishers can influence fishery regulations scores towards the towards the ‘‘goodgood’’ end of the scale, while a fishery end of the scale, while a fishery where there is conflict with other fisheries or where there is conflict with other fisheries or industries scores towards the industries scores towards the ‘‘badbad’’ end of the scale.end of the scale.
Socialization of fishing; New entrants into the fishery; Socialization of fishing; New entrants into the fishery; Fishing sector; Environmental knowledge; Education Fishing sector; Environmental knowledge; Education level; Conflict status; Fisher influence; Fishing level; Conflict status; Fisher influence; Fishing income; Kin participationincome; Kin participation
Love

13
Ecological Evaluation
Ecological attributes reflect how the fishery impacts Ecological attributes reflect how the fishery impacts sustainability in terms of the ecology of the sustainability in terms of the ecology of the exploited fish and their ecosystem.exploited fish and their ecosystem.
Fisheries management practices that increase the risk of Fisheries management practices that increase the risk of overexploitation, quickly change trophic levels etc. overexploitation, quickly change trophic levels etc. are scored towards the are scored towards the ‘‘badbad’’ end of the scale while end of the scale while fisheries management practices that protect the fisheries management practices that protect the species or ecosystem score towards the species or ecosystem score towards the ‘‘goodgood’’ end of end of
the scale.the scale.
Exploitation status; Recruitment variability; Change in Exploitation status; Recruitment variability; Change in trophic level; Migratory range; Range collapse; Size of trophic level; Migratory range; Range collapse; Size of fish caught; Catch before maturity; Discarded byfish caught; Catch before maturity; Discarded by--catch; Species caught; Primary productioncatch; Species caught; Primary production
Chastity
Technological Evaluation
Technological attributes capture appropriate Technological attributes capture appropriate technologies that minimize risk to sustainability technologies that minimize risk to sustainability of the fishery.of the fishery.
Therefore when devices are used to improve the catching Therefore when devices are used to improve the catching power these fisheries score towards the power these fisheries score towards the ‘‘badbad’’ end, end, while a fishery that uses technology such as ice to while a fishery that uses technology such as ice to prevent waste or reduce byprevent waste or reduce by--catch scores towards the catch scores towards the ‘‘goodgood’’ end of the scale.end of the scale.
Trip length; Landing sites; PreTrip length; Landing sites; Pre--sale processing; Onboard sale processing; Onboard handling; Gear; Selective gear; FADS; Vessel size; handling; Gear; Selective gear; FADS; Vessel size; Catching power; Gear side effectsCatching power; Gear side effects
Time

14
Ethical Evaluation
The ethical evaluation field in RThe ethical evaluation field in RAPFISHAPFISH was was developed by a team of 15 including ethicists, developed by a team of 15 including ethicists, social and natural scientists.social and natural scientists.
Ethical analysis within Ethical analysis within RapfishRapfish is designed to is designed to analyseanalyse fisheries for five types of justice: fisheries for five types of justice: creative, productive, ecosystem, restorative, and creative, productive, ecosystem, restorative, and distributive. distributive.
The ethical attributes assesses fisheries based on these The ethical attributes assesses fisheries based on these ethical concerns, and integrate sustainability on many ethical concerns, and integrate sustainability on many levels, including ecological and social.levels, including ecological and social.
Adjacency and reliance; Alternatives; Equity in entry to Adjacency and reliance; Alternatives; Equity in entry to fishery; Just management; Mitigation fishery; Just management; Mitigation –– habitat habitat destruction; Mitigation destruction; Mitigation –– ecosystem depletion; Illegal ecosystem depletion; Illegal
fishing; Discards & wastesfishing; Discards & wastes
Eternity
Productive justice: Productive justice: sustainable sustainable production of desired production of desired resources or benefitresources or benefit
Distributive justice:Distributive justice: how the how the resource is shared resource is shared
Restorative justice:Restorative justice: covers the covers the repairing of previous damagerepairing of previous damage
Creative justice:Creative justice: dynamic dynamic instruments for fair, instruments for fair, cooperative management cooperative management
Ecosystem justice: Ecosystem justice: interdependence of natural interdependence of natural and human members of the and human members of the fisheries ecosystem fisheries ecosystem
The ethical evaluation field in RAPFISH was developed by a team The ethical evaluation field in RAPFISH was developed by a team of 15 including ethicists, social and natural scientists.of 15 including ethicists, social and natural scientists.
Coward, H., Ommer, R. and Pitcher, T.J. (Eds) (2000) Just Fish: the Ethics of Canadian Fisheries. Institute of Social and Economic Research Press, St John's, Newfoundland, Canada, 304pp. ISBN 0-919-666-97-3

15
Combined Evaluation
Combining the scores in an overall analysis Combining the scores in an overall analysis
is probably not helpfulis probably not helpfulHow to decide on weightings?How to decide on weightings?
Same problem as decision analysis?Same problem as decision analysis?
Solution ???Solution ???
Retain the evaluation fieldsRetain the evaluation fields
Present togetherPresent together
Kite diagram (Garcia)Kite diagram (Garcia)

16
RAPFISH 1
1. Why do we need it?
2. Anchor points and ordination
3. Evaluation fields and attributes
4. Scoring, killers, documentation
5. Testing the Rapfish method
Towards Ecosystem-Based Management Rapid Appraisal of Status
RekyavikRekyavik, February 2006, February 2006

17
ScoringKiller attributes
RAPFISH:
Scoring the AttributesScoring the Attributes
Use Experts on the fisheryUse Experts on the fisheryBUT BUT …….mediate the scores.mediate the scores
Attribute Scoring Good Bad Notes
Exploitation Status
0 to 4 0 4 FAO – like scale, 0= under, 4 = collpased
Size of fish caught
0 to 2 0 2 Change in average fish size landed in past 5 years, 0 = none, 2 = rapid & large
Discarded by-catch
0 to 2 0 2 % of target catch, 0 = low, 2=high
Ecological evaluation fieldEcological evaluation field
RAPFISH: example of scoring

18
RAPFISH: Example of data table 1Example of data table 1
From Canada: ecological evaluation fieldFrom Canada: ecological evaluation field
Cap 1 1.0 1.0 2.0 1.0 0.5 0.0 1.0 0.0 2.0
SnwCb 2 0.5 2.0 2.0 0.0 0.0 1.0 0.0 0.0 1.0
SnCb19 3 0.5 2.0 2.0 0.0 0.0 1.0 0.0 0.0 2.0
BFunS 4 1.0 1.0 2.0 0.0 0.0 1.0 0.0 0.0 1.0
BFun W 5 0.0 1.0 2.0 0.0 0.0 2.0 0.0 0.0 1.0
Lob 6 1.5 1.0 2.0 0.0 0.0 1.0 0.0 0.0 2.0
LobDing 7 1.5 1.0 2.0 0.0 0.0 1.0 1.0 0.0 2.0
MakAt 8 0.5 1.5 2.0 0.0 0.5 1.0 0.0 0.0 2.0
MakDin 9 0.5 1.5 2.0 0.0 0.0 1.0 0.0 0.0 2.0
CodGil 10 3.0 1.5 2.0 0.5 3.0 1.5 1.0 0.5 2.0
CodHan 11 3.0 1.5 2.0 0.5 3.0 1.0 0.0 0.0 2.0
CodLon 12 3.0 1.5 2.0 0.5 3.0 1.0 0.0 0.0 2.0
CodTap 13 3.0 1.5 2.0 0.5 3.0 1.5 0.0 0.5 2.0
CodTrw 14 3.0 2.0 2.0 1.0 3.0 2.0 1.5 1.0 2.5
CodIn 15 3.0 1.5 2.0 0.5 3.0 1.3 0.0 0.5 2.0
Abbreviation
exploitation status
recruitment
variability
change in T level
migratory
range
range collaps
e
catch < maturit
y
discarded
bycatchspecies caught
primary
production
RAPFISH: Example of data table 2Example of data table 2
From Canada: Ecological Evaluation FieldFrom Canada: Ecological Evaluation Field
PkTrol 40 0.0 0.5 0.5 0.8 0.0 0.5 0.5 0.0 2.0
SokGil 41 2.0 2.0 0.5 2.0 0.0 0.5 1.0 0.0 2.5
SokSen 42 2.0 2.0 0.5 2.0 0.0 1.0 1.5 1.0 2.5
43
Good 44 0.0 0.0 0.0 0.0 0.0 0.0 0.0 0.0 3.0
45
MID1 46 0.0 0.0 0.0 0.0
47 0.0 0.0 0.0 0.0 3.0
SkTrol 2.0 2.0 0.5 2.0 0.0 0.5 0.0 0.0 2.5
Bad 4.0 2.0 2.0 2.0 3.0 2.0 2.0 2.0 0.0
3.0 2.0 2.0 2.0 0.0
MID2 4.0 2.0 2.0 2.0
19
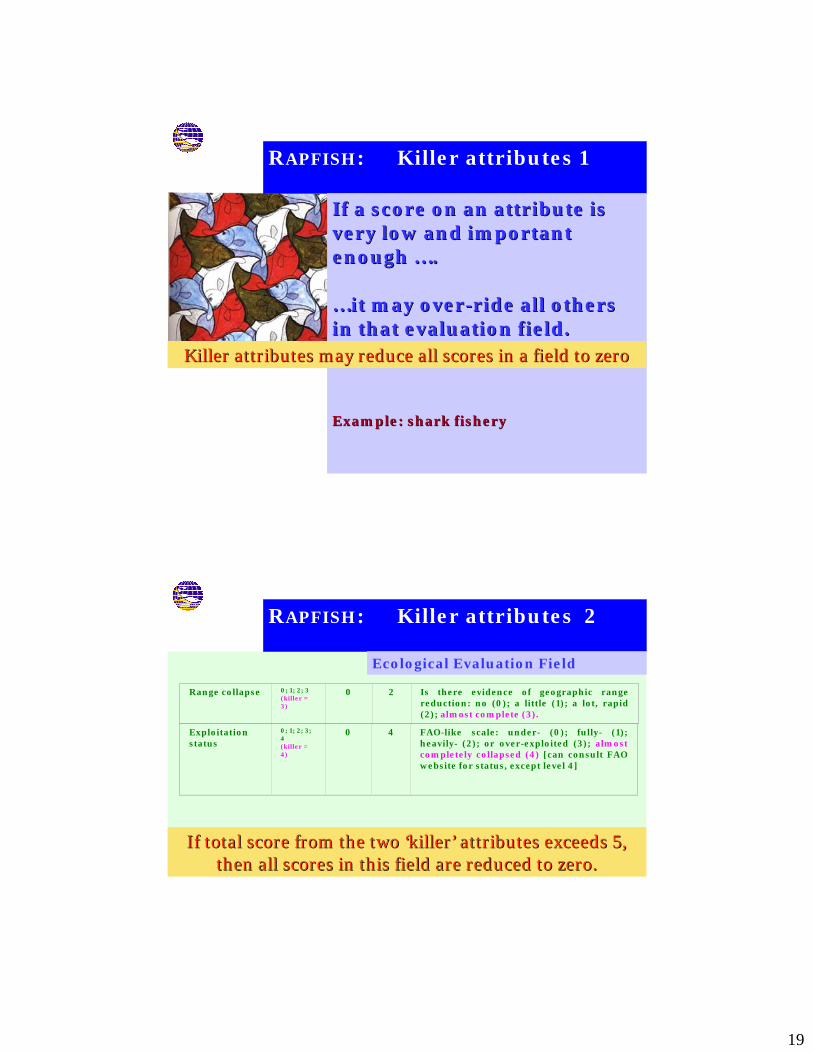
RAPFISH: Killer attributes 1
If a score on an attribute is If a score on an attribute is very low and important very low and important enough enough ……..
……it may overit may over--ride all othersride all othersin that evaluation field. in that evaluation field.
Example: shark fishery Example: shark fishery
Killer attributes may reduce all scores in a field to zeroKiller attributes may reduce all scores in a field to zero
RAPFISH: Killer attributes 2
Exploitation status
0; 1; 2; 3; 4(killer = 4)
0 4 FAO-like scale: under- (0); fully- (1); heavily- (2); or over-exploited (3); almost completely collapsed (4) [can consult FAO website for status, except level 4]
Range collapse 0; 1; 2; 3(killer = 3)
0 2 Is there evidence of geographic range reduction: no (0); a little (1); a lot, rapid (2); almost complete (3).
If total score from the two If total score from the two ‘‘killerkiller’’ attributes exceeds 5, attributes exceeds 5, then all scores in this field are reduced to zero. then all scores in this field are reduced to zero.
Ecological Evaluation Field

20
RAPFISH: Killer attributes 3
If total score from the two If total score from the two ‘‘killerkiller’’ attributes exceeds 5, attributes exceeds 5, then all scores in this field are reduced to zero. then all scores in this field are reduced to zero.
Economic Evaluation Field
Profitability 0; 1; 2; 3; 4(killer = 4)
0 4 Highly profitable (0); marginally profitable (1); break even (2); losing money (3); large losses (4). (Subsidies are included).
Subsidy 0; 1; 2; 3(killer = 4)
0 2 Are subsidies (including hidden) provided to support the fishery?: no (o); somewhat (1); large subsidies (2); heavily reliant (3); almost completely reliant on subsidies (4).
RAPFISH: Killer attributes 4
If score of If score of ‘‘killerkiller’’ attribute equals 3, then all scores in this attribute equals 3, then all scores in this field are reduced to zero. field are reduced to zero.
Technology Evaluation Field
Gear side effects
0; 1; 2; (killer = 3)
0 2 Does gear have undesirable side effects (e.g. cyanide, dynamite, trawl); no (0); some (1); a lot (2); fishery dominated by destructive fishing practices (3).

21
RAPFISH:
Importance of DocumentationImportance of Documentation
List of Fisheries and Sources of Information. Sources for information used in attribute scores for all fisheries. Exploitation Status –Atlantic fisheries: FAO Table I: “State of Exploitation, total production and nominal catches by selected species groups fished in the Northwest Atlantic (FAO Statistical Area 21), in metric tonnes, years 1950-94.” www.fao.org/waicent/faoinfo/fishery/publ/ circular/ c920/tab1.htm. Exploitation Status – Pacific fisheries: FAO Table XI: “State of Exploitation, total production and nominal catches by selected species groups fished in the Northeast Pacific (FAO Statistical Area 67), in metric tonnes, years 1950-94.”www.fao.org/waicent/faoinfo/fishery/publ/circular/c920/tab11.htm. Recruitment Variability – FishBase 1997 and 1998. Trophic Level –FishBase ’97 and ’98. Primary Production – Pernetta, J. 1994. GDP/Person – Canada 1996c.
Personal Communications:Brian Adams, President, Area 19 Crab Fisherman’s Association, Cheticamp, Nova Scotia – Area 19 Snow Crab FisheryAlisdair Beattie, University of British Columbia Fisheries Centre, Vancouver, British Columbia – British Columbia Groundfish Trawl and Pacific HalibutRamon Bonfil, University of British Columbia Fisheries Centre, Vancouver, British Columbia – British Columbia Groundfish TrawlGerry Brothers, Department of Fisheries and Oceans, St. John’s, Newfoundland – Atlantic fisheriesJim Carscadden, Department of Fisheries and Oceans, St. John’s, Newfoundland – CaplinEarl Dawe, Department of Fisheries and Oceans, St. John’s, Newfoundland – Snow CrabKelly Fitzgerald, Fisher, Dingwall, Nova Scotia –Mackerel and Lobster in Dingwall, NSFrançois Grégoire, Department of Fisheries and Oceans, Mont-Joli, Québec – MackerelSylvie Guénette, University of British Columbia Fisheries Centre, Vancouver, British Columbia – Northern CodEarl Johnson, Newfoundland Inshore Fishers Association – Newfoundland Fisheries Peter Koeller, Department of Fisheries and Oceans, Halifax, Nova Scotia – Northern ShrimpSteve Martell, University of British Columbia Fisheries Centre, Vancouver, British Columbia – LingcodSteve Mackinson, University of British Columbia Fisheries Centre, Vancouver, British Columbia – Herring and Herring Spawn-on-kelpCharles McKee, Fisher and lawyer, Vancouver, British Columbia – Pacific SalmonMelanie Morris, Department of Sociology, Memorial University of Newfoundland, St. John’s, Newfoundland – CaplinBarbara Neis, Department of Sociology, Memorial University of Newfoundland, St. John’s, Newfoundland – Atlantic Fisheries Rosemary Ommer, Department of History, Memorial University of Newfoundland, St. John’s, Newfoundland – Atlantic FisheriesDon Parsons, Department of Fisheries and Oceans, St. John’s, Newfoundland – Northern ShrimpDouglas Pezzack, Department of Fisheries and Oceans, Dartmouth, Nova Scotia – LobsterGinette Robert, Department of Fisheries and Oceans, Halifax, Nova Scotia – Scallops Chris Sporer, Department of Fisheries and Oceans, Vancouver, British Columbia – Herring Spawn-on-kelp and Pacific SalmonJohn Sutcliffe, United Fishermen and Allied Workers’ Union, Vancouver, British Columbia – Pacific SalmonGreg Thomas, Department of Fisheries and Oceans – Herring Spawn-on-kelpJohn Tremblay, Department of Fisheries and Oceans, Dartmouth, Nova Scotia – Snow Crab and LobsterClay Young, Salmon Fisher – Pacific Salmon
Documenting Documenting RapfishRapfish data sources: data sources: Canadian fisheriesCanadian fisheries

22
Species Location Symbol on Plots Period Sources Caplin Newfoundland Cap Mid-1990s G. Brothers; Carscadden; Cashin (1993); DFO website; E. Johnson; Canada
(1996d); M. Morris; B. Neis; R. Ommer Crab (Snow) Atlantic coast SnwCb Mid-1990s G. Brothers; E. Dawe; B. Neis; R. Ommer; Taylor and O’Keefe (1997); Canada
(1996e); J. Tremblay Crab (Snow) Area 19, Cape Breton SnCb19 Mid-1990s B. Adams; R. Ommer; Canada (1998e) Herring – Seine Bay of Fundy BFunS Mid-1990s R. Ommer; Pitcher et al Herring – Weir Bay of Fundy BFunW Mid-1990s R. Ommer; Pitcher et al Lobster Atlantic coast Lob Mid-1990s Canada (1997a); Canada (1995); Canada (1998f); R. Ommer; D. Pezzack; J.
Tremblay Lobster Dingwall, Cape Breton LobDing Mid-1990s Canada (1995); K. Fitzgerald; R. Ommer Mackerel Atlantic coast MakAt Mid-1990s Canada (1997a); F. Grégoire; R. Ommer; Mackerel Dingwall, Cape Breton MakDin Mid-1990s F. Grégoire; K. Fitzgerald; R. Ommer; Northern Cod – Gillnet Newfoundland CodGil 1991 Cashin (1993); S. Guénette; E. Johnson; B. Neis (1992); R. Ommer; Canada
(1996b) Northern Cod – Handline Newfoundland CodHan 1991 Cashin (1993); S. Guénette; E. Johnson; B. Neis (1992); R. Ommer; Canada
(1996b) Northern Cod – Trap Newfoundland CodTap 1991 Cashin (1993); S. Guénette; E. Johnson; B. Neis (1992); R. Ommer; Canada
(1996b) Northern Cod – Inshore Newfoundland CodIn 1991 Cashin (1993); S. Guénette; E. Johnson; B. Neis (1992); R. Ommer; Canada
(1996b) Northern Cod – Otter Trawl Newfoundland CodTrw 1991 G. Brothers; Cashin (1993); S. Guénette; E. Johnson; B. Neis (1992); R. Ommer;
Canada (1996b) Northern Cod – Offshore Newfoundland CodOff 1991 G. Brothers; Cashin (1993); S. Guénette; E. Johnson; B. Neis (1992); R. Ommer;
Canada (1996b) Scallops Maritimes Sclp Mid-1990s G. Brothers; R. Ommer; G. Roberts Shrimp (Northern) Atlantic coast NShp Mid-1990s G. Brothers; DFO website; R. Ommer; D. Parsons; Canada (1996g); Canada
(1996f); Canada (1997b) Shrimp (Northern) eastern Scotian Shelf Trawl NShpES Mid-1990s P. Koeller; R. Ommer; Canada (1998g); Canada (1997c)
Documenting Documenting RapfishRapfish data sources (2): data sources (2): Canadian fisheriesCanadian fisheries
RAPFISH 1
1. Why do we need it?
2. Anchor points and ordination
3. Evaluation fields and attributes
4. Scoring, killers, documentation
5. Testing the Rapfish method
Towards Ecosystem-Based Management Rapid Appraisal of Status
RekyavikRekyavik, February 2006, February 2006

23
Alternative OrdinationsMonotonicityTracking Simulated Quality
Monte Carlo Simulations for Errors Testing Leverage of Attributes
RAPFISH:
Testing the MethodTesting the Method
Tony Pitcher, Pat Tony Pitcher, Pat KavanaghKavanagh & Jacqueline Alder& Jacqueline Alder
RRAPFISHAPFISH –– Alternative OrdinationsAlternative Ordinations
PCAPCAbiased plotsbiased plots
Fuzzy ordination Fuzzy ordination ideal, but not applied yet ideal, but not applied yet
MDSMDSdistances lineardistances linear

24
Fishery- some 3-step gapsFishery - one-step gapsB
BAD GOOD
Fishery 1Fishery 2 - alternativeA
BAD GOOD
RRAPFISHAPFISH –– testing monotonicity with MDStesting monotonicity with MDS
Simulated fishery improves one step on any attribute at a time Run Rapfish ordination & plot Repeat for another simulated fishery
0 20 40 60 80 100
BAD GOOD
A
B
C
0
20
40
60
80
100
0 2 4 6 8 10 12 14 16 18 20
time
% s
usta
inab
ility
sco
re
`
Fishery A
Fishery B
Fishery C
RRAPFISHAPFISH –– Tracking quality: Tracking quality: 3 simulated fisheries3 simulated fisheries
Simulated fishery A: improves one step on any attribute as far as 50%,returns a different route Fishery B: reverse of AFishery C: same score achieved with different attribute combos

25
Random sample from error distribution of each attribute
Run Rapfish analysis
Repeat 100 times
Plot SDs of x, y scores for each fishery Or medians and IQ ranges
Bad Good
capelin
herring E
mackerelcod
shrimplobster
snow crab Area19
halibut
herring W
trawl
salmon
ling
herring spawn-on-
kelp
0 20 40 60 80 100
RAPFISH: Uncertainty
RRAPFISHAPFISH plot with errors: plot with errors: Canadian Fisheries, ecologicalCanadian Fisheries, ecological
species caught
recruitment variability
discarded bycatch
primary production
change in size caught
change in trophic level
migratory range
exploitation status
catch < maturity
trophic level
range collapse
-10 -8 -6 -4 -2 0 2 4 6 8 10
attr
ibut
e
leverage on sustainability score (se, %)
-12-10-8-6-4-2024681012
leverage on Y axis (se, %)
LeveragesLeverages of attributes of attributes -- small small pelagicspelagics, ecological, ecological
Drop one attribute from setRun Rapfish analysisRepeat for all attributesExamine how x, y scores change
RAPFISH: Leverage (sensitivity)

26
With thanks to : Andrew Bakun, Tim Bostock, John Caddy,
Kevern Cochrane, Serge Garcia, Richard Grainger, Purwito Martosubroto(FAO, Rome)
Jake Rice, Mary Gregory (DFO in Ottawa; Canada)
Doug Ferrell, Peter Gehrke, Geoff Gordon, Steve Kennelly
(NSW Fisheries Laboratory, Cronulla, Australia)
André Punt, Dennis Heinemann (CSIRO, Hobart)Dave Ramm (CCAMLR, Hobart, Australia)
Paul Hart (Leicester, UK)
RAPFISH - acknowledgements
Lake Malawi: sunset


![[eBook - ITA] Friederich Wilhelm Nietzsche - Così Parlò Zarathustra.pdf](https://img.dokumen.tips/doc/110x75/557211fa497959fc0b8fd2dd/ebook-ita-friederich-wilhelm-nietzsche-cosi-parlo-zarathustrapdf.jpg)