Embed Size (px)
Citation preview

http://go.warwick.ac.uk/lib-publications
Original citation: Duncan, David A., Unterberger, W. (Werner), Jackson, D. C., Knight, M. J., Kröger, E. A., Hogan, K. A., Lamont, C. L. A., Lerotholi, T. J. and Woodruff, D. P.. (2012) Quantitative local structure determination of R,R-tartaric acid on Cu(110) : Monotartrate and bitartrate phases. Surface Science, Vol.606 . pp. 1435-1442. Permanent WRAP url: http://wrap.warwick.ac.uk/53591 Copyright and reuse: The Warwick Research Archive Portal (WRAP) makes the work of researchers of the University of Warwick available open access under the following conditions. Copyright © and all moral rights to the version of the paper presented here belong to the individual author(s) and/or other copyright owners. To the extent reasonable and practicable the material made available in WRAP has been checked for eligibility before being made available. Copies of full items can be used for personal research or study, educational, or not-for-profit purposes without prior permission or charge. Provided that the authors, title and full bibliographic details are credited, a hyperlink and/or URL is given for the original metadata page and the content is not changed in any way. Publisher’s statement: “NOTICE: this is the author’s version of a work that was accepted for publication in Surface Science. Changes resulting from the publishing process, such as peer review, editing, corrections, structural formatting, and other quality control mechanisms may not be reflected in this document. Changes may have been made to this work since it was submitted for publication. A definitive version was subsequently published in Surface Science, Vol.606 . pp. 1435-1442. http://dx.doi.org/10.1016/j.susc.2012.05.011 A note on versions: The version presented here may differ from the published version or, version of record, if you wish to cite this item you are advised to consult the publisher’s version. Please see the ‘permanent WRAP url’ above for details on accessing the published version and note that access may require a subscription. For more information, please contact the WRAP Team at: [email protected]
1
Quantitative local structure determination of R,R-tartaric acid
on Cu(110): monotartrate and bitartrate phases
D.A.Duncan1, W. Unterberger2, D.C. Jackson1, M.K. Knight1, E.A. Kröger2,
K.A. Hogan3, C.L.A. Lamont3, T.J. Lerotholi1,4, and D.P. Woodruff1
1University of Warwick, Coventry, CV4 7AL, UK
2Fritz-Haber Institut der MPG, Faradayweg 4-6, D 14195, Berlin, Germany 3University of Huddersfield, Queensgate, Huddersfield, HD1 3DH, UK
4University of Witwatersrand, PO Wits, Johannesburg, 2050, South Africa
Abstract
The local adsorption site of the monotartrate and bitartrate species of R,R-tartaric
acid deposited on Cu(110) have been determined by scanned-energy mode
photoelectron diffraction (PhD). In the monotartrate phase the molecule is found
to adsorb upright through the O atoms of the single deprotonated carboxylic acid
(carboxylate) group, which are located in different off-atop sites with associated
Cu-O bondlengths of 1.92±0.08Å and 1.93±0.06Å; the plane of the carboxylate
group is tilted by 17±6° off the surface normal. The bitartrate species adopts a
‘lying down’ orientation, bonding to the surface through all four O atoms of the
two carboxylate groups, also in off-atop sites. Three slightly different models give
comparably good fits to the PhD data, but only one of these is similar to that
predicted by earlier density functional theory calculations. This model is found to
have Cu-O bondlengths of 1.93±0.08Å and 1.95±0.08Å, while the planes of the
carboxylate groups are tilted by 38±6° from the surface normal.
Keywords: chemisorption; chirality; surface structure; photoelectron diffraction;
copper; tartaric acid
2
1. Introduction
In the last few years there has been increasing interest in the study of chiral
molecules adsorbed on surfaces. This work is motivated by the need to produce
enantiopure chiral molecules (e.g. [1]) for pharmaceutical applications (e.g. [2]);
currently this is generally achieved using homogeneous catalysts that tend to be
expensive and difficult to recover. By understanding the way such molecules
interact with surfaces one might ultimately identify heterogeneous catalysts for
this purpose. Indeed, the addition of chiral molecules, such as tartaric acid, to act
as modifiers to heterogeneous catalysts, such as Raney nickel, has proved to be
successful in this regard [3, 4, 5]. Tartaric acid (which has two chiral centres, see
Fig 1) in its crystalline form was the first material found to have optical activity
[6], now known to be associated with the chirality of the molecule. Its adsorption
on the Cu(110) surface has been used as a model system for extensive
investigation by a range of experimental techniques including low energy electron
diffraction (LEED), scanning tunnelling microscopy (STM), Fourier-transform
reflection-absorption infrared spectroscopy (FT-RAIRS) [7, 8], and also by
density functional theory (DFT) calculations [9, 10, 11
3204
]. The FT-RAIRS results,
in particular, have identified two different surface species that can be formed
through the interaction of tartaric acid with Cu(110) under different conditions,
namely monotartrate and bitartrate, depending on whether only one or both
carboxylic acid groups are deprotonated to create carboxylate (COO-) groups that
can form chemisorption bonds to the surface through the two constituent O atoms.
The long-range ordering of these molecules has been of especial interest because
of the potential significance of the fact that all the ordered phases are globally
chiral, leading to exposed Cu surface regions or ‘gaps’ in the overlayers that are
potential sites for enantiospecific surface chemistry. Several different long-range
ordered phases of the monotartrate species have been identified at different
coverages and temperatures. At room temperature, a sub-saturation
ordered overlayer is formed, which transforms to a
3214
phase at higher

3
coverage. Annealing of this high coverage phase to ~400 K leads to the formation
of a
5214
monotartrate phase, but similar annealing of the lower-coverage
monotartrate phase leads to a
2109
bitartrate phase. A recent DFT study [11]
concluded that the potential barrier for initial deprotonation, to form the
monotartrate species on the Cu(110) surface, is below 0.1eV, whereas the barrier
to form the bitartrate species is more than 1 eV, qualitatively consistent with the
need for increased temperatures to create the bitartrate. The fact that this
conversion only occurs at lower monotartrate coverages is also consistent with the
larger ‘footprint’ of the bitartrate species on the surface, and thus the need for
vacant Cu surface sites. STM images of the
3214
and
2109
phases each
show three adsorbate features per unit cell that are proposed to each correspond to
a single tartrate species; this implies that the coverages of these phases are 0.25
ML and 0.17 ML respectively [7].
While these previous studies of the Cu(110)/tartaric acid system provide
considerable insight into the surface reaction and molecular ordering, none of the
experiments provide information on the local adsorption geometry. It has been
generally assumed that the deprotonated species bond to the surface in a fashion
locally identical to that of the simple carboxylate species formate (HCOO) [12,
13, 14], acetate (CH3COO) [15], and benzoate (C6H5COO) [16
[110]
] on this surface,
with the two O atoms of each carboxylate species occupying near-atop sites
relative to two nearest-neighbour Cu surface atoms along the close-packed
rows. This geometry is consistent with the results of the DFT calculations [9]. Of
course, in the bitartrate phase, bonding of the molecule through both sets of
carboxylate O atoms means that the mismatch of the unstrained surface and
molecular geometry imposes constraints on the exact local bonding sites. A
similar effect is seen in the simple amino acids, glycine (NH2CH2COOH) [17]
and alanine (NH2CHCH3COOH) [18], which bond through both the deprotonated
carboxylate O atoms and the amino N atom, and this three-point bonding on
4
Cu(110) does force one of the O atoms to adopt a site that is substantially
displaced from a local atop geometry. The impact of the four-point bonding of the
bitartrate phase is thus an issue of some interest.
Here we present the first direct experimental quantitative determination of the
local adsorption site of tartaric acid on Cu(110) for both the monotartrate and
bitartrate conformers using scanned-energy mode photoelectron diffraction
(PhD), the same technique that has been used in the past to determine the local
adsorption geometry of other carboxylic acid species on copper surfaces [13, 14,
15, 16, 17, 18]. The PhD technique [19, 20
] exploits the coherent interference of
the directly-emitted component of the photoelectron wavefield, from a core level
of an adsorbate atom, with components of the same wavefield that are elastically
backscattered by the nearby (mainly substrate) atoms. By measuring the
photoemission in specific directions as a function of photon energy, and hence
photoelectron energy and wavelength, the scattered wavefield components shift in
and out of phase relative to the directly emitted component; the resulting
modulations in the detected photoemission intensity, which depend on the
scattering pathlengths, thus provide information on the relative emitter-scatterer
atomic positions. These modulations can be simulated for different structural
models using multiple scattering calculations, and by modifying the structure until
one achieves good agreement with the experimental measurements, the local
adsorption geometry around the emitter can be determined.
We should note that the technique is sensitive to the local structure around the
emitter atoms, so intermolecular scattering generally has a negligible effect on the
observed modulations; there is therefore essentially no dependence on the long-
range order of the overlayer. Intermolecular interactions, such as hydrogen
bonding, can therefore only manifest themselves if they lead to a modification of
the local structure of the individual molecules on the surface.
2. Experimental details

5
The experiments were conducted in an ultra-high vacuum surface science end-
station equipped with typical facilities for sample cleaning, heating and cooling.
This instrument was installed on the UE56/2-PGM-2 beam line of BESSY-II,
which comprised a 56 mm period undulator followed by a plane grating
monochromator [21
]. The sample could be rotated about its surface normal (to
change the azimuthal angle) and about its vertical axis (to change the polar angle),
allowing (simultaneous) variation of incidence and electron collection directions.
Sample characterisation in situ was achieved by LEED, and by SXPS (soft X-ray
photoelectron spectroscopy) using the incident synchrotron radiation. The SXPS
and PhD data were measured using an Omicron EA-125HR 125 mm mean-radius
hemispherical electrostatic energy analyser, equipped with seven-channeltron
parallel detection, which was mounted at a fixed angle of 60° to the incident
radiation, in the same horizontal plane as that of the polarisation vector of the
incident radiation.
A clean, well-ordered Cu(110) surface was prepared from an oriented and
polished crystal slice by the usual combination of Ar+ ion bombardment and brief
annealing to 950 K, to give a sharp (1x1) LEED pattern and a SXP spectrum
devoid of impurities. R,R-tartaric acid dosing of the sample was achieved by
heating the powder (99% purity, Sigma Aldrich) to 400 K. Dosing with the
sample held at 400 K yielded a clear
2109
LEED pattern, consistent with that
expected for the bitartrate phase. Dosing with the sample at room temperature, the
conditions known to produce monotartrate layers, yielded a different LEED
pattern of poor quality; it was not possible to determine whether the pattern
corresponded to the
3204
,
3214
, or
5214
phase.
PhD modulation spectra were obtained by measuring photoelectron energy
distribution curves (EDCs) of the O 1s peaks at 4 eV steps in photon energy, over
the photoelectron kinetic energy range of 50-350 eV for a number of different
polar emission angles in the [001] and [110] azimuths. These data were processed
6
following our general PhD methodology (e.g. [19,20]) in which the individual
EDCs are fitted by a sum of Gaussian peaks, a Gauss error function, and a
template background. The integrated areas of each of the individual chemically-
shifted component peaks were then plotted as a function of photoelectron kinetic
energy, and these plots were used to define a smooth spline which represents the
non-diffractive intensity and instrumental factors. The spline was then subtracted
from, and used to normalise, the integrated areas, to provide the final PhD
modulation spectrum.
3. Results
3.1. SXPS Characterisation
The O1s and C1s SXP spectra from the prepared monotartrate and bitartrate
phases are shown in Fig 2. These SXP spectra clearly show that the coverage in
the monotartrate phase measured here is significantly larger than that of the
bitartrate phase. Comparison of the photoemission intensity ratio of the O 1s and
Cu 3s peaks obtained from a saturated Cu(110)(2x1)-O surface (O coverage 0.5
ML), with those from the tartrate-covered surfaces provides coverage estimates of
0.3 and 0.2 ML for the monotartrate and bitartrate phases respectively. The
spectra of Fig. 2 show (at least) two clearly-resolved chemically-shifted
components in both the O 1s and C 1s photoemission, with a very significant
difference in the relative intensities of the two O 1s components between the
monotartrate and bitartrate species. The fact that there is such a change is
consistent with the different number of deprotonated carboxylic groups in these
two species, as identified in the previous FT-RAIRS study.
The assignment of the two peaks in the C 1s SXP spectra is relatively
straightforward by comparison with spectra from other molecules containing both
a carboxylic acid or carboxylate species, and one or more four-fold coordinated C
atoms. The higher kinetic energy peak may be attributed to the middle carbon
atoms, C(2) and C(3) (Fig. 1), which are bonded to the alcohol groups, while the
lower kinetic energy peak is associated with the outer carbon atoms, C(1) and

7
C(4) that are part of the carboxylic acid/carboxylate groups. One surprising
feature of the C 1s spectra is that the peak at lower kinetic energy appears to be
consistently weaker than the peak at higher kinetic energy, although according to
this assignment, both peaks arise from 2 C atoms in the tartrate species. This
effect has also been observed in C 1s spectra in many other adsorbed
(deprotonated) species produced by reaction with carboxylic acids, notably acetic
acid on Cu(110) [15], glycine on Cu(111) [22] and Pd(111) [23], serine on
Cu(110) [24], and alanine on Cu(110) [25, 26
], and must be attributed to loss of
intensity in one of the peaks to shake-up satellites; the shoulder visible in the
spectra at lower kinetic energy is consistent with this interpretation.
The assignment of the O 1s SXP spectral peaks in the bitartrate species is also
clear. In this species there are four O atoms in carboxylate groups (O(1), O(2),
O(5) and O(6)), and two O atoms on the OH groups (O(3) and O(4)); this would
lead us to expect two peaks with an intensity ratio of 2:1, consistent with the
spectrum in Fig. 2. We can therefore assign the higher kinetic energy peak to
carboxylate O atoms and the lower kinetic energy peak to OH species. However,
in the case of the monotartrate O1s XP spectrum (Fig 2a) there are two peaks with
approximately the same area, but the molecule contains six O atoms in four
different bonding states. As the monotartrate retains two O atoms in OH species
(O(3) and O(4)), and two O atoms in the carboxylate group (O(1) and O(2)), these
four O atoms may be expected to lead to peaks at the same energies as the two
peaks in the bitartrate spectrum. The implication is therefore that the two O atoms
in the remaining carboxylic acid group, namely the C=O and C-OH species, must
have O 1s chemical shifts similar to the carboxylate and OH species of the
bitatrate. It seems most reasonable to assign them to these two components in this
order although, as we shall see, for the purposes of our PhD structure
investigation, the ordering of these assignments proves to be unimportant.
3.2. PhD results: qualitative evaluation
The objective of the PhD analysis is to determine the local adsorption
8
structure of the two different tartrate species on the Cu(110) surface. The
strongest elastic scattering contributions to PhD modulations arise from
scattering by near-neighbour Cu substrate atoms (which are much stronger
scatterers than the O, C and H atoms within the molecule). PhD data from the
adsorbate atoms that are bonded to the surface are thus the primary source of
structural information, and in the present case these are expected to be the O
atoms of the deprotonated carboxylate groups. For this reason we focus our
analysis on the PhD modulation spectra from the higher kinetic energy
component of the O 1s emission spectra.
Proper analysis of PhD in order to extract quantitative structural information
relies on the use of multiple scattering simulations, but visual inspection of the
raw experimental data can often provide some qualitative information. The
experimental PhD spectra associated with the higher kinetic energy O 1s peak
recorded from both the monotartrate and bitartrate species are shown in Fig 3.
The PhD spectra from the O 1s peak at lower kinetic energy were devoid of any
obvious modulations, consistent with our expectation that this emission is from O
atoms that are relatively far from the surface and lack any near-neighbour Cu
scatterer atoms. A striking feature of the data of Fig. 3 is the remarkable similarity
of the spectra from the two different species. One might infer from this that the
two structures are identical, yet our SXP spectra and the associated coverage
estimates, as well as the previously published FT-RAIRS results using similar
preparation methods [7], clearly indicate that the two surface species are different,
while the FT-RAIRS data and STM images further indicate that the two
molecular orientations differ. It is therefore difficult to see how the two adsorption
geometries can be equivalent. The different LEED patterns observed in the
present work also reinforce the view that we are studying different surface phases,
but LEED tends to be dominated by the diffraction pattern of those regions of the
surface that show the best long-range order, which may be a minority phase on
the surface. SXPS, on the other hand, averages over the whole surface, so the
clear difference in these spectra recorded from the two different methods of
surface preparation are indicative of the surfaces being predominantly covered by

9
different species.
In fact a strong similarity in PhD data from the two species is to be expected. We
have already noted that all the bonding carboxylate O atoms (two in the
monotartrate, four in the bitartrate) are likely to adopt near-atop sites. The
different constraints of the anticipated two-point and four-point bonding
geometries, involving some mismatch between interatomic distances on the
surface and within the undeformed molecule, would lead us to expect some subtle
differences in the O bonding sites, but after averaging over the sites of the
inequivalent atoms in the molecules, these differences may have only a modest
effect on the resulting PhD data.
One further qualitative observation is that the dominant long range periodicity of
the modulations seen in data recorded at and near normal emission is quite similar
to that seen from simple deprotonated carboxylates on Cu(110) [14, 15,16]. This
strongly suggests that the emitter O atoms are in similar near-atop sites and at
similar Cu-O bondlengths of ~ 1.90-1.95 Å. However, the fact that the
modulation amplitudes do not decrease substantially with increasing emission
angle may suggest that the emitter O atoms are significantly more displaced from
exact atop sites than is found to be the case for the simple carboxylates on
Cu(110).
3.3. PhD results: quantitative structure determination
In order to achieve a proper quantitative analysis of the PhD data, multiple
scattering simulations for different structural models were performed using the
computer codes developed by Fritzsche [27, 28, 29
19
]. These are based on the
expansion of the final state wave-function into a sum over all scattering pathways
that the electron can take from the emitter atom to the detector outside the sample.
The level of agreement between the theoretical and experimental modulation
amplitudes is quantified using an objective reliability factor (R-factor) [ , 20]
defined in a fashion closely similar to that proposed by Pendry for quantitative
10
LEED studies [30
]. The R-factor is defined such that a value of 0 corresponds to
perfect agreement, and a value of 1 to uncorrelated data. The lowest value
achievable in practice depends on the complexity of the structure and the
amplitude of the modulations, but typically falls in the range 0.2-0.4.
In the present case the structural optimisation to locate the best-fit structure is
complicated by the large number of structural parameters with at least two
inequivalent O emitter sites in each molecule (creating a multidimensional
hyperspace). In order to search for the global minimum of the R-factor in this
parameter space, and to try to avoid convergence on local minima, structural
models were first explored using a particle swarm optimisation (PSO) global
search algorithm described fully elsewhere [31]. Having located potential global
minima by this approach, an adapted Newton-Gauss algorithm was used to
further optimise the structures. Precision estimates associated with the individual
structural parameters were obtained using our standard methodology of defining a
variance, Var(Rmin), of the minimum value of the R-factor associated with a best-
fit structure, Rmin [32]. All parameters values giving structures with R-factors less
than Rmin + Var(Rmin) are regarded as falling within one standard deviation of the
best fit structure. In the structure determination for both the monotartrate and the
bitartrate the molecule was assumed to adsorb intact with similar intramolecular
bondlengths and bond angles to those in the tartaric acid crystal structure [33
[110]
].
The atomic coordinate systems was defined with the x, y and z axes along,
respectively, , [001] and the outward surface normal, [110].
3.3.1 Monotartrate on Cu(110)
In the PhD simulations for the monotartrate species on Cu(110), emission from
three O atoms was assumed to contribute to the higher photoelectron kinetic
energy and thus to contribute to the measured PhD modulations; these are the
two O atoms of the carboxylate group, and one of the two O atoms of the
carboxylic acid group (-COOH). The exact location of this third O atom proves to
have very little influence on the PhD spectra, being located significantly further
11
from the surface than the bonding carboxylate O atoms, so it is unimportant
whether this emitter atom is at the C=O or C-O-H location in the molecule.
Because the molecule is chiral, the two O atoms in the carboxylate group are not
symmetrically identical, with only one of these being adjacent to the neighbouring
alcohol group; all three emitter O atoms were therefore allowed to occupy
inequivalent sites.
In order to explore the multidimensional parameter hyperspace the molecule was
allowed to be displaced independently in the x, y and z directions, and the
orientation of the plane of the carboxylate group was allowed to tilt with respect
to, and rotate about, the surface normal. The PhD technique is generally rather
insensitive to the position of intramolecular (low mass number) scatterers, so the
sensitivity to variations in the x, y and z position of the whole molecule, and to the
rotation (φ(COO) relative to the [110] direction) and tilt (θ(COO) relative to the surface
normal) of the plane of the carboxylate group, arises primarily from their effect in
changing the vector between the O atoms of the carboxylate group and their
nearest Cu atoms; there is also a much weaker dependence on the location of
these O atoms relative to the nearest-neighbour carboxylate C atom. The position
of the third (carboxylic acid) emitting O atom is effectively varied by the rotation
of the three C-C bonds, but the calculations were found to have no sensitivity to
the position of this emitter atom as long as it was a significant distance from the
substrate. In addition, the nearest-neighbour Cu atoms to the carboxylate O atoms
were allowed to relax in z independently relative to the underlying crystal, as was
the whole first layer of Cu atoms.
The best fit structure that was found is shown schematically in Fig. 4, together
with a comparison of the simulated and experimental PhD spectra. The
corresponding R-factor value for the full set of spectra measured in 11 different
directions is 0.32. Note that several of the experimental spectra show quite weak
modulations and thus a poor signal-to-noise ratio. If these spectra are omitted
from the theory-experiment comparison, and the R-factor is calculated only for
the 5 spectra showing the strongest modulations, the R-factor drops to a value of
12
0.23. The Cu-O bondlengths in this structural solution are 1.92±0.08Å and
1.93±0.06Å for the two carboxylate O atoms (the error estimates being based on
the full set of 11 spectra). The values of all the structural parameters in this model
are shown in table 1.
3.3.1 Bitartrate on Cu(110)
For the multiple scattering PhD simulations from the bitartrate species, we
assume that the four carboxylate O atoms are the emitters that contribute to the
PhD spectra. In this case too, the chirality of the molecule means that the two O
atoms in a single carboxylate group need not occupy locally equivalent sites;
indeed, the mismatch of interatomic spacings in the molecular footprint and in the
underlying Cu(110) structure means that some inequivalence is to be expected.
However, as the molecule does have 2-fold rotational symmetry, the diagonally-
related O atoms (O(1)/O(6) and O(2)/O(5) of Fig. 1) may be expected to occupy
equivalent adsorption sites. Strictly, this is only true if the 2-fold rotation axis of
the molecule coincides with one of the 2-fold rotation axes of the underlying
surface, but we do make this assumption. The molecule is assumed to bridge two
adjacent close-packed [110] Cu rows on the surface.
These two constraints have two implications in the geometry of the molecule.
Firstly, the C(2)-C(3) bond in the middle of the molecule must be parallel to the
surface. Secondly, the molecule must be centred over a hollow site (directly atop
a second-layer Cu atom) or over a long-bridge site (midway between two adjacent
Cu atoms along [001], because these are the two positions having 2-fold rotational
symmetry that lie between the close-packed [110] Cu rows. Note that the
assumption that the intramolecular bond angles remain the same as in the intact
molecule also implies that the COO plane must be tilted relative to the surface
normal by more than 19°.
13
A global structural search was pursued including all C and O atoms; all our PhD
calculations neglect the extremely weak scattering from H atoms. The two
symmetry-constrained models with the molecule centred over hollow and long-
bridge sites (as seen in Fig 6 and Fig 7 respectively), were explored
independently. The centre of the molecule was allowed to vary in z, while the
carboxylate groups were allowed to rotate around the adjacent C-C (C(1)-C(2)
and C(4)-C(3)) axes (φ(COO)), and to tilt with respect to the surface normal
(θ(COO)); the whole molecule was also allowed to rotate relative to the surface
normal about its centre (φtartaric). The Cu atoms closest to the emitting O atoms
were also allowed to relax by small amounts in the y and z directions, while the
emitting O atoms were allowed to vary independently in x by a small amount.
Three competing models with comparably-favourable R-factors were found
through this search. Two of the models are centred over the hollow site while the
third has the molecule centred on the long-bridge site.
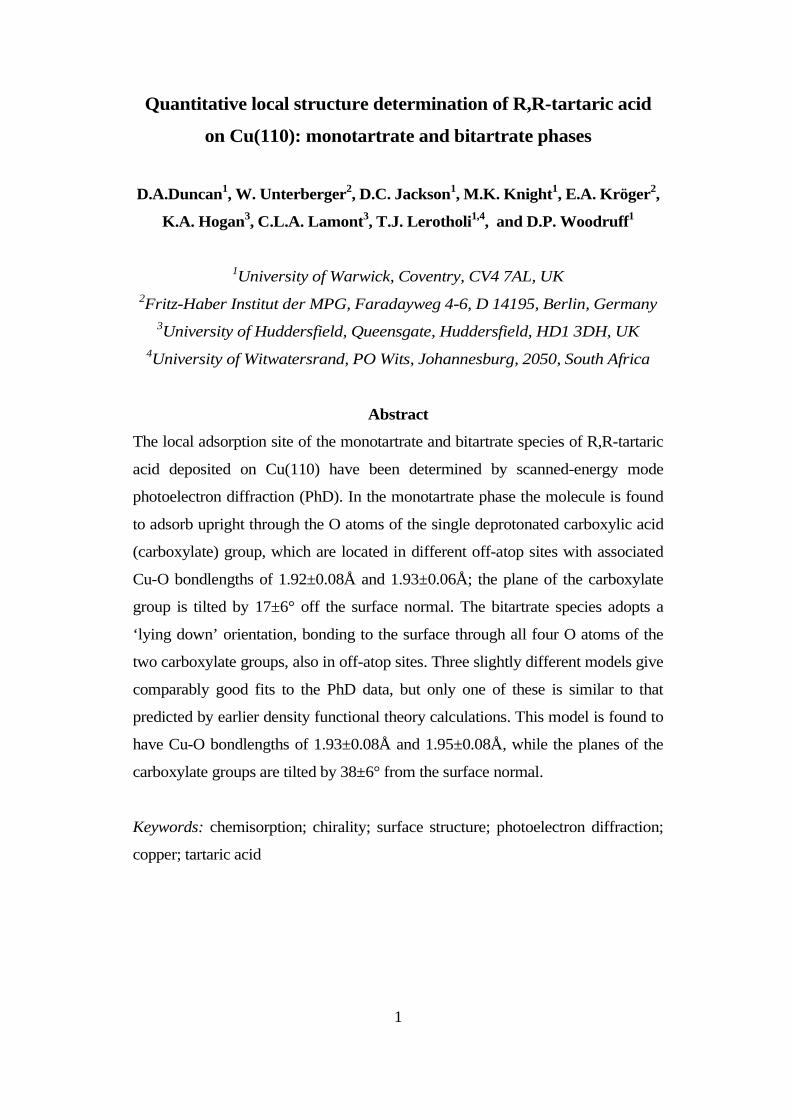
Of the two hollow-site models, one is found to have a tilt angle of the COO plane
of only 38±6° relative to the surface normal and we refer to this as the ‘upright’
hollow model. The associated Cu-O bondlengths are 1.94±0.06Å and
1.95±0.09Å, and the R-factor value is 0.45, the highest of the three preferred
models. This structure is shown schematically in Fig. 5, together with a
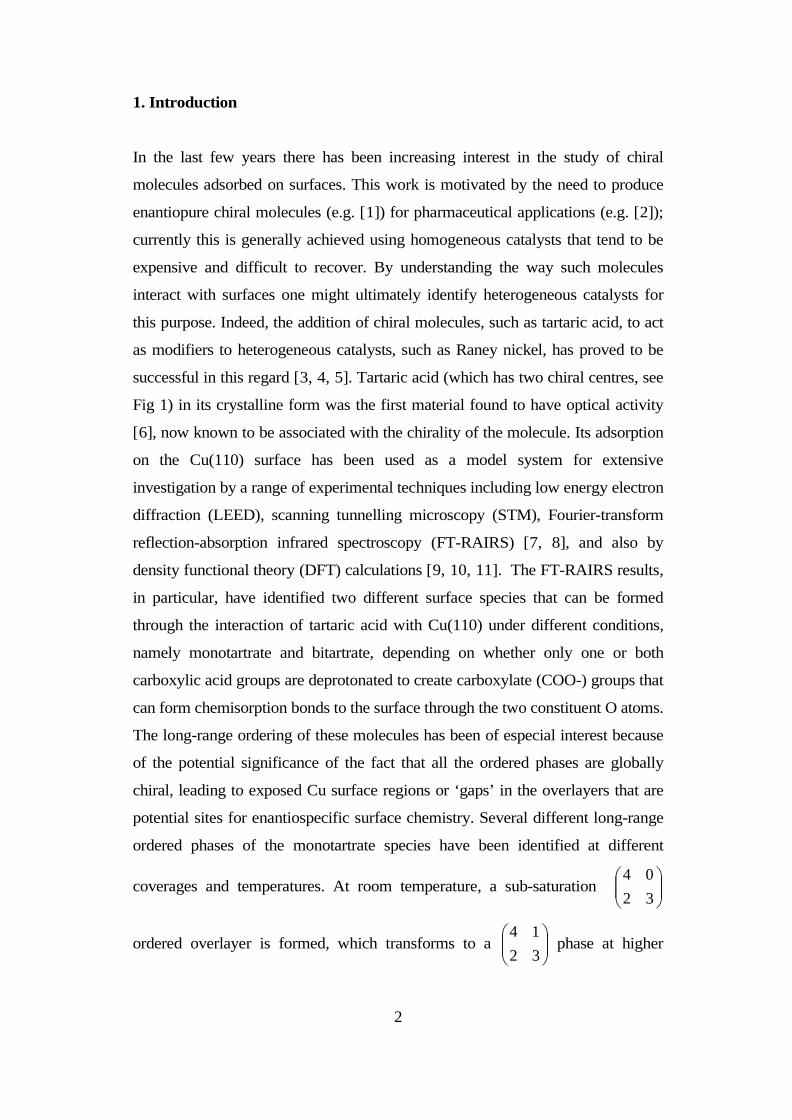
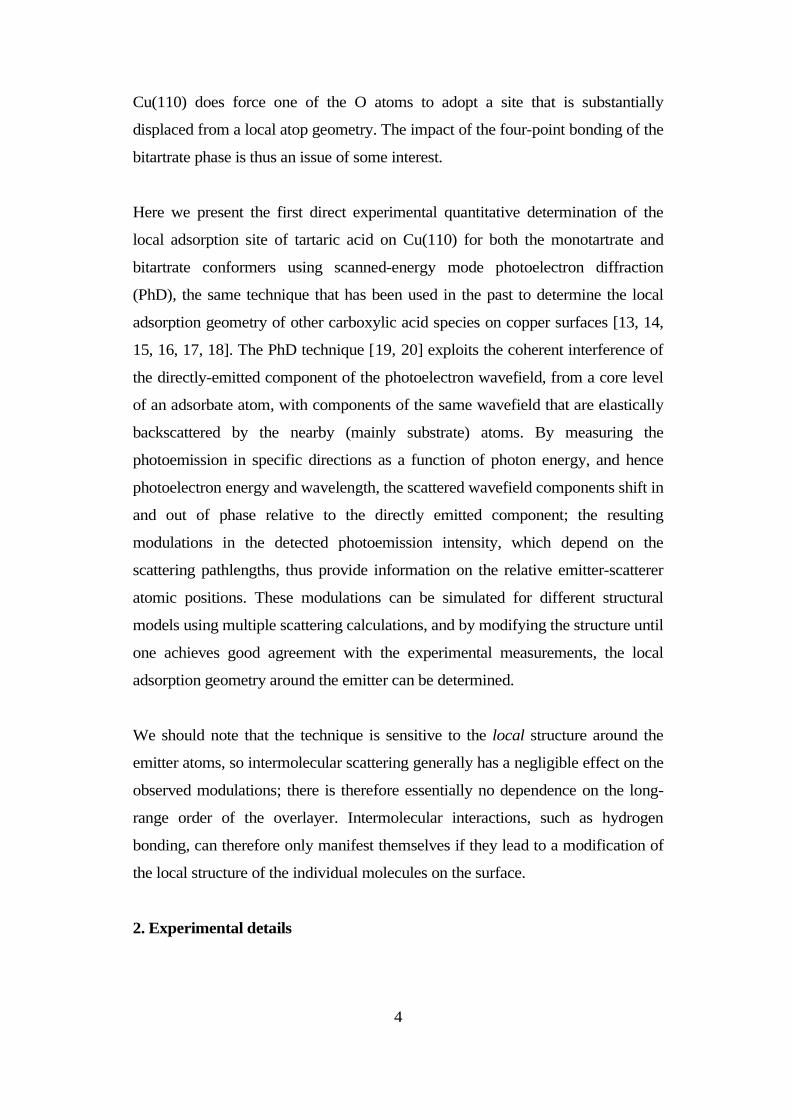
comparison of the experimental and simulated PhD spectra. The other two
models, one with the molecule in the hollow site (‘flat’ hollow), the other in the
bridge site, are shown in Figs 6 and 7, together with the associated comparisons
of the theoretical and experimental PhD spectra. Despite the differences in the
lateral position of the molecule as a whole, the local positions of the bonding O
atoms with respect to the substrate Cu atoms are essentially identical, thus leading
to closely similar PhD spectra. The Cu-O bondlengths in the two models are
1.93±0.08Å/1.95±0.08Å and 1.94±0.07Å/1.97±0.09Å; both models give an R-
factor of 0.43. These two models have the COO planes comparatively flat on the
surface, with a tilt of 70±10° relative to the surface normal.
The comparatively high R-factors found in these bitartrate structures can be
14
attributed to the relatively poor signal-to-noise ration of the PhD spectra that arise,
at least in part, from the lower molecular coverage (by a factor of ~2), and the
thus weaker photoemission signal, than that of the monotartrate phase. Note that
STM images of the bitartrate phase [8] indicate that the local environments of the
molecules are not all identical, so very small differences in the local adsorption
sites could arise. In PhD, however, these small changes in local coordinates would
lead to an increased Debye-Waller factor that would typically be interpreted as
indicating larger atomic vibrational amplitudes (static and dynamic displacements
having the same effect). The present analysis showed no such enhanced Debye-
Waller factor, so it appears that and small variations in the local geometry of the
distinct molecules within the surface unit mesh are too small to detect, and are not
the source of the inferior R-factor.
4. General discussion and conclusions
Here we have presented the results of the first direct structural information for the
local adsorption site of tartaric acid on Cu(110). As expected, the bonding
carboxylate O atoms in the monotartrate and bitartrate phase are found to occupy
similar near-atop sites, with no significant differences in Cu-O bondlengths
(1.92±0.08/1.93±0.06Å and 1.93-1.97±0.06-0.09Å, respectively). These values
are comparable to those found in DFT calculations for the bitartrate species (1.96-
1.98 [9] and 1.92-2.01 Å [11]), and to experimentally-determined values for
other species on Cu(110) that form a chemisorption bond through their
carboxylate O atoms; 1.90±0.03Å for formate on Cu(110) [14], 1.91±0.04Å for
acetate [15], 1.91±0.02Å for benzoate [16], and 2.02±0.04Å/2.00±0.04Å for
glycinate [17], and 1.90-2.04±0.03Å for alaninate [18]. Interestingly, the
bondlengths found for the monotartrate, which bonds to the surface only through
one carboxylate species, is essentially identical to those of the simple carboxylates
that bond in the same way, while the slightly longer bondlength seen for bitartrate
with a four-point bonding to the surface is also seen in the two amino acids with
three-point bonding. Whether this marginally-significant difference is due to the
geometrical constraints or through-metal effects on the near-neighbour bonding

15
Cu atoms is unclear.
Based on the PhD data analysis alone we are unable to distinguish between the
three competing bitartrate models. We note, however, that the published DFT
calculations [9, 11] show the bitartrate centred on the hollow site which would
exclude our bridge site solution (Fig.7), although it is not clear that the bridging
model was explicitly tested in these calculations. Although none of the DFT
investigations report specific values for the orientation of the COO plane in the
bitartrate calculations, the schematic diagrams presented in these papers indicate
the tilt angles from the surface normal are small. The ‘upright’ hollow geometry
of Fig. 5 is thus the one model that is consistent with both the PhD data and the
results of the DFT calculations. Moreover, only this model has C-C bonds tilted
out of the surface consistent with an earlier angle-scan X-ray photoelectron
diffraction study (XPD) [34
]. As such the upright hollow geometry is the most
probable structure.
Acknowledgements
The authors acknowledge the benefit of useful discussions with Rasmita Raval
and Karsten Horn, and assistance from Philipp Schmidt-Weber, regarding the
preparation of the surfaces investigated here. Partial support of the Engineering
and Physical Sciences Research Council (UK) for this work is acknowledged.
The computing facilities were provided by the Centre for Scientific Computing of
the University of Warwick with support from the Science Research Investment
Fund.

16
Figure 1: Schematic representation of the two chiral forms of tartaric acid with the
chiral centres denoted by ‘*’. The molecule on the left is the R,R-enantiomer that
was used in this study and on the right is the mirror image, the S,S-enantiomer.

17
Figure 2: O 1s and C 1s SXP spectra of the monotartrate and bitartrate phases on
Cu(110). The C 1s spectra for the bitartrate phase shows a small shoulder at high
kinetic energy, attributed to atomic carbon resulting from partial decomposition of
tartaric acid. All spectra were measured at normal emission.

18
Figure 3: Comparison of the experimental PhD spectra from the mono- and bi-
tartrate phases on Cu(110) for several polar and azimuthal emission directions.
Only the 11 spectra with the strongest modulations are shown.
19
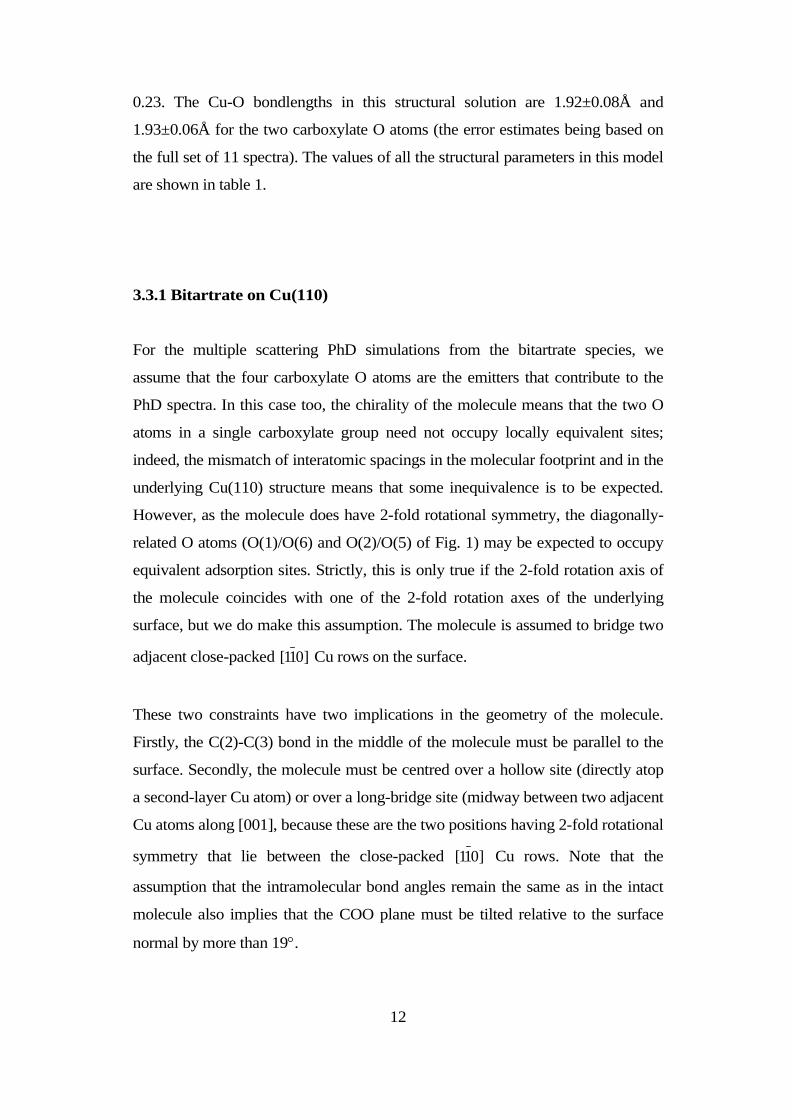
Figure 4: Comparison of the experimental PhD spectra from the higher kinetic
energy O 1s peak (Fig. 2) and the results of the simulations for the best-fit
structural model for the monotartrate species on Cu(110). On the right is shown a
schematic representation of the adsorption geometry. The C atoms are shown in
black, while the O emitter atoms contributing to the higher kinetic energy O 1s
peak are shaded red. The other O atoms are shaded pink. The (weakly-scattering)
hydrogen atoms are not shown, as they were not included in the multiple
scattering calculations.

20
Figure 5: Comparison of the experimental PhD spectra from the higher kinetic
energy O 1s peak (Fig. 2) and the results of the simulations for the best-fit
bitartrate ‘upright’ hollow structure on Cu(110). A schematic representation of the
adsorption geometry is shown on the right in perspective and plan views. The C
atoms are shown in black, while the O emitter atoms contributing to the higher
kinetic energy O 1s peak are shaded red. The other O atoms are shaded pink. The
(weakly-scattering) hydrogen atoms are not shown, as they were not included in
the multiple scattering calculations.

21
Figure 6: Comparison of the experimental PhD spectra from the higher kinetic
energy O 1s peak (Fig. 2) and the results of the simulations for the best-fit
bitartrate ‘flat’ hollow structure on Cu(110). A schematic representation of the
adsorption geometry is shown on the right in perspective and plan views. The C
atoms are shown in black, while the O emitter atoms contributing to the higher
kinetic energy O 1s peak are shaded red. The other O atoms are shaded pink. The
(weakly-scattering) hydrogen atoms are not shown, as they were not included in
the multiple scattering calculations.
22
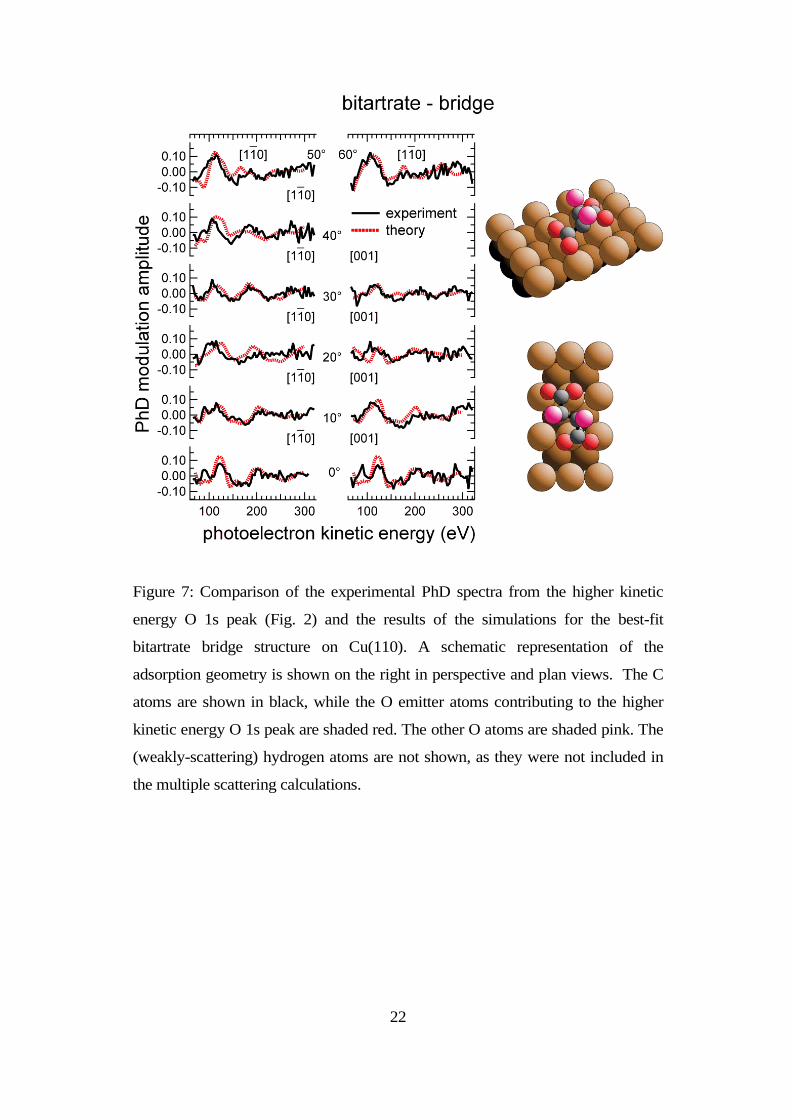
Figure 7: Comparison of the experimental PhD spectra from the higher kinetic
energy O 1s peak (Fig. 2) and the results of the simulations for the best-fit
bitartrate bridge structure on Cu(110). A schematic representation of the
adsorption geometry is shown on the right in perspective and plan views. The C
atoms are shown in black, while the O emitter atoms contributing to the higher
kinetic energy O 1s peak are shaded red. The other O atoms are shaded pink. The
(weakly-scattering) hydrogen atoms are not shown, as they were not included in
the multiple scattering calculations.

23
Table 1: Structural parameter values for the best-fit monotartrate model and the
three best-fit bitartrate models. d values are bondlengths, x, y and z are
coordinates of O emitter atoms relative to the nearest-neighbour Cu atom, and of
these surface Cu atoms relative to their positions in an ideal bulk-termination,
along, respectively, [110], [001] and the outward surface normal, [110]. θ(COO) and
φ(COO) are the tilt and twist angles of the COO plane relative to, respectively, the
surface normal and the [110] direction. φtartaric is the rotation angle of the complete
molecule about its centre relative to the surface normal; when φtartaric = φ(COO) = 0°,
the vector between the O atoms of the carboxylic acid group is along [110].
monotartrate bitartrate
‘upright’
hollow
bitartrate
‘flat’
hollow
bitartrate
bridge
R-factor 0.32 0.45 0.43 0.43
dCu-O(1) (Å) 1.92±0.08 1.94±0.06 1.93±0.08 1.94±0.07
dCu-O(2) (Å) 1.93±0.06 1.95±0.09 1.95±0.08 1.97±0.09
zO(1) (Å) 1.84±0.06 1.89±0.08 1.78±0.08 1.86±0.08
zO(2) (Å) 1.89±0.06 1.86±0.08 1.85±0.08 1.77±0.08
xO(1) (Å) 0.1(+0.3/-0.1) 0.2±0.2 0.6±0.1 -0.4±0.1
yO(1) (Å) -0.6(+0.6/-0.4) 0.4±0.2 -0.4±0.2 -0.4(+0.2/-0.3)
xO(2) (Å) -0.4±0.4 -0.3±0.1Å 0.3±0.1 -0.8±0.1
yO(2) (Å) 0.2(+0.2/-0.3) -0.5±0.2Å -0.5±0.3 -0.4(+0.6/-0.2)
θ(COO) (°) 17±6 38±6 70±10 70±10
φ(COO) (°) 20±10 2±4 -1±3 -2(+4/-2)
φtartaric (°) -- 23±4 5±5 0±3
dO-O (Å) 2.2±0.1 2.2±0.1 2.2±0.1 2.2±0.1
zCu{O(1)} (Å) 0.0±0.1 -0.1±0.1 -0.1±0.2 -0.1±0.1
zCu{O(2)} (Å) 0.0±0.1 0.1±0.1 0.0±0.1 0.0±0.1
yCu{O(1)} (Å) -- 0.0±0.4 0.1±0.3 0.1±0.4
yCu{O(2)} (Å) -- 0.0±0.3 0.0±0.3 0±1

24
References
1 W.S. Knowles, Angew. Chem. Int. Ed., 41 (2002) 1998.
2 W.F. Kean, C.J.L. Lock, H.E. Howard-Lock, Lancet, 338 (1991) 1565.
3 J.A. Groenewegen, W.M.H. Sachtler, J. Catal., 38 (1975) 501.
4 A. Hoek, W.M.H. Sachtler, J. Catal., 58 (1979) 276.
5 Y. Izumi, Adv. Catal., 32 (1983) 215.
6 L. Pasteur, Annal Chim Phys, 24 (1848) 442.
7 M.Ortega Lorenzo, S. Haq, T. Bertrams, P. Murray, R. Raval, C.J. Baddeley, J.
Phys. Chem. B, 103 (1999) 10661.
8 M.Ortega Lorenzo, C.J. Baddeley, C. Muryn, R. Raval, Nature 404 (2000) 376.
9 L.A.M.M. Barbosa, P. Sautet, J. Am. Chem. Soc., 123 (2001) 6639.
10 C.G.M. Hermse, A.P. van Bavel, A.P.J. Jansen, L.A.M.M. Barbosa, P. Sautet,
R.A. van Santen, J Phys Chem B, 108 (2004) 11035.
11 J. Zhang, T. Lu, C. Jiang, J. Zou, F. Cao, Y. Chen, J Chem Phys, 131 (2009)
144703.
12 M.D. Crapper, C.E. Riley, D.P. Woodruff, Surf. Sci. 184 (1987) 121.
13 D.P. Woodruff, C.F.McConville, A.L.D.Kilcoyne, Th.Lindner, J.Somers,
M.Surman, G.Paolucci, A.M.Bradshaw, Surf. Sci. 201 (1998) 228.
14 D. Kreikemeyer Lorenzo, W. Unterberger, D.A. Duncan, M.K. Bradley, T.J.
Lerotholi, J. Robinson, D.P. Woodruff, Phys. Rev. Lett., 107 (2011)
046102.
15 K.-U. Weiss, R.Dippel, K-M.Schindler, P.Gardner, V.Fritzsche,
A.M.Bradshaw, A.L.D.Kilcoyne, D.P.Woodruff , Phys. Rev. Lett. 69 (1992)
3196.
16 M. Pascal, C.L.A. Lamont, M. Kittel, J.T. Hoeft, R. Terborg, M. Polcik, J.H.
Kang, R.Toomes, D.P. Woodruff, Surf. Sci. 492 (2001) 285.
17 J.-H. Kang, R. L. Toomes, M. Polcik, M. Kittel, J.-T Hoeft, V. Efstathiou, D. P.
Woodruff, A. M. Bradshaw, J.Chem.Phys. 118 (2003) 6059.
18 D.I. Sayago, M. Polcik, G. Nisbet, C.L.A. Lamont, D.P. Woodruff, Surf. Sci.
590 (2005) 76.
19 D. P. Woodruff, A M Bradshaw, Rep. Prog. Phys., 57 (1994) 1029.

25
20 D. P. Woodruff, Surf Sci Rep, 62 (2007) 1
21 M.R. Weiss, R. Follath, K.J.S. Sawhney, F. Senf, J. Bahrdt, W. Frentrup, A.
Gaupp, S. Sasaki, M. Scheer, H.C. Mertins, D. Abramsohn, F. Schäfers, W.
Kuch, W. Mahler, Nucl. Instrum. Meth. A, 467-468 (2001) 449.
22 D.A. Duncan, M.K. Bradley, T.J. Lerotholi, D. Kreikemeyer Lorenzo, W.
Unterberger, D.P. Woodruff, to be published
23 F. Gao, Z. Li, Y. Wang, L. Burkholder, W.T. Tysoe, J. Phys. Chem. C., 111
(2007) 9981.
24] T. Eralp, A. Shavorskiy, Z. Zheleva, G. Held, N. Kalashnyk, Y. Ning, T.
Lineroth, Langmuir, 26 (2010) 18841.
25 M. Polcik, F. Allegretti, D.I. Sayago, G. Nisbet , C.L.A. Lamont, D.P.
Woodruff, Phys. Rev. Lett. 92 (2004) 236103.
26 G. Jones, L.B. Jones, F. Thibault-Starzyk, S.E. A, R. Raval, S.J. Jenkins, G.
Held, Surf. Sci., 600 (2006) 1924,
27 V. Fritzsche, J. Phys.: Condens. Matter, (1990) 1413.
28 V. Fritzsche, Surf. Sci., 265 (1992) 187
29 V. Fritzsche, Surf. Sci., 213 (1989) 648
30 J.B. Pendry, J. Phys. C, 13 (1980) 937
31 D.A. Duncan, J.I.J. Choi, D.P. Woodruff, Surf. Sci. 606 (2012) 278.
32 N.A. Booth, R. Davis, R. Toomes, D.P. Woodruff, C. Hirschmugl, K.M.
Schindler, O. Schaff, V. Fernandez, A. Theobald, P. Hofmann, R. Lindsay,
T. Gießel, P. Baumgärtel, A.M. Bradshaw, Surf. Sci., 387 (1997) 152.
33 F. Stern, C.A. Beevers, Acta Cryst., 3 (1950) 341.
34 R. Fasel, J. Wider. C. Quitmann, K.-H. Ernst, T. Greber, Angew. Chem. Int.
Ed. 43 (2004) 2853.