Embed Size (px)
Citation preview
REP~660&-WGVtA~*NTFXP914SE!
Lol
0LflI
THE NUCLEATION
OF
CAVITATION IN AQUEOUS
ME•DIA
DTIC
LL-
ga This document has beet approved.ol public release and salei itsdistribution is unlimited-
THE UNIVERSITY OF MISSISSIPPiPHYSICAL ACOUSTICS RESEARCH GROUP '.1DEPARTMENT OF PHYSICS AND ASTRONOMY
b54 129 -
7::::.::-t
Approved for Public Release: Distribution Unlimited
Teclnical Report for •
Office of Naxll Research
Contract NOOO14-84-C-0193
TIME NUCLEATION 0OF
CAVITATION IN AQUEOUS
M4EDIA- 0*
by
A. A. Atchley* and L. A. Crum F . 5 1985Phiysical Acoustics Research Laboratory
Department of Physics and AstronomyThe University of Mississippi A
University, MAS 38677
.7. --.... °--. ..- ,
*Ph.D dissertation directed by L. A. Crum.
Reproduction in whole or in part is permi tted for any purpose by the U. S.Gove rmnent
...........................................................
................................... I........... -I1 I I- ill II••l•I. I.M "III.... II

Unclassified ___
SECURITY CLASSIFICATION OF 1 HIS PAGE , Dmr. Ete,.cd)
RFAD rNSTRUCTIONS :.REPORT DOCUMENTATION PAGE 3EFORE COMPLETING FORM
REPORT NUMBER 12 GOVT ACCESSION NO.I 3 RECIPIENT'S CATALOG NUMBER
1-85 _ _ _ _ _ _ _
A TITLE (end SurlrI.J S. I YPE OF NEPORT 6 PERIOD COVERED
The Nucleation of Cavitation in AqueousMed ia •. Technical O•
Media 6 PERFORMING OPG. REPORT NUMBER
7. AUTH.OR(*) 8- CONI 1RACT OR GRANT NU•M-B ---
A. A. Atchley arid L. A. Crum NOCO14-84-C-0193
9. PERFORMING ORGANIZATION NAME AND ADDRESS 10. PRL'GRAM ELEMENT. PROJECT. 'TASK(AREA 6 WOrK UNIT NUMBERS
Physical Acoustics Research Laboratory
Department of Physics, University of MS11 - -S _t y , %S -18677•
11. CONTROLLING OFFICE NAME AND ADDORESS 12. REPORT CATE
Office of Naval Research, Physics Divisior, 1-25-85
Code 412, Arlington, VA 22217 13I;OPGES
14. MONITORING AGENC'r N AME 8 AODRESS(II dill.,-,f lioC n gLIn Office) 15. SECURITY C L A 5 5. I~ tPI 1 .porlJ
Unclassified
_i~a7-DECL ASSIFICATriON/OOWNGRAOING5CHEDULE
15. DISTRIBUTION STATEMENT (.f thI. Report)
Approved for public release; distribution unlimited
17. OISTRIBUTION S1 ATEMENT (ol the . belt.ct •ntIred 1. Block 20, ZI diffrent fro Report)
18. SUPPLEMENTARY NOTES
M1. KEY WORDS (Continu. o, reveree aide it neceev.- ••d Idantity by block ou~ber, S
Acoustic cavitation nonlinear oscillation,nucleation bubbles-I- , f , II
20. Aý.Sl R.ACT (C-ntl.n" .•de.e dde If -r..... y ad Identiy by block b ) - - .-./ '/1 */
The topic of this report is cavitatjon nucleation andconcerns itself ',ith both the. cavitation'nucleus and the mechan-isms bv which the nucleus is stabilized. /"Three differentttheor-
ies of ttke cavitatinn nude-is are-considered most plausible.
They are the crevice model, the surfactant skin model, and theionic skin model. -These hypothesized nuclei are physically
DD FJAN23 1473 EDITIONOF 1iL Unclassified " "'-'-'
S0102 0 1SECURITY CLASSIFICAT:ON Or lplS PAGE (S'ln . Bnle•dj
-9•1

. h. . . . .. .. . . .. . . . . . .
Unclassif ed(SECURITY CLASSIFICATION OF THIS PAGE Wi-e.n Dale EntM.ed)
different and each has been used to explain separate groupsof data. Presented in this report are theoretical and experi-mental advances made while searching for a unified model of acavitation nucleus.
,The previous crevice model +h-a-d" required that, in order fora vaporous cavity to grow from a crevice nucleus, the liquid-gas interface must reach the receding contact angle. Thiscondition is necessary,'but not sufficient. An additionalcriterion is that the radius of curvature of the interface mustbe greater than a critical radius, beyond which the cavity is _mechanically unstable. Using these nucleation criteria, themodel is rederived_. The results of the rederivation are quitesatisfactory.%•Both the~old and new crevice models predict thecavitation threshold as a function of surface tension and temp-erature wel]. However, theyv4-a-ls)diverge when predictions ofthe threshold as a function of dissolved gas content are consid-ered. The old crevice-model predicts a linear dependence butexperiment shows t-he-t, the threshold increases rapidly withdecreasing gas content. This behavior is predicted by therevised model .... . .
In addition to vaporous cavitation, the revised model isapplied to diffusion cavitationA 4-s--is shown that the model----.-predicts features present in the data previously explained onlyin terms of the varying-permeability model. 4--
The experimental part of the dissertation consists of aseries of experiments performed to measure the acoustic cavita- .tion threshold of water as a function of the dissolved ionconcentration. The results indicate that up to about I mmol/], ... ;the threshold increases with increasing concentration. Thisis directly opposite to predictions based on the ionic skinmodel. However, the results of these experiments are difficultto explain with any of the models in their present o.tate ofdevelopment... .
I -.---.---
/N 0102- LF-- 014 6601Unclassified .
SECURiTy CL ASSIFICATION OF THIS PAGE(Iften Dol( ErIt-sd)

4 S.
ACKNOWLEDGEMENTS
I would like to acknowledge the support and encouragement of my
advisor and friend Dr. Larry Crum. I extend my gratitude to Dr. Andrea
Prosperetti who suggested that I apply the concept of a critical radius to .
the crevice model. I would alsc like to thank my fellow graduate students
for many useful discussions and their companionship.
The financial support of the Office of Naval Research and the National P
Science Foundation that permitted me to work as a research assistant is
also gratefully acknowledged.
Finally, I thank my parents and brother for their complete support in P
my pursuit of this non-traditional career.
- L
III
iii;
•3--ii

TABLE OF CONTENTS.-
PaSe
LIST OF FIGURES .................... ................ vii
Chapter
1. INTRODUCTION ........................ 1
1-1 Statement of the Problem ..... ............... .
1-2 Historical Persoective ........... .................
fa 1-3 Review of Stabilization Mechanisms ....... .......... 9
1-3.1 Ionic Skin Model ...... ............. .. .. 10
1-3.2 Rigid Oceanic Skin Model ... .......... .. 14
1-3.3 Varyiinsg Perrjeidbility Model ... ........ ..... 15
1-3.4 Crevice Model ........... ............•• . 21
1-4 Final Introductory Remarks ....... ............ .. 25
*2. DERIVATION OF CAVITATION THIRESHOLDS USING T14FCRITICAL RADIUS APPROACH TO THE CREVICE YODEL ........... 27
2-1 Introduction ............... .................. .. 27
2-2 Critical Radius .................. .................. 28
2-2.1 Critical Radius for Growth byGaseous Diffusion ..... ............. .. 28
2-2.2 Critical Radius for Growth in the
Absence of Diffusion .... ........... ..... 31
2-3 Threshold Derivations ........ ................ 32
2-3.1 Acoustic Cavitation Nucleation .. .-......... 33
ivv S
. .- .It..i-

Chanter Pa c -e
2-3.2 Diffusion Cavitation Nucleartion. ....... ... 40
3. ANALYSIS OF THE CRITICAL RADIUSAPPROACH TO T13E CREVICE MODEL .......... ............ .. .. 48
3-1 Introduction ............. .................... .. 48
3-2 Application of the Crevice Modelto Acoustic Cavitation ...... ................ .. 48
3-2.1 The Effect of Dissolved
Gas Pressure ....... ............... .. 48
3-2.2 The Effect of Surface Tension ......... ... 59 P
3-2.3 The Effect of Temoerature ............. .. 60
3-2.4 Comments on Sensitivity. .............. 67
3-3 Application of the Crevice Model to . .Diffusion Cavitation*. . .. .. .. .. .. .. .. 71. .
4. OTHER CANDIDATES FOR THE CAVITATION NUCLEUS. ......... ... 76
4-1 Introduction ............ ..................... .. 76
4-2 ionic Skin Model ......... ................... .. 76
4-3 Varying-Permeability Model ......... ............ .. 80 -"-1
5. SUKIMARY, CONCLUSIONS
AND TOPICS FOR FURTHER STUDY ...... . ............... 90 P
5-i Summarv of the Dissertation ..... ............. .. 90
5-2 Conclusions ............. ..................... 91
5-3 Topics for Further Study. ..... ............... 92 P
REFERENCLS ........................... ............................. 94
APPENDIX......................................................... . -98
A-I Introduction ................. .................... 98
- -*;-~:-r-:;-;-.-..---

vi 9
Chapter p -
A-2 Purpose of the Experiment .......... .............. 9.
A-3 Experimental Apparatus ......... ............... .. 98
A-4 Experimental Procedure ......... ............... .. 103
A-4.1 Procedure for Sample Preparation ........ .. 104
A-4.2 Procedure for Data Acquisition ...... ....... 107
A-5 Results of the Experiment ...... .............. .. 108
BIOCRAPHICAL SKFTCH OF THF AUTHOR ............. .................. 113u.
- °. - . . • .li-i :
'---. - ...

LIST OF FIGUIRFS
Figure Pace
1. Threshold versu Dissolved on Concentrations 12
2. Illustration of a surfactant skin nucleus ... ......... .. 16
3. Typical pressure schedule for acompression/decompression experiment .... ............ ..
* 4. Plot of P versus P.................. 20ss crush .
5. Diagram of a gas-filled conical creviceembedded in a hydrophobic solid ...... .............. .. 22
6. Illustration of a free bubble surroundedby a liquid ...................... ........................ 29
7. Diagram of a crevice model nucleus ....... ............... 34
8. Illustration of crevice geometry. ..... ........... . . . 37
9. TllIstration of interfacila motion during -
the compression phase of a compression/decompression process . .................. .. .-
10a. Theoretical Prediction of the cavitationthreshold as a function of dissolved gaspressurc for a surface tension of 70 dyn/cm .... ........ 50 _
10b. Theoretical prediction of the cavitationthreshold as a function of dissolved gaspressure for a surface tension of 40 dvn/cm ........ .... 51
Ila. Graph of threshold versus gas pressure. ............ ... 53
Ilb. Graph of threshold versus gas press! re forlow gas Pressures . . . . . .... ... . ........ ........ . 54
12. Graph of Mlake threshold vers.us P.as pressure ..... ........ 5F
13. Graph of threshold versus surface tension.. .... ...... . 61
1 4 a. Illustration of the polvnomial fit used to determinePenrv's law constant as a function of temneracture ....... ... b3
vii .
• .S
I' ,
viii
Figure
14b. Illustration of the polynomial fit used todetermine the surface tension of water asa function of temperature ............. ................. 64
15. Graph of threshold versus temperature ....... .......... £6
16a. Graph of threshold versus surface tensionSillustrating the sensitivity of equation (31) ...... ...... 68
16b. Graph of threshold versus surface tensionillustrating the sensitivity of equation (31) ......... .. 69
16c. Graph of threshold versus surface tensionillustrating the sensitivity of equation (31) ......... .. 70 -
17. Plot of P versus P _ illustratinathe change in slope a h w-P*S.. .. . rush , rushas predicted by the ..... . . . . . . . ......... 74
-ia. Craoh of normalized cavitation thresholdversus the log of the dissolved iouconcentration for KI ............ .................. 78
18b. Graph of the normalized cavitation tbresholdversus the log of the dissolved ion
Sconcentration for hal .......... ................... 70 .
19a. Graph of the cavitation threshold versusdissolved gas pressure for a V-P nucleuswith b=1.43 bar ......... ...................... 85
19b. Graph of the cavitation threshold versusdissolved gas oressure for a V-P nucleuswith b=1.96 bar .............. ...................... 86
19(. Graph of the cavitation threshold versusdissolved gas pressure for a V-P nucleuswith b=1.00 bar .................... ....................... 87
20a. Schematic diagrram of the samplepreparation system ................ .................... 100
CD
-------------------- -. - -- --- - --..------- ---- ---- -- . -

ix
F i.r1u re
2Ob. Schcnvatic diagram of the dataa calUisitiio l System . . . . . . . . . . . . . . . . . . . . l1
21a. Graoh of the cavitation thresholdversus- the los of the dissolved ionconcentration for Nal ............... .................. 110
21b. Graph of the normalized cavitation
threshold versus the lor of thedissolved ion concentration for Nal . . ... . . . . . ... 11
i
- - .
U. -- ... .

Chapter 1
Introduction
1-1 Statement of the Problem
The topic of this dissettation is stabilization mechanisms for theS
cavitation nucleus. For the purposes of this dissertation, cavitation
may he defined as the formation of vapor cavities or gas bubbles in a
liquid through a reduction of the pressure within that liquid. Although
the majority of this work will pertain to acoustic cavitation, many
types of cavitation are not acoustic in origin. These processes will
not be ignored. Cavitation occurs in a wide variety of place,-, ranging.-
from sterile laboratory systems to dirty beer mugs, from ship propellers
to inside biological systems. That cavitation occurs in these vastly
differert environments can be ascribed to a single common phenomenon: a
(micrcscopic) site exists at a place within the system where conditions
are favorable for the formation of a (macroscopic) bubble. This site is
called a cavitation nucleus.
The impetus behind this research was to answer the questions: what
is the nature of this nucleus? Is a nucleus unique to a given
environment, or can a nucleus cause cavitation In more than one
environment and under more than one set of circumstances? Indeed, can
all cavitation processes be attributed to a single type of nucleus? The
answers to these questions have been sought for more than a century and
- .
. ..... _.. . .. .. . ........... . ..........-. '... ........ ~.'.-_.....-...,:7-. . . -• - - - - - -. .A L- - .-..--- -- o .. . . ... % .._ ... : - °.•. . *. -. -.. --. o ° . - -. - -- ° - ° - . -..*%

23
* completely satisfactory answers will not be given here. In a practical
sense, It was suspected at the outset of this project that all of the . -
answers would not be found. They were meant to serve as "the carrot in
front of the horse". What will be presented here are some theoretical
and experimental advances made while seeking the answers. Not only do
these results clarify some of the past and present research in this
field, they also serve as beacons pointing to new directions that future S
researchers shot1d pursue.
1-2 Historical Perspective .0
Perhaps the first type of cavitation observed was the formation of
bubbles in liquids supersaturated with gas. This is familiar to all of "
those who have ever opened or poured a carbonated beverage. Tomlinson
discussed a series of twelve experiments performed with soda-water and
various solids. Hie contended that if the solids were "chemically
clean", no bubbles wou.td form on them. lie went on to point out that if ,
a solid, initially chemically clean, came into contact with a dirty
cloth, unclean air, or dust particles, copious bubbles formed on it when
immersed in the soda-water. Tomlinson concluded that chemically clean 0
solids are perfectly wetted, whereas dirty solids are not. From this he
argued that if a solid were dirty it would have a F-. t adhesion
force for the gas then for the liquid and that it wa: asymmetry .
that caused bubble formation. Although this line of reasoning is
incorrect, the results of hib extensive experimentation with " -
effervescence support the explaination offered by his contemporary M. S
.9
3
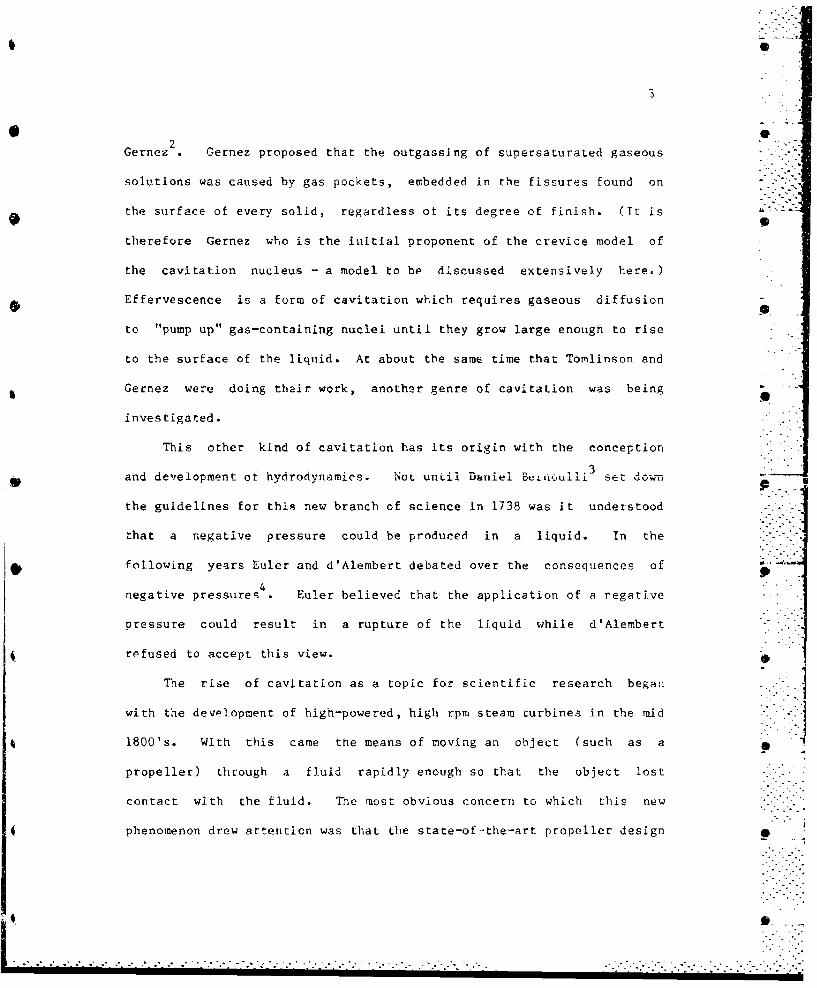
2Gernez Gernez proposed that the outgassing of supersaturated gaseous
solutions was caused by gas pockets, embedded in the fissures found on
the surface of every solid, regardless of its degree of finish. (It is
therefore Gernez who is the initial proponent of the crevice model of
the cavitation nucleus - a model to be discussed extensively here.)
Effervescence is a form of cavitation which requires gaseous diffusion
to "pump up" gas-containing nuclei until they grow large enough to rise
to the surface of the liquid. At about the same time that Tomlinson and
Gernez were doing their work, another genre of cavitation was being
investigated.
This other kind of cavitation has its origin with the conception
_3"
and development or hydrodynamics. Not until Daniel BtLt,,.uILI set dvoWn
the guidelines for this new branch of science in 1738 was it understood
that a negative pressure could be produced in a liquid. In the
following years Euler and d'Alembert debated over the consequences of4"
negative pressures . Euler believed that the application of a negative
pressure could result in a rupture of the liquid while d'Alembert
refused to accept this view.
The rise of cavitation as a topic for scientific research began
with the development of high-powered, high rpm steam turbines in the raid <-.1800's. With this came the means of moving an object (such as a p -
propeller) through a fluid rapidly enough so that the object lost
contact with the fluid. The most obvious concern to which this new -'-
phenomenon drew attenticn was that the state-of-the-art propeller design
- --..-.
4
was poor. A second, and as was soon evident, much greater concern was I
propeller erosion. In fact, this problem was so critical that in 1915 -Z
the British Admiralty appointed a special subcommittee to investigate
this phenomenon. In 1917, Lord Rayleigh 5 became involved. His solution -
of the equations governing vapor cavity dynamics is still quite useful
today.
Concurrent to this work the first attempts to measure the tensile S
strengths of liquids were being undertaken. In about 1850, Berthelot
began to measure the tensile strength of water and found it to be on the
'1 6order of 50 bars (maximum)6. His method consisted of heating a liquid, I
which was sealed in an evacuated glass capillary tube, until the
expanding liquid completely filled the tube. The temperature at which
the tube was filled was recorded and the liquid was then allowed to U U
cool. Because the liquid adhered to the sides of the tube, this
subsequent contraction resulted in the liquid undergoing a tensile
stress, eventually ending in the rupture of the liquid. The
temperature at which rupture occurred was also recorded. From a
knowledge of the filling and rupturing temperatures, along with the
Ithermal expansion coefficient for the liquid being tested, Berthelot was
able to calculate a tensile strength. Many other measurements of the
tensile strength of water through these static means have been made over
the intervening one hundred and thirty-four years, and their results
(ranging from as low as about 5 to as high as about 200 bars) are
comparable to Berthelot's. A detailed discussion of these works will
no b gnot be given here. The point is that; for the first time investigators• •
p -/
I I II I i i i ! •1 - •x I.

.. . . .. . . . . . . . . . . ....... ....
5
were intentionally putting liquids under stress and considering the
consequences. The application of a tensile stress to a liquid is the
basis for present day acoustic cavitation studies, which are actually
studies of the "dynamic" tensile strength, as opposed to these earlier
"static" measurements.
it Acoustic cavitation waa first observed during the period from 1915 0
to 1920 by Langevin and his co-workers while he was pioneering the field
of ultrasonics 7 Sdllner6 was one of the first to observe cavitation in
degassed liquids at room temperature and atmospheric pressures (1936).
In the 1930's and 1940's a number of other researchers investigated --
6various aspects of ultrasonic cavitation, among them R.W. Boyce , E.N.
The fundamental problem of cavitation was by now well formed.
Numerous measurements of the cavitation threshold (tensile strength) of
water yielded results in the range of 5-25 bars (using the most careful
and painstaking procedures thresholds of up to 300 bars have been
9obtained9, but they are unusual) and yet, theoretical predictions of the
6homogeneous (pure liquid) threshold of water are thousands of bars.
What accounts for this order-of-magnitude (best case) discrepancy?
Failure in solids under tension is usually attributed to an imperfection
in the solid. The same logic (i.e., imperfections in the liquid) was
applied to the failure of liquids.
In the remainder of this section different types of cavitation will -
be mentioned in an overview of the field in the last half-century. The
( S
*. . . . . . . . . .. . . . . . . . . . . . . . . . . . . . . . . . . . . .--.-.

*° .
were intentionally putting liquids under stress and considering the
consequences. The application of a tensile stress to a liquid is the
basis for present day acoustic cavitation studies, which are actually
studies of the "dynamic" tensile strength, as opposed to these earlier
"'static" measurements.
Acoustic cavitation was first observed during the period from 1915
to 1920 by Langevin and his co-workers while he was pioneering the field
.7 6of ultrasonics Stllner was one of the first to observe cavitation in
degassed liquids at room temperature and atmospheric pressures (1936).
In the 1930's and 1940's a number of other researchers investigated
6various aspects of ultrasonic cavitation, among them RýW. Bcyce E.N.
Harveyb, and Kornfeld and Suvorov .
The fundamental problem of cavitation was by now well formed.
Numerous measurements of the cavitation threshold (tensile strength) of
water yielded results in the range of 5-25 bars (using the most careful -
and painstaking procedures thresholds of up to 300 bars have been
9obtained , but they are unusual) and yet, theoretical predictions of the
homogeneous (pure liquid) threshold of water are thousands of bars. 6 -
What accounts for this order-of-magnitude (best case) discrepancy? 7.
Failure in solids under tension is usually attributed to an imperfection
in the solid. The same logic (i.e., imperfections in the liquid) was
applied to the failure of liquids.
In the remainder of this section different types of cavitation will
be mentioned in an overview of the field in the last half-century. The S
"- ' .. ..

6
investigatorti of these branches of cavitation research sought these -
imperfections (cavitation nuclei) to explain the various aspects of the
particular cavitation process-. Cavitation nucleated by these
inhomogeneities is termed heterogeneous cavitation.
In 1944, Dean 1 0 suggested that vapor cavities form in the center of
small vortices produced by turbulent motion of water around solid
objects. In the same year, Harvey 1 1 suggested that gas pockets U
stabilized at the bottom of crevices found on dirt particles accounted
for the cavitation found irn an~mals. He had concerned himself mainly
with cavitation formed by compression/decompression processes in
animals (the "bends"); however, he did discuss his model's application
to acoustic cavitation. One of the most careful and extensive
experiments of the time was perforned by Briggs, Johnson, and Mason 1 2 .
They measured cavitation thresholds for a variety of liquids as a
function of dissolved gas pressure, viscosity, and pulse length.
However, their theoretical explaination of their results was later shown
6to be incorrect
The 1950's was a decade of diversification for cavitation research.
Perhaps the most important exdmple of this breadth is the invention of
the bubble chamber by Glaser. This invention gave rise to the field of
13radiation-induced cavitation. Seitz gave an explanation for bubble
formation in superheated liquids by charged particles. He concluded
rthatL the majority of bubbles were "nucleated by moderacely-energetic :free electrons produced by the incident particles in Coulomb
encounters". The bubble chamber was developed as a tool for elementary
• .... .
7
particle physics while radiation-induced cavitation research took a
14different avenue. Lieberman measured the threshold for acoustic
cavitation in Pentane and acetone exposed to neutron and beta sour'ces.
He concluded that the cavitation was nucleated by the recoil of carbon
ions; these results agreed well with Seitz's theory.
In the field of acoustically induced cavitation, a different tvne
15of nucleus was suggested in 1954 by Fox and Herzfeld. This nucleus
consisted of a gas bubble surrounded by a rigid skin of orvanic
molecules. This organic skin model will be discussed further in the
next section. An extensive set of measurements was reported by
16Strasberg . He analyzed his results in terms of the nuclei proposed up
to that time and found the crevice model offered the best ex... anatton.
17Other noteworthy papers of the 1950's are by Connolly and Fox , and .1
Galloway 1; some of their results will be discussed later.
i9* Sette and Wanderlin.gh9 were the first to study acoustic cavitation
in water induced by cosmic rays. They concluded that the nuclei were
recoiling oxygen atoms and their results agreed well with calculations
20based on Seicz's theory. The Soviet researcher Akulichev proposed
another cavitation nucleus based on his measurements of the influence of
dissolved ions on cavitation thresholds. His nucleus, similar to that
of Fox and Herzfeld, consisted of an ionic, skin surrounding a gas
21bubble. Greenspan and Tschiegg described a method by which they were
able to attain unusually hieh cavitation thresholds. This method
consisted of prolonged filtering and cleaning of the liquids to be
L -~ .> '-- -- ~ - - -- - ------- --.

8
tested in a closed system. 0
in 1970, Apfel developed the crevice model further to Include the
size of the crevice; he suggested that there existed "critical" size
for the crevice. Crevices larger than and smaller than this critical 9
size exhibit quite different behavior. Apfei published papers on both
23homogeneous and heterogeneous cavitation, in 1971 , he modified a
theory for homogeneous nucleation of vapor cavities at the interface
between a flat solid and a pure liquid to account for nucleation at the
interface between two pure liquids. Apfel's crevice model was modified
* 24further by Crum who considered the variation of contact angles with F•
surface tension. The crevice model in this latest form was successful "
in explaining a wide variety of data obtained from acoustic cavitation
W measurements. Winterton 2also modified Apfel's model and used it to
explain boiling and non-acoustic cavitation.
At about the same time Yount was developing a different type of
nucleus.26 Modifying the organic skin models of Fox and Herzfeld, and
Sirotyuk 27 Yount considered his nucleus to be a bubble surrounded by
polar surfactant molecules. This skin has the property of offering a
varying permeability to gas, depending upon the ambient conditions. He
has applied his model to compression/decompression processes and has
been successful in explaining his data.
And so this was the state of the field when this project was
28undertaken. Since that time, Yount has further developed his model
theoretically and experimentally so that there is little doubt that it
i pis plausible. However, the crevice model, with new developments to be " '
- N ...-. .-.
9
discussed later, explains a very broad set of data. After this brief
and sketchy historical review of the field in general, the cavitation
nucleation and stabilization mechanisms will be discussed in detail in
the following section with emphasis on the organic skin model of Yount
and the crevice model as developed by Apfel and Crum.
1-3 Review of Stabilization Mechanisms
The most obvious candidate for the cavitation nucleus is a gas-
filled bubble. However, this nucleus is unstable. A bubble will
dissolve in an undersaturated solution and the effect of surface tension
will cause it to dissolve in a saturated solution. In supersaturated
solutions, a bubble can be In equilibrium because the tendency for the
bubble to dissolve due to surface tension is opposed by the tendency for
the bubble to grow by diffusion of gas intc it. However, this
equilibrium is unstable; the bubble will grow or dissolve depending on
whether the perturbation increases or decreases the bubble's radius
relative to its equilibrium rad!us. 2 9 ' 3 0 Therefore, a liquid would be
free of bubbles after a short period of time and cavitation thresholds
would quickly approach those for homogeneous nucleation. This does not
imply that gas bubbles could not serve as cavitation nuclei. It does
imply, however, that in order for gas bubbles to serve as cavitation
nuclei, they must be stabilized at a size small enough to prevent their
rising to the surface of the liquid, yet large enough so that they will
grow when exposed to negative pressure as low as a few bars. In other
-
............................-. * -- ~ . -*.

10
words, a stabilization mechanism must exist for a gas bubble before it
can act as a cavitation nucleus.
That cavitation nuclei do in fact contain gas has been borne out
in numerou', experlments. 1 l' 1-' 2 4 ,.6 Some measurements show that the .
cavitation threshold is strongly dependent on dissolved gas pressure,21"' -
except fo_ extremely clein water. Also, samples which undergo a
compression/ decompression cycle prior to testing show higher thresholds 0
than samples which do not.
Various types of stabilizing skins have been proposed. These skins
usually consist of contaminants wvhich somehow deposit themselves on the
bubble's surface and counteract the surface tension. The first of these
skin models to be discussed is the ionic skin model proposed by
Akuiichev. 20 -
1-3.1 Ionic Skin Model
S 31Alty noted that it has been known since the 1860's that liquid-
gas interfaces are electrically charged. He experimentally determined
that bubbles quickly acquired a charge after being introduced into water
and behaved as though they carried a net negative charge. In a later
32
paper , Alty postulated a charging mechanism by which a bubble became
charged by the selective adsorption of ions onto the bubble surface. He
noted that the rate at which the bubble dissolved decreased as the
charge on the bubble increased--a phenomenon which he attributed to the
Coulomb repulsion of the adsorbed charges. The mechanism by which this
selective adsorption took place, however, was unclear.
• o-- • • •
N N . ¾ . . .. N" N N °-N V"N.. . .

* - . r--- .o-- - -.- ,77 .7 ,.
Akulichev postulated that not only could the rate of dissolution of
a bubble be decreased, the dissolution could be stopped altogether. He
explained the selective adsorption in terms of the type of hydration
exhibited by various ions. Those exhibiting positive hydration behave
in a hydrophilic manner. They are surrounded by water molecules when
dissolved in aqueous solutions. On the other hand, ions exhibiting
negati.ve hydration behave in a hydrophobic manner and are not "as"
surrounded by water molecules as are hydrophilic Ions. Hydrophobic
ions, therefore, are more likely to stay on the surface of a bubble once
they encounter it than are hydrophilic ions, in other words--selective
adsorption. Hydrophi]ic ions include Na Li; examples of hydrophobic
ions are 14g K, F-, Cl , and I_
In order to test these ideas, Akulichev measured the cavitation
threshold as a function of dissolved ion concentration. Some of his
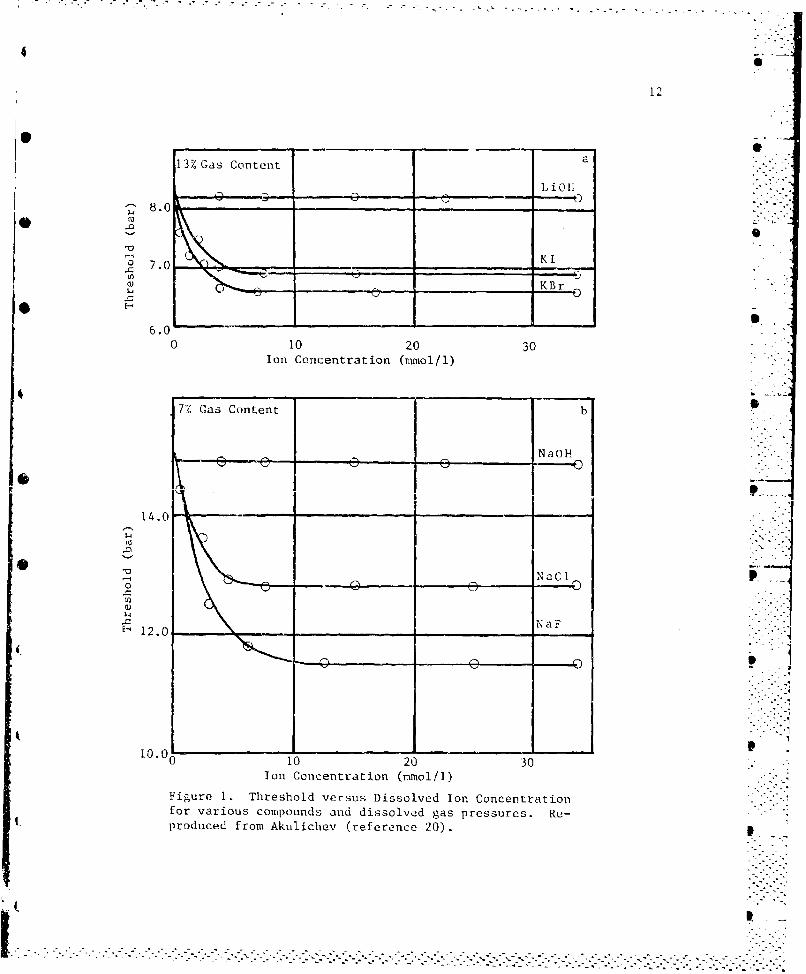
results are reproduced in figure 1. Figure la shows the variation in
threshold with concentration for three salts: LIMH, KI, and KBr. Since
OH is a natural constituent of water, Akulichev argued that it could
* not affect the bubble. Lithium is hydrophilic. Therefore, the presence
of LiOH in the water should have no effect on the threshold. It is seen
from figure la that the threshold is independent of concentration for
LiOH. The ions K+, I-, and Br are all hydrophobic so they should all " '
be adsorbed by a bubble. 1Tis results in the bubble being charged.
Therefore, because of Coulomb repulsion of the ions, the equilibrium
radius is larger than for an uncharged bubble. Th;s adsorption should
- ..-.....-
r~'~---.-- --. --. -- --..- - - - - - .-- "
12
13% Gas Contenta
8.00
* KI
___ KBro
6.00 10 20 30
Ion Concentration (rnmol/1)
4 S." . 7% Gas Content b
_____________NaOH
0~ ------
r I "
14.0 " __-__0_-____-
LO
V _ _ _ _ _ _ __
W
NaFE 12.0
.00 10 20 30
Ton Concentration (mmol/l)
Figure 1. Threshold versus Dissolved Ion Concentrationfor various compounds and dissolved gas pressures. Re-produced from Akulichev (reference 20). .
I
l . :"-

-40
13
produce a lower threshold for aqueous solutions of Kbr and KI than of S
LiOH. Notice that the effect tends to saturate at a concentration of - -"-
about 5 mmol/]. He attributes the slightly lower threshold (about 5%
lower) of KBr compared to that of KI to the difference in mobilities of 0
the two ions Br and IT. Figure lb is a similar graph for the salts
NaOH, NaCI, and NaF. in this instance, the positive ion (Na +) is
hydrophilic. The differences in the three curves are, therefore, due to •
the different natures of OH , Cl, and F . Again, the threshold is
lower for solutions of the hydrophobic anions.
Akulichev's model requires that ns the ion concentration approaches
zero, the thresholds for the various salt solutions approeTh the
threshold of LIOH and NaOH. In other words, the threshold must increase
with decreasing ion concentration. It is important to notice two things
about Akulichev's data. First, the lines drawn are not theoretical
calculations. They are best fit lines to his experimental data. Second,--
no measurements are made for ion concentrations below about 1 mmol/l.
The thresholds at zero concentration are extrapolated from thresholds
measured at concentrations greater than about 1 mmol/l. We have
extended Akulichev' s experimental results to concentrations below
I mmol/1. These measurements will be discussed in detail in a later
chapter.
Akulichev and Alty considered these stabilizing ions to be trace
contaminants in their water. It is known that water of all but the
purest of samples contains such contaminant-. Organic molecules are
also found as contaminants in water and they have been employed by
* p
-------------------------------------------------------------------

14
others as stabilizing agents. The first such attempt was by Fox and
15Herzfeld, and so their model will be the first to be discussed.
1-3.2 Rigid Organic Skin Model
15Fox and Herzfeld proposed that surface active organic molecules
could form a rigid skin around a gas bubble. This skin would be
impermeable to gas diffusion and would be mechanically strong enough to
withstand moderate hydrostatic pressures. A nucleus would cavitate when
the acoustic pressure reached a (negative) level at which the skin would
tear because of the pressure difference between the gas pressure inside
and the acoustic pressure outside. According to this model, the skin
wou.d have a characteristic crushi ng pressure. As iun! d the
hydrostatic pressure remained below this crushing pressure, the nucleus:1
would be unaffected by increases in hydrostatic pressure. If the
hydrostatic pressure exceeded the crushing pressure, the skin would
crumble and the nucleus would dissolve. This would result in an
increase in the cavitation threshold since the nuclti would no longer be
present. It was this property which forced Herzfeld to later retract
16his model. Strasberg had found that the threshold does increase with
hydrostatic pressure. However, the variation is continuous; there is no -.
lower limit to this variation as predicted by the rigid skin model.
The idea of an organic skitn has been developed further by
27 -28 28others2'28 the most viable form will be discussed next.
"" I I u n " , . . . .. . . . . . . . . . . . .. . .. . ...-"' ' • ' "... . "--.'..". - - " -" . -

I"I
1-3.3 Varying Permeability Model S
Rather than the rigid skin of organic molecules proposed by Fox and
26 ,28Herzfeld, Yount has developed a stabilization theory in which the -
dissolution of gas bubbles is halted by a non-rigid organic skin. This 0
skin has mechanical strength against compression, but none against
tension. This postulated nucleus is depicted schematically in figure 2.
This nucleus Is formed in the following manner. A gas bubble is .
iytroduced into a liquid (water, say) and begins to dissolve. While the
dssolution takes place, surface active molecules accummulate on the
surface. Eventually, within minutes or seconds, the density of these
surfactants is such that they resist the collapse of the bubble. This
Is presumably a Coulomb interaction. These molecules are polar Uc
perhaps even carry a net charge) and align themselves such that their P
polar "heads" face outward (toward the water) and their tails (typically t
hydrocarbons) stick inward. Thus, as the density increases, the
separation of the heads becomes small enough for dipole fields to become
important. Of course, one would expect that if the surfactants were
charged, the density at which stabilization occurs would be lower
6-2 -3because monopolar fields vary as r rather thae r -3
Once the critical density is reached, the radius of the nucleus may
change through changes in the number of molecules on the skin. The
equilibrium condition for this nucleus is that the electrochemical
potentials of the skin and the reservoir must be equal. The reservoir
is a thin (perhaps monomolecular) layer of non-aligned surfactants which
surrounds the skin of aligned molecules. This equilibrium condition can
.- -.-- ------ ------- -..-. ,

16
-4 _4
CC
I> I
04I
- - I :-:". :
-o- 4-
co -r
- - °- .
- --- ':-. .- .!
I (A
oUP ---.- UI .-..C
S. . . . . . . . .. . . . . . . . . . . . . . . . . . ° . . . . . - . J . _ . .

be satisfied by the accretion or deletion of molecules from the skin (or .
reservoir), resulting in a "large-scale" change in radius. Having
adjusted the radius in this manner, subseouent "small-scale" changes in
radius occur. These changes involve only the adjustment of the 9
separation of adjacent skin molecules, not a change in the number of
molecules. At equilibrium, the nucleus can be thought of as two
concentric shells of negligible thickness--the outer one, the reservoir,
is in contact with the liquid and the inner one, the skin, is in contact
with the gas. So fat, this model has only been used to make Predictions
about compression/decompression processes during which gas diffusion can S28play a major role. However, Yount has calculated characteristic times
in which a skin molecule car, be accreted or deleted, due to an
inequality of electrochemical potentials, and found them to raiew fJ',,
-3 -610 to 0 seconds. The shortest times approach the period of
acoustic signals used in ultrasonic studies. This would imDlv that
large-scale changes in radius may be able to keep up with the variations
in applied pressure associated with acoustic cavitation.
As mentioned above, Yount has performed only long-time scale
experiments. A typical experiment will now be described. During the "0
experiment, gelatin samples (surface tension around 50-55 dvn/cm) are
subjected to a pressure schedule which is typically like the one shown
in figure 3. The sample, about 0.4 ml in volume, initially at a
pressure P, is rapidly compressed to a Pressure P. "Rapidly" means F. - -
that no gas diffuses out of the nucleus during the compression. The
sample is held at P long enough f r the dissolved gas pressure in them
-. 7 -%.-..-
- - ~-,,* -. '.b

-. -. .
18
p m
/•
0/ .
Time-
Figure 3. Typical. pressure schedule for a ".' "•comppression/decomupression experiment. The . i.dashed line depicts the change in the di~s-solved gas pressure.
/ I",-.*" - --Sw:: -I:
-/_ .Ff Ii---
n n uh u . . .n. ..I
. .u "
19
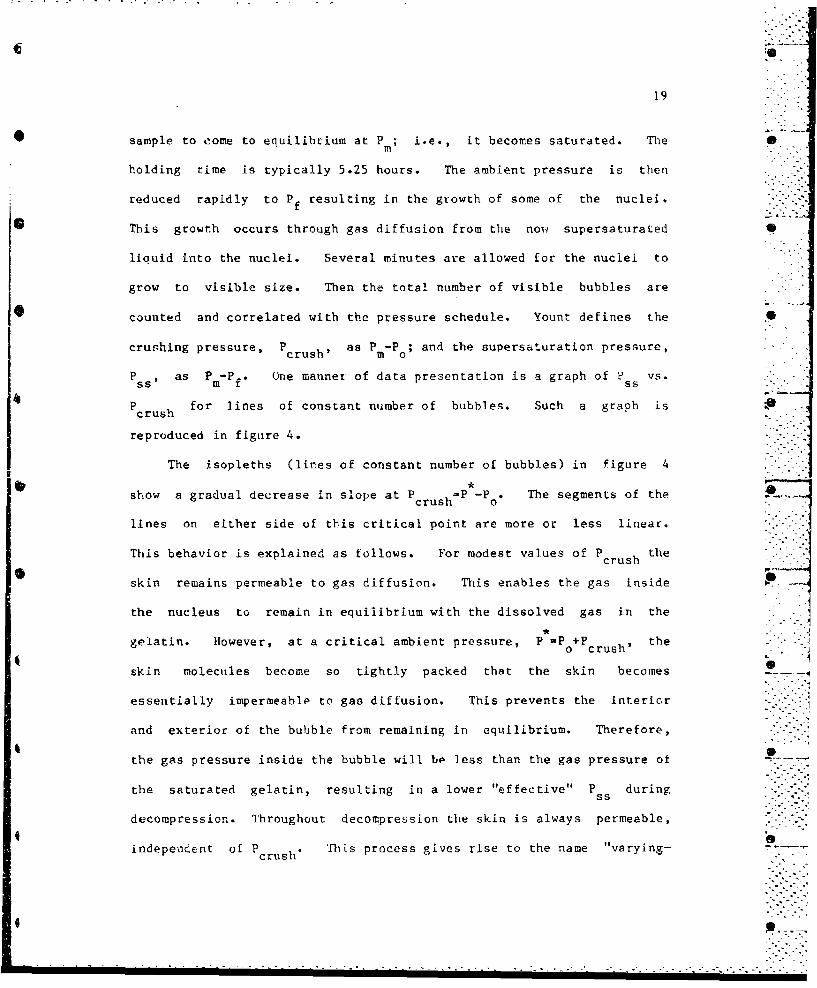
* sample to come to equilibrium at P; i.e., it becomes saturated. The 0
holding time is typically 5.25 hours. The ambient pressure is then
reduced rapidly to Pf resulting in the growth of some of the nuclei. -- -
* This growth occurs through gas diffusion from the now supersaturated
liquid Into the nuclei. Several minutes are allowed for the nuclei to
grow to visible size. Then the total number of visible bubbles are
* counted and correlated with the pressure schedule. Yount defines the S
crushing pressure, P as P -P 0 and the supersaturation pressure,
P, as Pm-Pf. One manner of data presentation is a graph of P vs.
P for lines of constant number of bubbles. Such a graph is . -
crush
reproduced in figure 4.
The isopleths (lines of constant number of bubbles) in figure 4
show a gradual decrease in slope at Pu P *Po The segments of thecrush
lines on either side of this critical point are more or less linear. "
This behavior is explained as follows. For modest values of P the
crush
skin remains permeable to gas diffusion. This enables the gas inside
the nucleus to remain in equilibrium with the dissolved gas in the
gelatin. However, at a critical ambient pressure, P -P +P crush' ""eo 'crush' the""
skin molecules become so tightly packed that the skin becomes
essentially impermeable to gas diffusion. This prevents the interior
and exterior of the bubble from remaining in equilibrium. Therefore,Io
the gas pressure inside the bubble will be less than the gas pressure of -the saturated gelatin, resulting in a lower "effective" P during
ss
decompression. Throughout decompression the skin is always permeable, .7'
independent of Pcruh" This process gives rise to the name "varying-
crsh
. ~ ~~~ .. . . . . .

200
ss crush20.~P 1
ss crush 0 P
I
./ 9
/ .
15 "
.500 -,"
*100 oo'
A 10-- "- 10 /
3 1, -- -# -CU -
///!.. .-- p.
5 015
IleI
CN, - T
Pcrs (atm) pl. ._"
numbers of bubbles ss Pcrush...
4 (After Yount, reference 26.)4 S4
Figure 4. Plot- -P Versus. . . . . . . . . . . . . .
• ~~~ ~ ~ ~ ~ s "cr"u"s"'h'" '"""" "" 'I i"-" ' " ". . . .. ."""-. .. . " ' """" " ""i i"""'""i .. "' ""

21
permeablility". S
Perhaps it is useful to point out that for acoustic processes
P -P and that the holding time is usually too short for any--.crush ss-
significant gas diffusion t3 occur. Other aspects of this elegant model .
will be discussed later.
1-3.4 Crevice Model
The crevice model is fiundamentally different from the other models
discussed. Its stabilization mechanism does not require that surface
tension be nullified. Rather, it uses surface tension, combined with
geometrical considerations, to stabilize a gas pocket at the bottom of a
crevice. It is, perhaps, the most "worked over" of the models. This is
partly true because it can account for a wide range of experimental
data, whereas the other models can account for only limited sets of
data, most often that of the model's proponent. Since the crevice mciel
has undergone several revisions, it would be unreasonable to discuss all -
of them in detail. Therefore, the model will be discussed briefly in
34the form reported by Crum ; this model will then be revised in the next
chapter.
The crevice model assuTnes that gas pockets are stabilized at the
bottom of conical cracks or crevices found on hydrophobic solid -
Pimpurities present in the water. The essential features of the model
are depicted in figure 5. When the liquid is saturated with gas, tt.-'
liquid-gas interface is essentially flat. However, when the liquid is
degassed, the interface bows toward the apex of the crevice. This
(122•'•.
. "- .-.. . . .

22
I4A I
*p +
*V g
(a)
I _cc
RU
rLiquidpL +-
Figure 5. Diagram of a gas-filled conical crevice* embedded in a hydrophobic solid a) in the degassed
state and b) in the nucleation phaqse. (After Crum,reference 34).
.. .......

S23
behavior occurs for the following reason. In a saturated solution, the
dissolved gas pressure, P , equals the pressure which the liquid exertsg
on the interface. We call this the liquid pressure, PL' and define it to
be the sum of all the pressures present--hydrostatic and acoustic. 9
Diffusion maintains the gas pressure in the nucleus at the dissolved
gas pressure. Assuming that vapor pressure is negligible for the time
- being, we have P P for saturated solutions. Since there is no SLg9
pressure difference across the interface, it is flat and the Laplace
pressure (2Y ir, where y - surface tension and r = radius of curvature
of the interface) is zero. When the liquid is degassed, P is less than Pg
PL and the interface bows toward the apex. This curvature giies rise to
a Laplace pressure which exactly equals the difference between PL and@a
P . Since all pressures are now balanced, the n;ucleus does not dissolve -g
and remains intact.
Suppose we have a degassed liquid and the liquid pressure is
increased. In response to this condition, the interface bows inward
more, until it reaches the advancing contact angle. At this point any
subsequent Tootion of the interface involves the entire interface
advancing as a whole toward the apex. As it advances, the radius of
curvature necessarily becomes smaller, since the angle of the interface
measured from the crevice wall is now fixed. As the radius of curvature
decreases, the Laplace pressure Increases, eventually becoming high -
enough to balance the increased liquid pressure.
If the liquid pressure is now suddenly decreased becoming negative,
as during the negative portion of an acoustic cycle, the interface bows
-:V%-~-t--t.-xx.-- .-..U½tN'.%-;'-..-

24
outward and may reach the receding contact angle. If the receding
contact angle is reached, ar.v subsequent motion of the interface
involves the entire interface receding away from the apex. This
recession results in a decrease in the Laplace pressure, since the
radius of curvature Increases. With the Laplace pressure decreased the
gas pressure inside the nucleus is retarded even less. Previous
researchers 1 6 ' 2 2 ' 2 4 ' 2 5 assumed, therefore, that th-i criterion for
nucleation from a crevice was that the interface must reaci the receding
contact angle. They argued that once the interface had reached the
receding contact angle, any subsequent interfacial motiouL would Increase
the radius of curvature, resultikg in less Laplace pressure (which was
now opposing the growth of the nucleus) and so the growth would be -
unbounded. (This argument will be opposed in the next chapter.) This
unbounded growth would result in a mostly-vapor-filled cavity being
emitted from the crevice. This nucleation process must occur within the
time frame cf an acoustic period.
Using this nucleation criterion to define a cavitation threshold,
the threshold can be predicted. Crum has modified previous results to
include the effects of surface tension. He finds the threshold to be
P (P,- P -Pg) + L V (Cosý) ( -l)+(sin) [1-(E-1)21}'
A v- 9 g 6
where:
P= (negative) acoustic pressure PL liquid pressure
P = vapor pressure P gas pressure
5 Icos (C'-,)I = aH+" -A H
IL .

25
c - constant = 50 dyn/cm 'A - advancing contact angle
3 = crevice half angle - hysteresis angle
This equatioa predicts the threshold as a function of dissolved gas
pressure, surface tension, and temperature fairly well. More details of
these predictions will be given later.
-o j1-4 Final Introductory Remarks
Each of the models discussed above are stabilization mechanisms;
each requires the presence of a gas phase large enough to be stabilized.
The origin of the gas phase is not of concern here. None of the models
mentioned predict the subsequent growth of a nucleus to an observable
size. It is simply assumed that after the bubble is nuclcated, it will
grow large enough to be detected. This is, of course, a huge assumption
and is not always valid. This point will be addressed in a subsequenc'
0cl pter. -
In this dissertation, many different, and sometimes subtle, .. .-
concepts are introduced and discussed. One way in which these many
topics could be handled would be to discuss each in exhaustive detail,
the result being a much longer, and perhaps more complete, dissertation.
However, in an effort to be as concise as possible, this approach was
not taken. This choice may lead to a choppy appearence of the body of .
the text. In an etfort to remedy this appearence, a brief description
of the layout of this dissertation will be given.
Two types of cavitation will be dealt with. One type is vaporous
* ..-.9

26
(or transient) cavitation in which the cavity is mostly vapor-filled. S
The other type of cavitation will be termed "diffusion cavitation" and
it is controlled by gaseous diffusion into or out of the bubble. Three
different nucleation models will be discussed. Of the three, the
crevice model will receive the majority of the attention. The other two
models are the ionic skin model and the varying-permeability organic
skin model. -
Chapter 2 contains the majority of the theoretical derivations that
will be presented. The concept of a critical radius will be introduced
for both types of cavitation. This concept will then be applied to the
crevice model and expressions for both the vaporous and diffusion
cavitation thresholds will be derived. In chapter 3, the theoretical
thresholds predicted by the crevice model will be compared to P
experimental results. Chapter 4 is devoted to the oth.er models. The
plausibility of the ionic skin model will be discussed in light of the -
results of measurements of the variation in the acoustic cavitation
threshold with the dissolved ion concentration. In addition, the
varying-permeability model will be applied to vaporous cavitation. To
the author's knowledge, this is the first attempt at such an 5
application. The final chapter will include a summary of the important
points presented in the dissertation as well as toe conclusions that may -
be drawn from them.
--.S .°
4 S %%
Chanter 2
nerivation of Cavitation ThresholdsUsing the Critical Radius Approach to
the Crevice Model
2-1 Introduction
in the previous chapter, it was noted that in the current crevice
model, a vapor bubble would be nucleated when the liquid-qas interface
reached the receding contact angle. In this dissertation, it will be "
shown that this criterion is indeed necessary but not sutficient. In
order for a cavity to be nucleated, it is also necessary that the
radius of curvature exceed a crirical value deLermilLed [Lull[ d Stabi•,,tv
criterion, the nature of which depends upon the type of cavitation under
investigation. In view of this requirement, an expression for the
liquid nressure required to produce such a radius of curvature will be
derived.
The discussion will be divided into two cases: one for ambient
pressures less than the vapor pressure and the other for ambient
pressure-, greater than the vapor pressure. In the first case the~ cavity
formed will be vapor-filled while in the second case the cavity will be
gas-filled, growing by gaseous diffusion. The results of this
rederivation will be compared with those of the Previous crevice model.
It will be shown that predictions of cavitation thresholds based on this
revised crevice model agree closely with experimental results. In 0
27
"Im..

addition, the revised model will be applied to situations nrevoiouslv v
explained only in terms of the varying-permeability model.
2-2 Critical Radius -'
The concept of a critical radius is not new. Therefore, it is
somewhat surprising that this approach to the crevice model has not been /.
taken before. Harvey did discuss a critical radius for a nucleus to
grow bv gaseous diffusion. However, he did not use it in *
37 38quantitative way. Blake and Prosneretti have discussed the criticai
radius at which a vapor bubble is stable against growth or collapse.
Building or, these concepts, expressions will be derived for the applied
pressure, called the cavitation threshold, renuired for a bubble to be
nucieated from a crevice. (No r e: :he applied ) L CVUt ,,,v .U L '-SSUIirC
negative values.) Since the spherical geometry of a free bubble lends
itself to easier manipulation than the conical geometry of a crevice,
the critical radii will be derived for a free bubble. In ieneral, the
stability conditions hold Lor either case; exceptions will he noted when
necessary.
2-2.1 Critical Radius for Growth by Gaseous Diffusion
Consider a gas filled bubble of radius R surrounded by a liqu-id
which exerts a pressure P1L on the bubble. The Aicuid-eas surface
tension is • The gas pressure inside the bubble is P the vapor
pressure, Pv is assumed negligible (see figure 6). Assume the bubble
is in equilibrium so that the pressure inside (P) eouals the liquid -'- u
pressure plus the Laplace nressure due to the surface tension"
9. o..

29
2-Y-
P + I R
(• .
r~Bubble-
"Liquid-
Figure 6. Illustration of a free bubble surrounded
by a liquid. The external pressure is the sum ofthe liquid and Laplace pressures and the internal
pressure is the sum of the gas and vapor pressure.
--.. "I
C I .°
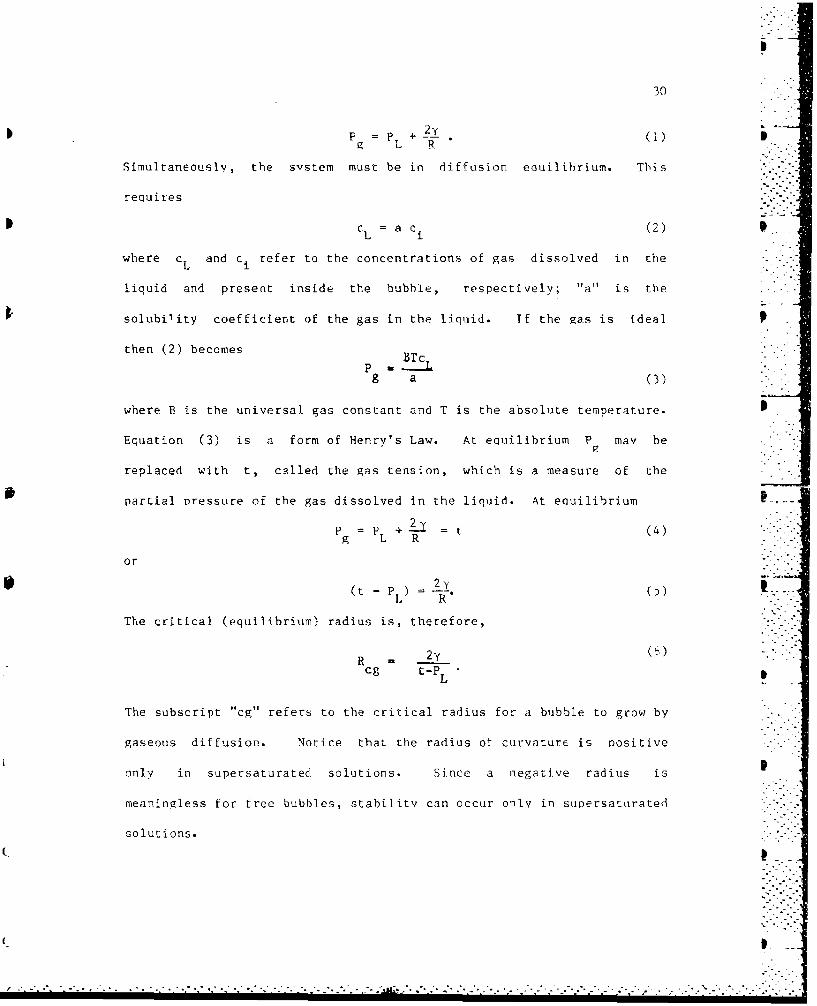
30
p -L (R)
Simultaneously, the svstem must be in diffusion eauilihrium. This
requires
cL = 8 c. (2) .
where c and c1 refer to the concentrations of gas dissolved in the -
liquid and present inside the bubble, respectively; "a" is the
solubility coefficient of the gas in the liquid. Tf the gas is ideal P
then (2) becomes ...
g a (3)
where B is the universal gas constant and T is the absolute temperature. .
Equation (3) is a form of Henry's Law. At equilibrium P may be
replaced with t, called the gas tension, which is a measure of the
partial Dressure of the gas dissolved in the liquid. At enuilibrium
P P + - t (4)g L R
or
(t - P ) = "R (5)-1 R•
The critical (equilibrium) radius is, therefore,
R 2y (6) -
cg t-PL LI -
The subscript "cg" refers to the critical radius for a bubble to grow by
gaseous diffusion. Notice that the radius of curvature is positive9
only in supersaturated solutions. Since a negative radius is
meaningless for free bubbles, stability can occur only in supersaturated
solutions.
C p
- . . - '
.P : . I
/- - . .. ~~~~~~~-'.~ . . . . . . . .. . .-. . . . . . . . . . . . .

31
2-2.2 Critical Radius for Growth in the Absence of Diffusion
The discussion presented in this section is similar to that of the
previous one, except now the effect of vapor pressure is included.O
Again, at equilibrium the following condition holds
F+ P L + • (7)v g L
The condition given by equation (3) is dropped and the amount of gas .0S
inside the bubble is fixed. (In other words, no diffusion of gas takes
place. However, the amount of vapor is not fixed.) If the gas is ideal.
then rearranging (7) gives
L + 21 3nBT + pL R 41TrR v(8
whcrcn Is the number of moe o-he gaE ins-ide thle hn1,hble T-n Pvqrmnp
the stability consider the effect of a small increase in R. For the
bubble not to grow spontaneously, the effective external pressure, which
Is given by the left-hand side of equation (8), must increase more than
the internal pressure, given by the right-hand side of equation (8). ""
This will always be true If P L Pv, because the gas pressure decreasesL- .-. '-
more with an increase in R than does the Laplace pressure. If, however,
P, < P then the situation is different.
The stability criterion can be expressed, in general, as
+2> " 3nBT + --- R (P. + "-:-) > ( 4-R-- + P ) (9) ...I. R ýR 4rrR3 v
Performing the differentiation and solving for R gives
R < 31P PL" (10)---.-v L
In other words, when P P L) the bubble will be stable against
1%!SwV

32
spontaneous growth only it R < R wherecv
R = 11cv 30" "-p"v L
Taking the other view, a bubble will grow in a spontaneous unbounded
manner when the ?iquid pressure is less than the vapor pressure only if
R > R v A bubble that grows in this way will be mostly vapor-filled.-cv
Therefore, the subscript "cv" refers to the critical radius for a vapor
bubble to grow from a gas-filled nucleus. The reader is referred to
Prosperetti 3 8 for more details.
2-3 Threshold Derivations
In the preceding section, the conditions for the nucleation of both
gaseous and vaporous bububles were dcv.1oped. Uzing them, express'-".s-
will now be derived for the applied pressures required for nucleation
from gas-filled crevices. These are referred to as cavitation
thresholds. It should be noted that the applied pressure, P is equalA'
to the liquid pressure minus the ambient static pressure; i.e., PPA p - Po. (P experJ illy is the applied acoustic pressure.) The
A L o A
discussion which foiliws will be divided into two different cases: one
for P < P and the other for P > P This division is a natural one;V L V
the difference in the restrictions on P is in a sense the differenceL
between acoustic cavitation and diffusion cavitation. Acoustic
cavitation is produced by negative applied pressures and its nucleation .
usually involves the growth of vapor-filled bubbles, although not
always. On the other hand, diffusion cavitation is usually produced by
ambient pressures greater than the vapor pressure and gas diffusion is
I. SS~ ~ ~~33-]]]:'
the predominant mechanism in its nucleation. Diffusion cavitation
should not be confused with gaseous (stable) acoustic cavitation; the
two occur in different regions of ambient pressures. Acoustic
cavitation will be considered first.
2-3.1 Acoustic Cavitation Nucleation
Assume that a deep crevice, partially filled with gas, exists in a -.
hydrophobic solid surrounded by a gas-saturated liquid. The hydrostatic
pressure due to the liquid is negligible and it is exposed to an
atmosphere at pressure Po (refer to figure 7). The liquid-gas P
interface contacts the crevice wall at a height z above the apex. The
crevice angle is c Ths- systerm i.- in ecullibrium, so
P0 t Pg. (12) I_.
For temperatures far below the boiling point, P << P and thus theV 0
interface is essentially flat.
The liquid is now degassed so that t < P * Gas will diffuse out of I0
the nucleus causing the interface to bow inward, toward the apex, as
shown by the dashed line (b) in figure 7. At equilibrium P - t andg
P =P + P +-2. (13)0 g v R". .-.0
The new equilibrium position of the nucleus is shown by the solid line
(c) in figure 7. At this position the angle between the interface and -
the wall is tA' che advancing contact angle.
At this point, an acoustic field of pressure amplitude PA is applied(A
such that the liquid pressure exerted on the interface is P + PA A
o'.-
.t-ri

34
* M
Q ') W
Q) l
N0 1=C
co 41
- L4r- V
v 0 Q
-4 J-_ Jý
)L AJ 0

35
Assume P is such that P > P - P During the negative half-cycle, .A v a A
the interface bows outward and a new equilibrium position is " •
established. This process will be isothermal if the thermal diffusion --
length, L, is large compared to crevice dimensions. L is given by 3 9 . -•
2k ½"'. :L - (2-) (14)
PCp
where k is the thermal conductivity of the gas, p is its density, c isp
the specific heat at constant pressure per unit mass, and w = 27f where .
f is the frequency of the acoustic field. For most gases at normal
pressures and temperatures (P = 1 bar and T-=- 200-500K), k is on the
order of 5x10⁻⁶ kcal m- sI K- ; the density of air is 1.1 kg m-3; c
is 0.25 kcal kg-K-. Therefore,
L Z 2.4 x 10- f-i/ 2 m . (15)
Notice that L is inversely proportional to the square root of the
acoustic frequency, but even at megahertz frequencies, L Q 2.4 jt m. This - "-
is about an order of magnitude larger than the crevice sizes assumed
here. Therefore, the isothermal assumption is a good one.
A bubble will be nucleated from this rTew position only if the radius
of curvature of the interface is larger than the critical radius R .cv
The value of P necessary for this condition to be met is found as -
follows.
For isothermal processes, "1
PIV =P2V2 (16)11 2 2
where P1 and V are the internal gas pressure and nuclear volume in the
initial degassed state whereas P2 and V are the interior gas pressure," -.2 2
and nuclear volume at P L P - PA V is given byL o A IJ
•4

36
S
V, V V (17)I cone cap
(see figure 8). After some geometric and algebraic manipulation
3 (18)
where L.-_' ( -. (1+ 2 ( 19 ) :
and
61 = jcos(CE -1 ) "(20)
(Throughout this dissertation the subscripts associated with ni and 6 . .
refer to the subsc,-ipt associated with a.) The final volume, V2 is
similarly given byS 1 Tra 2(cota + r 2 ) (21)
The interior pressures are given by --
P1 eP (22)g
and
P2 o PA P + (23)
Rearranging (16) givesP V
2= 1 (24)V1 2 " '
orP-P P -- + 2 iia3 (cots-n)P PA- v+ R2"
"2 - 3 11 (25)
P -- Ta3 (cot1+n )
g 3 Z
Using the geometrical relationship that a = 6R, (25) becomes (after some
algebra)
pR 3" -y P .
cotB--n """""I"
p, =_ r7_... ~ rc[ .. ,]--o.0 (26)P3 + P - P 2P - P - ) i I i . I ~ ~ ~ i1 0ov v PA - co - •
0 A v".
- . . .-- -- -----

37
/
I R•\ I p .
A
/-
*a
.Figure 8. Illustration of crevice geometry.
C- = .'
C "

38
At the initial state, P1 P t. From equation (13) it is seen thatg
R = 2y~ (27)
or2-6
a = (2 8
Using this expression and letting
R R 4y-~---- (29)02 cv 3(P + P -P)v A 0
gives
P -P 3 -
3 COt8+nP A=P 0-P v+ iv- P II - V-- 1 I-- (30)
In general, in the degassed state, the contact angle is the advancing
contact angle, --A~. In II 'it iLii bdi state th otc -cuI
receding contact angle, P 2-"PR. Equation (30) now becomes
- p1 -12.
..
PPrf p -I PocoR ~Ll P --)
-R(31)A$ P 2g g 9 COS(a A 8) 0 Ct S -'A 3J
This relationship gives the threshold for vaporous cavitation. Although
a more detailed comparison will be made in the next chapter, a few brief
comparisons to the old crevice mode], should be made here. Apfel's
threshold is
S v i oP+(PtPP- nR .(32)A o v g9 0 Cos ."- )
This equation gives a linear dependence on gas content whezeas (31) does
not. The acos (a -)/cos (a t3) erm appears in both but the dependenceR A
.is different..

39
It was assumed throughout the derivation that the interface reaches
the receding contact angle. For small values of P this may not beA
true. In order to find the value of PA necessary for the interface toA.
reach aR, again assume isothermal conditions. The initial state is the
degassed stated mentioned above with
P P (33)1. g
and
V -1-ffa 3 (cot8 - (34)
The final state, 2, is such that the interface just reaches O so
P = P " P. - P + 2 y R2 A -R ( 3 5 )- .}
2
V2 Va* CoýnR (36)
Recall that
a 6R (37)
so 2oP6RP-P-p
P P P +(3)2 o v A a (38)
Using (16),(28), and (37) it can be shown that
6- 6 R rcot -,A 1P - P P(-P-P) + : (.----o v A 6A 0 v g F,ýOTri
or
*Cotý-T)Cs (PA P P + ( I (- P R (40)
A 0 g 9 l R (P- P -Pg os(a A - "-:
"The asterisk refers to the fact that this is the critical value of P
below which nucleation will not occur. (In this dissertation an
asterisk will always denote some type of "critical" pressure.) Why is
. -. . °

40
this a critical value? Assume the outwardly bowed interface has a
radius of curvature greater than R , vet it has not reached the
receding contact angle. The nucleus is unstable and so the radius of
curvature will not spontaneously decrease. However, this would be B
required in order for the contact angle to decrease to aR Since the
interface will not move before it reaches the receding contact angle, - "
there is no nucleation. It should be noted that equation (40) is almost S
identical to equation (32), Apfel's threshold equation. The cnly
difference is that in deriving equation (32) it was assumed at gas
diffusion can keep up with the motion of the interface. This assumption 0
was not made in deriving equation (40), hence the additional factor
associated with P • If gas diffusion can keep up with the motion of the
interface then that factor equals one.
The implications of these thresholds will be discussed in detail in
the next chapter. We turn now to the threshold for the nucleation of a -"..- -'..
bubble by gaseous diffusion.
2-3.2 Diffusion Cavitation Nucleation
Once again assume a deep crevice, partially filled with gas, exists
in a hydrophobic solid surrounded by a gas-saturated liquid that exerts
a static, ambient, pressure P on the interface. In equilibrium, the
pressure balance equation (12) holds; the interface is essentially flat
and a height z above the apex. Assume the ambient pressure is0
increased from P to P . This change in pressure appears at theo m
interface as an Increase in the liquid pressure causing it to bow inward
" . . - .-.. . . . . . . . . . . o . .> --. - - - - X'�... . --' . .-- .
S
41
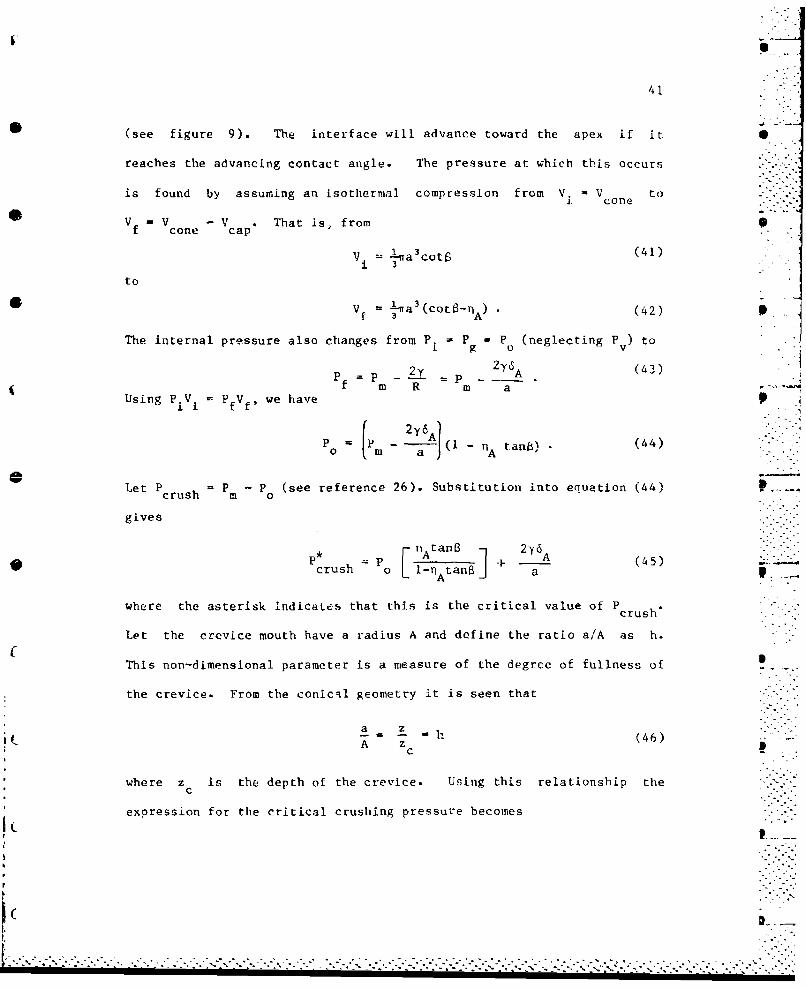
(see figure 9). The interface will advance toward the apex if it '
reaches the advancing contact angle. The pressure at which this occurs
is found by assuming an Isothermal compression from V. V toJ. cone
Vf V - V c That is, fromcoe cap
v, _a 3cotý (41)3I
to
Vf =a 3 (coto-A)• (42) P .
The internal pressure also changes from P. P = P (neglecting Pv) to
P=P 2y P y6 A ( 4 3)
f m R m aUsing P.iV I- P fVf we have P
PP0 (1 -Atanft) (44)
Let Pcrush = P - P (see reference 26). Substitution into equation (44)crsh m o
gives~. n..a.-.2y
*crush P A + A (45)
where the asterisk indicates that this is the critical value of Pcrush'
Let the crevice mouth have a radius A and define the ratio a/A as h.
This non-dimensional parameter is a measure of the degree of fullness of
the crevice. From the conical geometry it is seen that
a z ''-"a.. . . h (46)A z C
where z is the depth of the crevice. Using this relationship the
C
expression for the critical crushing pressure becomes
. - . -M
I.: :!

42 ..
w M
S 0
0 Q)
00 0.
J- 4 4-
(1)u
.- 4 r4
to aI) 0-

43
S 1+ 2Acrush nAtan hA (47)
For crushing pressures less than this value, the interface does not
reach the advancing contact angle and therefore cannot move.
If the crushing pressures exceed P the interface advancescrush' •. _
until
Pm , P + 2+ (48)m g .
The prime indicates that the gas pressure is no longer equal to t, but
is greater. Sin(? the liquid is assumed incompressible, the change in
liquid pressure does not cause an immediate change in t, as it does in
P The change in gas tension occurs at a rate controlled by theg
diffusion of gas frow the atmosphere into the liquid. Thus, for a time,
the nucleus is supersaturated. Gas diffuses out of the nucleus until,
once again, P = t. At this point, the interfaciel radius of curvaturei
is less than R because P < P '. Therefore, sit-ce the interface isg g
already at cA this reduction in radius implies that the diffusion
causes the nucleus to contract; that is, h decreases. At this
"equilibrium position
p = p + -- ..2ymR g R (49) . ...
Swhere P < P' and R2 < R C
If, at this point, the ambient pressure were reduced back to Po,
the nucleus would expand, but not to its original volume since there are
fewer gas molecules within the nucleus. This net reduction in the
I S 1
S. . . . . "" F"' ' "" - - - - - -" *'': " -.. -""" . '" -i . -- " - : - . ,-- - • "-

44
volume of the nucleus would result in a higher cavitation threshold than 0
that of an identical, non-pressurized nucleus. Such an increase in
threshold is well. documented. 1 6'1 If the liquid pressure is E,--
maintained at P long enough, however, the dissolved gas pressure will _m
eventually reach P that Is, tM P This results in the diffusion ofm in
gas back into the nucleus until P = P, at which point the interface isg
essentially flat, and a height z 2 above the apex.
Suppose now the atmospheric, and therefore the liquid, pressure
were reduced to a final pressure P. The internal gas pressure of thef
nucleus will be greater than the external ambient pressure; the .
interface bows outward. In order for the interface to reach the
receding contact angle the volume must change from
V1 = -1-1a3 cot6 (50)
to
Vf= ½ra3
(Cota+TR),
while the gas pressure inside the nucleus chanes from P to
+Y6R (52)f f h A'(2
2Assuming isothermal conditions, we have
P =P + 2RJ(l+T) tan) (53)
m f h A R2
The extent to which the nucleus is supersaturated can be characterized
by defining the supersaturation pressure P P - P-. Using thisin t-f
expression and noting that
Pf P + P crush P ss (54)
......................... .... "*

...-.- jrr~ -r* -..
45
equation (53) becomes
F r iRtans 2-'R•= (Po+L----+ hA(5Pss P crush) l+Rth A (55),
Notice the similarity between this equation and equatioýn (47). The 9
difference in sign in the denominator arises from the fact chat in one
instance the calotte adds to the volume of the nucleus, while in the
other it subtracts from it,
For supersaturation pressures greater than P the interface
reaches the receding contact angle and moves outward. If the change in
volume is such that the radius of curvature of the interface is larger
than Rcgi equation (6), the nucleus will grow by gas diffusion. Ta
general, the fin-1vlu~nime (5Si 1- Z'~ ~~ven by
Vf -¶a 3 (cot8+R (56)
where a 3 > a In this case (53) becomes
Pm P[a + 2a4r__taý (7
Recall that
R ~2y (8cg p(58)
In this case, t =Pm and P L P C Therefore,
R - (59)Cg P
is
By definition, P f P + P . Therefore, equation (57) reduces tom ss
KJ(l~fR tat2) ,w I(60)
Also note that a. 6 R where R, is defined in (49). Equation (49) canL A 2
be rewritten as
• " - 4'" '

- ~r.-.'r--r----.--,~---.-t - ..- - - - - - ---.---
46
2 -- Pcrush (61) .:
Substituting (61) into (60) and recalling that a3 = R one finds
rhat[ 1 0p -- p [•[(.+l ntanj3) -.
ss crush F6J R (62)
or
I CO (1
ss crush cos(aA) R tan$) 3 (63)
This is the threshold for the growth of a nucleus by gas diffusion* * i•~""
provided that P > Pss and Pcrush > P crush'
Before getting into the analysis of the model equations presented
here, it is perhaps worthwhile to dwell a bit longer on the concept of a
critiral crushing oressure. P is giver, by equation (47): .
SA.-r -Atan 'A
crush L1-n tanB hA (64)oL A
Solving this for the radius of the crevice mouth gives
2-f nAtan 1-
A P P (65)PA= h LPcrush - Po l-rA tarl "j i[-[.•'
"---I
Writing P as P - P , (65) becomescrush m o
( A 0Y-A F* !--a (66)
From equation (44) one sees that the second term inside the brackets is
simply equal to the final gas pressure, P', inside the nucleus. Using
this (66) becomes
__cos(a A-Zi)A (P*- P ) (67)
m g
22Apfel defines a critical crevice radius for acoustic cavitation as
K S i

- - -- ' -,• . - .•' • , .-- -, - .- --
47
* p ( A BI, . .. -- .'A 2- 'Co (a (68)
(PL-P)
(neglecting vapor pressure). Apfel's PL and P are analogous to Pm andL g ..m
P' in equation (67). Therefore, the concept of P crush in diffusiong icavitation is analogous to Apfel's concept of A in acoustic cavitation,
the only difference being that Apfel considers only full crevices
( 1)(h - 1). ._
-N/7[
• *.
* "...1
..(°
2 ,.C '-4 {
C- - -
( a/2-

Chapter 3
Analysis of the Critical Radius"* Approach to the Crevice M-odel
3-1 Introduction
*- In this chapter the critical radius approach to the crevice model _
will be analyzed on the basis of its ability to predict cavitation
thresholds. The discussion will include both acoustic and diffusion -
cavitation and only the crevice model will be considered. In a later P
chapter other stabilization and nucleation models will be analyzed.
3--2 Application of the Crevice Model to Acoustic Cavitation
The acoustic cavitation threshold of water will be predicted as a
function of dissolved gas pressure, surface tension, and temperature.
Unless otherwise stated, all theoretical predictions will be based on
the critical radius criterion.
3-2.1 The Effect of Dissolved Gas Pressure
Recall equations (31) and (40) from the previous chanter.
P = P -- P + - P g . o s ( A - 8 ) 1 (3otB- ,- A (31)
and 3 .[.-. A :
• o P - F + Pv- Pg) CO(40)..PAto-v-n[ -(Po-P cos- -8) (40g cota+n 0 sA-8
These equations are the expressions for the acoustic pressures necessary
for the interface to reach the critical radius (R ) and the recedingcv
contact angle, respectively. Equation (40) is essentially the same as
48
..I- ._

49 -
the threshold predicted by the previous formulation of the crevice 0
model.
The dependence of these thresholds on the dissolved gas pressure is
explicitly stated. (We shall see later that the dependences on surface MO--
tension and temperature are not so explicit.) Recall that P isg
equivalent to the partial pressure that the gas inside the nucleus
exerts on the interface in both the saturated and undersaturated
(degassed) states. In the absence of gas diffusion, the partial
pressure of the gas in an expanding nucleus is less than Pg
Figures 10a and 10b show the cavitation threshold as a function of
dissolved gas content for two representative values of surface tension. -"-
These grraphs illustrate several important points. First, the two
nucleation criteria are equivalent over a short range of gas pressures. I.OIL
This equivalence is difficult to show analytically; however,
numerically it is easily demonstrated. Hence for threshold measurements
made in these regions, the different criteria give equivalent
predictions. The theories diverge on either side of this equivalent
region. At no value of gas pressure is the threshold predicted by the '
critical radius criterion (PA) less than that predicted by the recedingA"
contact angle criterion (P ). In other words, while P is a necessary
condition for nucleation, PA is both a necessary and sufficient
condition for nucleation. -O "
At low gas pressures, the receding contact angle criterion gives a
limiting threshold value of between about 6 and 12 bars for the ranges. '
of surface tensions discussed here. The exact values are not important.
---------------------------------------------------------------------------------
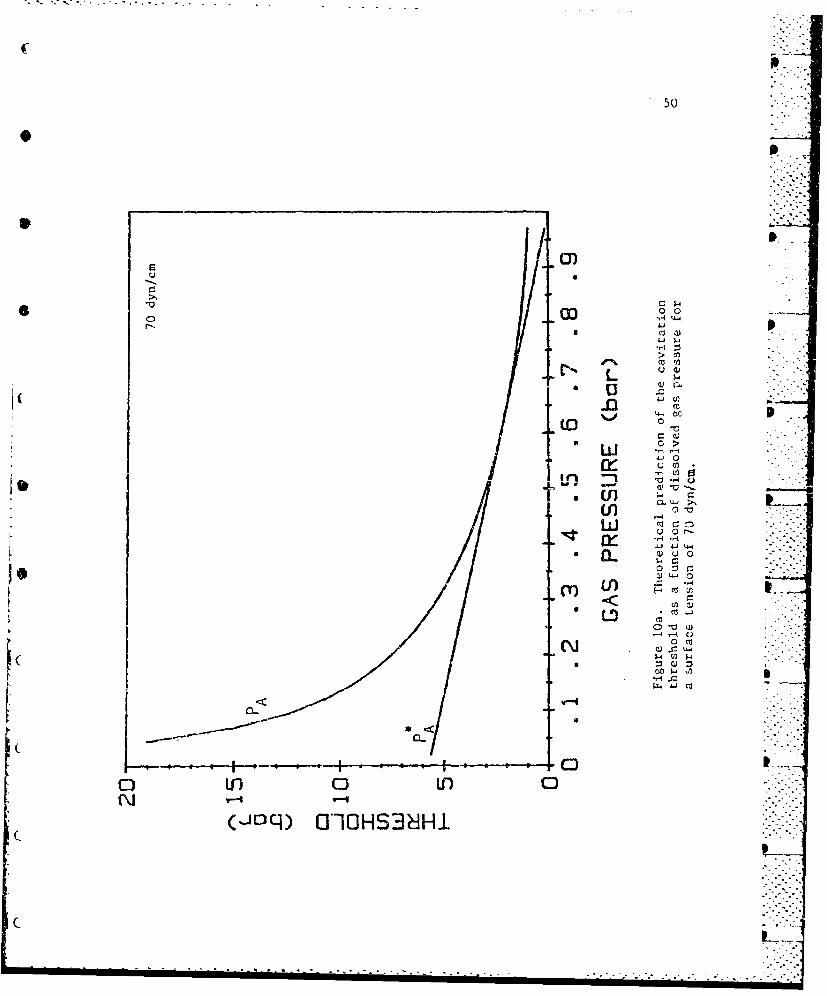
50
0Y)
00 03-
>ct
ct,
0 >I-W0
(-eU' 0>w
co c
U) -J
0?U
1~ 0 LC

51
cu 0
C.CL
04 1
00
o I I
Q)
(00wl .r- - .
F: .LQ -
QJ )~ -a
in~~ 0 L)*j~q v-iH3H-
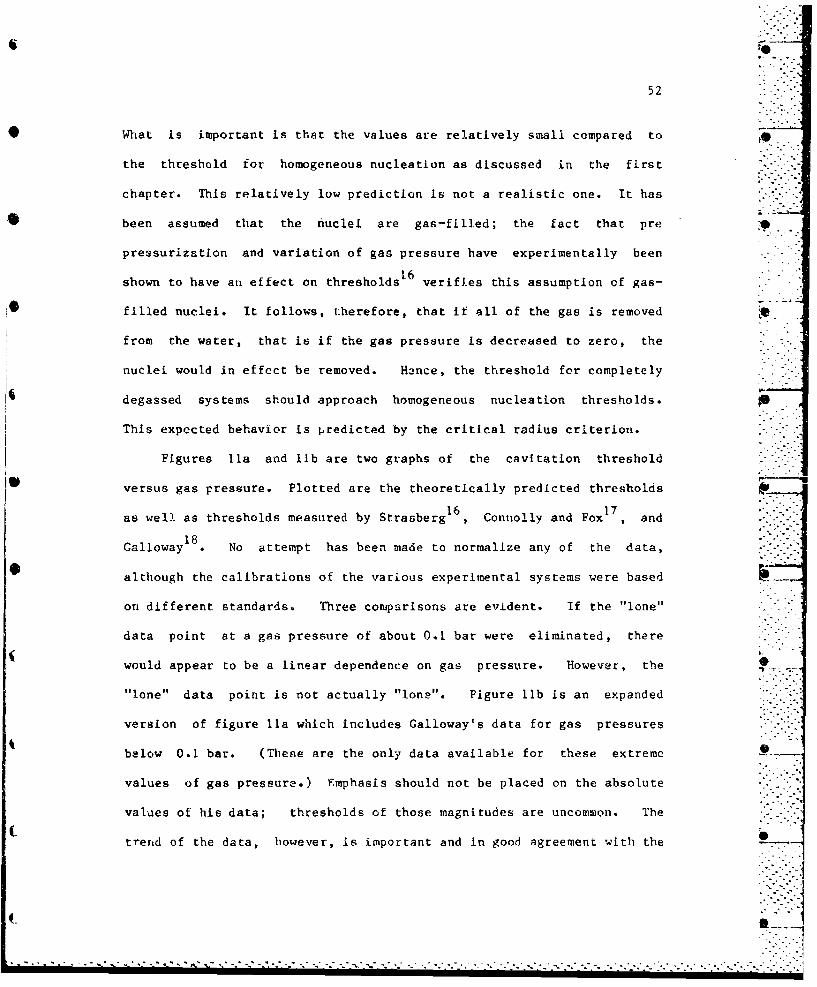
52
SWhat is important is that the values are relatively small compared to
the threshold for homogeneous nucleation as discussed in the first
chapter. This relatively low prediction is not a realistic one. It has
"- been assumed that the nuclei are gas-filled; the fact that pre
pressurization and variation of gas pressure have experimentally been
1.6shown to have an effect on thresholds6 verifies this assumption of gas-
filled nuclei. It follows, therefore, that if all of the gas is removed
from the water, that is if the gas pressure is decreased to zero, the
nuclei would in effect be removed. H2nce, the threshold for completely
degassed systems should approach homogeneous nucleation thresholds. .
This expected behavior is predicted by the critical radius criterion.
Figures Ila and lib are two graphs of the cavitation threshold
versus gas pressure. Plotted are the theoretically predicted thresholds
16 17as well as thresholds measured by Strasberg , Connolly and Fox , and
18Galloway . No attempt has been made to normalize any of the data,
although the calibrations of the various experimental systems were based
on different standards. Three comparisons are evident. If the "lone"
data point at a gas pressure of about 0.1 bar were eliminated, there
would appear to be a linear dependence on gas pressure. However, the
"lone" data point is not actually "lone". Figure llb is an expanded
version of figure Ila which includes Galloway's data for gas pressures
below 0.1 bar. (These are the only data available for these extreme 0
values of gas pressure.) Emphasis should not be placed on the absolute
values of his data; thresholds of those magnitudes are uncommon. The
trend of the data, however, is important and in good agreement with the
----- ---- ----
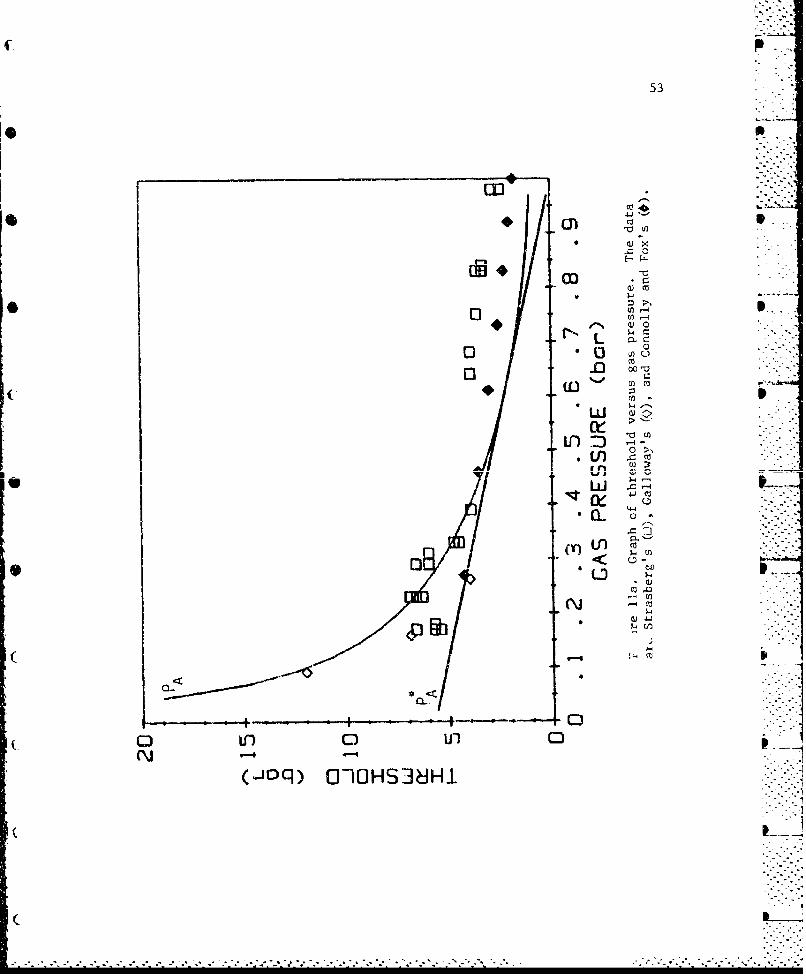
53
cnn
U) c
(n 0H
f r%
0-~
<W u132
00
0 0' 0 U-)-
(joq) OIOHS3LH

54
00 0
00
L o w c v
0.0
(a- E- r
Qf) 0
0 C)0
NN(J~q) 00HS3)J)

55
critical radius nrediction. It should be pointed out that the limiting I
value of the threshold as predicted by the receding contact angle
criterion differs from the experimental and theoretical values given in
figure lib by well over an order of magnitude. I
As shown in figure 10, the receding contact angle criterion
predicts a threshold of zero bars for near-saturated solutions. On the
D other hand, the critical radius criterion predicts a threshold near 1 I
bar (actually P -Pv, which is approximately 1 bar for low temperatures).0 V9
The difference is inherent in the definition of R (given by equationcv
11 of the previous chapter) in that the expression for P is valid .cv
onlv for total external pressures (P -PA) less than P • There is no -".-0 A v
such restriction on P This difference, although forced, should be "
experimentally verifiable. '
Referring to figure ela, it is seen that the experimental
thresholds tend to be about 2 bars for saturated solutions. Although.
this is in closer agreement with P than P the discrepancy isA A'
troublesome. This discrepancy may result from the fact that the
theoretical model does not strictly reproduce the experimental
procedure. That is, the lines on the graphs represent the acoustic
pressure amplitude necessary for the nucleus to become mechanically
unstable. The experimental thresholds are measured values of the
acoustic pressure amp]itude within the liquid at the time a bubble was
detected. It should not be assumed that these two pressure amplitudes
are always the same. The process by which a nucleated bubble (or
t bInucleate) becomes a detected bubble is indeed complex, as alluded to at-_-..
- "i --.

56
the close of the first chapter. One factor which can complicate the
evolution of a nucleate is gas diffusion into the expanding bubble. . -; --
This factor is ignored In the theoretical threshold predictions.
However, the effects of gas diffusion should diminish as the gas content
of the system decreases. This conclusion is consistent with the results
shown in figure Ila; there is better agreement between theory and Iexperiment at gas pressures below about 0.5 bar.
A somewhat quantitative explanation of the discrepancy can be made
with the use of Apfel's work on acoustic cavitation prediction0 35 Apfel -_
defined thresholds for various types of cavitation and uses these
definitions to predict which of the types of cavitation will occur under
a given set of experimental conditions. The threspholds reproduced in
figure 11 were described by the experimenters as corresponding to
"transient" cavitation events. If an order of magnitude estimate of the .1initial radius of a nucleate is made, Apfel's criteria for transient
cavitation can be applied to find the pressure amplitude necessary for a
nucleate to evolve into a detected bubble. The term "detected bubble"
refers to a bubble from which a vaporous cavity can form in the
presence of a sound field of sufficient amplitude.
Up to this point little has been said concerning the physical size
of the crevice. Apfe122 estimated the radius of a crevice mouth to be
about 0.5 um. Assume that the crevice has a depth equal to its mouth
diameter. This results in a crevice volume of about 3x10- 9 Let uS
further assume that the nucleation process deactivates the crevice. By
" 2..

57
this it is meant that when the critical radius is reached, the expanding S
vapor cavity will eventually detach itself from the solid, removing all
of the gas from the crevice in the process. Titus, shortly after
nucleation, a mostly-vapor-filled cavity exists which contains an amount .
of gas such that under average conditions (zero acoustic pressure) would
-19 3have a volume of 3x10 m • Therefore in order to predict the future
of this nucleate, we shall examine the evolution of a spherical bubble "
having that volume, or equivalently, a bubble having an initial
equilibrium radius of about 0.4 iJm.
Apfel's analysis indicates that a bubble small compared to its
resonance radius will become transient when the acoustic pressure
amplitude exceeds the Blake threshold. The Blake threshold is the free
bubble analogy to the critical radius approach to the crevice model. It P '
is derived by combining the value of R with the pressure balanceciV
equation for a free bubble. The Blake threshold is
V '~ B(69)B + B ( -+XB)
whe re L -;-%.:-
XB F P R (70)0 0
Here, R is the equilibrium size of the bubble. Using P =1 bar, y=700 0
dyn/cm, and R 0.4 Dm, the calculated value of P is 2.2 bar. Figureo B
lla has been reproduced in figure 12 with the exception that PB is shown*B
instead of P The lines intersect at a gas pt,ýssure of about 0.6 bar.
Below this value PA is larger and the fit with the data is good in this
region. However, above 0.6 bar the prediction of PA diverges from .*
experiment and it is seen that P8 is a much better predictor. It should
- -- ---- ---.. -. %.--;-:c-:-;-:.----.-- - - - - -- - - - - - - - -. ~.- ti -.

58
0- (
L c
(D 4.
a) -w
rn V.)
I-Q E 00)<p~(~ Eb -3 )
-H' T, -4
U4-
0~0
CF U- 0I) 0
(-jc~q) O1IOHS38HI

59
be pointed out that the straight solid line assumes a constant value of .
R.0
This analysis of thresholds near saturation does not Drove that the
cavitation nucleus is in fact a gas-filled crevice. It is, however, not .
inconsistent with the hypothesis. It is seen that a gas-filled crevice
could give ri le to a nucleate which would later grow as a free bubble to
a detectable size because the Blake threshcld exceeds the crevice model S
threshold in the near saturation region. For liquids far below
saturation, the cruvice model is a gooa predictor of caviltation
thresholds. In this reaion the critical radius criterion anpears to be
a necessary and sufficient condition not only for bubble nucleation but
also for bubble detection.
3-2.2 The Effect of Surface Tension .1.12
The functional dependence of the critical radius threshold on the
liquid-gas surface tension is not as obvious as with the cassŽ of qas
Cum34pressure. To understand this dependence, we follow the lead of Crui,.
who used an empirical relationship discovered by Bargeman and Van Voorst -
40Vader , viz., csE c-
Y (71) ....
where is the equilibrium coatact angle and c is a constant. For manyE
nonpolar solids c has a value of about 50 dyn/cm. This relationship is
valid for surface tensions greater than about 10 dyn/cm. In the analysis
given by Crum as well as the one to follow, it is assumed that u E='A and
that ahOa •AX wih ere a is the hysteresis contact angle. (Hysteresis is
A.-. .- H. .
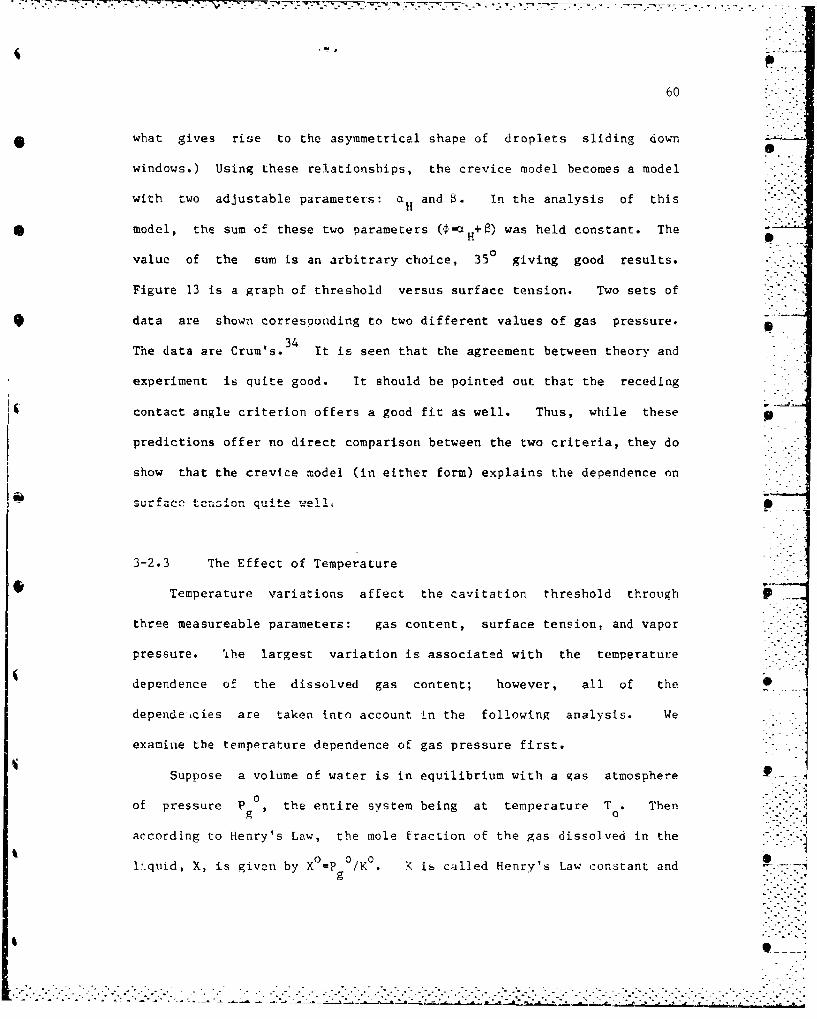
.
60
what gives rise to the asymmetrical shape of droplets sliding down
windows.) Using these relationships, the crevice model becomes a model
with two adjustable parameters: a and 3. In the analysis of this
* model, the sum of these two parameters ( H was held constant. The
value of the sum is an arbitrary choice, 350 giving good results.
Figure 13 is a graph of threshold versus surface tension. Two sets of
9 data are shownl corresponding to two different values of gas pressure.
34The data are Crum's. It is seen that the agreement between theory and
experiment is quite good. It should be pointed out that the receding
contact angle criterion offers a good fit as well. Thus, while these p
predictions offer no direct comparison between the two criteria, they do
show that the crevice model (in either form) explains the dependence on
surface tension quite wel14
3-2.3 The Effect of Temperature
Temperature variations affect the cavitation threshold through P
three measureable parameters: gas content, surface tension, and vapor
pressure. 1he largest variation is associated with the temperature
dependence of the dissolved gas content; however, all of the.
dependencies are taken into account in the following analysis. We
examine the temperature dependence of gas pressure first.
Suppose a volume of water is in equilibrium with a gas atmosphere
of pressure Po, the entire system being at temperature T . Then
according to Henry's Law, the mole fraction of the gas dissolved in the
liquid, X, is given by X -P 0 /K0 o K ib called Henry's Law constant and -.- -2 "i .
. . .. . ..',
k . ". ". .- . -? " - -" -" - . - . - . . . . - . -. . . -. -. -. . - . -. . - . - ' . - - _ - .-- . -. -. . -. .. - - - .- . - .. .-. - : 3 -

61
0 po
40
C.)
N- E-
r_ 0Ic0 > 1 CU
LO -o
:00
z a-
a Cj
o Lj l=
0
cy:L C Cý
o mcCF)~~I- U..Q
0l l-P Co 'j (41
0 n0 Lf)0NM
(-jon) O]-OHS3dHIl

62
is a function of temperature. If the temperature is changed to T, then
gas goes into or out of solution until again XVP /K. For large volumesg
of water, the amount of gas which diffuses into the nucleus is .-
negligible. Thus, the mole fraction can be considered constant and the .
equilibrium gas pressure at a temperature T becomes
F CT) P o K(T) (72)g g K5
where the temperature dependence is indicated.
'n order to evaluate this dependence, data taken from the
41,International Critical Tables for the variation of K with temperature,
were fit, using a least squares method, to a third degree polynomial, -
viz.,
7 5 3 2 3K- (3.24xi07) + (9.59xi05) T - (2.17xlO) T - 2.59 T (73)
The units of K are bar per mole of gas per mole of water. T is measured .
in degrees C. The coefficient of correlation of this fit is 0.999.
Figure 14a is a graph of K versus temperature. In the temperature range .'.•-
of interest, the fit is indeed quite good. The initial value of K, K
is calculated from a knowledge of the initial gas pressure and the
temperature at which the sample was degassed.
Although analytical expressions for the temperature dependence cf
surface tension exist, in this analysis we chose to employ a least
squares fit of values for the surface tension of water taken from the
CRC Handbook of Chemistry and Physics (56th edition). 4 2 A second degree I
polynomial least squares fit was used, viz.,
-4 2y(T) - 75.65 - 0.142 T - (2.63xi0-) T (74)
Surface tension is in dyn/cm and temperature in degrees C. The
0..° "-

p ..63
Co
-. or 0
ui 0 U p%-,
LD LI j U) (n
, --I o
= •.:-; . -_
CO L
-- --. , Lu UJ .cNI -. ;
!._OT X "L5N03 MAVI S~,,,,b',3H i-.-:--{}
a -" -cc.
CC
d. 4.) . ....
-4 0 o-• .
mi 03

~. ca
o luJJ
0 0 C4
Co 0
4-4 -1-
1-4 (D
I >i*u
IU Ld m
I CC
(\J E-
~-4 (u
C~~~~1 Lf Ll C !
0o N 0 (n0 Lfl)
(Luz) fU/(P) NOTSN3i 3i)vidflS

65
coefficient of correlation is 0.999. Figure 14b displays the data and .
least sauares fit for the surface tension dependence on temperature.
The final temperatur variation to be considered is that due to
vapor pressure. For this parameter, an analytical expression was used.
43The expression is that of Osborne and Meyers
1oP~ B CX DX2 ii+£10 ' (75)log Pv" A + TA T OX
w h e r e + TA 2 )
T temperature in degrees Celcius C = 1.3869x10⁻⁴
TA absolute temperature D = 1.1965x10- 1
X T - K K 2.937xl0 5
A
Y = 374.11 - T H = -0.0044
A = 5.4267 F -5.715xlO 3
B = -2005.1
43According to Eisenberg and Kauzmann3, this expression is accurate to
within five parts in 104
The cavitation threshold is plotted as a function of temperature e
for a range of dissolved gas pressures in figure 15. The open squares
represent Galloway's data and the solid squares represent Crim's data.
The solid lines represent the threshold as pcedicted by the critical
0 0radius criterion for &=12.85 and ý++ct 35 . The data have been
normalized to fit the theory at room temperature (230 C). The variation
with temperature is predicted well by the crevice model emploving the -
critical radius criterion. Although there are no data to test the
theory above 50 C, the threshold must approach the vapor pressure at
the boiling point. This behavior is suggested by the "tail" at high -
4 f - '-t
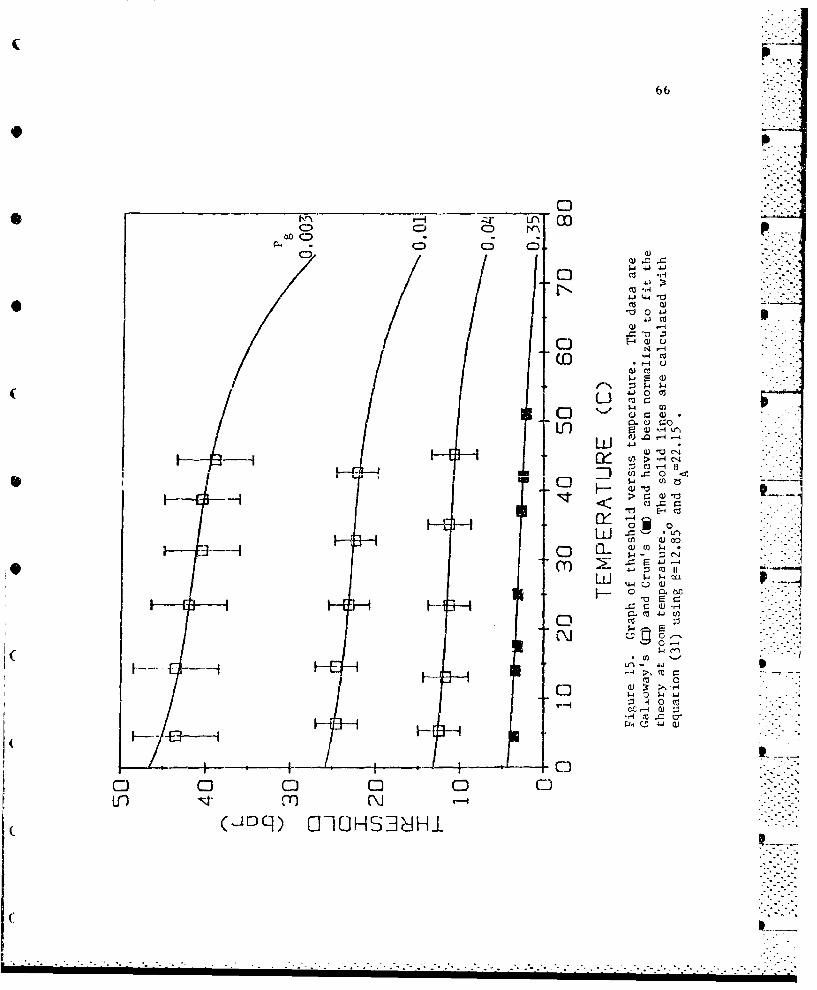
66
* 0
CD,
0
-J 0t4-4 1
0 41
4j c-oo
M- 0
---- 0i (a-~d
"F- E- co~
(\J
L (L 4 -J 0 C;I-
(\(

67
temperatures. ,
3-2.4 Comments on Sensitivity
It w.is shown that the critical radius approach to the crevice model
provides a good explanation of acoustic cavitation thre&holds. However,
all of these predictions have been made a posterlori. That is, values
of 6 and • were chosen to provide the best fit to the data. For the .
majority of the analysis, 6 was chosen to be 12.850 and --350. The
exception was the prediction of threshold versus surface tension (figure
13) for P -0.19 bar. For this line 6-10.8o, yet t remained equal to h.g ii --
350. The model is very sensitive to changes in 6. Figure 16a shows
theoretical predictions of threshold versus surface tension. In each -
line, the parameter Y is consLanL dud Eq.al o 3O.5 F•o t m ddle
0 0line, cc -22.15 and 6-12.R5°. These are the same parameters for the
P =0.47 bar prediction in figure 13. The upper curve is for ccH-21.15°" - .
6=13.85°; the lower curve is for aH=23.15°, -=11.850. Figure 16b is --
similar to figure 16a, however, in this figure aH22.15 for all the
curves and a =12.85 + 1° for the middle, upper and lower curves
respectively. In figure 16c, B-12.850 and O-H. 2 2 . 1 5 + 1 for the middle,
upper and lower curves, respectively.
It is seen that varying a has little effect. However, variation~ _ .--
o0 6 produces a large change in predicted thresholds. This is
unfortunate. It means that extremely accurate a priori predictions of
cavitation thresholds are n,_ possibLe. However, the purpose of this
research is not to predict cavitation thresholds, per se, but to
°f.l-A':!

68
00000
0 00 0*~c 0004
-0 - 000
On U 0 0>
(D 4.. en-
241
z~ I-4 >/ I / If) mU4z Ld0r
W 0
< ~
Ln 0 Hn C)
0~ N.) ' -).~O
0')~q O-IOHS38H
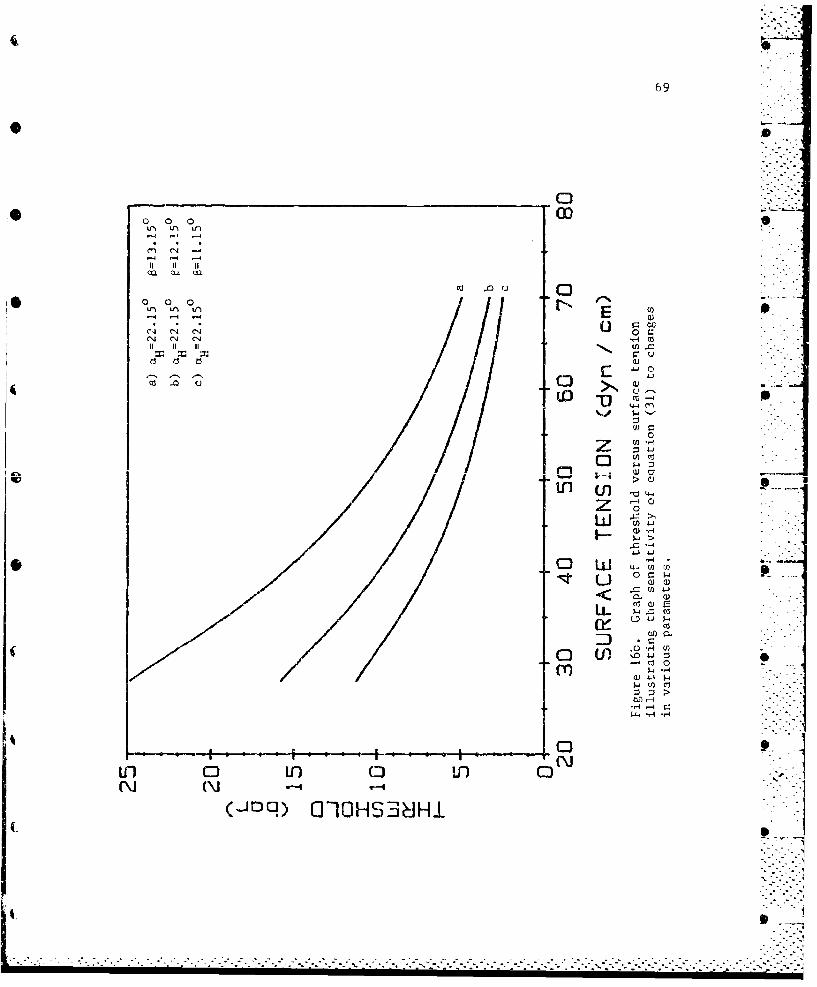
69
00 0 0 *0c4 D
0 02
U c4 cf4 0
cq (Ni 14 U H
(N3 Z5 (N6
(13 . r; 0 - =
() CT
z '
w >F - -4
U 0 rU ww
CL Q)cli
C3 0.
(V) co'::I >
tz -4P, r4 _4
0 tO 0- in.0N NM
(-'Dcq) O-IOHS-3dýHi

07
0 0 0
C14 CN C1
Qa Qa ca
irn Lfl VLEI o
N -H
C1 N" N C:
41 0
00
:3n
Lo o0%.- LipLLo . o
W
0. 0
c'0J
U -H U)
C) U) c 3
C\j(\
(J~n) rJOHS3H~iH
7 1
identify possible candidates for the cavitation nucleus. The degree to AD
which the a posteriori predictions agree with measured values indicate
that the crevice model is, inc~ed, a plausible nucleation model for
acoustic cavitation. In addition, even in the worst case, using typical 0
values of the parameters, a priori predictioas of the cavitation
threshold can be made that disagree with measured thiesholds by no more
than a factor of two.
3-3 Application cf the Crevice Model to Diffusion Cavitation
The analysis presented in this section is unique; ic is the first
attempt, that we know of, at applying ths. crevice model to diffusion
cavitation. Reference will be made to the diffusion cavitation data
published by Yount26, an example of which was reproduced as figure 4.
Yount has explained his data in tezms of the varying-permeability
ocga, kin model. The variation of the permeability is necessary to
* c change in slope of the isopleths for the various numbers of
b -- his change in slope is something which Yount claims is
inexplicable in terms of the crevice model. The version of the crevice
model to which Yount is referring to is the previous iormulrtion. An
explanation of this phenomenon can be provided employing the reised
creviceý model.
As pointed out in the previous chapter, the concept of P crush is
analogous to that of a critical size of a crevice. Yount also uses
P to .,nean the crushing pressure at which the organic skin becomescrush
impermeable. Drawing an analogy between the two definitions of P crush'
I' S •.

72
we can say that the crevice model analogy of a permeable/impermeable
transition is the interface reaching the advancing contact angle.*
Equdtion (63) was derived for crushing pressures greater than P crush"arush
i.e., it is analogous to a process in Yount's impermeable region. For
crushing pressures less than P crush' equation (63) becomes
A P crush i+ j tans) (76)
ss ru jcos(c-3) L R
The only difference between equations (63) and (76) is that in equation
(76), the interface is at an angle a and not the advancing contact angle
aLA. Moreover, 90° <a-B( <IA-B , which means that Icos( a-B )I <
Icos( GA -B )1. Hence, d(Pss)/d(Pruh) is greater when the crushing
pressure is less thpn P crush" - ti- ..... t-- cn------nt- with Yount's
findings.
in the experiments described by Yount, bubbles were formed in
gelaLin samples which had an average surface tension of about 53 dyn/cm.
Using equation (71), one finds that the advancing contact angle for this
surface tension is around 93°. It can be seen from geometrical
considerations -lat for stability aA >"+ > aR Therefore. If
U - 930, the L-revice half-angle must he between zero and three deg•_-A
Crevices with half-angles greater than 30 are unstable and become
deactivated (thoroughly wetted). For the calculations to follow, ý was
assumed ti be 10; the crevice has become a narrow crack. For such a
nari-ow crevice with an advancing contact angle close to 90°, one would
expect that the hysteresis angle would be small; assume it to be 3. A
• 26typical value of P crush is about 8 bars. Solving equation (47) for
crush.

73
the product hA and using these values for the various parameters, one
finds that hA is about 6 nm. One possible interpretation of this result
is that the nucleus is located at the bottom of a deep, narrow crevice.e*
crur crush' one finds from equation (76) that
d(Pss)/d(Pcrush) is between 0.5 and 1; for Pcrush > P crush'
* dPs )/d(F crush) is about 0.5. These values are reasonably consistent
26with measured values. The main difference is that the data show a
range of 3lope3 for P > P from about 0.2 to 1. The crevicecrush crush
model result is within this range. This discussion is illustrated in
figure 17. The predictions shown in this figure are reminiscent of
those in figure 4.
The results of these calculations are very sensitive to the chosen
parameters and more work needs to be done on these concepts. The size
of the nucleus involved with these vrocesses is very small and it is
* possible that some phenomenon not taken into account in this model may
well become important at these small sizes. However, two points have
been made. First, the crevice model can explain the change in slope of
( the isopleths. Second, the calculated values of the slopes are _
reasonable. Perhaps one final comment it appropriate. Yount and others
have carried out an extensive microscopic investigation of bubble
44formation nuclei, about which more will be discussed later. The
investigators make the statement "In no case have we observed a gas
phase embedded in a crevice, as would be required by the crevice
Smodel.. This absence is ecactly what one would expect according to
{oe...hi bec

. . . . . . . . . . . . . •-- -l
74
20 "
P =ss crush
*/ S! -
15 /
0 /-i
S / .U
,/
Aw
XU)
5 4
0 / 10 is 2
Figure 1. Crusih (atrn 2)'
Fiue1.Plot of P versus P illustrating
tile change in slope at 1 = P as predicted(crush crush
by the crevice model.(-

75
the argument given above, which showed that the gas phase should be very P
small and locatea at the bottom of a deep narrow crevice.
As has just been shown, the critical radius approach to the crevice
model offers an explanation of results of both acoustic and diffusion
cavitation experiments. There are, however, other nucleation models and
they are taken up next.
* I
-- _ -" i
C".: •
Chapter 4
Other Candidates for the
Cavitation Nucleus
4-1 Introduction
The previous chapters have been devoted to the critical radius .
approach to the crevice model. It was shown that, based upon its a
posteriori predictive powers, it is a plausible nucleation model. There
are, however, alternative models and this chapter is devoted to thet.
It was stated in the introduction that only two other nucleation models
20are corqidered feasible. One is the ionic skin model of Akulichev and
the other is the organic skin model most recently advanced by Yount, 2 8 "
In this chapter, these mGdels will be analyzed to determine whether or
not they really are plausible models.
4-2 Ionic Skin Model
The ionic skin model proposed by Akulichev was reviewed in the
first chapter. That review is adequate for this analysis and the reader
should refer back to it if necessary. The strongest evidence that
Akulichev presents in support of his model is the increase in threshold
with decreasing ion concentration. This behavior must exist if his0
model is feasible, It is to this behavior thaL we direct our attention.
Two points become evident upon investigating Akulichev's work.
First, the lower limit of the concentrations used in hiF experiments was
6S
.. . . . . ... . .

77
about I mmol/l. In fact, he published only two data points below Lhis
concentration, one at about 0.6 mmol/l and the other about 0.3 inmol/l.
Second, his conclusions about thresholds for concentra tions below - -.
I mmol/l are based upon extrapolations of trends present at higher S
voncentrations, not upon experimental measurements. (Refer to figure 1.)
In an effort to extend this lower limit and experimentally determine the
influence of the dissolved iRn concentration on the cavit .ion P
threshold, we performed a series of measurements of the effect of ions
on the cavitation threshold. The details of this experiment are d
presantea in the appendix; only those details necessary for the present P
discussion will be waentioned here.
Figures 18a and 18b represent typical results of the experiment.
It should be pointed out that zero on the abscissia corresponds to a- 3
concentration of I mmol!l. Tne data in the figures have been normalized -
to the threshold value at the lowest concentration. The experimental -.- '-.
Scatter is such that no strong conclusions can be drawn about the P
possible fine structure present in the data. Vowever, one conclusion
can be made. The threshold does not increase monotonically with
decreasing concentration. On the contrary, in every set of measurements
made, the trend is for the threshold to decrease. It is true chat n'o
direct comparison of these data and Akulichev's is possible because the
experiments were performed at different dissolved gas concentrations. -
However, it is not at all clear why this difference in gas content
should alter the results so as to produce the opposite behavior. It
may, therefore, be concluded that the nuclei of the cavitation detected
-----------------------... ... ... .. .....-- '-- .. .-.-.-..-.... •.-':-->

78
-4-h
to
1-4
0 w
0 0 r-
4hz
oS36Hi AVO WJO

79
*- - .
4 r,
zz
0 co
m~ 0
0 U)
6 00
U j
(\(1
'S3]H *A3 KIU

80
* in our experiments were not ionically stabilized.
Although not statistically significant, there is a recurring trend
in all of the data for the threshold to reach a maximum value at a
concentration of about 1 mmol/l. This behavior is reminiscent of the
trend In Akulichev's data. It is an interesting observation and it
makes theoretical analysis more difficult. This trend leads to a second
conclusion that can be drawn from the ion data. The dissolved ion
concentration does, in fact, influence the cavitation threshold. This
influence is, perhaps, not a simple one and it appears that it is not
attributable to a purely ionic skin. The trend in the data nay indicate
a transition region, above which one type of nucleus is predominant and
below which a second, different, type of nucleus is the predominant
cause of the cavitation. For example, the cavitation detected at
concentrations above I mmol/l maay, in fact, be due to AI'ulichev' s
nuclei. Decreasing the concentration would Increase the threshold of
these nuclei. However, the decrease In concentration may decrease the
thueahold of some other type of nucleus so that it is able to produce a
bubble at a lower threshold than an Akulichev nucleus. This statement
is speculative but plausible.
4-3 Varying-Permeability Model
In section 3-3, the crevice model was a~plied to diffusion
cavitation, a process which had been explaine", aI~most exclusively In
28terms of the organic skin model . In this section, the organic skin
model will be applied to acoustic cavitation, a process which has been
S. . -. . ,
-- .."-- :- .- -

*explained well in terms of the crevice model. The dependence on .4
dissolved gas pressure will be discussed first.
In order to determine the variation in the acoustic cavitation
.* threshold with dissolved gas pressure based upon an organic skin
nucleus, It must first be determined how such a nucleus is affected by
the degassing process. The degassing of a liquid is generally
accomplished in the following manner. The atmosphere surrounding the
liquid is evacuated to a certain pressure, say P d ("d" for degassing
pressure). This is equivalent to the decompression phase of Yount's
experimerts. The liquid comes to equilibrium with the atmosphere so
that the dissolved gas pressure P equals P *At this point the ambientg d
pressure is returned to atmospheric pressure, which is equivalent to the
upcompression phase of Yount's experiments. The measurements are then
made before the liquid has enough time to come back into equilibrium
with the atmosphere. The process just described is a Yount experiment
0 ~~in reverse; the decompression phase occurs first, then the equilibration .-
phase, and finally tl'e compression phase. Therefore, in order to
determine the effect of gas Pressure, the effect that the degassing
process has on the radiur of the nucleus must be determined. Since the-
changes in pressure are always leSS than one atmosphere, the skin can
always be considered permeable.
Assume that a varying-permeability (V-F) nucleus with an initial2
radius R is degassed to a pressure P This decompression is governed0 d'
by equation (19c) of reference 26, viz.,
I-(77) eL LRd Rj d a
. .3 .

( p .
82I.p(The notation has been altered.) y is called the skin compression.
The decompression results in the liquid being supersaturated, so the
nucleus will grow by diffusion if the final radius Rd exceeds R -.40 d cgQp
Using this criterion along with ,he preceeding equation, one finds that:
the largest radius which a nucleus can have and survive degassing (i.e.
will not grow by diffusion) is
R0 2- (78)
According to the V-P model, the following relationship exists among YC
'Y and R( 0 bR0 b0
"fc + 2---" (79)
(The variable b is the same as beta in reference 26.) b is a variable
whielh d•ens nnnpon thermodynamic considerations but is constant for a
given sample. For the experiments discussed by Yount it has a value of
5 2about 1.43 x 10 N/rn Substituting equation (79) into (78) gives
Ro = 2 [• (80).-
Following the decompression, the liquid eventually comes to
equilibrium with the reduced atmosphere. It is not clear exactly what ---. -.
the response of the nucleus will be to this equilibration. However,
two possible extreme cases can be discussed. The first case Is one in -
which the equilibrium radius Ret is the same as the degassed radius,
Rd. In order for this to be the a.:tual case, enough additionaldp
surfactant mclecules must be adsorbed onto the skin tz stabilize the . -
skin at this radius. The second extreme case is one in which the -
nucleus shrinds back to its initial radius, R . In this case it is
o S
< - , -

83
assumed that no additional surfactant molecules attach themselves to 0
the skin. Moreover, one would not expect any molecule' to leave the
skin during the decompression. Hence, since the skin consists of the -,-
same number of molecules the nucleus should be stabilized at the same 9
radius, namely, R 0]In either case, during the subsequent compression back to P , the
0
*nucleus should obey the relationship 2 6
2 (y -Y)r. R] P 0-p (81)f eg
where R is the final radius after compression, R is the equilibriumf e
radius (either R or R , and P is the dissolved gas pressure in the
liquid and equal to Pdo Compazing equations (77) and (81), it is easilyd*
seen that if the first case Is true (Re Rd) then R f R • If the
second case is true then it can be shown from equations (79) and (81)
that
R I R I +° + (82)
The ccmpressed nucleus will be supersaturated so gas will diffuse out of
it; however, this diffusion does not result in a change in radius (see
equation 16 of reference 26). Now that the response of a V-P nucleus to
the degassing process is known, it must determined how such a nucleus
will react to an applied acoustic field. Previously, it was stated that " '-
a V-P nucleus will grow during degassing if its radius exceeds Rcg
This criterion is consistent with the derivation of the V-P model (see
equation 17a of reference 26). Therefore, one would expect that such a
nucleus will grow in an acoustic ficld when the radius exceeds R (if
cv

'C. - - ". . - .-
84
PA < Po-P ). This criterion is given by the Blake threshold (see
equation (69) of Chapter 3). Figure 19a shows the Blake threshold as a
function of dissolved gas pressure for the two extreme cases discussed
above. It can be seen that the threshold is relatively insensitive to
variations in gas pressure and that the difference between the two cases
is negligible. However, there is a hint that the proper trend isS
present.
There is one large caveat in this discussion; it is the choice of
the valae of b. For the results shown in figure 19a, the value of b was
that computed in reference 26. That is, it was based on measurements
made on gelatin samples having a surface tension of about 51 dyn/cm. " i
However, the data presented in figure 19a were taken in water having a
surface tension of about 70 dyn/cm. The dependence of b on surface
tension is given in equation (39b) of reference 26,
b - 2.80 x 10 4 y dyn/cm. (83)
For Y - 70 dyn/cw, b - 1.96 bar. Figure 19b is a graph of threshold
versus gas pressure for b 1.96 bar. Comparing figures 19a and 19b, it
is seen that this modification makes the prediction worse instead of p
better.
Upon examination of equation (82) it is seer. that if h is
increased, Rf increases as well; a larger Rf results In a lower
threshold. therefore, increasing b from 1.43 to 1.96 bar resulr.s in the
trhreshold decreasing. In order for the V-P model to predict the
acoustic cavitation threshold as a function of Gissolved gas pressure, b
S

85
(~0
L~L
0 10
NL*0r
Sin EDT A J-
I , a)
0amJ
4)oq 4) cjH cn wI
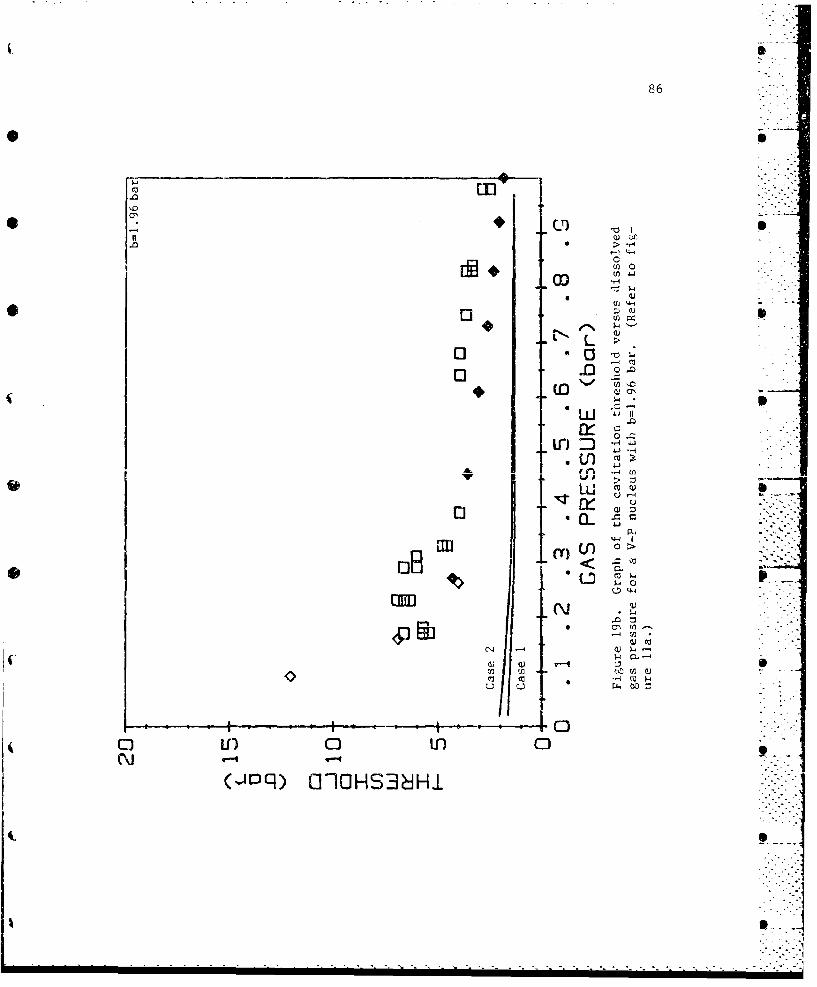
86
CT
QJj
* 0>
o((~U.J
icn Z
CLUoD0>
* p..CIO4#0(3\
* 1'4n-
04~ 4) enw;-,
( j a) v4
-0
(0 Lii 0 Lii 0(\j -
(joq~c) 01OHS36Hi

87
(n 00. H
134
U- D 0 X-
w
* ~co0a
*w OLD
Ln 0 in
(-joq 0-10 S3CN

must be less than 1.43 bar, not greater. The lower limit oii b is 1 bar. S
If b were less than 1 bar, equation (80) would predict negative radii
for some values of P . Figure 19c represents the threshold dependencess
on gas pressure for b - 1 bar. The agreement is much better, however,
the means by which the agreement was improved is not consistent with the
V-P model.
From this discussion, either of two conclusions may be drawn. The
first, and most severe, conclusion that may be drawn is that the V-P
model is not adequate. A second, and perhaps more realistic, conclusion
is that the experimental confirmation of the V-P model has been -
inadequate. The only measurements to which the V-P model has been
applied have involved diffusion cavitation occurring in gelatin. The
numerical factor (2.80) present in equation (83) is based -ipoun a set of L-.
measurements made on a single sample of gelatin. It is possible that
this factor varies with the experimental conditions and is not a
"universal" constant. This possibility could account for the .
discrepancy present in figure 19.
Aside from the limited experimental confirmation of the V-P model,
its complexity leaves it cumbersome to apply. For instance, consider
the effect that a variation in surface tension might have on the
nucleus. Since the model depends upon the chemical potential of the
surfactants, It is not at all clear that if different types of
surfactants are used to alter the surface tension, the threshold would
not be affected in different ws,. s Even the model's chief advocate is
not certain how the addition of surfactants affect the nucleus. In .
.. ... ....... .... , n.. i .."i..... ...."•'z•i•......i"...i. •("--
89
reference 28. the statement is made "Another standard method [of
increasing the threshold for bubble formation] is to add detergents or
other substances which presumably operate by changing [b]". The effect
of temperature variation on a V-P nucLeus is an equally complex matter.
In fact, not even a qualit• tive description of the temperature
* dependence is offered in reference 28, only the statement "A dependence
on temperature is also predicted".
The discussion in this section may be summarized as follows.
Although the varying-permeability model is elegant and explains
diffusion cavitation in gelatin, its application to acoustic cavitation
is cumbersome at best. Since these nuclei have been observed using
42Smicroscopic techniques4, their existence is difficult to deny.
However, the model needs to be extended to explain acoustic cavitation
processes.
$ I,
Si i.i•
iS ]):

Chapter 5
Summary, Conclusions andTopics for Further Study
5-1 Summary of the Dissertation
As stated at the outset, the purpose of the research discussed in
this dissertation was to advance the state of knowledge of the
cavitation nucleus. The advances made toward this goal may be
summarized as follows:
1) The crevice model was revised in terms of a more physically
realistic n.ucleation critrion. This new criterion was shown to be both
a necessary and sufficient condition for cavitation nucleation.
2) The predictions of the acoustic cavitation threshold based on
this revised model (called the critical radius approach to the crevice -'-
model) were found to be in good agreement with experimental results.
3) The revised crevice model was applied to diffusion cavitation
(the first such application) and it was shown to predict resultsA
previoubly explainee only in terms of the varying-permeability model.
4) It was shown that in liquids with low surface tensions,
nanometer-sized nuclei are capable of producing cavitation.
5) The first extensive measurements of the acoustic cavitation
threshold as a function of dissolved ion concentration were made for . -..A
concentrations less than I mmol/l.
6) These measurements indicate that the cavitation observed could
90
4. . . . . .. ... . . .

p91
not have been produced entirely by a purely ionic skin as proposed by -
Akulichev.
7) The varying permeability model was applied to acoustic
cavitation (another unique application). It was found that although the
model could explain the increase in threshold with decreasing gas
content, certain inconsistencies arose which indicated that the model
should be developed further to facilitate its application to acoustic
cavitation.
5-2 Conclusions
In this dissertation, three different cavitation nucleation
mechanisms were considered. Based upon the findings of this work, we
conclude that the critical radius approach Lo the crevice rmodel is the
most satisfactory of these models. Using this model, the threshold for
acoustic cavitation can be accurately predicted as a function of various
Sparameters. In addition, some aspects of diffusion cavitation are seen
to be natural consequences of the crevice model. We should stress,
however, that this conclusion is based on measurements made in water.
C It should not be assumed that these findingp :an be extrapolated to
other fluids without some detailed analysis.
Cavitation is a vastly complicated phenomenon and to conclude that
a single type of nucleus accounts for all cavitation processes is almost p
certainly in error. We do feel that the critical radius approach to the
crevice model is the most satisfactory theory at present. Indeed, the
crevice model may account for the largest part of the entity referred to
• -- .- .
92
as "the" cavitation nucleus. However, the fact remains that there is no
theoretical reason, nor any conclusiso experimental results, that
discounts the existence of the other two proposed nuclei. (In fact,
organic skin nuclei have been observed by Yount. 42) These models
should be developed further. As was stated earlier, we have advanced
the state of knowledge concerning the nucleation of cavitation in water.
The next step to be taken should be toward uniting these models into "a'
cavitation nucleation model.
5-3 Topics for Further Study lop
As the research presented in this dissertation progressed, it
became clear that some aspects of this research deserved further study. -
In the previous section some of these topics were ,entioned. In this
section we will mention some others.
1) Mcre measurements need to be taken In different fluids. In
particular, biological fluids are presently in need of extensive
investigation because of the possible hazards associated with the use of - - -
ultrasound in medi:ioe.
2) The results of the measurements of threshold as a function of
ion concentration are not easily etplained in terms of our present
knowledge. The explanation of these results has the potential of
advancing our knowledge of nucleation processes significantly.
3) The modification of the experimental apparatus used to make
the ion measurements (co be discussed in the appendix) should make it
possible to verify the existence of the surfactant or ionic skin nuclei. P
.. ..... .2-.
- - - - - - - - - - - - - - - - - - -- - - - - - - - - - - - - - -- ½ -'. "-'

93
With these modifications it should be possible to remove the vast
majority of the existing cavitation nuclei. Bubbles could then heP
introduced into the liquid (perhaps through electrolysis) in the .
presence of surfactants or ions. Since some of these bubbles should
stabilize, the result should be a (significantly) lower caviation
threshold.
4) A further modification of the apparatus would make it possible m
to perform threshold measurements with ambient liquid pressures close to
the vapor pressure. To the author's knowledge, this type of measurement
has never been performed. The results of such measurements are easilyI
predictable in terms of the revised crevice model, and therefore this .
measurement should be a good test of the model.
5) Another topic for further study is the measuremenr of the
cavitation threshold as a function of dissolved gas pressure fo:" ambient
pressures g•reater than atmospheric. Such an experiment may prove useful". -
i* in understanding more fully the reason for the discrepancy between the
predicted threshold based on equation (3]) and the measured threshold
for gas pressures near saturation (refer to figure lha).
6) The last topic we mention is of a different sort. Assume that S
molecular skin nuclei are confirmed to exist. Certain types of
molecules should be better stabilizers than others. Nuclei composed of
good stabilizers may be relatively rugged and able to exist in harsh
liquid conditions. These nuclei would be long lived"seeds" which could
be activated at a certain time for a certain purpose. The development
of such technology may prove to be quite useful. _
P
................

REFERENCES
1) C. Tomlinson, "On the so-called "Inactive" condition of solids",Phil. Mag. 34, 136-143, 220-230 (1867).
2) M. Gernez, "On the disengagement of gases from their saturatedsolutions", Phil. Mag. 33, 379-481 (1867).
P3) D. Bernoulli, Hydrodynamica, sive de viribus et motibus fluldorum
comentaril, (Strasbourg, 1738).
4) D. Freed and W.F. Walker, "Notes on the history of cavitation", in
Cavitation and Multiphase Flow Forum -- 1984, ed. J. W. Hoyt,1-7 (1984). P
5) Lord Rayleigh, "On the pressure developed in a liquid during thecollapse of a spherical cavity", Phil. Mag. 34, 94-98 (1917).
6) F. G. Blake, "The tensile strength of liquids: A review of theliterature", Tech. Memo No. 9 Harvard Acoustics ResearchiLaboratory (1949).
7) E. Klein, "Some background history of ultrasonics", J. Acoust. Soc.Am., 20, 601-604,1948.
8) M. Kornfeld and L. Suvorov, "On the destructive action ofcavitation", J. Appl. Phys. 15, 495-506 (1944).
9) L. J. Briggs, "Limiting negative preasure of water", J. Appl. Phys.21, 721-722 (1950).
10) R. B. Dean, "The formation of bubbles", J. App]. Phys. 15, 446- b
451 (1944).
11) E. N. Harvey, et. al., Bubble formation in animals", J. Cell.Comp. Physiol., 24, 1-22 (1944).
12) I1. B. Briggs, J. B. Johnson, and W. P. Mason, "Properties of .liquids at high sound pressure", J. Acous. Soc. Am. 19, 664- . -
677 (1947).
13) F. Seitz, "On the theory of the bubble chamber", Phys. Fluids 1,S2-13 (1958).
94
• " - ".
" ' " .. . " " '" " " " " ." . , . .. _ ,- . .- x - - '- - . '- ' - . '' .- ... . . . . . . . . .. t .. . . .. . . . . , " " -

J
95
14) D. Lieberman, "Radiation-induced cavitation", Phys. Fluids 2,466-468 (1959).
15) F. Fox and K. Kerzfeld, "Gas bubbles with organic skin ascavitation nuclei", J. Acoust. Soc. Am. 26, 984-989(1954).
16) 11. Strasberg, "Onset of ultrasonic cavitation in tap water", J.Acoust. Soc. Am. 31, 163-176 (1959).
17) W. Connolly and F. Fox, "Ultrasonic cavitation thresholds inwater", J. Acoust. Soc. Am. 26, 843-848 (1954).
18) W. Galloway, "An experimental study of acoustically inducedcavitation in liquids", J. Acoust. Soc. Am. 26, 849-857(1954).
19) D. Sette and F. Wanderlingh, "Nucleation by cosmic rays inultrasonic cavitation", Phys. Rev. 125, 409-417 (1962).
20) V. Akulichev, "Hydration of ions and the cavitation resistance ofwater", Sov. Phys. Acoust. 12, 144-149 (1966).
21) M. Greenspan and C. Tbchiegg, "Radiation-induccd acousticcavitation; apparatus and some results", J. Res. Nat. Bur. PStds. 71C, 299-312 (1967).
22) R. Apfel, "The role of impurities in cavitation-thresholddetermination", J. Acoust. Soc. Am. 48, 1179-1186 (1970).
23) R. Apfel, "Vapor nucleation at a liquid-liquid interface", J.Chem Phys. 54, 62-63 (1971).
24) L. Crum, "Tensile strength of water", Nature 278, 148-149(1979).
25) R. Winterton, "Nucleation of boiling and cavitation", J. Phys.D: Appl. Phys. 10, 2041-2056 (1977).
26) D. Yount, "Skins of varying permeability: A stabilizationmechanism for gas cavitation nuclei", J. Acoust. Soc. Am.,65, 1429-1439 (1979).
27) M. Sirotyuk, "Stabilization of gas bubbles in w;,ter", Soy. Phys.Acoust. 16, 237-240, (1970).
28) D. Yount, "On the evolution, generation, and regeneration of gascavitation nuclei", J. Acoust. Soc. Am. 71, 1473-1481(1982).
-S -_

S
96
29) J. W. Gibbs, The Scientific Papers of J. W. Gibbs Vol. 1, 237(Dover, New York, 19U1).
30) P. Epstein and M. Plesset, "On the stability of gas bubbles inliquid-gas solutions", J. Chem. 1hys. 18, 1505-1509
*(lg50). S
31) T. Alty, "The cataphoresis of gas bubbles in water", Proc. Roy.Soc. A.106, 315-340 (1924).
32) T. Alty, "The origin of electrical charge on small particles inwater", Proc. Roy. Soc. A.112, 235-251 (1926). S
33) K. F. Herzfeld, Comment, Proc. First Sympos. Naval Hydrodynamics,ed. F.S. Sherman, 319-320 (095 7 ).
34) L. A. Crum, "Nucleation and stabilization of microbubbles inliquids", Appl. Sci. Res. 38, 101-115 (1982).
35) R. E. Apfel, "Acoustic cavitation prediction", J. Acoust. Soc.Am. 69, 1624-1633 (1981).
36) H. G. Glynn, "Physics of acuubtic cavitat!oo in liquids", -..Physical Acoustics, ed. W. P. Mason, 1B, 57-172 (Academic,New York, 1964).
37) F. G. Blake, "The onset of cavitation in liquids. I", Tech. MemoNo. 12 Harvard Acoustics Research Laboratory (1949).
38) A. Prosperetti, "Bubble phenomena in sound fields", To be publishedin Ultro.'-ics.
39) R. E. Apfel, "Acoustic Cavitation", in Ultrasonics, Methods ofExperimental Physics 19, ed. P. Edmonds, (Academic, New York,1981).
40) D. Bergeman and F. Van Voorst Vader, "Effect of surfactants oncontact angles of nonpolar aolids", J. Colloid and InterfaceSci. 42, 467-472 (1973).
41) E. W. Washburn , ed., International Critical Tables Vol. III, 257(McGraw-Hill, New York, 1928).
42) R. C. Weast, ed., Handbook of Chemistry and Physics 56-h Edition,page F-43 (CRC Press, Cleveland, 1975)
43) D. Eisenberg and W. Kauzmann, The Structure and Properties ofWater. 61-b2 (Oxford, Oxford, 1969).
S
97
44) D. E. Yount, E. W. Gillary, and D. C. Roffman, "Microscopic stuayof bubble formation nuclei", in Underwater Physiology VIII:Proceedings of the Eighth Sywpaslum on Underwater Physiology
(to be published).
45) R. A. Roy, A. A. Atchley, L. A. Crum, J. B. Fowlkes, and J. R.Reidy, "A precise technique for the measurement of acoustic
cavitation thresholds and some preliminary results", accepted
for publication in J. Acouit. Soc. Am.
46) C. Seghal, R. G. Sutherland, and R. E. Verrall, "Optical spectra of .
sonoluminescence from transient and stable cavitation in water S
saturated with various gases", J. Chem. Phys. 84. 388-395(1980).
MIEN
.1 p
K. o "
S.
.......................----S*..... .. .2
* -- * m rr- -.-. ." '-
Appendix
Experimental Determination of the Variation of the AcousticCavitation Threshold as a Function of Dissolved Ion Concentration 6
A-] Introduction
In this appendix the experimental aspects of the measurement of the "
acoustic cavitation threshold of water as a function of the dissolved
ion concentration of the water will be discussed0 This discussion will
be pres2nted in four parts: the purpose of the experiment, the
experimental apparatus, the experimental procedure, and the results of
the experiment. The conclusions drawn from the expt iment were
presented in section 4-2.
A-2 Purpose of the Experiment
One purpose of the experiment was to attempt to verify the results
20of Akulichev's experiment since his results are the only strong
evidence for the existence of an ionically stabilized nucleus. In
addition, our apparatus made it possible to extend the range of his
measurements to lower ion concentrations. This range of concentrations
(below I mmol/!) had not previously been investigated, and yet, the
behavior of the threshold at low concentrations is a strong test of the
ionic skin hypothesis.
A-3 Experimental Apparatus
The apparatus used ir making these measurements was developed over S
.9

99
B a period of several years by our research group. It is designed to be
versatile so that it can be used to make threshold measurements for a
wide range of fluid conditions. Since the system is described in some
A 45a detail elsewhere, only a brief description will be given here. -
The apparatus is composed of two major groups: the sample
preparation system and the data acquisition system. The sample
preparation system is shown schematically in figure 20a. A typical
sample preparation takes place as follows. Prefiltcred distilled water
is introduced into the reservoir. The water is pumped from the
reservoir and may be passed through either the organic removal column or P
the ionic removal column, or both. The organic removal column is a
Barnstead Organic Removal Cartridge (part number D8904) and lowers the
0 concentration of long chain organic molecules to less than one part per
million. The Ionic removal column is a Barnetead Ultrapure Cartridge
(part number D8902) and produces water with a conductivity of less than
one micromnho and a pH of between 6.8 and 7.2. The specific conductance
of the water is measured with a Cole Parmer conductivity meter (model
number R-1491-20). The resolution of the meter is 0.1 micromho and the
accuracy is 0.2 micromho. The water then passes through an in-line
teflon filter to remove solid contaminants. The filter size can be
chosen to suit the requirements of the experiment. After the filter, .
the water circulates through a spherical quartz flask in which the
acoustic field is produced, and then back to the reservoir. Except when
passing through the organic and ionic removal coluwns, the water is in
contact with either teflon, glass or quartz. In this way, the
A.. "
. . . . . . . . . . . . . . . . . . . . . . . .. . . . . . . . . . . -.. "%

1 00
200
U2
w LLI
LU 0
U-
41
.-C z 4
z >:t
< 0
Q X -0I
Cc LL) 0 Z
0 AX u L0
Z. u I-f
0o W (J 0
uij
(. S.
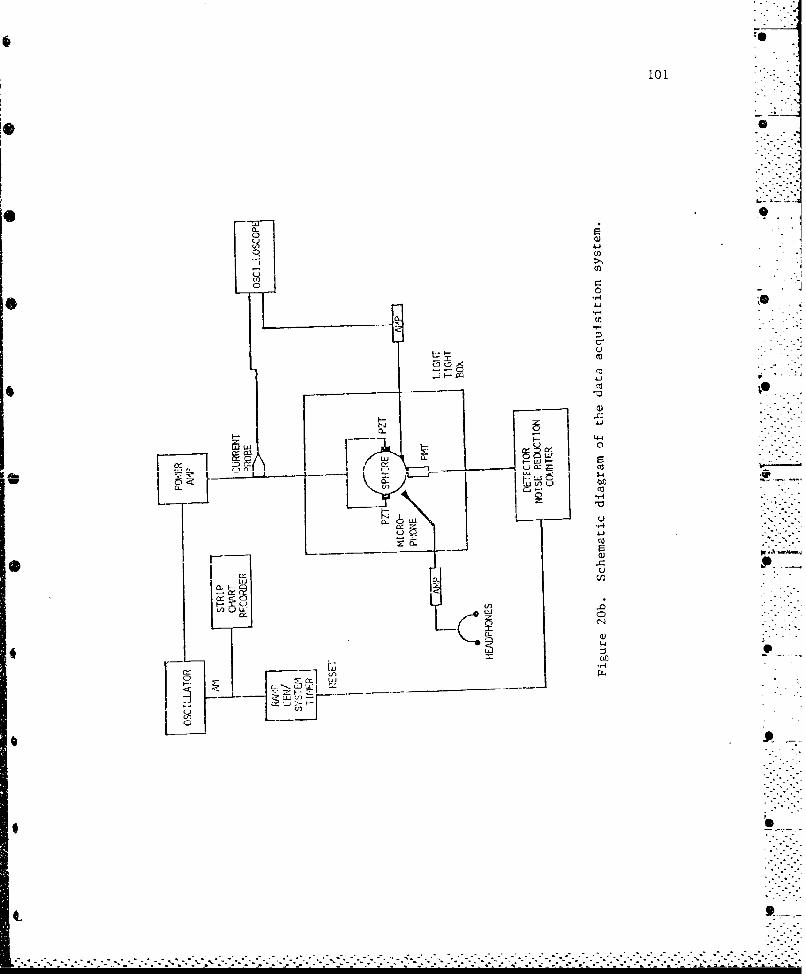
101
CLi0..0c X
-jj
(-a
L;JJ

102
possibility of contamination of the sample is reduced. The capacity of
the system is about two liters.--
The gas content of the system is controlled in the following
manner. The glass reservoir is evacuated to a specified pressure. A .
gas (usually argon) is bubbled through the liquid in the reservoir as
the liquid is circulated. The agitation, so produced, aids in both
removing the dissolved air and saturating the liquid with the gas at the
specified pressure. Before entering the reservoir, the gas is passed
through a filter to prevent the introduction of solid contaminants.
The quartz flask is enclosed in a light tight box which contains -
two large liquid heat sinks. The heat sinks are maintained at a
constant temperature to aid in controlling the temperature of the sample
during the data acquisition phase. Also, the reservoir is surrounded by -.
a cooling jacket which is used to adjust the temperature of the sample.
The temperatures of the sample and the heat sinks are monitored with
thermistors. .
The data acquisition system is depicted schematically in figure
20b. The acoustic field is generated by two cylindrical PZT transducers -
cemented onto the sides of the quartz flask. They are driven by the
amplified signal of the oscillator In a reFonant mode near 60 kHz. The
resonance frequency is determined by monitoring the output of a pill
tre isducer (which is also cemented on the side of the flask) on an 71 ,
oscilloscope. The amplitude of the driving signal is modulated by a Jramp voltage, the value of which is displayed on a strip chart
recorder. A current probe monitors the transducer current and the
- . •
S.t .-. - . - .

----- 4103.-i•
output is displayed on an oscilloscope.
The driving amplitude is increased until a cavitation event is
detected. Two methods of detection were employed. The first is audio .
detection. Vaporous cavitation events are almost always associated with
a loud audible "click" that Is produced by a collapsing cavity. Thus,
cavitation can be detected by the operator who monitors the system
through a headphone set. A second type of detection scheme relies upon
the production of sonoluminescence. Sonoluminescence is an emission of
light associated with cavitation events in liquids. Its origin is not _
clearly understood, but recent experimental evidence indicates that it
is associated with the deexcitation and radiative recombination of46
chemical species formed during the collapse ot a bubble. This
emission is detected with a photomultiplier tube mounted underneath the
flask. The photomultiplier signal is processed by a noise reduction
system to reduce the occurrence of false triggers. When the detector
senses that sonoluminescence has been produced, it resets the ramp
voltage and the system is quiescent for a predetermined time before the
ramping phase is reinItiated. During the quiescent period the sound
field in the flask is generally attenuated by 60 dB below the level
associated with a ramp voltage of zero. The ramping/quiescent cycle is
repeated until the desired number of data points are taken.
A-4 Experimental Procedure
The discussion to follow is a step-by-step description of the
procedure used to acquire a typical set of data. An effort was made to
.- °C=

104
follow the same procedure as closely as possible for each set of data.
This discussion will be divided into two sections: one for the sample
preparation and the other for data acquisition.
A-4.1 Procedure for Sample Preparation
The water used for these measurements was acquired from a bulk
source of distilled water and stored in a 25 liter plastic bottle. In
an effort to eliminate the effect of any variation of the properties of
the distilled water obtained from this source at different times, the
measurements for a given Ionic compound were all made with water P
obtained at the same time. The water used for measurement of the
cavitation threshold at a given concentration was all drawn from the
storage bottle at the same time, and after being prefiltered through a
teflon filter, was stored in indiiidual i liter teflon PFA bottles. The
pore size of the filter was chosen to be the same as that of the in-line
filter.
The ionic concentration of a sa.,ple was adjusted by adding a
specified volume of a 0.40 molar stock aqueous solution of the compound.
The stock solution was made by adding a known amount of the compound
(laboratory grade) to one liter of filtered distilled water having a
specific conductance of less than one micromho/cm. The concentration of
the stock solution was calculated from the measured value of the
specific conductance. The conversion was made according to the
relationship
C. 1 0 (Al)
................................................... -"""" " " ""

105
IIwhere C is the ionic concentration in moles/l, A is the molar
conductance in mho cm mol-, and K is the specific conductance i.n
niho/cm. Small amounts of the compound were added , if necessary, to* p
bring the concentration of the stock solution to 0.40 molar. The stock
solution was kept in a sealed glass flask and stored in a closed cabinet
when not needed. A teflon coated magnetic stirring bar was kept in the
solution so the solution could be mixed immediately before being
introduced into the sample. The preparation of the sample will now be
discussed.
Assume that the sample preparation system contains a previously
used sample. The old sample is pumped out of the system. After as much
of the lmnliq I a possible has been pumped out of the system, the systemiM
is pressurized with argon. This pressurization forces out any remaining
liquid except for the portion Lontained within the quartz flask (about
0.75 liters). After the system has been flushed, about 1.75 liters of
prefiltered distilled water is introduced into the system. This water
is circulated for about 15 minutes, after which time the system is
flushed once again. Then, one liter of prefiltered distilled water is
put into the system. This water along with that remaining in the flask
is the water used for the next data run.
Circulation is started and the water is routed through the organic
and ionic removal columns. The deionization process is continued for
thirty minutes at which time the water is routed so as to bypass the
columns. (However, whenever the water is circulating, it passes through
N - - ." * . . . - - -

106
the in-line filter.) Three small samples of the deionized water (about p
5 ml each) are removed from the system. The coaductance of these
samples is measured and must be less than 1.5 micromho/cm in order for
the preparation phase to progress farther. In every instance the p
samples always met this requirement after thirty minutes of
deionization. In most cases the 6verage specific conductance was less
than 1.0 micromho/cm. At this point the stock sulution is added. In
order to keep the system volume approximately constant for all
measurements, an additional amount of water equal to the volume of
solution to be added was removed from the system. The solution Is then
introduced. Throughout this process the water has been continuously
circulated.
After the solution has been introduced, the degassing phase begins.
The absolute pressure during degassing was maintained at 0.30 bar, and
therefore, the dissolved gas pressure of argon In the water was 0.30
bar. As described in reference 45, the system has been calibrated
against actual measurements of gas content made with a Van Slyke
apparatus. The degassing/argon saturation phase is accompanied by a
temperature control phase. At the end of the degassing phase, the
temperature of the sample is about 23.15 C. Circulation is stopped and
the system is returned to atmospheric pressure. Three more samplss are
drawn for the purpose of determining the dissolved ion concentration and
surface tension of the sample. The system is allowed to rest for one
hour. This rest period accomplishes two things. It allows any large
bubbles produced by the circulation and agitation to dissolve, or
-.-. ~ . . . . . .. . . . . . . .......... o
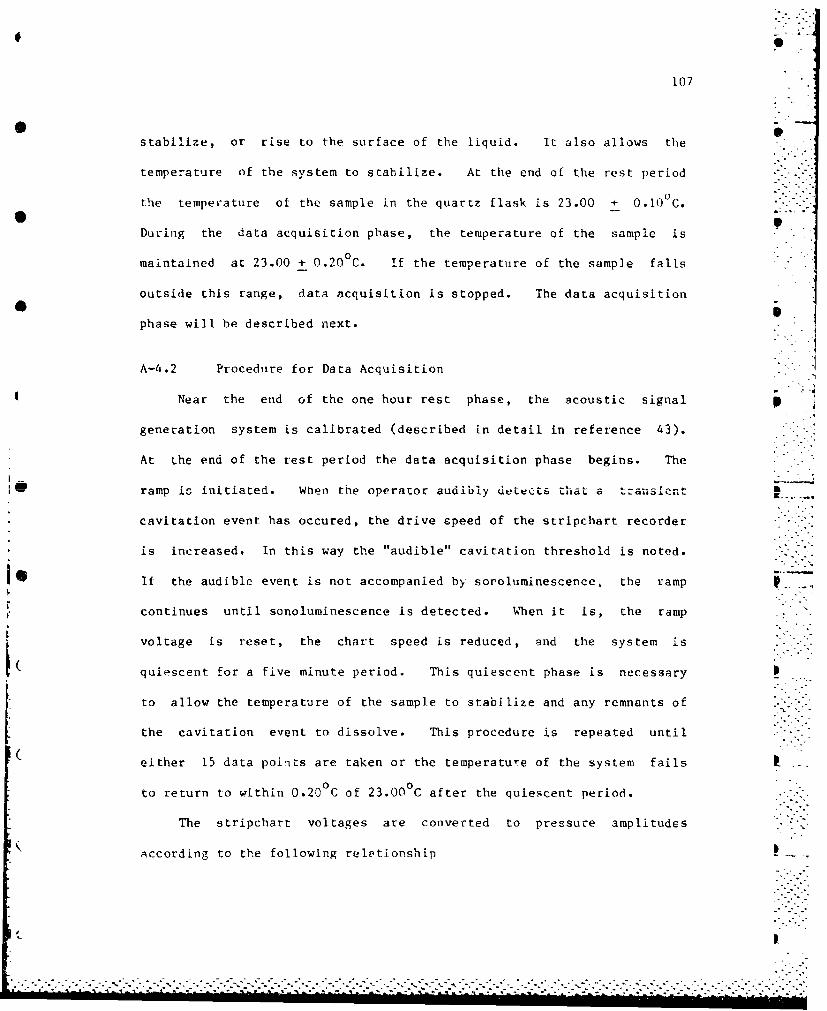
107
stabilize, or rise to the surface of the liquid. It also allows the
temperature of the system to stabilize. At the end of the rest period
the temperature of the sample in the quartz flask is 23.00 + 0.10C,.
During the data acquisition phase, the temperature of the sample is
maintained at 23.00 + 0.20°C. If the temperature of the sample falls
outside this range, data acquisition is stopped. The data acquisition
phase will be described next.
A-4.2 Procedure for Data Acquisition
Near the end of the one hour rest phase, the acoustic signal p
generation system is calibrated (described in detail in reference 43).
At the end of the rest period the data acquisition phase begins. The
1W ramp io initiated. When the operator audibly detecLs that a t ..rs.. - -.
cavitation event has occured, the drive speed of the stripchart recorder
is increased, In this way the "audible" cavitation threshold is noted.
I. If the audible event is not accompanied by soroluminescence, the ramp
continues until sonoluminescence is detected. When it is, the ramp
voltage is reset, the chart speed is reduced, and the system is
quiescent for a five minute period. This quiescent phase is necessary
to allow the temperature of the sample to stabilize and any remnants of
"the cavitation event to dissolve. This procedure is repeated until
either 15 data points are taken or the temperature of the system fails
to return to within 0.20°C of 23.000 C after the quiescent period.
The stripchart voltages are converted to pressure amplitudes
according to the following relotionship
. .. -
108
P A 0.91 + 2.87 V bar (A2) -
where V Is the stripchart voltage corresponding to the cavitations
event. (The origin of this relationship is described in reference 43.)
Using this relationship two cavitation thresholds are obtained: an
audible threshold and a sonoluminescence thr-eshold. The results of
these measurements are presented in the following section.
A-5 Results of the Experiment
Six different compounds were used for the measurements: NaF, NaCl,
Nal, KCi, X1, and KOH. The audible threshold as a function of
concentration for KI and Nal were presented in figures 18a and 18b. The
data were normalized to the threshold at the lowest concentration to
facilitate comparison among various data sets. The value of the
threshold at the lowest ccncentration is typically about 4.5 - 1 bar;
such variations are, unfortunately, typical in cavitation threshold
measurements. The normalization is justifiable since it is the .
variation in the threshold that is sought and not the absolute value.
The error bars in figures 18a and 18b represent plus-or-minus one
standard deviation. S
The lowest value of the concentration was determined in the
following manner. The sample was prepared in the usual way except that
no ionic solution was introduced. That is, the threshold of the
deionized water was measured. The deionized water had a non-zero-.
specific conductance, typically about I micromho/cm. In order to assign
a concentration to this deionized sample, it was assumed that the non-
?::7i):
109
zero conductance was due to the presence of whatever compound was under
investigation at that time. This is probably not a valid assumption,
but a better method was not apparent. Therefore, the values of the
lowest concentrations are to be considered as upper limit- The actual
concentration of the specific compound under investigation is probably
much less than the assigned value.
As stated above our apparatus made it possible to measure both an
audible and sonoluminescence threshold. In figure 21a, both the audible
and sonoluminescence threshold are plotted as a function of ion
concentration. In evexy Instance, the audible threshold is lower than
the sonolumlnescence threshold. This trend was present In all six
cumpouxids tested. However, the variation with ion concentration was the
same for each threshold as shown in figure 21b. That is, when the
thresholds are normalized the difference between them is negligible.
This trend was also apparent In all six compounds. From this dicussion
it may be concluded that for measurements of the variation of the
transient cavitation threshold, either of the thresholds are applicable.
Emphasis has been placed on the words "variation" and "transient". The
absolute threshold does not appear to be the same for both cases.
46Measurements made with single photon counters indicate that a clear- Icut threshold for sonolumineseence emission from stable (gaseous)
cavities may not exist. That is, pulsating gas-filled bubbles may emit
light even when the pressure amplitude of the applied acoustic field is
extremely small. However, when transient cavitation occurs, usually, no
, - . : .. ~ ~.. .... . . .: . . .. . - --.-...-.- :- - .-.- ....- '...
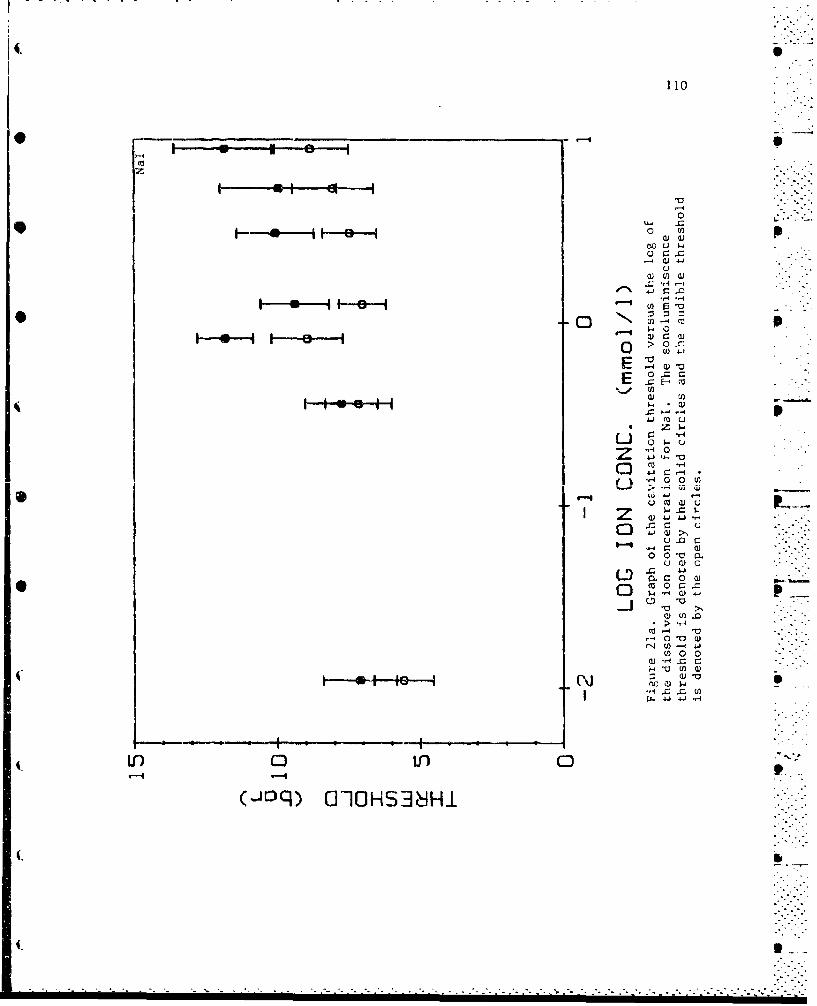
110
u . . . , .
-. 0
I -r4
S~ u -L
~C 0 S ,'.-.
, r -
0 04Z
m 0 F_-:." -
- 4 -- 4 1
C.) .
.r. *-4
,•
EJ 4
.~~ ~ ~ . .. . .
.Z ,-4
4-J Q .. .:.
'.- o,'.:4_C1. 0)S 0 4o4 .=
o 0S,-40 0) .'.
(-"I 00)0W....cscO w - ""-
0 - H0 0. ".-'--.-
I . 0 (4 .0r
U'..-00L't0 0.
0) '-4 .• 0
r-4 .0o° U
'-4-. '-'-S. . ... . . . . .. . . . . . ..(, . . ,. . . . . .. . . . - .- , -. . .. . ..O. -H.. - ,. . .- , .. , ,-I

-L C C)
0 r
E
4.j.
00
E J 1h-- -H
U) m
3 -4 a)J 10
000

<V~~ . .. .------------.-.-..
112
one does exist for transient cavitation. The conclusions drawn from.
this experiment are discussed in chapter 4.
I..p
* p.
-". - .,
C Pb ..
.......................................................--..--'-

BIOGRAPHICAL SKETCH OF THE AUTHOR
Anthony Armstrong Atchley was born in Lebanon, Tennessee on June 23,
1957, the son of Mr. and Mrs. Kenneth L. Atchley. He attended Castle
Heights Military Academy, graduating in May, 1975. He received a B.A. -
lopin physics from the University of the South in May, 1979. He continued
his studies at the New Mexico Institute of Mining arid Technology,
receiving an M.S. in physics in May of 1982. .
Anthony is a member of Sigma P! Sigma, Phi Kappa Phi, The American
Physical Society, and The Acoustical Society of America. He was selected
as the Acoustical Society of America's F. V. Hurnt -E'low f or 19 5 He
enjoys racquetball, canoeing, photography and carpentry. He also very
much enjoys his teaching duties.
iHe plans to pursue a career in research and teaching and has accepted
a position at the Naval Postgraduate School in Monterey, California.
Anthony will take a leave of absence from the NPS to continue cavitation
research at Yale University as the Hunt Fellow.
His permanent address is box 851, Smyrna, Tennessee 37167.
113
Sii -
-----------------------------------------------------------------. -

January 1985
REPORTS DISTRIBUTION LIST FOR ONR PHYSICS DIVISION OFFICEUNCLASSIFIED CONTRACTS
Director 3 copiesDefense Advanced Research Projects AgencyAttn: Technical Library1400 Wilson Blvd.Arlington, VA 22209
Office of Naval Research 3 copiesPhysics Division Office (Code 412)800 North Quincy StreetArlington, VA 22217
Office of Naval Research 1 copyDirector, Technology (Code 200)800 North Quincy StreetArlington, VA 22217
Naval Research Laboratory 1 copyDepartment of the NavyAttn: Technical LibraryWashington, DC 20375
Office of the Director of Defense 1 copyw Research and Engineering .
Information Office Library BranchThe PentagonWashington, DC 20301
U. S. Army Research Office I copy "'"Box 1211 P .Research Triai.gle ParkNorth Carolina 27709
Defense Technical Information Center 12 copiesCemeron StationAlexandria, VA 22314
CommandJ.,g Officer 1 copyOffice of Naval Research Western Detachment Office1030 East Green StreetPasadena, CA 91101
A9Commanding Officer I copyOffice of Naval Research
Eastern/Central Detachment Office495 Suwmer StreetBoston, MA 02210
. • -" "

Naval Postgraduate School I copyTechnical Library (Code 0212)Monterey, CA 93940
Commanding Officer 1 copyNaval Ocean Research & Development Activity STechnical LibraryNSTL Station, Mississippi 39529
Naval Explosive Ordnance Disposal Facility 1 copyTechnical LibraryIndian Head, Maryland 20640 .
Naval Ship Research and Development Center 1 copyCentral Library (Code L42 and L43)Bethesda, Maryland 20084
* S
*m
& .
• "
• &.?
"t -"