Embed Size (px)
Citation preview
Lexington Park Development District Master Plan 1
2
i
ACKNOWLEGEMENTS
COMMISSIONERS OF ST MARY’S COUNTY
James R. Guy, President
Michael L. Hewitt
Tom Jarboe
Todd B. Morgan
John E. O’Connor
Planning Commission
James Howard Thompson, Chairman
Merl Evans
Shelby Guazzo
Susan McNeill
Patricia Robrecht
Martin Siebert
Harold Willard
Land Use and Growth Management Staff
Philip J. Shire Director William H. Hunt, Deputy Director Jeffrey Jackman, Senior Planner
Sue Veith, Planner IV Dave Chapman, Planner III
SPECIAL THANKS TO the citizens of St Mary’s County and of the Lexington Park Development District
and to officers and staff of Patuxent Naval Air Station
who provided input into the development of this plan.
ii
TABLE OF CONTENTS 1
2
1. Introduction _________________________________________ 1-1
1.1 Vision ____________________________________________ 1-2
1.2 Planning Context ___________________________________ 1-2
1.3 Development Priorities_______________________________ 1-4
1.4 Recommendations __________________________________ 1-7
2. Development Strategies ________________________________ 2-1
2.1 Downtown ________________________________________ 2-2
2.2 Circulation Improvements ____________________________ 2-6
2.3 Great Mills Road Corridor ____________________________ 2-14
2.4 FDR Boulevard Corridor _____________________________ 2-16
2.5 Jarboesville Focus Area _____________________________ 2-18
2.6 Land Use Designations ______________________________ 2-21
2.7 Zoning Recommendations to Implement to Plan _________ 2-23
3. Physical Setting and the Environment _____________________ 3-1
3.1 Background ________________________________________ 3-2
3.2 Resource Protection Issues Affecting Development ________ 3-4
4. Transportation and Circulation __________________________ 4-1
4.1 Background ________________________________________ 4-2
4.2 Roads and Streets ___________________________________ 4-3
4.3 Public Transportation (Transit System ___________________ 4-5
4.4 Sidewalks _________________________________________ 4-6
4.5 Bikeways __________________________________________ 4-6
4.6 Trails _____________________________________________ 4-7
4.7 Airport ___________________________________________ 4-7
4.8 Objectives, Policies and Priorities ______________________ 4-7
5.
Public Facilities ___________________________________________ 5-1
5.1 Public water and Sewerage facilities ____________________ 5-2
5.2 Public Education facilities ____________________________ 5-3
5.3 Library facilities ____________________________________ 5-3
5.4 Broadband infrastructure ____________________________ 5-4
5.5 Public Safety: Fire, Sheriff and Emergency Medical Services _ 5-5
5.7 Parks and Recreational facilities _______________________ 5-7
5.8 Trails _____________________________________________ 5-8
5.9 Historic and Cultural Sites ____________________________ 5-9
5.10 Solid Waste management ___________________________ 5-11
6. Economic Development ________________________________ 6-1
6.1 Introduction _______________________________________ 6-2
6.2 Economic Development Recommendations ______________ 6-4
7. Housing _____________________________________________ 7-1
7.1 Perspectives _______________________________________ 7-1
7.2 Housing Recommendations ___________________________ 7-5
8. Community Health and Wellness ________________________ 8-1
8.1 Impact of Community Design on Population Health ________ 8-2
8.2 Priority Health Needs ________________________________ 8-4
8.3 Community Health and Wellness Recommendations based on the Healthy St. Mary’s 2020 Plan _______________________ 8-5
9. Community Design ____________________________________ 9-9
9.1 Design Recommendations ____________________________ 9-9
9.2 Community Design Goals _____________________________ 9-9
9.3 Community Design Policies ___________________________ 9-2
PC Draft- August 2015 ii lexington park Development Distirct Master Plan
10. Appendices _________________________________________ 10-1
10.1 Background Metrics ________________________________ 10-1
10.2 Maryland’s Twelve Planning Visions ___________________ 10-7
10.3 Planned Bicycle Routes ______________________________ 10-8
10.4 Sustainable Communities ____________________________ 10-9
10.5 Planning History __________________________________ 10-10
10.6 Incentives _______________________________________ 10-18
10.7 Glossary ________________________________________ 10-27
11. Maps ______________________________________________ 11-1
Environmental Context Maps _____________________________ 11-1
Development Context Maps _____________________________ 11-13
Planning Context ______________________________________ 11-23
Implementation maps __________________________________ 11-27
PC Draft- August 2015 1-1 Lexington Park Development Distirct Master Plan
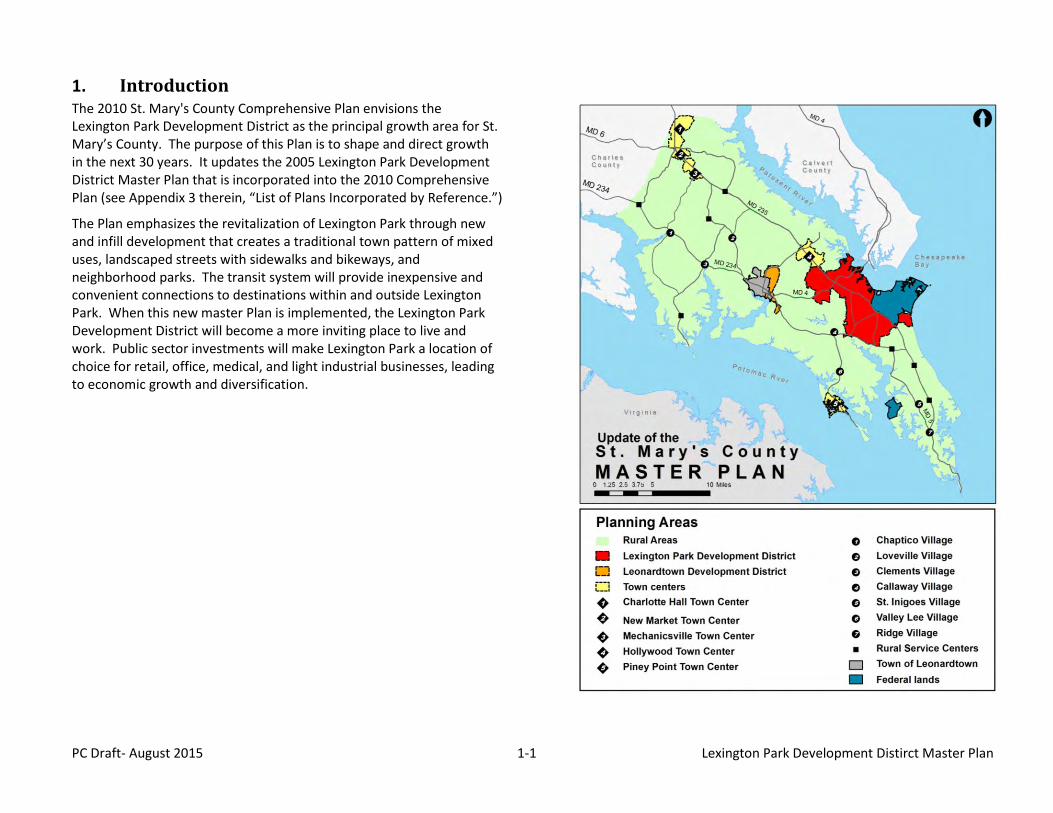
1. Introduction The 2010 St. Mary's County Comprehensive Plan envisions the Lexington Park Development District as the principal growth area for St. Mary’s County. The purpose of this Plan is to shape and direct growth in the next 30 years. It updates the 2005 Lexington Park Development District Master Plan that is incorporated into the 2010 Comprehensive Plan (see Appendix 3 therein, “List of Plans Incorporated by Reference.”)
The Plan emphasizes the revitalization of Lexington Park through new and infill development that creates a traditional town pattern of mixed uses, landscaped streets with sidewalks and bikeways, and neighborhood parks. The transit system will provide inexpensive and convenient connections to destinations within and outside Lexington Park. When this new master Plan is implemented, the Lexington Park Development District will become a more inviting place to live and work. Public sector investments will make Lexington Park a location of choice for retail, office, medical, and light industrial businesses, leading to economic growth and diversification.

PC Draft- August 2015 1-2 Lexington Park Development Distirct Master Plan
1.1 Vision
This Plan foresees:
1.1.1 Transforming the Downtown area of Lexington Park into a place with:
A distinct and recognizable character, consisting of town greens, A.gateways, landmarks and a concentration of community facilities, such as libraries, post offices, and schools,
Abundant and strategically located open spaces, B. A mix of governmental, retail, office, residential, entertainment, C.
cultural and recreational uses, Pedestrian and bicycle friendly streets and interconnected D.
greenways and trails, Safe and attractive transit-oriented, mixed-use development, E. Conveniently located social services, including senior care and F.
child care, Housing choices for people of all ages and incomes, G. A balanced transportation system. H.
1.1.2 Support for existing neighborhoods through:
On-going community revitalization, A. Construction and maintenance of local roads, water and B.
sewerage systems, parks and trails, Emphasis on overall community health through investment in C.
safe and walkable neighborhoods, and protection of open space.
1.2 Planning Context
1.2.1 Trends and Forecasts
The 2010 Census found that 35,582 people, or 33.8% of the county population, lived within the Lexington Park Development District. Based on Maryland Department of Planning projections, the population in the District is expected to grow by 31% from 2010 to 2020 to a population of 46,800 and by 69% from 2010 to 2030 to a population of 60,000. [Update in progress.]
As of 2010 there were 15,075 dwelling units in the Development District, of which 13,900 were occupied. By 2030 the Lexington Park Development District is projected to have between 24,800 and 26,000 dwelling units. [Update in progress.]
Between 2010 and 2030, employment is projected to grow by 14,700 jobs from 63,200 to 77,900 or by 23%, including professional and technical services, health care, construction, accommodations and food services, and other business and personal services. The combined job growth in these sectors comprises two-thirds of total projected employment growth in the Development District. [Update in progress.]
1.2.2 Planning History
A brief overview of the development and planning history of Lexington Park since 1945 is found in the Appendix.
1.2.3 Pertinent State and Federal Programs and Requirements
This Plan responds to state and federal initiatives to protect the environment and to ensure orderly growth.
1.2.4 Sustainable Growth and Agricultural Preservation Act of 2012
This Plan supports the purpose of the Act to direct growth to areas where public facilities are or will be available.
1.2.5 Watershed Implementation Plan
In accordance with the 1973 Clean Water Act, the U.S. Environmental Protection Agency mandated that Bay State jurisdictions, including St. Mary’s County, take action to meet Total Maximum Daily Load (TMDL) limits set by EPA for nitrogen, phosphorous and sediment entering the Chesapeake Bay. The Maryland Department of Environment (MDE) prepared a “watershed implementation plan”, or WIP, to meet these limits by reducing pollutant loads, and requires local jurisdictions, including SMC, to prepare strategies for meeting their respective limits. Maryland is also developing an Accounting for Growth (AFG) policy that will address the
PC Draft- August 2015 1-3 Lexington Park Development Distirct Master Plan
increase in the State’s pollution load from projected population growth and new development.
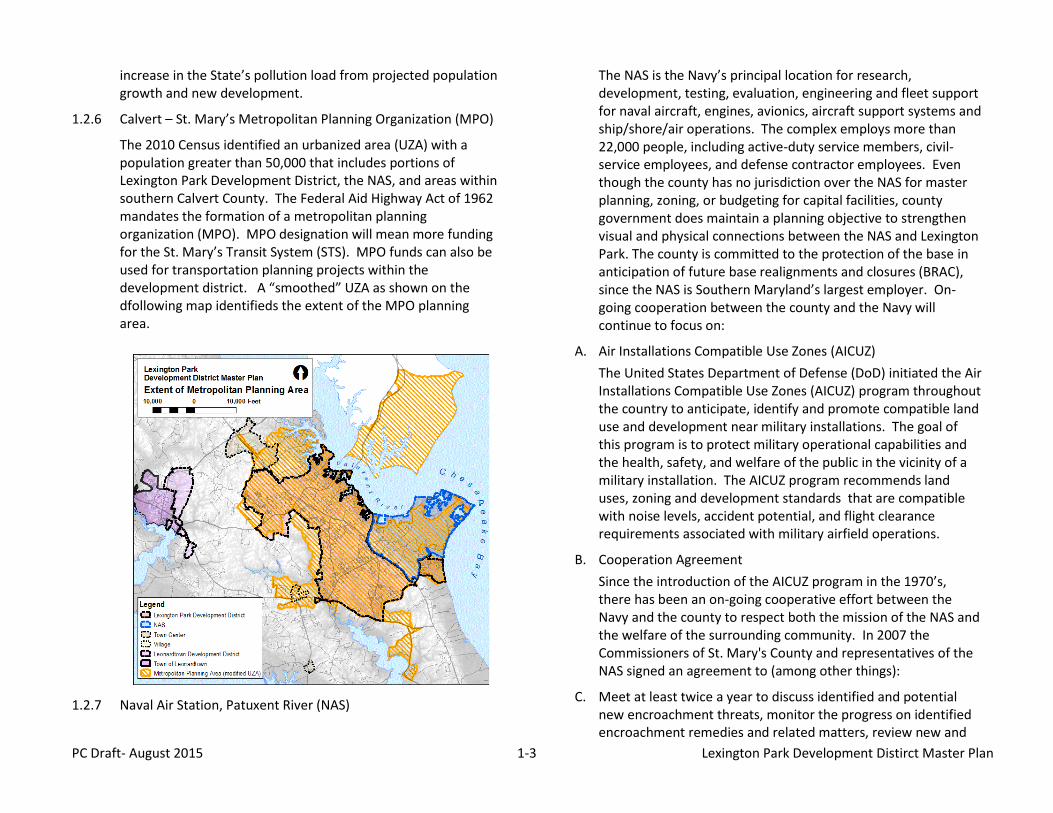
1.2.6 Calvert – St. Mary’s Metropolitan Planning Organization (MPO)
The 2010 Census identified an urbanized area (UZA) with a population greater than 50,000 that includes portions of Lexington Park Development District, the NAS, and areas within southern Calvert County. The Federal Aid Highway Act of 1962 mandates the formation of a metropolitan planning organization (MPO). MPO designation will mean more funding for the St. Mary’s Transit System (STS). MPO funds can also be used for transportation planning projects within the development district. A “smoothed” UZA as shown on the dfollowing map identifieds the extent of the MPO planning area.
1.2.7 Naval Air Station, Patuxent River (NAS)
The NAS is the Navy’s principal location for research, development, testing, evaluation, engineering and fleet support for naval aircraft, engines, avionics, aircraft support systems and ship/shore/air operations. The complex employs more than 22,000 people, including active-duty service members, civil-service employees, and defense contractor employees. Even though the county has no jurisdiction over the NAS for master planning, zoning, or budgeting for capital facilities, county government does maintain a planning objective to strengthen visual and physical connections between the NAS and Lexington Park. The county is committed to the protection of the base in anticipation of future base realignments and closures (BRAC), since the NAS is Southern Maryland’s largest employer. On-going cooperation between the county and the Navy will continue to focus on:
Air Installations Compatible Use Zones (AICUZ) A.
The United States Department of Defense (DoD) initiated the Air Installations Compatible Use Zones (AICUZ) program throughout the country to anticipate, identify and promote compatible land use and development near military installations. The goal of this program is to protect military operational capabilities and the health, safety, and welfare of the public in the vicinity of a military installation. The AICUZ program recommends land uses, zoning and development standards that are compatible with noise levels, accident potential, and flight clearance requirements associated with military airfield operations.
Cooperation Agreement B.
Since the introduction of the AICUZ program in the 1970’s, there has been an on-going cooperative effort between the Navy and the county to respect both the mission of the NAS and the welfare of the surrounding community. In 2007 the Commissioners of St. Mary's County and representatives of the NAS signed an agreement to (among other things):
Meet at least twice a year to discuss identified and potential C.new encroachment threats, monitor the progress on identified encroachment remedies and related matters, review new and
PC Draft- August 2015 1-4 Lexington Park Development Distirct Master Plan
proposed development in the AICUZ and nearby areas, discuss potential changes to the zoning ordinance, and initiate additional cooperative action needed to address encroachment;
Communicate through the technical evaluation committee on D.the review of proposed development;
Collaborate on communication efforts to inform the public E.about the nature of encroachment threats and local actions that can reduce or eliminate those threats; and
1.2.8 Enhanced Use Lease (EUL)
The Department of Defense is authorized to make underutilized, non-excess land and buildings available for lease to a public or private entity on a long-term basis. Property can be leased for cash or in exchange for in-kind services. The EUL under consideration at NAS would involve a 50 year lease with a developer in exchange for in-kind services consisting of the construction, operation, and maintenance of a 600,000 square foot work campus for 3,000 employees. In addition to office space, the proposed campus could accommodate research and development and light industrial activities that would support the Navy mission. [Provide link to the EUL on the LPDD webpage]
1.2.9 Joint Land Use Study (JLUS)
The NAS annually generates $6.6 billion for the economy and creates or supports 41,185 jobs, according to a 2010 Maryland Department of Business and Economic Development study entitled Measuring Economic Impact of Maryland’s Military Installations , making this installation vital not only to national security but also to the economic security of the State of Maryland. A JLUS is a common planning process that is conducted around military installations throughout the country to prevent urban encroachment, safeguard the military mission, and protect public health, safety, and welfare. The JLUS for the NAS was completed in January 2015 with participation by the affected jurisdictions, including St. Mary's County. It is sponsored by the Tri-County Council for Southern Maryland.
JLUS recommendations have been taken into consideration in this Plan.
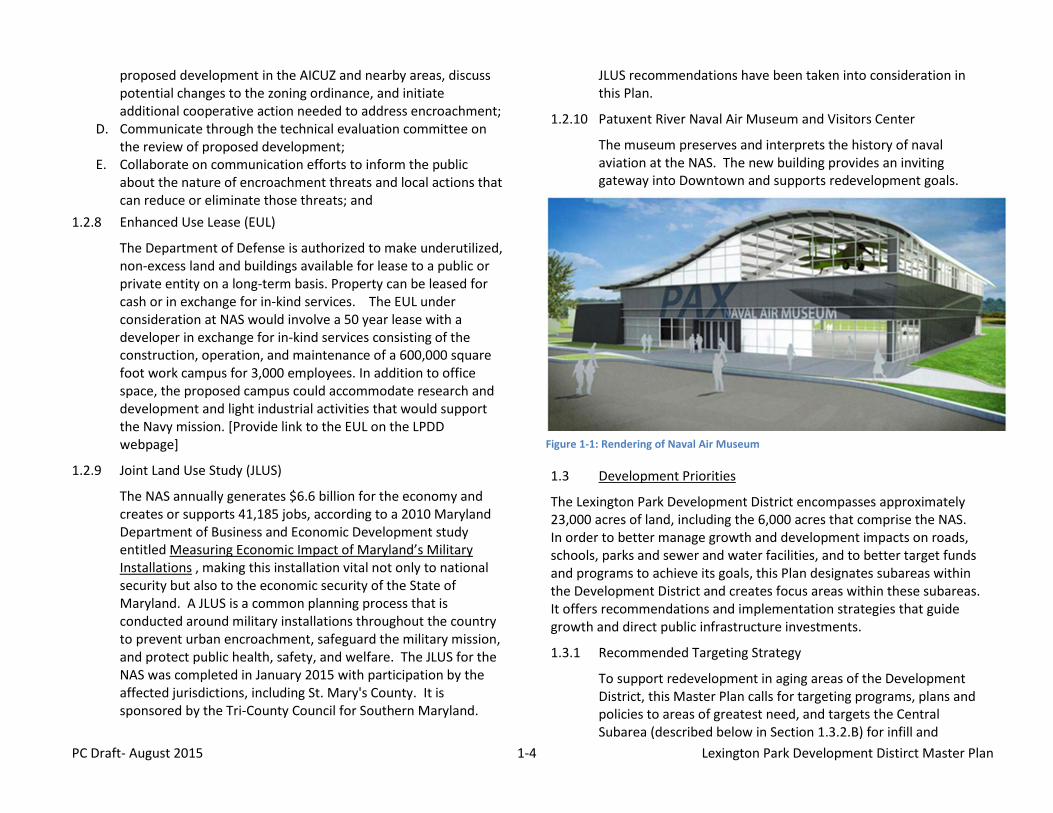
1.2.10 Patuxent River Naval Air Museum and Visitors Center
The museum preserves and interprets the history of naval aviation at the NAS. The new building provides an inviting gateway into Downtown and supports redevelopment goals.
1.3 Development Priorities
The Lexington Park Development District encompasses approximately 23,000 acres of land, including the 6,000 acres that comprise the NAS. In order to better manage growth and development impacts on roads, schools, parks and sewer and water facilities, and to better target funds and programs to achieve its goals, this Plan designates subareas within the Development District and creates focus areas within these subareas. It offers recommendations and implementation strategies that guide growth and direct public infrastructure investments.
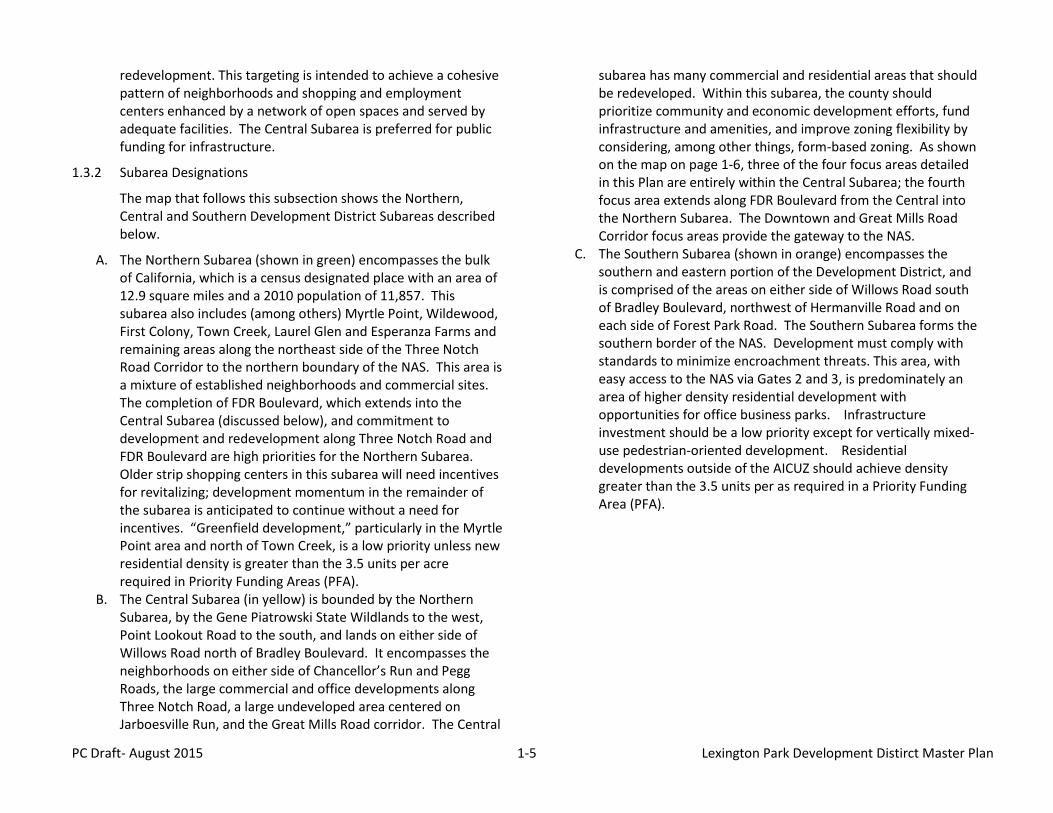
1.3.1 Recommended Targeting Strategy
To support redevelopment in aging areas of the Development District, this Master Plan calls for targeting programs, plans and policies to areas of greatest need, and targets the Central Subarea (described below in Section 1.3.2.B) for infill and
Figure 1-1: Rendering of Naval Air Museum
PC Draft- August 2015 1-5 Lexington Park Development Distirct Master Plan
redevelopment. This targeting is intended to achieve a cohesive pattern of neighborhoods and shopping and employment centers enhanced by a network of open spaces and served by adequate facilities. The Central Subarea is preferred for public funding for infrastructure.
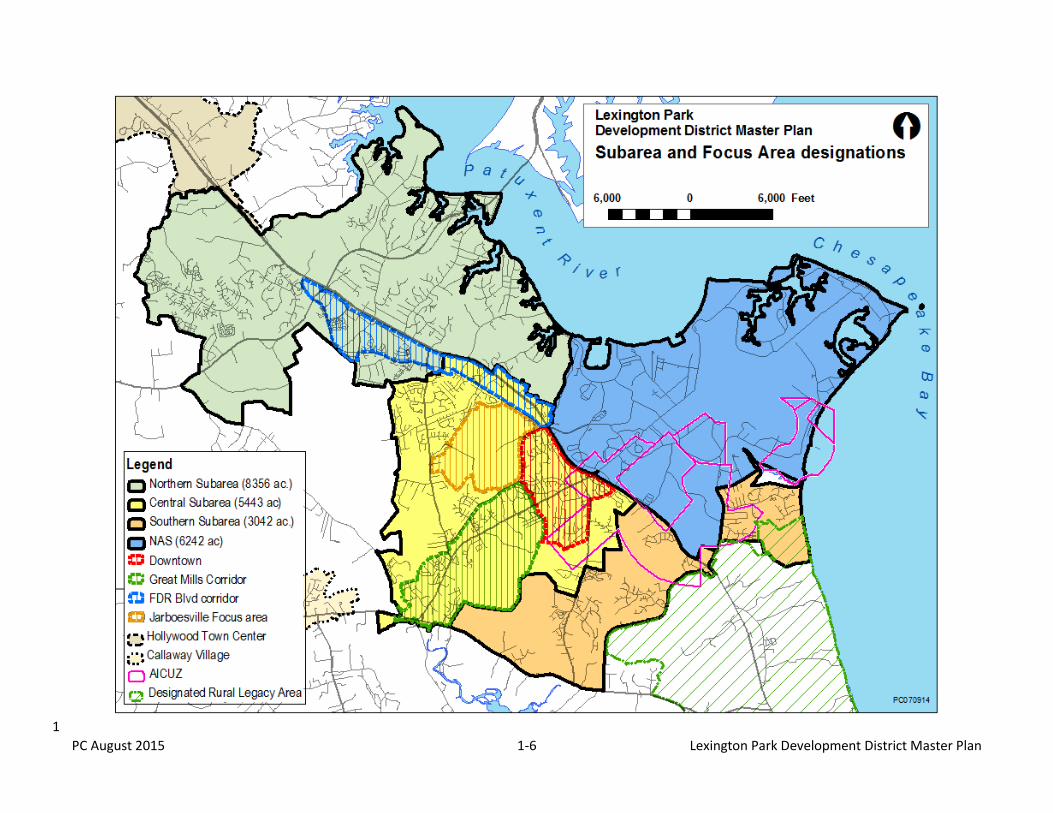
1.3.2 Subarea Designations
The map that follows this subsection shows the Northern, Central and Southern Development District Subareas described below.
The Northern Subarea (shown in green) encompasses the bulk A.of California, which is a census designated place with an area of 12.9 square miles and a 2010 population of 11,857. This subarea also includes (among others) Myrtle Point, Wildewood, First Colony, Town Creek, Laurel Glen and Esperanza Farms and remaining areas along the northeast side of the Three Notch Road Corridor to the northern boundary of the NAS. This area is a mixture of established neighborhoods and commercial sites. The completion of FDR Boulevard, which extends into the Central Subarea (discussed below), and commitment to development and redevelopment along Three Notch Road and FDR Boulevard are high priorities for the Northern Subarea. Older strip shopping centers in this subarea will need incentives for revitalizing; development momentum in the remainder of the subarea is anticipated to continue without a need for incentives. “Greenfield development,” particularly in the Myrtle Point area and north of Town Creek, is a low priority unless new residential density is greater than the 3.5 units per acre required in Priority Funding Areas (PFA).
The Central Subarea (in yellow) is bounded by the Northern B.Subarea, by the Gene Piatrowski State Wildlands to the west, Point Lookout Road to the south, and lands on either side of Willows Road north of Bradley Boulevard. It encompasses the neighborhoods on either side of Chancellor’s Run and Pegg Roads, the large commercial and office developments along Three Notch Road, a large undeveloped area centered on Jarboesville Run, and the Great Mills Road corridor. The Central
subarea has many commercial and residential areas that should be redeveloped. Within this subarea, the county should prioritize community and economic development efforts, fund infrastructure and amenities, and improve zoning flexibility by considering, among other things, form-based zoning. As shown on the map on page 1-6, three of the four focus areas detailed in this Plan are entirely within the Central Subarea; the fourth focus area extends along FDR Boulevard from the Central into the Northern Subarea. The Downtown and Great Mills Road Corridor focus areas provide the gateway to the NAS.
The Southern Subarea (shown in orange) encompasses the C.southern and eastern portion of the Development District, and is comprised of the areas on either side of Willows Road south of Bradley Boulevard, northwest of Hermanville Road and on each side of Forest Park Road. The Southern Subarea forms the southern border of the NAS. Development must comply with standards to minimize encroachment threats. This area, with easy access to the NAS via Gates 2 and 3, is predominately an area of higher density residential development with opportunities for office business parks. Infrastructure investment should be a low priority except for vertically mixed-use pedestrian-oriented development. Residential developments outside of the AICUZ should achieve density greater than the 3.5 units per as required in a Priority Funding Area (PFA).
PC August 2015 1-6 Lexington Park Development District Master Plan
1
Figure 1-2: sub area and focus area map
Figure 1-3: sub area and focus area map
PC August 2015 1-7 Lexington Park Development District Master Plan
1.4 Recommendations 1
The Plan includes maps and descriptions for land uses and community 2 character to be achieved over the next 20 to 30 years. In Chapter 2 the 3 Plan provides recommendations for the overall Development District, 4 the Downtown, the Great Mills Road and FDR Boulevard Corridors, and 5 for the Jarboesville Run Focus Area. Recommendations include: 6
1.4.1 Provide a mix of governmental, cultural, residential, office, 7 retail, entertainment, and recreational uses throughout the 8 Development District. 9
Improve the civic nature of the Development District and A.10 reinforce a sense of place and ownership for those who live, 11 work, and play in the community. 12
Promote viable new residential development in and near B.13 Downtown outside of the AICUZ. 14
Within six months of adoption of this Plan, amend the zoning C.15 code and adopt design guidelines to allow clusters of light 16 industrial, offices and flex space, technology businesses, 17 specialized contractors and suppliers. 18
Recruit businesses for a productive retail corridor that meets D.19 the needs of the community, and that captures a sizeable share 20 of the increasing regional demand for retail goods and services. 21
Redevelop automobile-oriented and strip commercial E.22 properties to achieve more pedestrian-oriented shopping and 23 service areas. 24
1.4.2 Promote job growth, economic diversification and increased 25 attention to and management of the health and service needs 26 of the community. 27
Participate in programs and provide incentives to attract new A.28 businesses and spur redevelopment (see Chapter 6). 29
Update market studies and implement recommendations for B.30 recruitment and diversification. 31
Promote the designated Health Enterprise Zone to improve C.32 commercial opportunities and job growth. 33
Within a year of adoption of this Plan, complete and adopt a D.34 strategy and program to expand heritage tourism and create an 35 arts and entertainment district. 36
1.4.3 Improve perceived and actual safety in Lexington Park. 37
Promote the elements of “Crime Prevention through A.38 Environmental Design” (CPTED)1 in the design of the built 39 environment to reduce crime (see Section 5.6). 40
Provide “Complete Streets2” to improve pedestrian, bicycle, B.41 driver and passenger safety (see Chapters 4 and 8). 42
Increase police presence; establish a sheriff’s station on Great C.43 Mills Road (see section 5.6). 44
1.4.4 Maintain cooperation with the Navy. 45
Continue coordination with the Navy to protect the Air A.46 Installation Compatible Use Zone (AICUZ3) for both accident 47 potential zones (APZ) and noise zones pursuant to the latest 48 studies. 49
1 CPTED includes recommendations for both the design of development and for
the operational aspects of the built environment. Elements of CPTED taken into account in development design and the development assessment process include casual surveillance opportunities and sightlines, land use mix and activity generators; exterior building design; lighting; way finding; predictable routes and entrapment locations. 2 Complete Streets are roadways designed to safely and comfortably
accommodate all users, including, but not limited to motorists, bicyclists, pedestrians, transit and school bus riders, delivery and service personnel, freight haulers, and emergency responders. "All users" includes people of all ages and abilities 3 Plan provisions for the AICUZ include clarifying the uses and structures
allowed, the standards for those uses including use intensity in terms of persons per acre, noise attenuation standards, while accommodating continued use of existing nonconforming structures. Nonconforming uses are anticipated to be allowed to continue in accordance with existing nonconforming use regulations
PC August 2015 1-8 Lexington Park Development District Master Plan
Increase public amenity open space within the AICUZ. B.1 Support Department of Defense efforts to preserve land and C.2
habitat buffers around the NAS by way of the Readiness and 3 Environmental Protection Initiative (REPI). 4
Work with the Navy to establish criteria addressing D.5 compatibility with changes in operations at the NAS. 6
1.4.5 Within six months of adoption of this Plan, revise the Compre-7 hensive Zoning Ordinance to fully achieve the vision and 8 objectives hereof. 9
Develop and adopt ordinance criteria for new and replacement A.10 mixed-use zones recommended by the plan. 11
Adopt regulations that: B.12
i. Identify uses and use intensities that are not compatible for 13 location within the AICUZ overlay, and 14
ii. Set clear parameters for the continued presence of 15 incompatible uses and structures within the AICUZ overlay. 16
Revise zoning maps. C.17
1.4.6 Within 12 months of adoption of the Plan, revise, supplement 18 or develop new ordinances necessary to achieve the physical 19 characteristics of development envisioned for the Development 20 District including but not limited to: 21
Comprehensive Zoning Ordinance Article 6 Development A.22 Standards and Approvals 23
Subdivision Ordinance B.24 Road Ordinance C.25 Comprehensive Water and Sewerage Plan D.26 Prefer expansion of public water and sewer services within the E.27
Central Subarea. Services may be considered within the balance 28 of the Development District for: 29
i. Economic development projects or to complete projects 30 that have final approved plans, and 31
ii. Restricted access lines to correct failing systems. 32
Design Ordinance for the LPDD, and F.33 Landscaping Ordinance for the LPDD G.34
1.4.7 Conduct a study to identify areas where public sewer and water 35 infrastructure has not been constructed or is inadequate for the 36 redevelopment described in this Plan. When this study is 37 completed: 38
Prioritize areas within the Central Subarea for expansion. A.39 Include a calculation of the number of EDUs necessary to 40 connect these areas to public sewer and water based on zoning. 41
Obtain a cost estimate for extending or improving sewer and B.42 water. 43
1.4.8 Budget the funds. 44
45
PC August 2015 2-1 Lexington Park Development District Master Plan
1
2. Development Strategies 2
Vision: Growth is concentrated in existing population and business centers, or in strategically selected new centers. Compact, mixed-use, walkable 3 design located near available or planned transit services ensures efficient use of land and transportation resources. Natural systems, open spaces, 4
recreational areas, and historical, cultural, and archaeological resources are preserved and enhanced. Members of the community are committed to an 5 active role in planning and carrying out steps to achieve this vision. 6
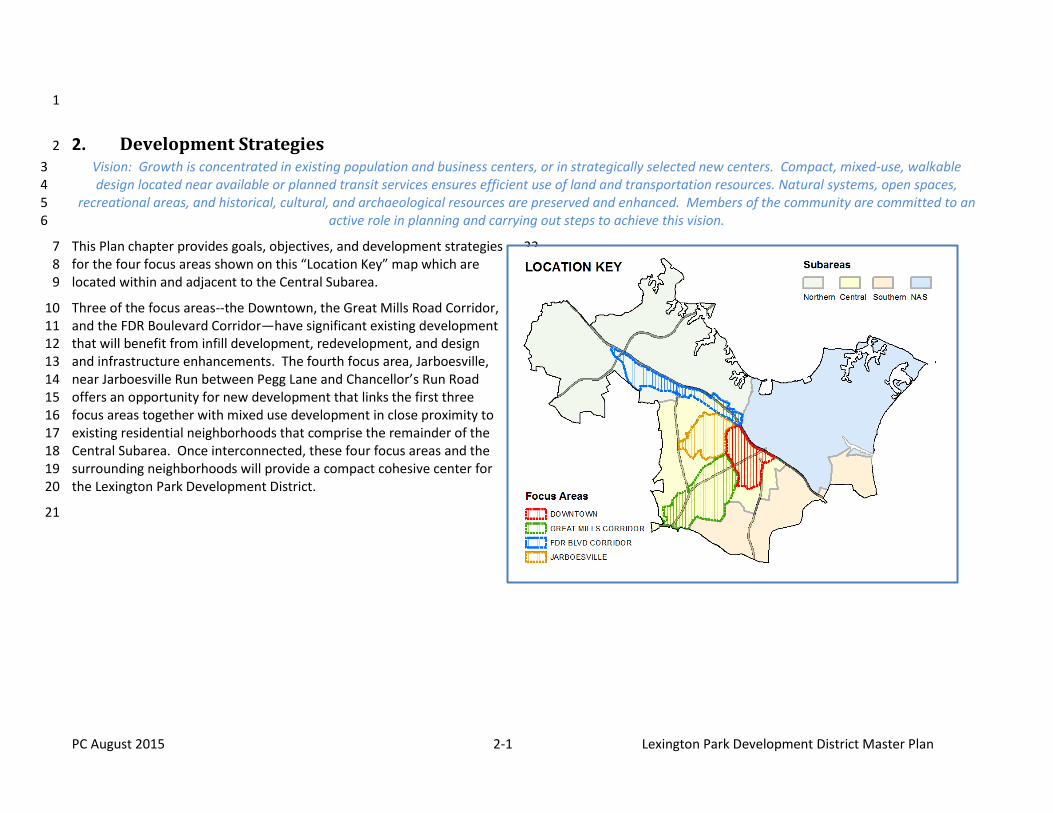
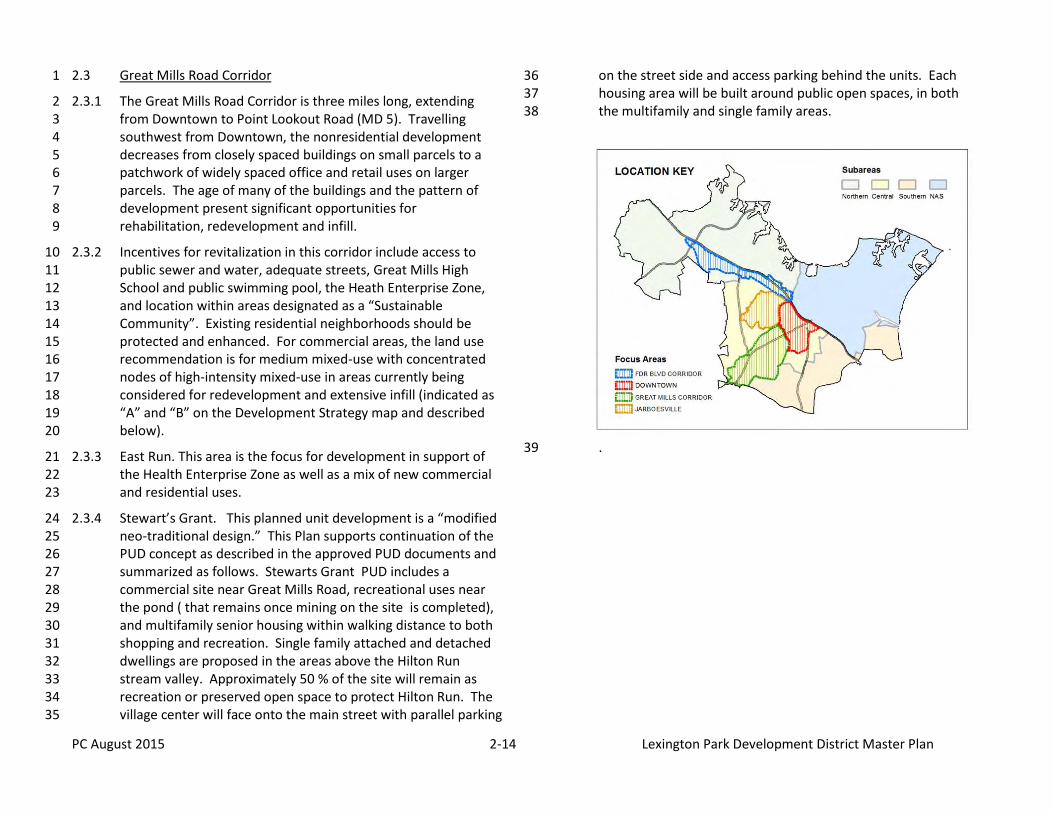
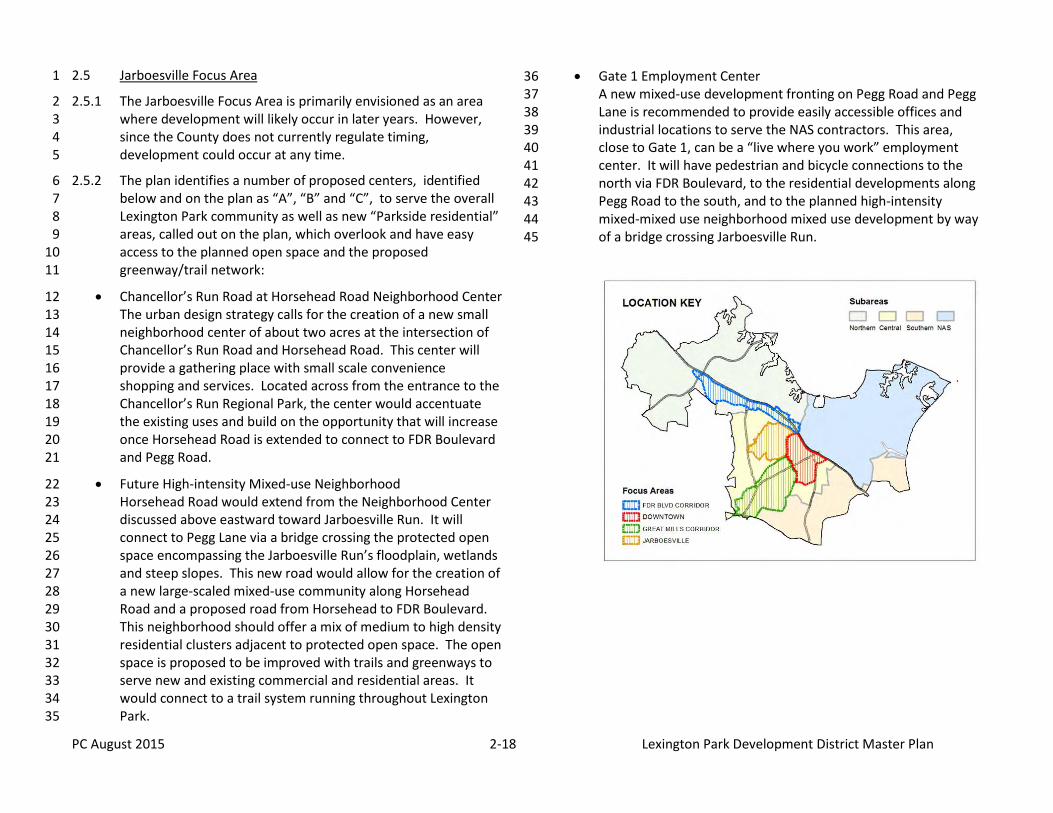
This Plan chapter provides goals, objectives, and development strategies 7 for the four focus areas shown on this “Location Key” map which are 8 located within and adjacent to the Central Subarea. 9
Three of the focus areas--the Downtown, the Great Mills Road Corridor, 10 and the FDR Boulevard Corridor—have significant existing development 11 that will benefit from infill development, redevelopment, and design 12 and infrastructure enhancements. The fourth focus area, Jarboesville, 13 near Jarboesville Run between Pegg Lane and Chancellor’s Run Road 14 offers an opportunity for new development that links the first three 15 focus areas together with mixed use development in close proximity to 16 existing residential neighborhoods that comprise the remainder of the 17 Central Subarea. Once interconnected, these four focus areas and the 18 surrounding neighborhoods will provide a compact cohesive center for 19 the Lexington Park Development District. 20
21
22
PC August 2015 2-2 Lexington Park Development District Master Plan
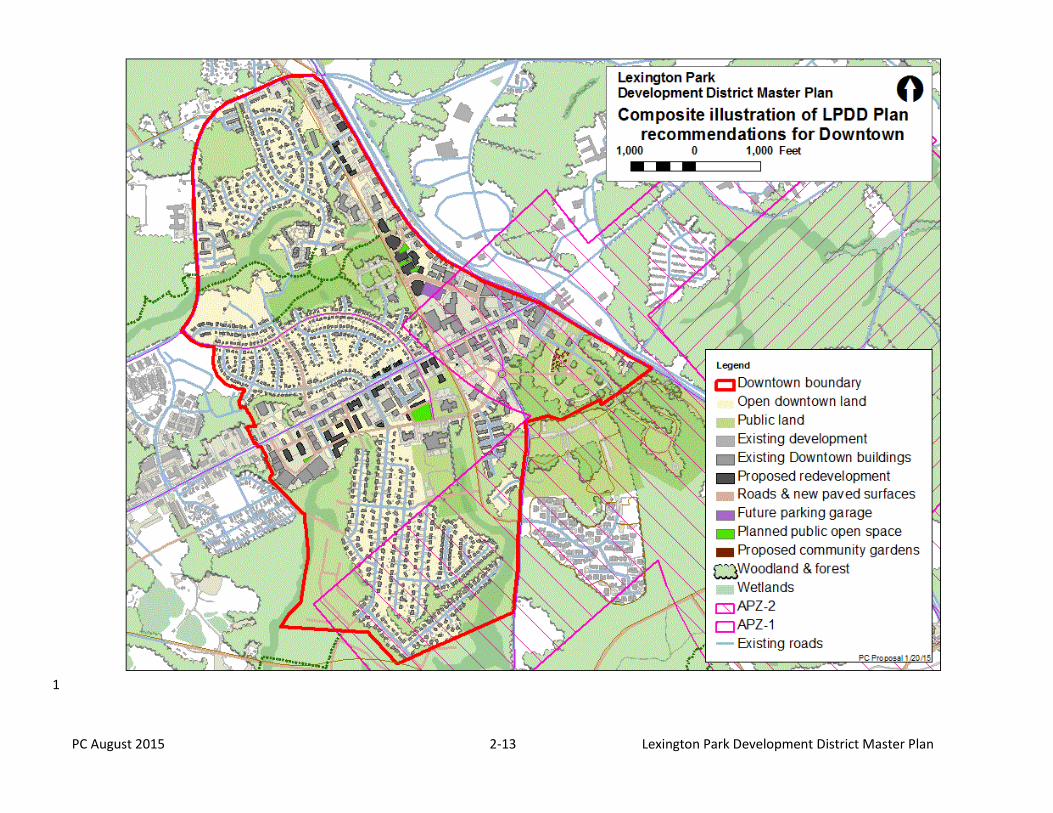
2.1 Downtown 1
The growth of Downtown will require redevelopment, an improved 2 transportation network of Complete Streets, and attractive landscaping. 3 Essential ingredients of the long-term success of the Downtown, the 4 adjoining corridors, and of the Development District as a whole should 5 include better street lighting, enhanced security, routine property 6 maintenance, coordinated parking, marketing and public event 7 programming. Phasing and funding of capital improvements should 8 occur within Downtown to support the infill, redevelopment and 9 revitalization of older commercial areas before significant investment 10 elsewhere. 11
The Plan prioritizes two areas outside the AICUZ and located west and 12 north of the older commercial areas surrounding Gate 2 of the Naval Air 13 Station. The first area is a new “Central Business District” (CBD) that is 14 planned as a family-friendly, commercial and civic center located 15 between Shangri-La Drive and Great Mills Road west of FDR Boulevard, 16 to and including St. Mary’s Square. It is envisioned to provide mid-rise 17 buildings (three to five stories high) offering a pedestrian friendly mix of 18 retail, office, and service uses connected to surrounding neighborhoods. 19 To the east of the CBD is an institutional center made up of the library, 20 the fire hall, the rescue squad, two churches and Lexington Park 21 Elementary School. The CBD and the institutional center could share a 22 town green as described in section 2.1.3.A. 23
The second area, to the north, is a Downtown Gateway that extends 24 along FDR Boulevard south of Pegg Road. This area offers easy access to 25 NAS Gate 1 and is envisioned to provide lodging, restaurants, services 26 and activities for tourists and for personnel associated with the NAS. 27 Redevelopment and infill in the Downtown Gateway can take advantage 28 of easy pedestrian and bike access to the Three Notch Trail, Nicolet 29 Park, the Navy museum, and to the CBD via FDR Boulevard. 30
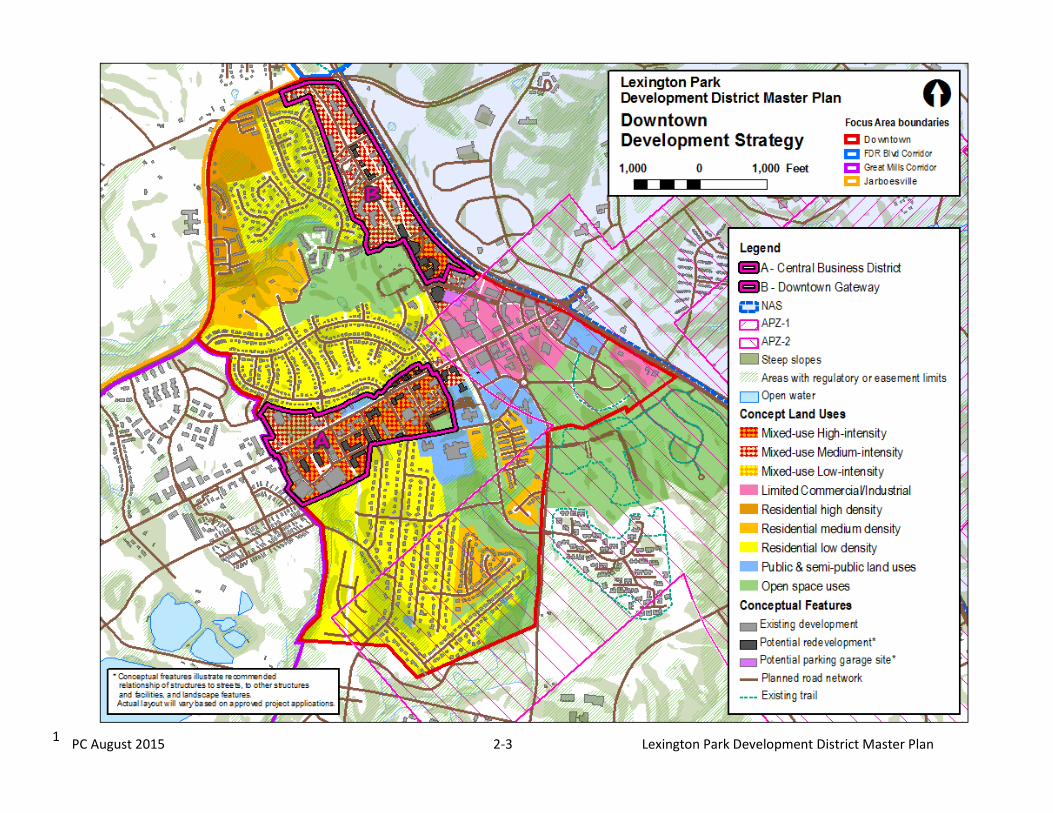
The map on the following page, along with recommended strategies for 31 development (Section 2.1.1), circulation improvements (Section 2.1.2), 32
and the network for open spaces and parks (Section 2.1.3), are provided 33 as a guide for modernizing Downtown Lexington Park. 34
The map on page 2-14 provides a composite illustration of all of the 35 Plan’s recommendations for Downtown. 36
2.1.1 Development Strategies 37
Create a Central Business District (CBD) A.38
The CBD introduced on page 2-2 is planned to provide new 39 streets, sidewalk and public amenities, multistory mixed use 40 residential, retail, office and service uses and a centrally located 41 town green, thus offering the feel of a small city and providing 42 neighborhood scale shopping and services. 43
The CBD is well suited for replacement of obsolete buildings 44 with new multistory buildings offering a mix of modest street 45 level office and retail uses, with office or moderate- to high-46 density residential units located above. At buildout, the new 47 high intensity mixed-use commercial and residential 48 development (see section 2.5.5.C) in the CBD is intended to 49 reach about 475,000 square feet. Even without being 50 completely redeveloped, this area can reasonably 51 accommodate up to 250 housing units, and between 220,000 52 and 325,000 square feet of nonresidential space. This amount 53 of development could translate into approximately 700 new 54 residents and 1,000 new employees in Downtown. 55
Infill, redevelopment and revitalization within the CBD should 56 provide or retain a traditional mix of downtown businesses 57 (e.g., pharmacies, stores selling apparel, home furnishings and 58 groceries, specialty shops and services such as banking, real 59 estate and insurance offices) to serve surrounding 60 neighborhoods. New apartments should be integrated into the 61 low- to mid-rise structures alongside or above downtown 62 businesses. 63
PC August 2015 2-3 Lexington Park Development District Master Plan 1
PC August 2015 2-4 Lexington Park Development District Master Plan
The Plan envisions improving the meaning and purpose of 1 Downtown through the maintenance of government and 2 institutional buildings near the CBD. Given that the Lexington 3 Park Development District is planned to absorb the majority of 4 the county’s growth, the offices of state, regional and local 5 agencies should also be located in and near this area. Public 6 investment in new streets, sidewalks, bikeways and public open 7 spaces within the CBD should encourage new private 8 development needed to achieve this vision. A new town green 9 is recommended to serve as the heart of the downtown and the 10 link between the institutional center and the CBD. 11
2.1.2 Establish a Downtown Gateway 12
The Plan envisions a “Downtown Gateway,” with a total new 13 floor area of approximately 500,000 square feet of uses to meet 14 demands throughout the Southern Maryland region. Located 15 northwest of the existing Downtown (between FDR Boulevard 16 and Three Notch Road), the area extends south of NAS Gate 1 to 17 a proposed new street that extends from N. Shangri-La Drive to 18 Nicolet Park’s planned FDR Boulevard entrance. 19
For the northern end of the Downtown Gateway (closest to 20 Gate 1), the Plan proposes new midrise hotels and mixed-use 21 development with restaurants, offices and service uses. New 22 buildings should be placed close to FDR Boulevard and Three 23 Notch Road to provide an urban streetscape. Surface parking 24 should be behind buildings in the interior of the blocks. 25
For the southern end of the Downtown Gateway, the Plan 26 suggests multi-story high-intensity mixed-use complex fronting 27 on a realigned and upgraded segment of FDR Boulevard 28 adjacent to Nicolet Park. Included in the pedestrian-oriented 29 complex would be retail, recreation and restaurant uses, 30 department stores and movie theaters. Parking could be 31 accommodated in a multilevel garage, taking advantage of the 32 grade change along a proposed new street that links the 33
existing retail development in Millison Plaza to the new 34 complex. 35
2.1.3 Enhance areas of existing development. 36
Existing Residential Neighborhoods A.37
Following adoption of the Plan, the County should initiate 38 neighborhood-based planning for the Patuxent Park, Spring 39 Valley, Essex South and Colony Square neighborhoods to 40 develop design guidelines and plans for complete streets (which 41 include new street connections, appropriate traffic calming, 42 beautification, and pedestrian and bicycle improvements). In 43 order to rehabilitate or replace substandard housing, the 44 County should continue to promote programs and pursue 45 funding to assist property owners and nongovernmental 46 organizations (NGOs). 47
Existing Commercial Areas B.48
Outside of the CBD and the Downtown Gateway, the Plan 49 recommends a new land use designation (“limited commercial 50 and industrial”), beautification, new road connections, and 51 pedestrian and bicycle improvements. As existing businesses 52 within these areas give way to replacement, landowner 53 expectations and the need to protect the mission of the NAS 54 must be balanced. The Plan recommends a redevelopment 55 study for areas within the AICUZ to address such a balance. 56
Existing Strip Commercial Centers C.57
A significant focus of this Plan is retrofitting of existing strip 58 commercial development as tenants change and, on a larger 59 scale, as structures become obsolete. This type of retrofit is 60 recommended for Millison Plaza (while respecting the 61 limitations imposed by the AICUZ) and for St. Mary’s Square. 62 Infill buildings, pocket parks and complete streets will 63 functionally and visually incorporate these shopping centers 64 into the CBD. 65
PC August 2015 2-5 Lexington Park Development District Master Plan
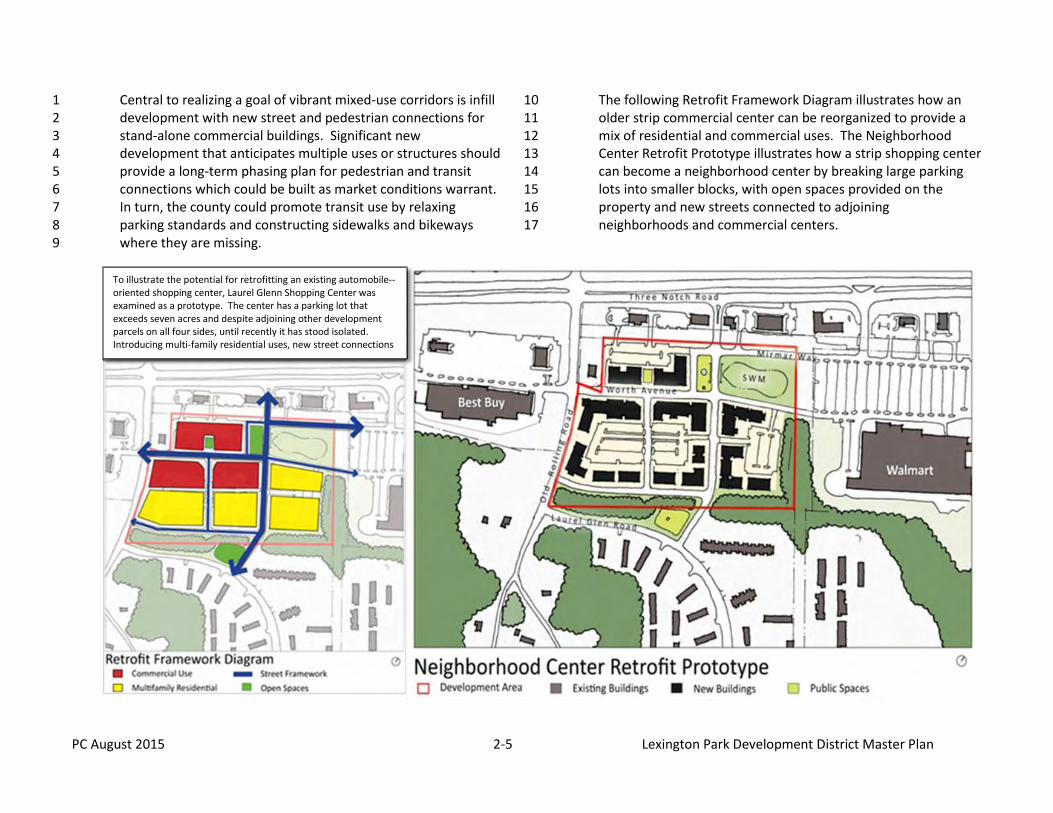
Central to realizing a goal of vibrant mixed-use corridors is infill 1 development with new street and pedestrian connections for 2 stand-alone commercial buildings. Significant new 3 development that anticipates multiple uses or structures should 4 provide a long-term phasing plan for pedestrian and transit 5 connections which could be built as market conditions warrant. 6 In turn, the county could promote transit use by relaxing 7 parking standards and constructing sidewalks and bikeways 8 where they are missing. 9
The following Retrofit Framework Diagram illustrates how an 10 older strip commercial center can be reorganized to provide a 11 mix of residential and commercial uses. The Neighborhood 12 Center Retrofit Prototype illustrates how a strip shopping center 13 can become a neighborhood center by breaking large parking 14 lots into smaller blocks, with open spaces provided on the 15 property and new streets connected to adjoining 16 neighborhoods and commercial centers. 17
To illustrate the potential for retrofitting an existing automobile--oriented shopping center, Laurel Glenn Shopping Center was examined as a prototype. The center has a parking lot that exceeds seven acres and despite adjoining other development parcels on all four sides, until recently it has stood isolated. Introducing multi-family residential uses, new street connections and open space transforms older shopping centers.
PC August 2015 2-6 Lexington Park Development District Master Plan
2.2 Circulation Improvements 1
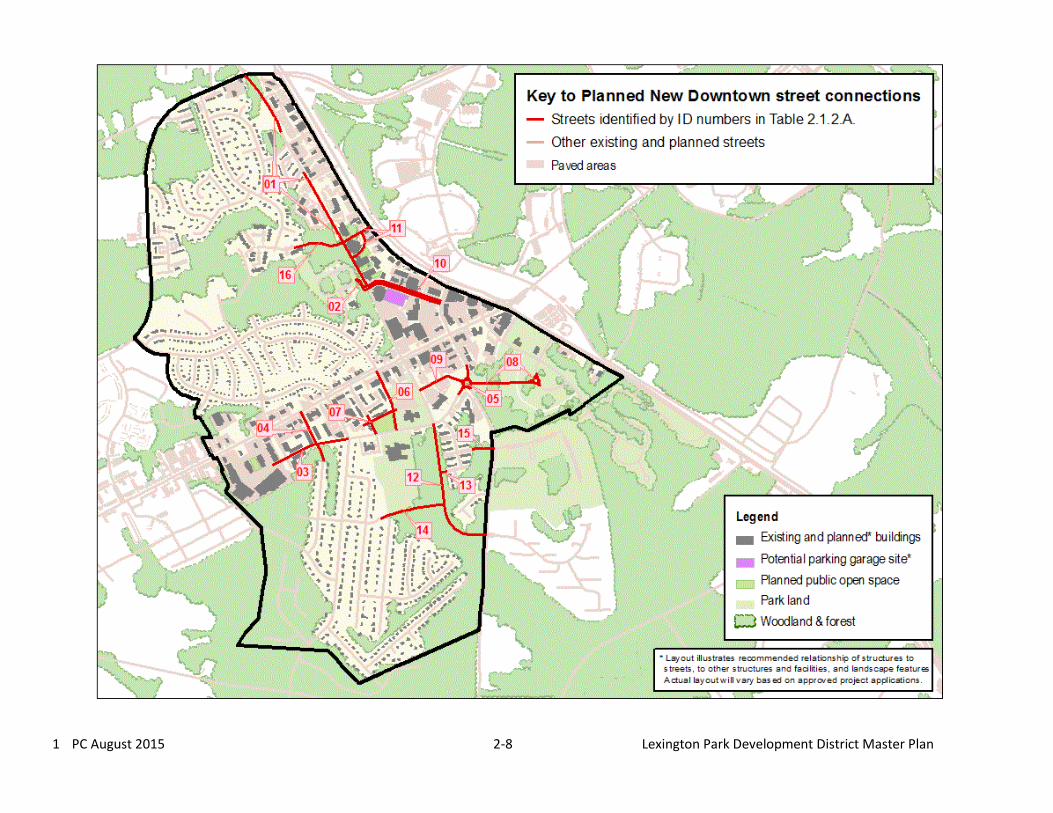
2.2.1 The Downtown Circulation Improvement map on page 2-9 2 proposes a network of streets, bikeways and sidewalks (off-road 3 paths for biking and walking are shown in the Downtown Open 4 Space Network map on page 2-13). 5
2.2.2 New Street Connections 6
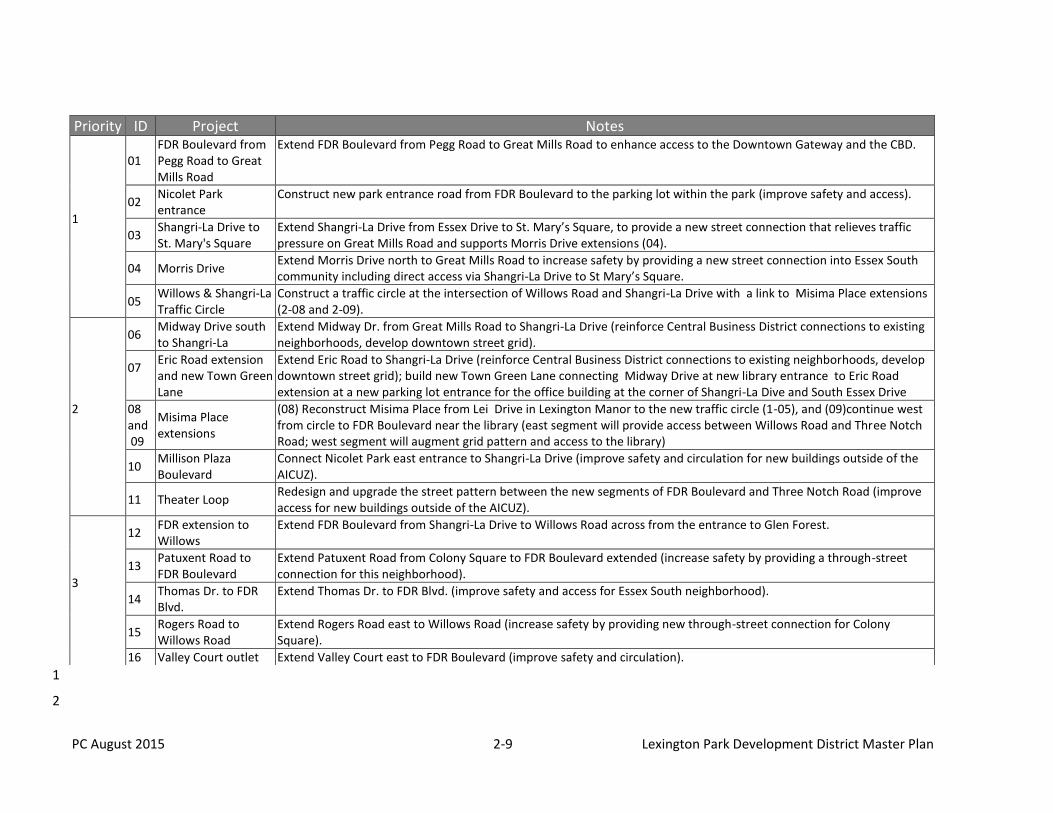
Planned new Downtown street connections fall within three 7 priority classes that are identified in Table 2.1.2A on page 19. 8 (See also Chapter 4; Table 4.1 identifies all street improvements 9 recommended for Lexington Park.) 10
The first class of improvements gives high priority to streets that 11 will improve connectivity between the Downtown focus area 12 and the rest of Lexington Park. These projects should be 13 initiated in the near term irrespective of the readiness of a 14 development project to share costs. They will provide 15 important connections that increase access between primary 16 destinations; FDR Boulevard is the most important project in 17 this first priority. Other streets in this priority provide 18 important connections between existing neighborhoods and 19 commercial areas. 20
The second class of improvements is those that help reinforce 21 the importance of the CBD, and provide direction for road 22 connections to be built by a developer in an area where these 23 streets are planned. The county should consider including these 24 streets in a capital improvement program (CIP) within 5 years of 25 Plan adoption. Constructing streets within the CBD (as 26 illustrated on the map entitled “Development Strategy for 27 Downtown”) will provide a street grid pattern, promote 28 redevelopment of the Downtown’s outdated - retail centers, 29 and provide additional connections that enhance safety and 30 convenience for existing neighborhoods. The cost of these 31 streets should be shared by private and public sectors when 32 included as part of a developer driven project. However, they 33
should be publicly funded when needed to provide an incentive 34 for infill, redevelopment and revitalization, are necessary for 35 traffic calming, or for improving management of stormwater. 36
The third class of street improvements includes projects 37 initiated by major development activities or by a public 38 purpose. Examples of development driven activity include 39 constructing internal streets in places like Millison Plaza or St. 40 Mary’s Square where the timing for these will be dictated by the 41 pace and phasing of redevelopment4 and the extent of 42 developer participation in the cost of construction. Public 43 purpose driven street improvements include projects initiated 44 in a CIP, but scheduled beyond its 5th year, where a significant 45 public need results from the success of Lexington Park as the 46 focus for development and population increases. Such CIP 47 improvements will address safety or congestion issues and will 48 provide incentives for infill, redevelopment and revitalization. 49
Extension of FDR Boulevard from Shangri-La Drive to Willows 50 Road or the connection from Willows Road to Three Notch Road 51 is typical of this priority. 52
2.2.3 Streetscape improvements, pedestrian amenities and traffic 53 calming. 54
This Plan builds on the Great Mills Road streetscape 55 improvements completed in 2011 and envisions that Downtown 56 will have significant pedestrian amenities, including streetlights, 57 shade trees, benches, and landscaping. Pedestrian and 58 streetscape amenities will strengthen a sense of place and 59
4 The internal Millison Plaza or St. Mary’s Square streets may either be
constructed as public streets or constructed as private development streets. In either case, there will likely be some cost sharing role for the public sector in the costs of their construction. From a design standpoint, it is imperative that these streets look and feel like real streets and not like driveways through a shopping center.
PC August 2015 2-7 Lexington Park Development District Master Plan
reinforce the quality and town like feel envisioned for the 1 Downtown. 2
The Proposed Downtown Circulation Changes diagram on page 3 2-9 illustrates the recommended network of streets, amenities 4 and enhancements. 5
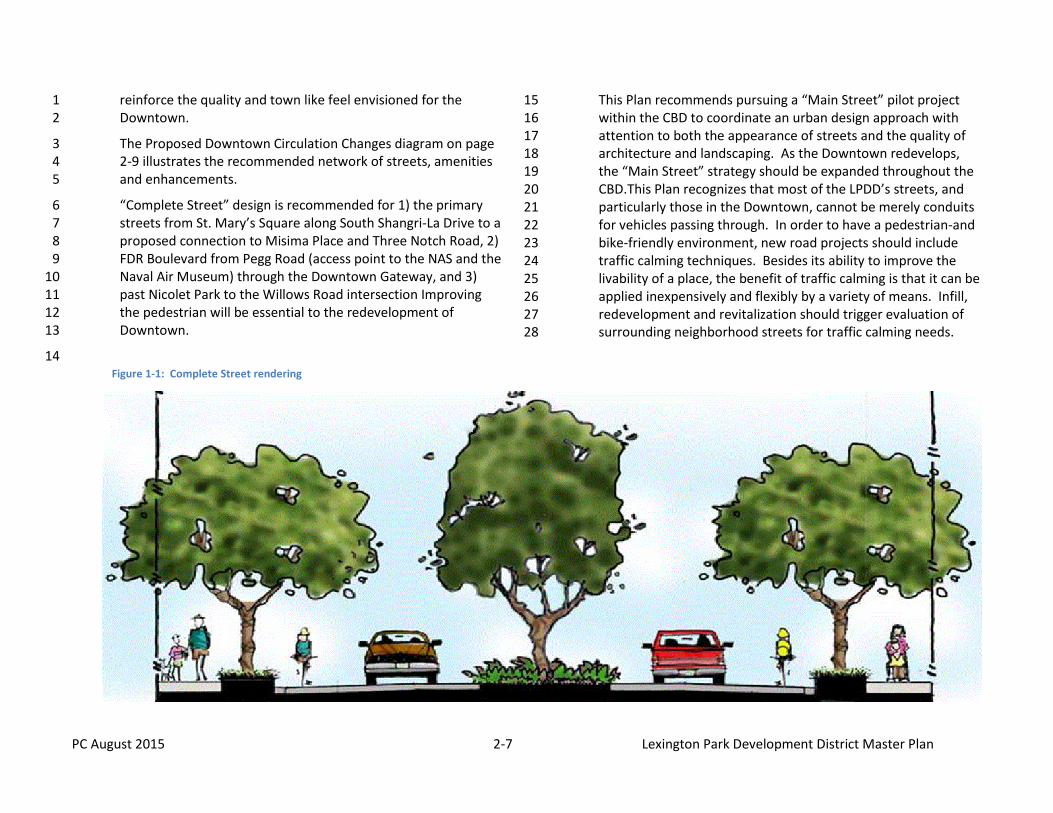
“Complete Street” design is recommended for 1) the primary 6 streets from St. Mary’s Square along South Shangri-La Drive to a 7 proposed connection to Misima Place and Three Notch Road, 2) 8 FDR Boulevard from Pegg Road (access point to the NAS and the 9 Naval Air Museum) through the Downtown Gateway, and 3) 10 past Nicolet Park to the Willows Road intersection Improving 11 the pedestrian will be essential to the redevelopment of 12 Downtown. 13
14
This Plan recommends pursuing a “Main Street” pilot project 15 within the CBD to coordinate an urban design approach with 16 attention to both the appearance of streets and the quality of 17 architecture and landscaping. As the Downtown redevelops, 18 the “Main Street” strategy should be expanded throughout the 19 CBD.This Plan recognizes that most of the LPDD’s streets, and 20 particularly those in the Downtown, cannot be merely conduits 21 for vehicles passing through. In order to have a pedestrian-and 22 bike-friendly environment, new road projects should include 23 traffic calming techniques. Besides its ability to improve the 24 livability of a place, the benefit of traffic calming is that it can be 25 applied inexpensively and flexibly by a variety of means. Infill, 26 redevelopment and revitalization should trigger evaluation of 27 surrounding neighborhood streets for traffic calming needs. 28
Figure 1-1: Complete Street rendering
PC August 2015 2-8 Lexington Park Development District Master Plan 1
PC August 2015 2-9 Lexington Park Development District Master Plan
1
2
Priority ID Project Notes
1
01 FDR Boulevard from Pegg Road to Great Mills Road
Extend FDR Boulevard from Pegg Road to Great Mills Road to enhance access to the Downtown Gateway and the CBD.
02 Nicolet Park entrance
Construct new park entrance road from FDR Boulevard to the parking lot within the park (improve safety and access).
03 Shangri-La Drive to St. Mary's Square
Extend Shangri-La Drive from Essex Drive to St. Mary’s Square, to provide a new street connection that relieves traffic pressure on Great Mills Road and supports Morris Drive extensions (04).
04 Morris Drive Extend Morris Drive north to Great Mills Road to increase safety by providing a new street connection into Essex South community including direct access via Shangri-La Drive to St Mary’s Square.
05 Willows & Shangri-La Traffic Circle
Construct a traffic circle at the intersection of Willows Road and Shangri-La Drive with a link to Misima Place extensions (2-08 and 2-09).
2
06 Midway Drive south to Shangri-La
Extend Midway Dr. from Great Mills Road to Shangri-La Drive (reinforce Central Business District connections to existing neighborhoods, develop downtown street grid).
07
Eric Road extension and new Town Green Lane
Extend Eric Road to Shangri-La Drive (reinforce Central Business District connections to existing neighborhoods, develop downtown street grid); build new Town Green Lane connecting Midway Drive at new library entrance to Eric Road extension at a new parking lot entrance for the office building at the corner of Shangri-La Dive and South Essex Drive
08 and 09
Misima Place extensions
(08) Reconstruct Misima Place from Lei Drive in Lexington Manor to the new traffic circle (1-05), and (09)continue west from circle to FDR Boulevard near the library (east segment will provide access between Willows Road and Three Notch Road; west segment will augment grid pattern and access to the library)
10 Millison Plaza Boulevard
Connect Nicolet Park east entrance to Shangri-La Drive (improve safety and circulation for new buildings outside of the AICUZ).
11 Theater Loop Redesign and upgrade the street pattern between the new segments of FDR Boulevard and Three Notch Road (improve access for new buildings outside of the AICUZ).
3
12 FDR extension to Willows
Extend FDR Boulevard from Shangri-La Drive to Willows Road across from the entrance to Glen Forest.
13 Patuxent Road to FDR Boulevard
Extend Patuxent Road from Colony Square to FDR Boulevard extended (increase safety by providing a through-street connection for this neighborhood).
14 Thomas Dr. to FDR Blvd.
Extend Thomas Dr. to FDR Blvd. (improve safety and access for Essex South neighborhood).
15 Rogers Road to Willows Road
Extend Rogers Road east to Willows Road (increase safety by providing new through-street connection for Colony Square).
16 Valley Court outlet Extend Valley Court east to FDR Boulevard (improve safety and circulation).
PC August 2015 2-10 Lexington Park Development District Master Plan
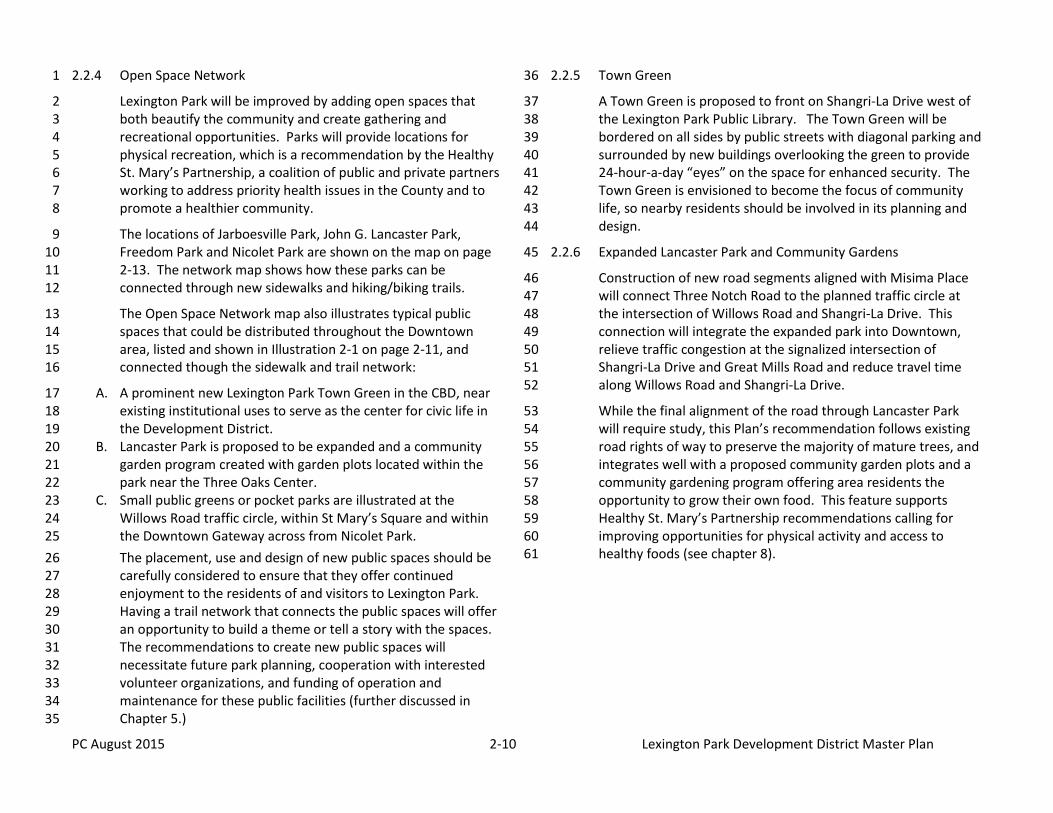
2.2.4 Open Space Network 1
Lexington Park will be improved by adding open spaces that 2 both beautify the community and create gathering and 3 recreational opportunities. Parks will provide locations for 4 physical recreation, which is a recommendation by the Healthy 5 St. Mary’s Partnership, a coalition of public and private partners 6 working to address priority health issues in the County and to 7 promote a healthier community. 8
The locations of Jarboesville Park, John G. Lancaster Park, 9 Freedom Park and Nicolet Park are shown on the map on page 10 2-13. The network map shows how these parks can be 11 connected through new sidewalks and hiking/biking trails. 12
The Open Space Network map also illustrates typical public 13 spaces that could be distributed throughout the Downtown 14 area, listed and shown in Illustration 2-1 on page 2-11, and 15 connected though the sidewalk and trail network: 16
A prominent new Lexington Park Town Green in the CBD, near A.17 existing institutional uses to serve as the center for civic life in 18 the Development District. 19
Lancaster Park is proposed to be expanded and a community B.20 garden program created with garden plots located within the 21 park near the Three Oaks Center. 22
Small public greens or pocket parks are illustrated at the C.23 Willows Road traffic circle, within St Mary’s Square and within 24 the Downtown Gateway across from Nicolet Park. 25
The placement, use and design of new public spaces should be 26 carefully considered to ensure that they offer continued 27 enjoyment to the residents of and visitors to Lexington Park. 28 Having a trail network that connects the public spaces will offer 29 an opportunity to build a theme or tell a story with the spaces. 30 The recommendations to create new public spaces will 31 necessitate future park planning, cooperation with interested 32 volunteer organizations, and funding of operation and 33 maintenance for these public facilities (further discussed in 34 Chapter 5.) 35
2.2.5 Town Green 36
A Town Green is proposed to front on Shangri-La Drive west of 37 the Lexington Park Public Library. The Town Green will be 38 bordered on all sides by public streets with diagonal parking and 39 surrounded by new buildings overlooking the green to provide 40 24-hour-a-day “eyes” on the space for enhanced security. The 41 Town Green is envisioned to become the focus of community 42 life, so nearby residents should be involved in its planning and 43 design. 44
2.2.6 Expanded Lancaster Park and Community Gardens 45
Construction of new road segments aligned with Misima Place 46 will connect Three Notch Road to the planned traffic circle at 47 the intersection of Willows Road and Shangri-La Drive. This 48 connection will integrate the expanded park into Downtown, 49 relieve traffic congestion at the signalized intersection of 50 Shangri-La Drive and Great Mills Road and reduce travel time 51 along Willows Road and Shangri-La Drive. 52
While the final alignment of the road through Lancaster Park 53 will require study, this Plan’s recommendation follows existing 54 road rights of way to preserve the majority of mature trees, and 55 integrates well with a proposed community garden plots and a 56 community gardening program offering area residents the 57 opportunity to grow their own food. This feature supports 58 Healthy St. Mary’s Partnership recommendations calling for 59 improving opportunities for physical activity and access to 60 healthy foods (see chapter 8). 61
PC August 2015 2-11 Lexington Park Development District Master Plan
1 2
PC August 2015 2-12 Lexington Park Development District Master Plan
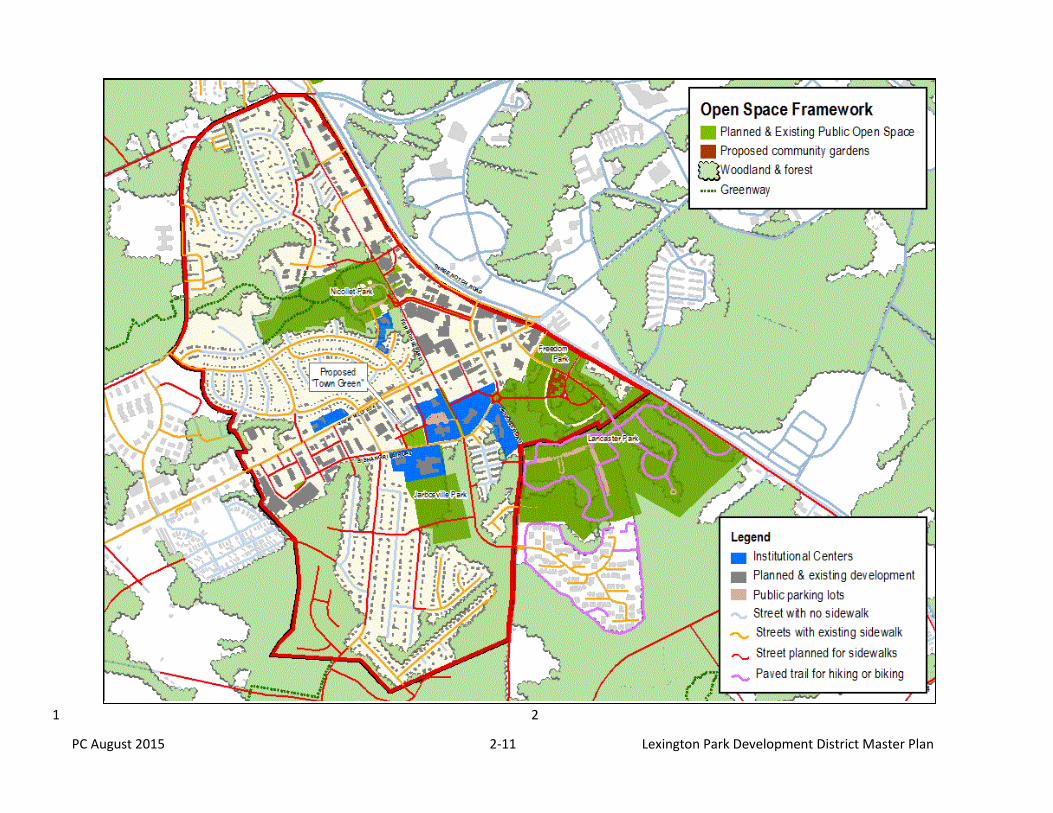
2.2.7 Small public greens and pocket parks 1
The walkability and livability of Lexington Park will be enhanced 2 by a sidewalk and trail network linking parks and new public 3 greens throughout the Downtown 4
During community meetings held to help develop this plan 5 participants made suggestions for additional parks for passive 6 outdoor recreation, public art spaces that could fit into an arts 7 district strategy, and spaces that offer seasonal opportunities 8 such as an ice skating rink or summer concerts, farm markets or 9
local craft fairs. Continued community involvement will be 10 invited to assure that the public open space network is built. 11
Highlighted in bright green in the illustration below (in 12 Lexington Manor, near the library, within St. Mary’s Square and 13 in the Downtown Gateway across from Nicolet Park) are sites 14 suggested for new public greens that can become important 15 components the Downtown open space network. 16
Illustration 2-1: Aerial View Showing Potential Massing of Structures and Forest Stands
PC August 2015 2-13 Lexington Park Development District Master Plan
1
PC August 2015 2-14 Lexington Park Development District Master Plan
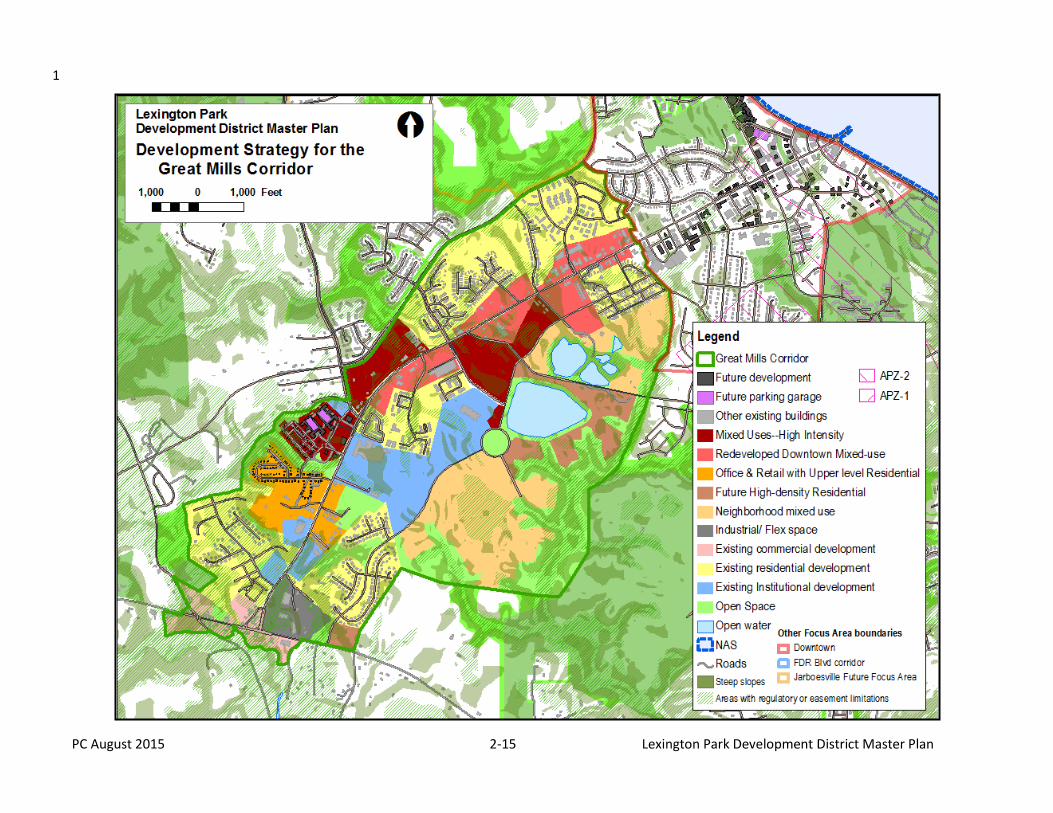
2.3 Great Mills Road Corridor 1
2.3.1 The Great Mills Road Corridor is three miles long, extending 2 from Downtown to Point Lookout Road (MD 5). Travelling 3 southwest from Downtown, the nonresidential development 4 decreases from closely spaced buildings on small parcels to a 5 patchwork of widely spaced office and retail uses on larger 6 parcels. The age of many of the buildings and the pattern of 7 development present significant opportunities for 8 rehabilitation, redevelopment and infill. 9
2.3.2 Incentives for revitalization in this corridor include access to 10 public sewer and water, adequate streets, Great Mills High 11 School and public swimming pool, the Heath Enterprise Zone, 12 and location within areas designated as a “Sustainable 13 Community”. Existing residential neighborhoods should be 14 protected and enhanced. For commercial areas, the land use 15 recommendation is for medium mixed-use with concentrated 16 nodes of high-intensity mixed-use in areas currently being 17 considered for redevelopment and extensive infill (indicated as 18 “A” and “B” on the Development Strategy map and described 19 below). 20
2.3.3 East Run. This area is the focus for development in support of 21 the Health Enterprise Zone as well as a mix of new commercial 22 and residential uses. 23
2.3.4 Stewart’s Grant. This planned unit development is a “modified 24 neo-traditional design.” This Plan supports continuation of the 25 PUD concept as described in the approved PUD documents and 26 summarized as follows. Stewarts Grant PUD includes a 27 commercial site near Great Mills Road, recreational uses near 28 the pond ( that remains once mining on the site is completed), 29 and multifamily senior housing within walking distance to both 30 shopping and recreation. Single family attached and detached 31 dwellings are proposed in the areas above the Hilton Run 32 stream valley. Approximately 50 % of the site will remain as 33 recreation or preserved open space to protect Hilton Run. The 34 village center will face onto the main street with parallel parking 35
on the street side and access parking behind the units. Each 36 housing area will be built around public open spaces, in both 37 the multifamily and single family areas. 38
. 39
PC August 2015 2-15 Lexington Park Development District Master Plan
1
PC August 2015 2-16 Lexington Park Development District Master Plan
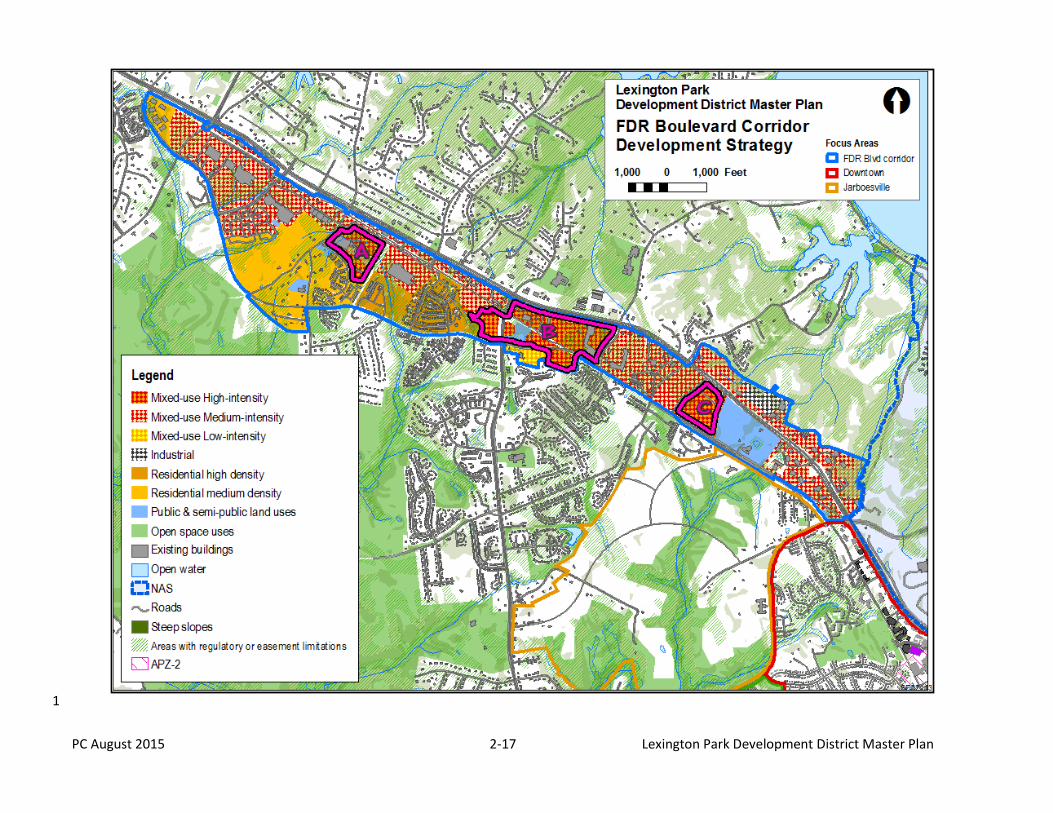
2.4 FDR Boulevard Corridor 1
2.4.1 The FDR Boulevard Corridor extends 4.5 miles from Pegg Road 2 to St. Andrew’s Church Road. A significant portion of the 3 Corridor is developed and is characterized by numerous partially 4 built-out automobile-oriented suburban shopping centers and 5 office buildings. 6
2.4.2 Some segments of FDR Boulevard are currently built and several 7 infill segments are planned for construction. Completion of FDR 8 Boulevard will likely depend on shared public and private 9 contributions. 10
2.4.3 Completion of the road through the corridor will meet 11 important County goals: to relieve traffic congestion and 12 improve access to the NAS along Three Notch Road, to open 13 new lands and circulation routes necessary to manage 14 anticipated growth in Lexington Park, support creation of more 15 urban development patterns, and improve transit routes. This 16 Plan supports development to provide mixed-use commercial 17 and residential land uses, with the addition of concentrated 18 nodes of high-intensity mixed-use development. Doing this 19 requires improved integration of multifamily residential 20 development into automobile-oriented suburban shopping and 21 office centers and new transportation connections to existing 22 residential development at the fringes of the corridor. 23
2.4.4 This Plan’s land use recommendation is for medium mixed-use 24 commercial and residential land uses, with the addition of 25 concentrated nodes of high-intensity mixed-use development. 26 A mixed use approach will allow integration of multifamily 27 residential development into existing shopping and 28 employment centers. New transportation connections from 29 these centers to existing residential development at the fringes 30 of the corridor should be built. 31
32
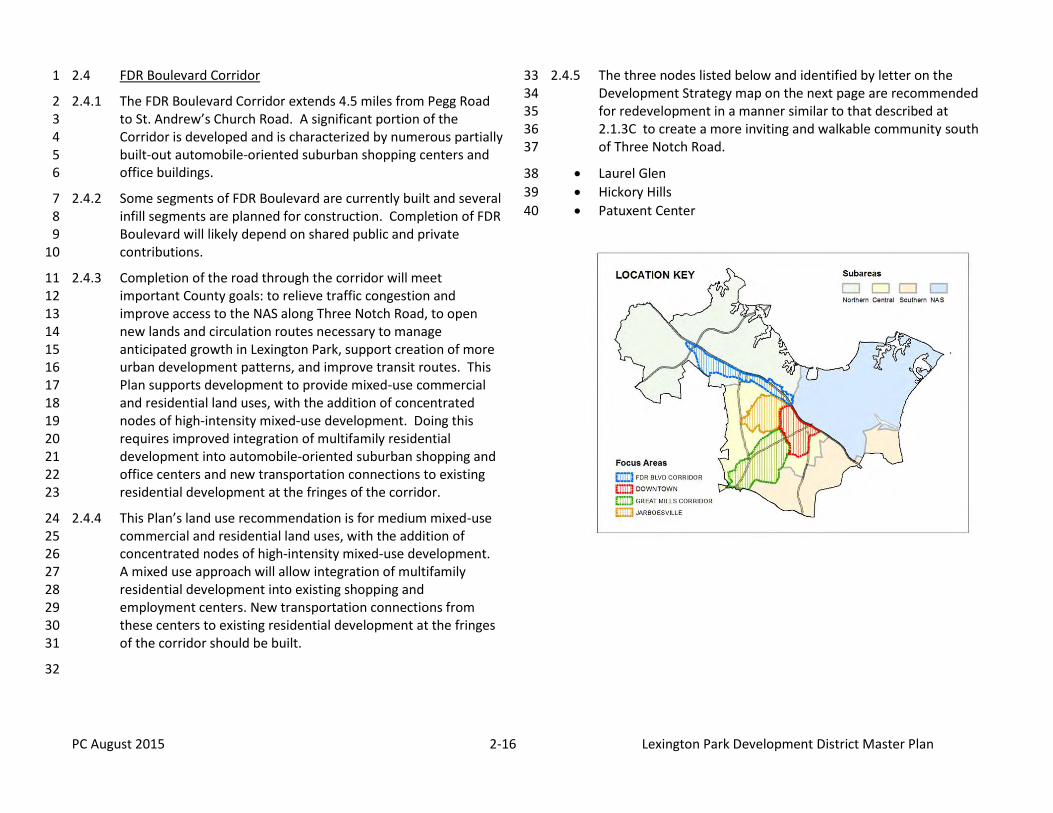
2.4.5 The three nodes listed below and identified by letter on the 33 Development Strategy map on the next page are recommended 34 for redevelopment in a manner similar to that described at 35 2.1.3C to create a more inviting and walkable community south 36 of Three Notch Road. 37
Laurel Glen 38
Hickory Hills 39
Patuxent Center 40
PC August 2015 2-17 Lexington Park Development District Master Plan
1
PC August 2015 2-18 Lexington Park Development District Master Plan
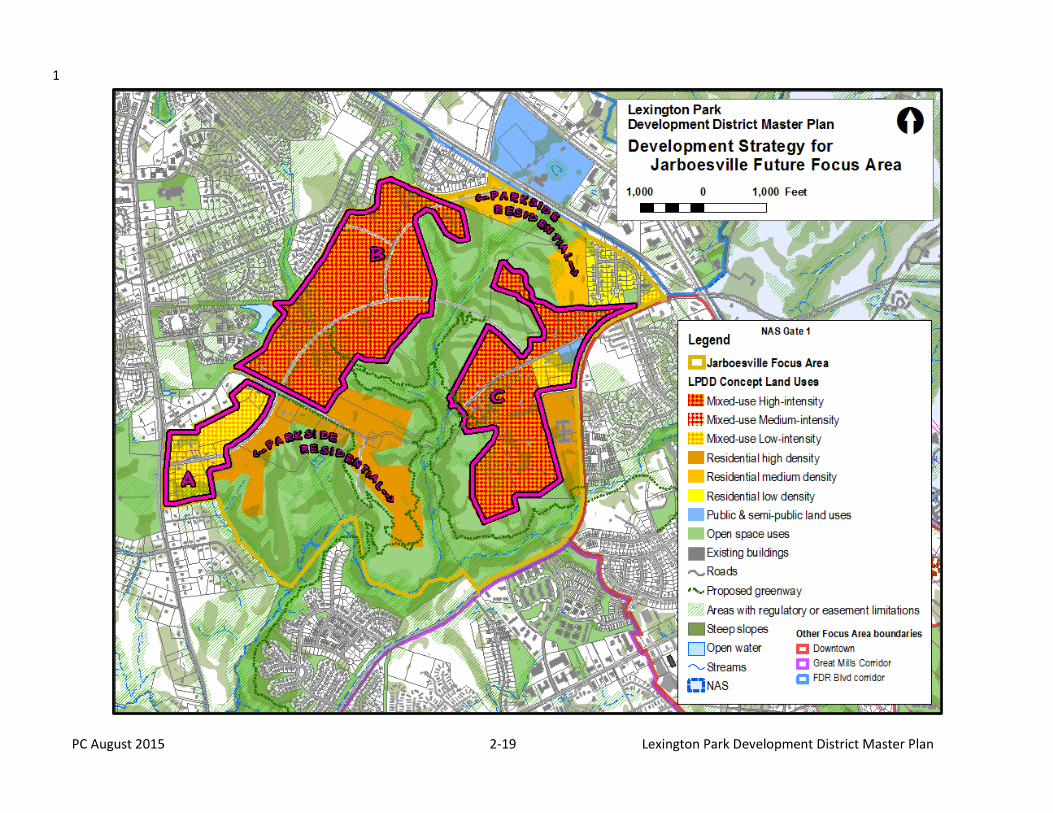
2.5 Jarboesville Focus Area 1
2.5.1 The Jarboesville Focus Area is primarily envisioned as an area 2 where development will likely occur in later years. However, 3 since the County does not currently regulate timing, 4 development could occur at any time. 5
2.5.2 The plan identifies a number of proposed centers, identified 6 below and on the plan as “A”, “B” and “C”, to serve the overall 7 Lexington Park community as well as new “Parkside residential” 8 areas, called out on the plan, which overlook and have easy 9 access to the planned open space and the proposed 10 greenway/trail network: 11
Chancellor’s Run Road at Horsehead Road Neighborhood Center 12 The urban design strategy calls for the creation of a new small 13 neighborhood center of about two acres at the intersection of 14 Chancellor’s Run Road and Horsehead Road. This center will 15 provide a gathering place with small scale convenience 16 shopping and services. Located across from the entrance to the 17 Chancellor’s Run Regional Park, the center would accentuate 18 the existing uses and build on the opportunity that will increase 19 once Horsehead Road is extended to connect to FDR Boulevard 20 and Pegg Road. 21
Future High-intensity Mixed-use Neighborhood 22 Horsehead Road would extend from the Neighborhood Center 23 discussed above eastward toward Jarboesville Run. It will 24 connect to Pegg Lane via a bridge crossing the protected open 25 space encompassing the Jarboesville Run’s floodplain, wetlands 26 and steep slopes. This new road would allow for the creation of 27 a new large-scaled mixed-use community along Horsehead 28 Road and a proposed road from Horsehead to FDR Boulevard. 29 This neighborhood should offer a mix of medium to high density 30 residential clusters adjacent to protected open space. The open 31 space is proposed to be improved with trails and greenways to 32 serve new and existing commercial and residential areas. It 33 would connect to a trail system running throughout Lexington 34 Park. 35
Gate 1 Employment Center 36 A new mixed-use development fronting on Pegg Road and Pegg 37 Lane is recommended to provide easily accessible offices and 38 industrial locations to serve the NAS contractors. This area, 39 close to Gate 1, can be a “live where you work” employment 40 center. It will have pedestrian and bicycle connections to the 41 north via FDR Boulevard, to the residential developments along 42 Pegg Road to the south, and to the planned high-intensity 43 mixed-mixed use neighborhood mixed use development by way 44 of a bridge crossing Jarboesville Run. 45
PC August 2015 2-19 Lexington Park Development District Master Plan
1
PC August 2015 2-20 Lexington Park Development District Master Plan
B.1
PC August 2015 2-21 Lexington Park Development District Master Plan
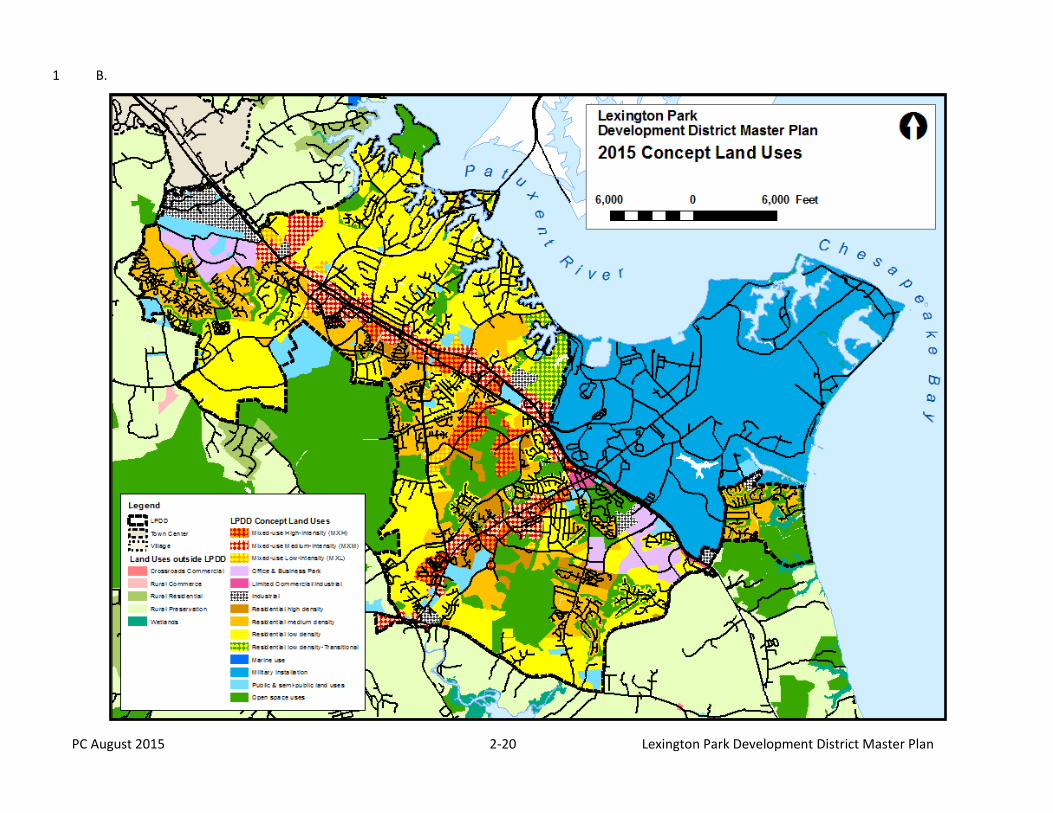
2.6 Land Use Designations 1
2.6.1 Residential Areas 2
Low density transitional A.3
Development in this designation should consist of low-density 4 detached residences with substantial accommodation for 5 preservation of open space or forest retention. Although base 6 density would be 1 dwelling unit per acre, it may increase to 3.5 7 dwellings per acre with the use of transferred development 8 rights (TDRs). All major subdivisions must achieve at least 3.5 9 dwellings per acre within the development envelope5. 10 Minimum lot size would be 2 acres. 11
Low Density B.12
Development in this designation consists of low density 13 residences in clustered configurations with preservation of 14 sensitive areas. Acceptable density would range from 3.5 15 dwelling unit per acre to 5 units per acre. All major subdivisions 16 and residential site plans would achieve at least 3.5 dwellings 17 per acre within a development envelope. Ensure need for TDRs. 18
Medium Density C.19
Development in this designation consists of medium density 20 residences with preservation of sensitive areas. Density would 21 range from 5 to 10 dwelling units per acre. All major 22 subdivisions and residential site plans would achieve at least 5 23 dwellings per acre within a development envelope. Ensure need 24 for TDRs. 25
26
5 “Development envelope” means all of the proposed components of a project that are
necessary to serve the proposed development, including lots, lot coverage, roads, utilities, stormwater management measures, sewage disposal measures, an active recreation area, and additional acreage needed to meet the development requirements of ordinances.
High Density D.27
Development in this designation consists of high density 28 residences with preservation of sensitive areas. Density would 29 range from 10 to 20 dwelling units per acre. All major 30 subdivisions and residential site plans should achieve at least 10 31 dwellings per acre within a development envelope. Ensure 32 need for TDRs. 33
2.6.2 Commercial Areas 34
Office and Business Parks A.35
Development in this designation consists of offices with 36 supporting limited retail uses in a campus setting, and excludes 37 residential use. 38
Industrial Areas B.39
Development in this designation consists of industrial and office 40 uses with preservation of sensitive areas. 41
2.6.3 Mixed-use Areas 42
High Intensity Mixed-Use A.43
Development in this category combines the intensity of areas 44 designated for Downtown mixed use, the density of areas 45 designated for residential-high density and the breadth of uses 46 allowed in corridor mixed use areas. In exchange for this 47 increased density and intensity of development, projects 48 creating more than 3000 feet of floor area will be required to 49 achieve a mix of uses. Proposed development should 50 accommodate multimodal transportation. The design of 51 buildings, landscaping, and public amenity spaces should assure 52 a visually attractive town-like environment and provide an 53 inviting environment for people to work, eat, shop and 54 congregate. Residential density would range from 7 to 30 55 dwelling units per acre. 56
Medium Intensity Mixed-Use B.57
Development in this designation should consist of large-scale 58 and clustered commercial and residential uses adjacent to 59 existing or planned principal transportation corridors with 60
PC August 2015 2-22 Lexington Park Development District Master Plan
reasonable preservation of open space or forest retention. Any 1 development within an envelope exceeding 5 acres would 2 incorporate a mix of uses or multifamily residences to occupy at 3 least 20% of the resulting floor area 4
Low Intensity Mixed-Use (Neighborhood Mixed-Use) C.5
Development in this designation should consist of residential 6 and office uses and personal and business services that are 7 compatible with adjoining residential uses. Within the AICUZ, 8 this designation would permit non-residential uses and intensity 9 compatible with the AICUZ. Where residential development is 10 provided, density would range from one dwelling unit per acre 11 to five units per acre. Any development within an envelope 12 exceeding 3 acres would incorporate a mix of uses or 13 multifamily residences to occupy at least 20% of the resulting 14 floor area. 15
Limited Commercial/Industrial (LCI) D.16
Development in this designation should consist of low-17 occupancy commercial and industrial uses appropriate for 18 location in the LPDD. The long-term goal within the LCI is 19 phased elimination of non-conforming uses and structures. This 20 Plan recommends adhering closely, but not exclusively, to 21 national standards for AICUZ compatibility. Specific 22 accommodation is to be made for continued presence within 23 the LCI. Expansion and replacement of non-conforming 24 structures and incompatible uses is to be limited to assure that 25 occupancy does not exceed 25 persons per acre in the APZ-1 26 and 50 persons per acre in the APZ-2. Adaptive reuse of existing 27 nonconforming structures to house conforming uses is 28 encouraged. 29
30
2.6.4 Open Space 31
This Plan identifies open space 1) for which long term 32 protection is important to quality of life, 2) protected by existing 33 conservation easements, 3) platted within approved 34 developments, 4) in public/semi-public ownership, and 5) with 35 large concentrations of sensitive areas protected from 36 disturbance under state, local, and federal laws. Such 37 depictions are drawn generally and will be refined as needed 38 based on field verifications. 39
The Plan also makes specific land use and transportation 40 recommendations based on subwatershed areas and on the 41 existing and potential condition of community and natural 42 resources. In doing so the Plan draws from completed or on-43 going watershed planning efforts, including the St. Mary’s River 44 Watershed Restoration Action Strategy (for all five listed 45 subwatersheds), the Hilton Run Management Plan, and Breton 46 Bay Watershed Restoration Action Plan. These plans address 47 protection, restoration and infrastructure. 48
Sensitive Areas 49
State law restricts development in floodplains, in stream and 50 wetland buffers, and steep slopes and soil types. Sensitive 51 areas have been mapped and are shown in this Plan as 52 preservation areas or open space. 53
Greenways 54
Opportunities for greenway systems have been identified in 55 Chapter 3 as well as on the individual focus area plans. 56
Public lands 57
This category includes county, state and federally owned lands, 58 such as parks, schools, and lands set aside for resource 59 protection or for government functions. Certain land used for 60 utilities is also mapped as public land which is unavailable for 61 development.. 62
63
PC August 2015 2-23 Lexington Park Development District Master Plan
2.7 Zoning Recommendations to Implement to Plan 1
2.7.1 Ordinances 2
To help achieve the goals of this Plan, it is recommended that 3 the zoning ordinance be revised within a year of Plan adoption 4 as follows: 5
Consider revisions to assure a mixture of uses where the Plan A.6 calls for mixed-use development. 7
Update requirements for setbacks, parking, and buffer yards to B.8 achieve an urban rather than a suburban development pattern. 9
Clarify AICUZ regulations to ensure compatibility of uses and C.10 implementation of noise abatement criteria for new 11 construction. 12
Update base and maximum densities in residential and mixed D.13 use zones and establish minimum densities for major 14 subdivisions within these zones. 15
i. Revise the residential-low density transition zone. 16
ii. Establish residential medium density zoning criteria. 17
iii. Revise the residential neighborhood conservation zone as 18 needed. 19
iv. Facilitate infill and assure that residential developments 20 achieve PFA density6 to the extent possible. 21
Retain and enhance regulations that protect community and E.22 environmental character. Provide incentives and establish 23 standards that conserve and accommodate public access to 24 lands within Open Space Network for Lexington Park. 25
Develop and implement design standards necessary to achieve F.26 a walkable urban rather than a car dominated suburban 27 development pattern. 28
6 PFA Standard -The "Smart Growth" Areas Act of 1997, Chapter 759 of the Laws of
Maryland of 1997, requires the State to target funding for "growth-related" projects to Priority Funding Areas (PFAs). To qualify as a PFA, areas must be improved with an actual density of at least 3.5 dwelling units per acre or be planned to permit an average density of at least 3.5 dwelling units per acre. This Plan sets a minimum density standard for residential development in the Development District based on the threshold established by this State law.
i. Assure the interconnection of parcels and development 29 sites with streets, sidewalks, bikeways and trails. 30
ii. Provide standards that address building massing, 31 relationships between on and offsite site features, 32 fenestration, multimodal access, and landscaping. 33
iii. Provide standards for design of new streets and repurposing 34 of existing streets to favor safe and convenient 35 transportation by walking, biking, and transit. 36
2.7.2 Maps 37
Chapter 11 includes a map that illustrates zoning as adopted in 38 2010, plus a map that illustrates zoning map changes necessary 39 to implement this Plan 40
41
PC August 2015 2-24 Lexington Park Development District Master Plan
1
PC August 2015 3-1 Lexington Park Development District Master Plan
3. Physical Setting and the Environment 1
Vision: A high quality of life is achieved through stewardship of the land, water, and air, resulting in sustainable communities and protection of the 2 environment. Land and water resources, including the Chesapeake Bay and its tributaries, are carefully managed to restore and maintain healthy air and 3
water, natural systems, and living resources. Waterways, forests, agricultural areas, open space, natural systems, and scenic areas are conserved. 4
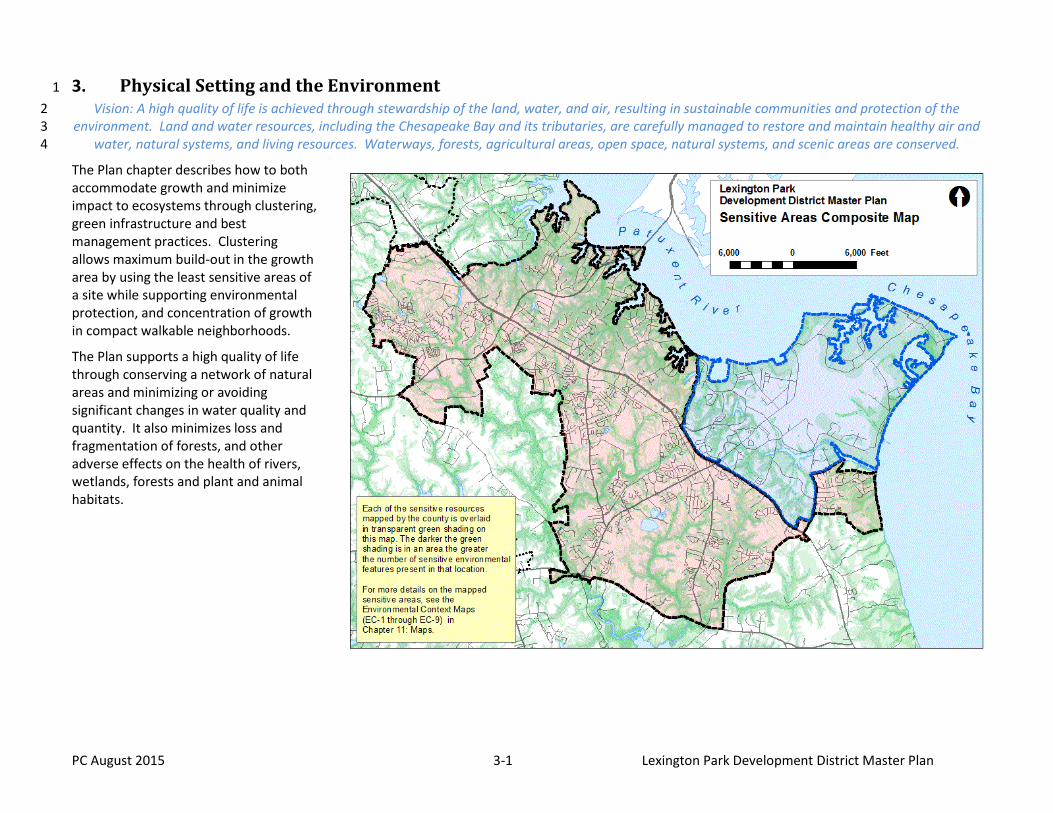
The Plan chapter describes how to both accommodate growth and minimize impact to ecosystems through clustering, green infrastructure and best management practices. Clustering allows maximum build-out in the growth area by using the least sensitive areas of a site while supporting environmental protection, and concentration of growth in compact walkable neighborhoods.
The Plan supports a high quality of life through conserving a network of natural areas and minimizing or avoiding significant changes in water quality and quantity. It also minimizes loss and fragmentation of forests, and other adverse effects on the health of rivers, wetlands, forests and plant and animal habitats.
PC August 2015 3-2 Lexington Park Development District Master Plan
3.1 Background
The Development District is primarily within the St. Mary’s River and the lower Patuxent River watersheds, with portions also within the subwatersheds of Breton Bay. There are also many small streams that have direct drainage to the Chesapeake Bay. Three Notch Road and the commercial strip on either side of the road occupy the narrow flat ridge top that runs roughly along the dividing line between these east and west drainage basins.
Watersheds are identified by the Maryland Department of Natural Resources (DNR) with a numerical coding system. The addition of digits identifies progressively smaller watersheds. The county lies within the Potomac River watershed (DNR 6-digit watershed #021401, which drains to the west), and within the Patuxent River watershed (DNR 6-digit watershed #021311, which drains to the east). Three Notch Road roughly follows the boundary between these two watersheds. The Development District also straddles this divide. Two thirds of the District drains to the St. Mary’s River (DNR 8-digit watershed # 02140103) portion of the Potomac River watershed, and just under a third drains to the lower Patuxent River (DNR 8-digit watershed # 02131101) portion of the Patuxent River watershed. The balance of the area lies within the Breton Bay watershed (DNR 8-digit watershed #02140104), which is also in the Potomac River watershed or within an area of direct drainage to the Chesapeake Bay (DNR 8-digit watershed #02139998). The map at Exhibit EC-4 shows these watersheds as well as the subwatershed boundaries identified by the last four digits of their DNR 12-digit watershed codes on the map and in the text below it.
3.1.1 St. Mary’s River
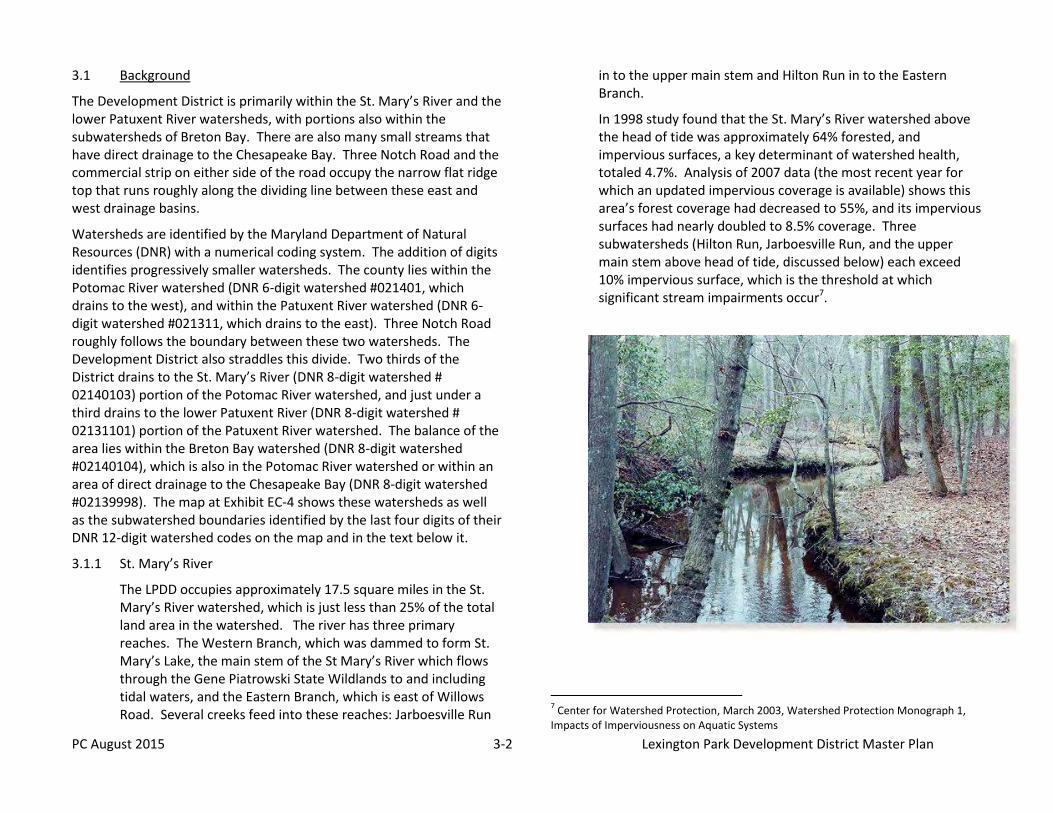
The LPDD occupies approximately 17.5 square miles in the St. Mary’s River watershed, which is just less than 25% of the total land area in the watershed. The river has three primary reaches. The Western Branch, which was dammed to form St. Mary’s Lake, the main stem of the St Mary’s River which flows through the Gene Piatrowski State Wildlands to and including tidal waters, and the Eastern Branch, which is east of Willows Road. Several creeks feed into these reaches: Jarboesville Run
in to the upper main stem and Hilton Run in to the Eastern Branch.
In 1998 study found that the St. Mary’s River watershed above the head of tide was approximately 64% forested, and impervious surfaces, a key determinant of watershed health, totaled 4.7%. Analysis of 2007 data (the most recent year for which an updated impervious coverage is available) shows this area’s forest coverage had decreased to 55%, and its impervious surfaces had nearly doubled to 8.5% coverage. Three subwatersheds (Hilton Run, Jarboesville Run, and the upper main stem above head of tide, discussed below) each exceed 10% impervious surface, which is the threshold at which significant stream impairments occur7.
7 Center for Watershed Protection, March 2003, Watershed Protection Monograph 1,
Impacts of Imperviousness on Aquatic Systems
PC August 2015 3-3 Lexington Park Development District Master Plan
Hilton Run Subwatershed #0715 A.
Hilton Run receives runoff from the Downtown Core and Great Mills Road Corridor. In 2003, the Watershed Legacy Coalition determined that a degree of biological integrity has been maintained in spite of growth, and concluded that the forested core of the subwatershed has protected water quality from serious deterioration and maintained high biological diversity. If this forested core should be removed, and if building activity proceeds in these areas without adequate protection for the aquatic environment, then water quality and biological integrity will be impaired. Controlling growth in the Hilton Run watershed should therefore focus on improving stormwater management where it is inadequate or lacking, and on protecting the forested core through environmental site design.
Jarboesville Run Subwatershed #0717 B.
This Plan recommends a large area for new high and medium intensity mixed-use within this forested subwatershed in the middle of the Central Subarea. This area has significant opportunities for development, but it also has significant steep slopes and bottomland floodplains that should be protected from erosion that would result from deforestation and excessive runoff from new construction. Environmental site design and best management practices must be implemented to minimize degradation of water quality and habitat. Protected lands will be well suited for greenways and passive recreation.
Upper Main Stem of St. Mary’s River Subwatershed #0719 C.
The upper main stem subwatershed includes the public landfill, the airport, and the built-up area of the FDR Corridor discussed in Chapter 2, which results in this subwatershed having the highest overall impervious surface coverage (13.83%) in the St. Mary’s River watershed. Nevertheless, the subwatershed retains significant environmentally sensitive resources, and it provides opportunities for recreational benefits.
The St. Mary’s River bottomland is an extensive, heavily forested floodplain, covering approximately 1,500 acres just west and south of the Development District. This bottomland, most of which is within St. Mary’s River State Park, is home to rare plant and animal species8 (including a federally-listed endangered toad), and is a designated Wetland of Special State Concern. Also located within the State Park is a 520-acre fish management area containing a lake and surrounding forest, which contains rare, threatened and endangered species habitats. Even though the St. Mary’s River bottomland and St. Mary’s River Fish Management Area are outside the Development District, upstream development has high potential for impacts to water quality and habitat resources.
3.1.2 Patuxent River
The Development District occupies only 7.3 square miles of the 67.9 square miles that comprise the St. Mary’s County portion of the Patuxent River watershed. The watershed is characterized by extensive areas of extremely erodible soils on steep slopes. Two of the Patuxent River’s subwatersheds intersect the Development District. Impervious coverage for the #0872 subwatershed, which is entirely within the Development District (including the NAS and the neighborhoods of Woodland Acres, Town Creek, and Esperanza Farms), is 15.62%. Impervious coverage within the #0874 subwatershed is only 6.74% of the area. It includes Mill Cove and the Woods at Myrtle Point. Also within this percentage are areas that are outside of the Development District, such as the majority of the Hollywood Town Center, and neighborhoods south of Cuckold Creek.
8 http://www.mde.state.md.us/assets/document/wetlandswaterways/st.pdf Prioritizing
Sites for Wetland Restoration and Preservation in Maryland, May 18, 2006-Maryland Department of the Environment, pp.27-33.
PC August 2015 3-4 Lexington Park Development District Master Plan
3.2 Resource Protection Issues Affecting Development
3.2.1 Chesapeake Bay Critical Area9
Approximately 960 acres abutting the Patuxent River and its tidal tributaries lie within the Chesapeake Bay Critical Area. Of this area, 33 acres are in an “Intensely Developed Area (IDA)” overlay occupied by Marlay Taylor Water Reclamation Facility. About 530 acres are in a “Limited Development Area (LDA)” overlay, the majority of which includes the Town Creek and Esperanza Farms subdivisions. The remaining 398 acres have a “Resource Conservation Area (RCA)” overlay, which limits residential density to 1 dwelling per 20 acres. The Critical Area regulations allow for “growth allocation” to change RCA to a more intensive overlay in exchange for environmentally sensitive site designs and clustered development in accordance with the underlying zoning.
The Critical Area in the Patuxent River watershed is characterized by extensive stream valleys with steep erodible soils. Often the most effective means to limit erosion is clustering within small development envelopes in areas where impacts to slopes and forest cover can be minimized. The low density residential transitional (RL-T) land use designation limits the ability to cluster10. This Plan recommends changing the RL-T use to the low density residential ( RL) for 1,257 acres of RL-T in the Myrtle Point area, and for 581 acres of RL-T along Point Lookout Road (MD 5). In the area between Millstone Landing Road and the NAS, the Plan recommends changes that will
9 The Chesapeake Bay Critical Area includes all land within 1,000 feet of the Mean High
Water Line of tidal waters or the landward edge of tidal wetlands and all waters of and lands under the Chesapeake Bay’s nontidal tributaries.
10 A significant portion of the RL-T adopted in the 2010 zoning ordinance is in the Critical
Area. The ordinance requires RL-T zoned lots in the Critical Area to be at least two acres in size. While the provision reduces the total number of units, it results in sprawling development with long roads and driveways and a net increase of impacts on steep slopes, erodible soils, forest habitat and water quality. In addition, the provision precludes clustering of development, which is one of the conditions for approval of growth allocation.
result in 196 acres of residential medium density (RM) near the existing schools, 103 acres of RL along Rue Purchase Road, and 267 acres of RL-T for land adjacent to the NAS and in the Critical Area.
3.2.2 Clean Water Act
The Clean Water Act (CWA) establishes minimum water quality standards and requires EPA and state and local jurisdictions to restore or protect water resources according to those standards. The Maryland Department of the Environment (MDE) and DNR have primary responsibility for water quality evaluation in the county. The provisions of the CWA described below may affect some developments in the LPDD.
3.2.3 Impaired Streams
Streams are evaluated for chemical, nutrient, and/or sediment impairments. MDE places impaired streams on the “303(d)” list submitted to EPA. Increased impairment of 303(d) listed streams is prohibited, and can significantly limit development in those watersheds. A “pollution diet” (known as a Total Maximum Daily Load or TMDL) has been set by MDE for impaired streams. A plan prepared by MDE and approved by EPA is intended to reduce or eliminate the impairment.
In watersheds with impaired streams, new developments must not only assure that practices are in place to prevent increased impairment, but may also be asked to accommodate measures that will reduce the existing impairment (for example, they may be asked to cooperate with local or state agencies to install a regional BMP that manages and treats runoff from offsite areas).
The impairment of streams in the LPDD is primarily caused by excess nitrogen, phosphorous and sediments. A Chesapeake Bay TMDL has been established to address these types of impairments, and the requirements to address the Bay TMDL are discussed below at subparts C., Watershed Implementation
PC August 2015 3-5 Lexington Park Development District Master Plan
Plan (WIP), and E., National Pollution Discharge Elimination System (NPDES) Permit.
3.2.4 High quality “Tier II” streams
MDE’s stream evaluation also identifies streams and waters with good water quality and aquatic habitat. These streams are listed as “Tier II” streams and the Clean Water Act requires that Tier II streams water quality and habitat must be maintained. When a project comes forward in a Tier II watershed, an anti-degradation evaluation may be required. Loss of designated and historical uses for the water body must be avoided, and the benefits resulting from development must be demonstrated to outweigh the impacts. Identified impacts may be required to be mitigated in order for the development to be approved.
Figure EC-8 shows the Hilton Run watershed and the upper reaches of the St. Mary’s River main stem; both are Tier II catchment areas.
3.2.5 Watershed Implementation Plan (WIP)
Excess nitrogen, phosphorous and sediment generated by A.existing development has resulted the Bay TMDL. EPA and MDE have required development of local Watershed Implementation Plans (also discussed in section 1.2.3.B) as necessary to meeting the Bay TMDL. The local WIP offers options for funding, implementation, and monitoring necessary to meet the county’s share of the TMDL for nutrient and sediment pollution resulting from existing development. The county’s Phase II WIP strategy was submitted to MDE in 2012.
Financial impacts of the strategy on development and on county B.residents generally are projected to be significant.11 In most cases, septic system upgrades are not likely to be affordable
11
The Phase II WIP submitted by the county provides commentary and detail regarding costs for proposed actions and a number of possible actions necessary to meet its share of the Bay TMDL to be achieved by 2015. The county submission is available for download at http://www.mde.state.md.us/programs/Water/TMDL/TMDLImplementation/Documents/FINAL_PhaseII_Report_Docs/Final_County_WIP_Narratives/St_Marys_WIPII_2012.pdf
unless a comprehensive program to expand sewer capacity and to connect septic systems to sewer can be implemented as recommended in the county’s Phase II WIP strategy.
Existing development is a primary source of current urban, C.septic, and wastewater treatment plant load allocations, and the Development District is slated for significant new development that has the potential to increase pollutant loads. The WIP strategy’s recommendations consider existing and future nutrient and sediment loads within the Development District including:
Natural filters protection and enhancement to reduce D.stormwater runoff help maintain habitat and water quality and improve aesthetic and environmental quality.
Continue existing sensitive areas regulations to limit the impacts E.from new development.
Increase attention to the protection of existing forest cover and F.green infrastructure at the time of development approval and construction.
Enhance use of urban forestry programs to increase forest cover G.in urban areas.
Stormwater management H.
i. Increase tracking, inspection, retrofits and maintenance of existing stormwater management (SWM) facilities to improve water quantity and quality.
ii. Implement environmental site design for new developments.
Septic system and wastewater treatment plant policies and I.programs
i. Connection of existing development served by onsite sewage disposal systems (OSDS) to sewer is recommended; the first priority for connection should be areas within and near Lexington Park where sewer infrastructure exists. Expansion of the Marlay Taylor water reclamation facility may be necessary to provide capacity for a septic connection program as well as to accommodate planned growth within the next twenty years.
PC August 2015 3-6 Lexington Park Development District Master Plan
ii. Updates to the comprehensive water and sewerage plan should address connection of all new and existing development to expanded and enhanced sewage treatment plant infrastructure.
3.2.6 Accounting for Growth
The county not only needs to reduce the nutrient and sediment load coming from existing development, but must also hold the line against new pollution resulting from population growth and new development. Maryland is developing an Accounting for Growth (AFG) policy that will identify actions needed to address increases in the State’s pollution load, and the county will be required to adhere to that policy. The cost of strategies to account for growth is expected to be borne by those building and benefitting from the new development.
3.2.7 National Pollution Discharge Elimination System (NPDES) Permit
An NPDES permit and program for implementation to manage nonpoint source pollution is required, since the county’s population exceeds 100,000. There will be additional stream protection requirements as well as more formal plans and processes for project review to assure that land development minimizes generation of pollutants and maintains stream water quality and existing natural hydrology. Another aspect of the permit may be a state requirement that NPDES jurisdictions develop and implement a fee program to fund stormwater implementation programs.
3.2.8 Conservation of Green Infrastructure
Green infrastructure includes important natural lands that are A.large and intact enough to provide a full range of environmental functions. The primary areas of green infrastructure, called “hubs,” are typically large unfragmented natural areas that are important to maintaining the State or county’s ecological health. They provide habitat for native plants and animals, protect water quality and soils, regulate climate, and perform other critical functions. "Corridors," linear remnants of natural land such as stream valleys and ridges, connect the hubs and
allow animals, seeds, and pollen to move from one area to another. Preserving linkages between the remaining blocks of habitat will ensure the long-term survival and continued diversity of the county’s unique plants, wildlife, and environment.
Conservation and enhancement of green infrastructure will help B.reduce pollution and improve water quality in a cost efficient manner. While single-purpose stormwater infrastructure is designed to move urban stormwater away from the built environment, green infrastructure reduces and treats stormwater at its source, while delivering environmental, social and economic benefits. As discussed in the section above, implementation costs to address the TMDL and NPDES program are expected to be substantial. As Lexington Park develops, these costs can only be expected to grow unless measures are taken to fully account for the impacts of new growth. Maintenance of the natural environment is the most efficient way to reduce costs.
Figure EC-7 in the appendix shows green infrastructure in the C.Development District that includes streams and extensive concentrations of forest cover and sensitive areas. The largest concentration is the St. Mary’s River bottomland. This “hub” extends into the Development District along Jarboesville Run and on the north and south sides of St. Andrew’s Church Road. Smaller hubs occupy areas adjacent to Hilton Run and Pembrook Run. The hubs are interconnected by natural corridors, such as the two that cross St. Andrew’s Church Road near Wildewood and two that cross Great Mills Road. Unless corridors are designated and maintained, the hubs become isolated (especially the smaller hubs) and less able to be ecologically self-sustaining.
It is the goal of this Plan to protect and conserve green areas, D.because doing so is significantly more effective than restoring them. It is also a goal of this Plan to assure that future loss and degradation of resources is avoided or minimized as public or private lands are developed, and that the property or rights of others are not adversely impacted.
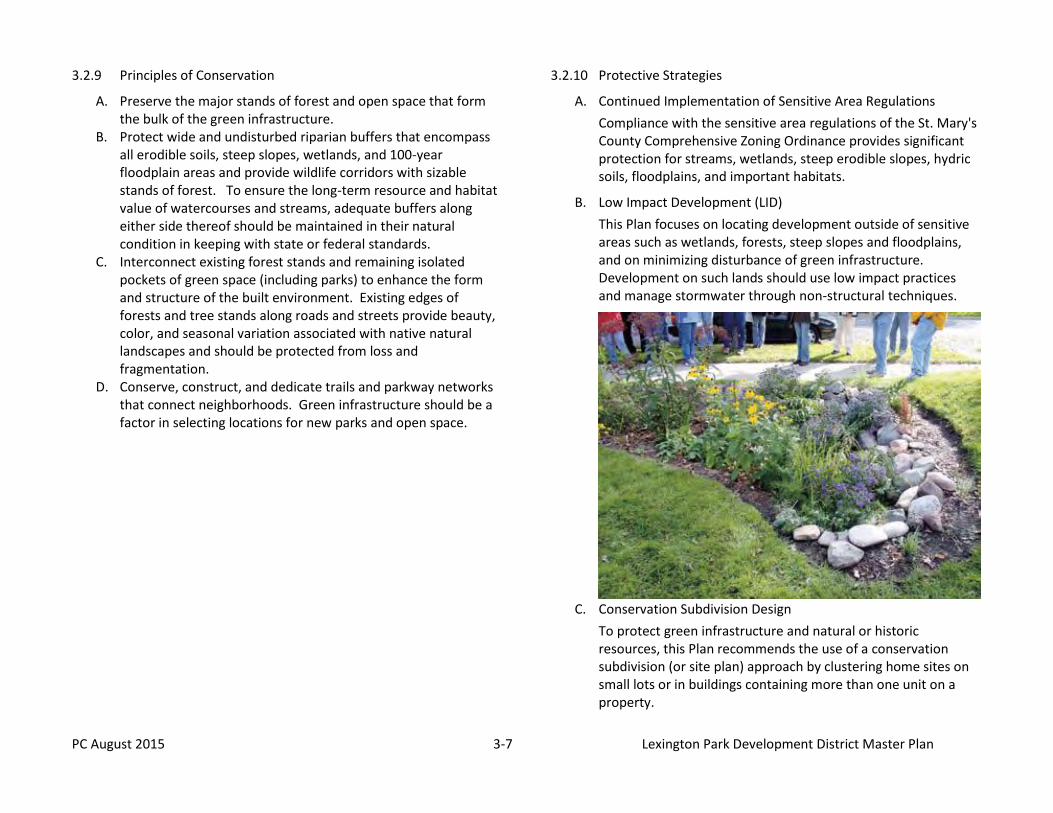
PC August 2015 3-7 Lexington Park Development District Master Plan
3.2.9 Principles of Conservation
Preserve the major stands of forest and open space that form A.the bulk of the green infrastructure.
Protect wide and undisturbed riparian buffers that encompass B.all erodible soils, steep slopes, wetlands, and 100-year floodplain areas and provide wildlife corridors with sizable stands of forest. To ensure the long-term resource and habitat value of watercourses and streams, adequate buffers along either side thereof should be maintained in their natural condition in keeping with state or federal standards.
Interconnect existing forest stands and remaining isolated C.pockets of green space (including parks) to enhance the form and structure of the built environment. Existing edges of forests and tree stands along roads and streets provide beauty, color, and seasonal variation associated with native natural landscapes and should be protected from loss and fragmentation.
Conserve, construct, and dedicate trails and parkway networks D.that connect neighborhoods. Green infrastructure should be a factor in selecting locations for new parks and open space.
3.2.10 Protective Strategies
Continued Implementation of Sensitive Area Regulations A.
Compliance with the sensitive area regulations of the St. Mary's County Comprehensive Zoning Ordinance provides significant protection for streams, wetlands, steep erodible slopes, hydric soils, floodplains, and important habitats.
Low Impact Development (LID) B.
This Plan focuses on locating development outside of sensitive areas such as wetlands, forests, steep slopes and floodplains, and on minimizing disturbance of green infrastructure. Development on such lands should use low impact practices and manage stormwater through non-structural techniques.
Conservation Subdivision Design C.
To protect green infrastructure and natural or historic resources, this Plan recommends the use of a conservation subdivision (or site plan) approach by clustering home sites on small lots or in buildings containing more than one unit on a property.
PC August 2015 3-8 Lexington Park Development District Master Plan
Off-Site Reforestation D.
Where conservation requirements cannot be met on site, then land within or adjacent to mapped green infrastructure should be targeted for reforestation and/or protection through easements.
Stream Restoration Projects E.
Plan and implement stream restoration projects to enhance compliance with state and federal clean water standards for stream segments that fall within or downstream of green infrastructure and assure that development upstream will not undo the benefits of the restoration.
Easements F.
Acquire conservation easements to protect green infrastructure.
Transfer of Development Rights (TDR) Sending Areas G.
Consider revising the TDR program to allow properties with green infrastructure to be “sending areas” to transfer development rights to other parts of the Development District or to other growth areas.
Purchase of Development Rights H.
Prioritize and actively seek preservation through voluntary purchase agreements with property owners.
Land Swaps I.
Consider swapping publicly owned open space land that is more advantageous for development (as guided by the Plan) with green infrastructure lands or for perpetual conservation easements on such lands.
Conservation Incentives J.
Encourage private land conservation and /or the creation of a new private entity to promote the preservation of the remaining forests in the Development District.
1 2
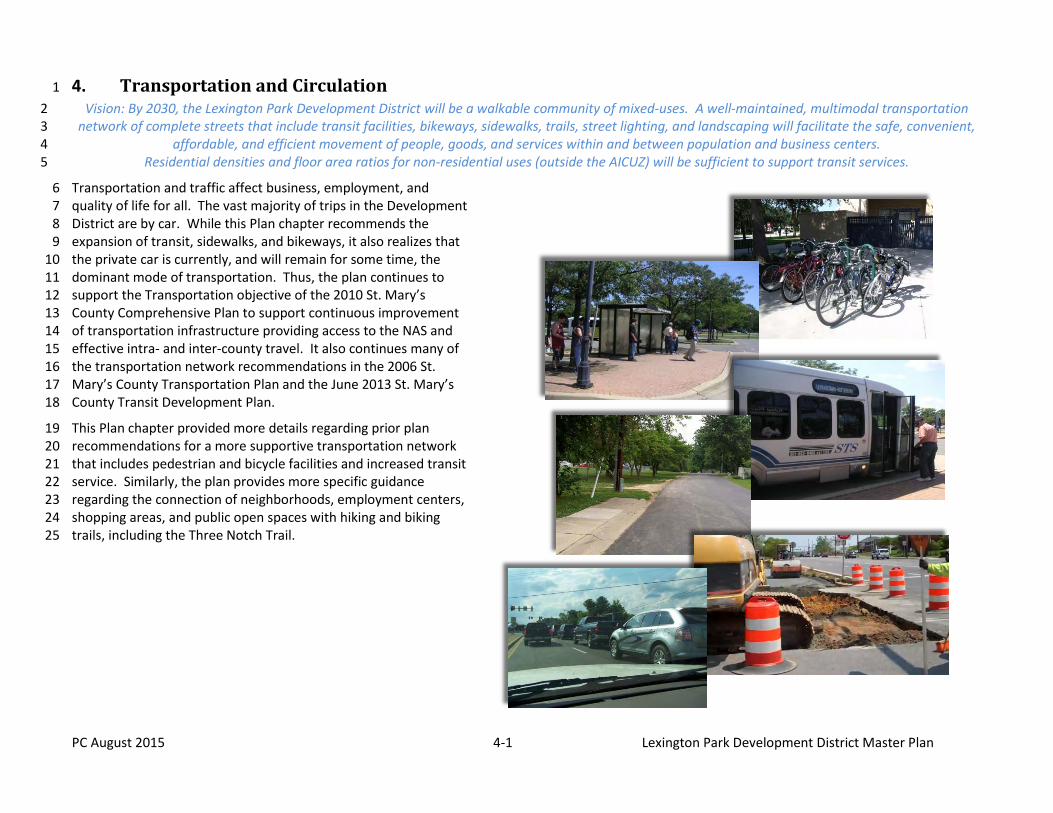
PC August 2015 4-1 Lexington Park Development District Master Plan
4. Transportation and Circulation 1
Vision: By 2030, the Lexington Park Development District will be a walkable community of mixed-uses. A well-maintained, multimodal transportation 2 network of complete streets that include transit facilities, bikeways, sidewalks, trails, street lighting, and landscaping will facilitate the safe, convenient, 3
affordable, and efficient movement of people, goods, and services within and between population and business centers. 4 Residential densities and floor area ratios for non-residential uses (outside the AICUZ) will be sufficient to support transit services. 5
Transportation and traffic affect business, employment, and 6 quality of life for all. The vast majority of trips in the Development 7 District are by car. While this Plan chapter recommends the 8 expansion of transit, sidewalks, and bikeways, it also realizes that 9 the private car is currently, and will remain for some time, the 10 dominant mode of transportation. Thus, the plan continues to 11 support the Transportation objective of the 2010 St. Mary’s 12 County Comprehensive Plan to support continuous improvement 13 of transportation infrastructure providing access to the NAS and 14 effective intra- and inter-county travel. It also continues many of 15 the transportation network recommendations in the 2006 St. 16 Mary’s County Transportation Plan and the June 2013 St. Mary’s 17 County Transit Development Plan. 18
This Plan chapter provided more details regarding prior plan 19 recommendations for a more supportive transportation network 20 that includes pedestrian and bicycle facilities and increased transit 21 service. Similarly, the plan provides more specific guidance 22 regarding the connection of neighborhoods, employment centers, 23 shopping areas, and public open spaces with hiking and biking 24 trails, including the Three Notch Trail. 25
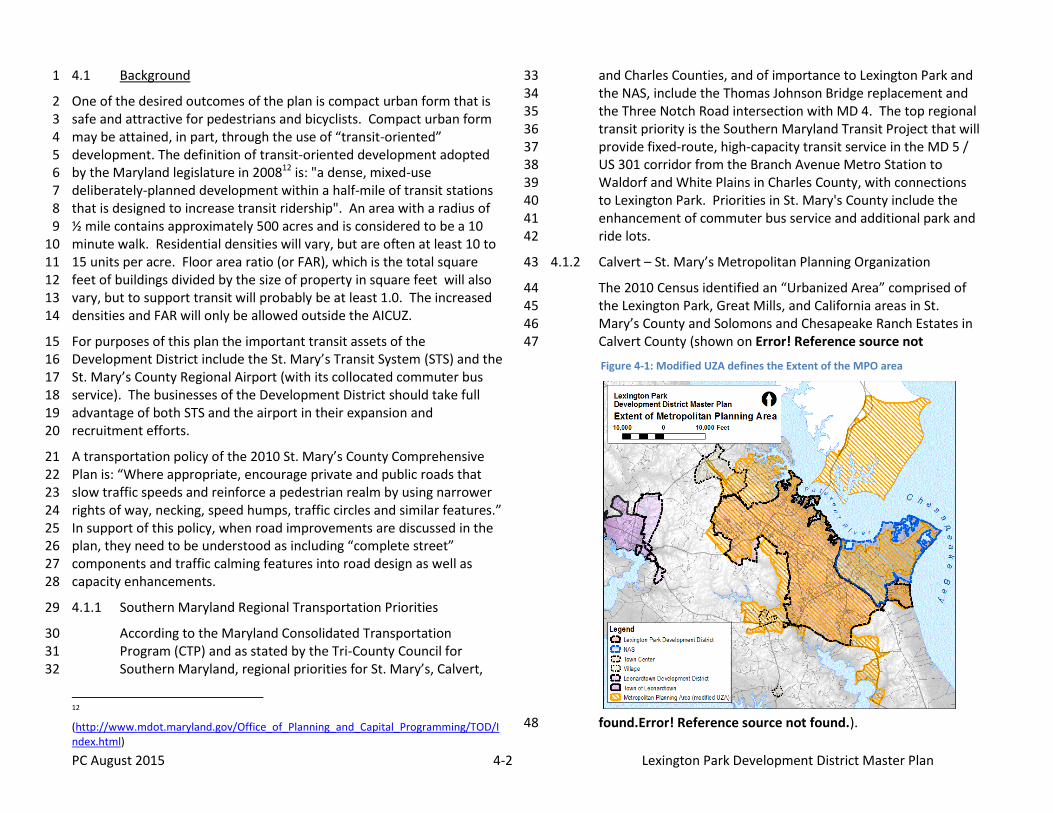
PC August 2015 4-2 Lexington Park Development District Master Plan
4.1 Background 1
One of the desired outcomes of the plan is compact urban form that is 2 safe and attractive for pedestrians and bicyclists. Compact urban form 3 may be attained, in part, through the use of “transit-oriented” 4 development. The definition of transit-oriented development adopted 5 by the Maryland legislature in 200812 is: "a dense, mixed-use 6 deliberately-planned development within a half-mile of transit stations 7 that is designed to increase transit ridership". An area with a radius of 8 ½ mile contains approximately 500 acres and is considered to be a 10 9 minute walk. Residential densities will vary, but are often at least 10 to 10 15 units per acre. Floor area ratio (or FAR), which is the total square 11 feet of buildings divided by the size of property in square feet will also 12 vary, but to support transit will probably be at least 1.0. The increased 13 densities and FAR will only be allowed outside the AICUZ. 14
For purposes of this plan the important transit assets of the 15 Development District include the St. Mary’s Transit System (STS) and the 16 St. Mary’s County Regional Airport (with its collocated commuter bus 17 service). The businesses of the Development District should take full 18 advantage of both STS and the airport in their expansion and 19 recruitment efforts. 20
A transportation policy of the 2010 St. Mary’s County Comprehensive 21 Plan is: “Where appropriate, encourage private and public roads that 22 slow traffic speeds and reinforce a pedestrian realm by using narrower 23 rights of way, necking, speed humps, traffic circles and similar features.” 24 In support of this policy, when road improvements are discussed in the 25 plan, they need to be understood as including “complete street” 26 components and traffic calming features into road design as well as 27 capacity enhancements. 28
4.1.1 Southern Maryland Regional Transportation Priorities 29
According to the Maryland Consolidated Transportation 30 Program (CTP) and as stated by the Tri-County Council for 31 Southern Maryland, regional priorities for St. Mary’s, Calvert, 32
12
(http://www.mdot.maryland.gov/Office_of_Planning_and_Capital_Programming/TOD/Index.html)
and Charles Counties, and of importance to Lexington Park and 33 the NAS, include the Thomas Johnson Bridge replacement and 34 the Three Notch Road intersection with MD 4. The top regional 35 transit priority is the Southern Maryland Transit Project that will 36 provide fixed-route, high-capacity transit service in the MD 5 / 37 US 301 corridor from the Branch Avenue Metro Station to 38 Waldorf and White Plains in Charles County, with connections 39 to Lexington Park. Priorities in St. Mary's County include the 40 enhancement of commuter bus service and additional park and 41 ride lots. 42
4.1.2 Calvert – St. Mary’s Metropolitan Planning Organization 43
The 2010 Census identified an “Urbanized Area” comprised of 44 the Lexington Park, Great Mills, and California areas in St. 45 Mary’s County and Solomons and Chesapeake Ranch Estates in 46 Calvert County (shown on Error! Reference source not 47
found.Error! Reference source not found.). 48
Figure 4-1: Modified UZA defines the Extent of the MPO area
PC August 2015 4-3 Lexington Park Development District Master Plan
Federally designated Urbanized Areas are required to form a 1 Metropolitan Planning Organization (MPO); Calvert and St. 2 Mary’s Counties, along with the Maryland Department of 3 Transportation, established the Calvert – St. Mary’s MPO (C-4 SMMPO) in 2013. Funds for transportation planning are 5 available to the two counties, and there may be an increase in 6 transit funding through the C-SMMPO. Since Lexington Park is 7 the largest St. Mary’s County community within the Urbanized 8 Area, a significant portion of the MPO funds could be used to 9 help implement the transportation recommendations in this 10 Plan. 11
4.2 Roads and Streets 12
Major state and county roads in the Lexington Park 13 Development District include: Three Notch Road (MD 235), 14 Great Mills Road (MD 246), Chancellor’s Run Road (MD 237), 15 Patuxent Beach Road (MD 4), St. Andrew’s Church Road (MD 4), 16 Pegg Road, Buck Hewitt Road, Willows Road, Hermanville Road 17 and FDR Boulevard. Technical information on these roads is 18 available in the St. Mary’s County Transportation Plan. Major 19 roads, especially Three Notch Road and Great Mills Road, are 20 heavily traveled, and drivers should expect delays in the 21 morning and evening peak hours. 22
Street improvements discussed in this Plan are based on the 23 concept of the Complete Street13, which has potential to 24 increase transportation options. 25
Lists of recommended road construction projects for the 26 Development District often begin with “complete FDR 27 Boulevard.” Information about the FDR Boulevard project is on 28 the Public Works and Transportation website, including 29 illustrations of the Complete Streets concept that is included in 30 the design for this project. This design could become the 31 prototype for other road projects in Lexington Park. 32
13
Complete street Information may be found online at this URL: http://www.smartgrowthamerica.org/complete-streets
Because FDR Boulevard will traverse such large residential 33 developments as Laurel Glen, Hickory Hills, and San Souci, it is 34 designed to limit traffic speeds and to create a pedestrian and 35 bicycle friendly atmosphere. Sidewalks, bicycle 36 accommodations, crosswalks, roundabouts, medians and 37 pedestrian refuge areas will make this roadway compatible with 38 the adjacent residential uses. 39
Public participation is an important component of the process 40 of selecting, prioritizing, and designing road projects. It is 41 important for the residents and businesses of the Development 42 District to stay informed about future road projects. When 43 meetings are held to discuss these projects, individual residents 44 as well as groups are encouraged to attend and present their 45 opinions and ideas. 46
4.2.1 Complete Streets and Traffic Calming Policy 47
“Complete Street” designs improve safety, lower transportation 48 costs, provide alternatives to private cars, encourage health 49 through walking and biking, create a sense of place, improve 50 social interaction, and generally improve adjacent property 51 values. It is appropriate to implement this policy throughout 52 the four focus areas identified in Chapter 2 and, on a case by 53 case basis, to evaluate the need for complete streets and traffic 54 calming for development elsewhere within the Lexington Park 55 Development District. 56
4.2.2 Complete Streets and traffic calming should be applied to all 57 public transportation projects within the LPDD such as, but not 58 limited to, new road construction, reconstruction, retrofits, 59 upgrades, resurfacing and rehabilitation. This policy also covers 60 privately built roads intended for public use. 61
New and infill development and redevelopment should provide A.62 a street network designed and operated to enable safe, 63 attractive, and comfortable access and travel for all users, 64 including pedestrians, bicyclists, motorists and public transport 65 users of all ages and abilities. 66
PC August 2015 4-10 Lexington Park Development District Master Plan
Existing roads should be considered for modifications to incorporate complete streets concepts and traffic calming in order to expand the B.1 sidewalk and bikeway networks even when there are no planned improvements to automobile travel lanes. 2
Exemptions to the complete streets and traffic calming policy may be documented in writing by the Director of Public Works with supporting C.3 data that indicates the reason for the decision and are limited to the following: 4
i. Non-motorized users are prohibited on the roadway. 5
ii. There is documentation that there is an absence of current and future need. 6
iii. The cost of accommodations for a particular mode is excessively disproportionate to the need and potential benefit of a project. 7
iv. The project involves ordinary maintenance activities designed to keep assets in acceptable condition (e.g. cleaning, sealing, spot repairs, 8 patching and surface treatments, such as micro-surfacing) 9
4.2.3 The following provides criteria for including complete street into site designs and identifies types of traffic calming devices that should be 10 considered. 11
Site designs should accommodate the existing and planned transportation network (planned road connections, public transit routes, bike lanes, A.12 hiker/biker trails, greenways, etc.) including conserving the rights- of- way for potential rapid transit routes along primary corridors. 13
Street designs should provide well defined and separate travel paths for vehicles, bikes, and pedestrians; accommodate bus stops. B.14 Provide a safe and inviting pedestrian landscape by occupying the area between streets and buildings and between the buildings and parking C.15
lots with street trees, pedestrian amenities, sidewalks, and landscaping. 16 Provide visually and texturally distinct crosswalk surfaces where pedestrian/bike paths and sidewalks must cross streets. D.17 Integrate stormwater management into the streetscape as means to minimize flooding of the transportation infrastructure and to protect and E.18
improve water quality. 19 Provide sidewalks and pedestrian/bike paths extended to the edges of the property in a manner that allows each new project to seamlessly F.20
connect to existing walks and paths on adjacent sites. 21 Specifically provide continuous walkway/crosswalk connections (with particular attention to handicapped accessibility) between uses within G.22
commercial and mixed-use developments and between non-residential development and adjacent residential developments. 23 Where pedestrian connections are currently missing, provide infill sidewalks and crosswalks when public roads are repaved or widened. H.24
Use traffic calming measures such as pavement width reduction to slow traffic and increase crossing safety, traffic circles at primary cross I.25 streets, crosswalks and canopy trees along streets. 26
4.2.4 Access Management 27
Access management refers to the need to provide the traveling public with safe and convenient travel options. Access management should be 28 thought of as an attempt to balance the need to provide good mobility for through traffic with the requirement for reasonable access to 29 adjacent land uses. 30
According to the Maryland State Highway Access Manual, transportation officials are showing more interest in access management as a means 31 of addressing the problems presented by traffic congestion, safety issues, and the rising cost and complexity of road improvements. 32
Arterial and collector roads in a Development District have two primary functions. They must serve commuters traveling to and from places of 33 employment, and they must provide automobile access to businesses. It is important that these two functions be balanced. If there are not 34 enough driveways to and from the businesses, commuters will not stop; however, too many driveways or intersections on the main routes 35
PC August 2015 4-10 Lexington Park Development District Master Plan
increase the length of the commute time. When congestion becomes unacceptably high, commuters will not leave the road to shop because of 1 the difficulty (and delay) of getting back on their journey to or from work. More important than slow travel times is the fact that every driveway 2 is a conflict point where turning movements can result in accidents. 3
4.2.5 The use of access management techniques should be considered in all road construction projects to reduce traffic congestion in urbanized areas, 4 to improve safety, reduce travel times, and enhance site accessibility and to protect the value of private investment in development and support 5 the long-term appeal and vitality of business and residential land uses in already-developed areas. 6
4.2.6 The following provides criteria for including access control into site designs as recommended by policies in the 2010 St. Mary’s County 7 Comprehensive Plan: 8
Discourage site design that requires vehicles to return to major roads in order to move from one project to an adjacent project (except when A.9 environmental constraints make connection impossible); and 10
Encourage vehicle, bicycle, and pedestrian connections between adjacent developments; B.11 Minimize the number of outlets to major roads and highways. C.12
13
PC August 2015 4-10 Lexington Park Development District Master Plan
4.3 Public Transportation (Transit System 1
Transforming the Development District into a “community” depends in part on a much more developed public transit system, which goes hand-in-hand 2 with transit-oriented development 3
This Plan supports the realization of the objective in the 2010 St. Mary’s County Comprehensive Plan to “Encourage use of transit in order to minimize 4 trips, help reduce emissions, increase economic opportunities for persons without motor vehicles, and provide service to the elderly and those with 5 medical needs.” 6
The St. Mary’s Transit System (STS) provides fixed route and demand response services to all residents and paratransit service for disabled and elderly 7 residents. An additional transit service in the Development District is the Maryland Transit Administration commuter bus service between the Regional 8 Airport and Washington, D.C., during morning and evening peak hours. 9
There are two park and ride lots in the Development District: one at Tulagi Place (operated by St. Mary’s County) and the other at the St. Mary's County 10 Regional Airport (operated by the Maryland Transit Authority). 11
The 2013 St. Mary’s County Transit Development Plan14, showed that in FY 2012 the STS provided approximately 425,000 passenger trips through eight 12 fixed routes, response demand, and contract services. The busiest route is the Great Mills loop, which is in Lexington Park; and the greatest 13 concentrations of transit-dependent persons are in the Lexington Park area and the nearby communities of California and Hollywood. The associated 14 survey identified a regular ridership base that uses the system for work and personal errands and that has limited mobility options with 85% of surveyed 15 riders using STS services at least once a week, with the most popular response being five to six days per week. Identified unmet transportation needs for 16 St. Mary’s County related to public transit include: 17
Expand transit availability for all trip purposes in the evenings (late shifts) and on weekends. 18
Provide additional service options for social and shopping trips, particularly for older adults. 19
Centralize/promote easy access to information concerning services, trip options, and providers. 20
Expand demand-response/specialized services, particularly for dialysis. 21
Expand medical trips outside of the County, especially return trips from dialysis. 22
In the distant future there remains the prospect of light rail transit or bus rapid transit into Waldorf as connections improve between that community 23 and the transit system serving Washington, D.C. The St. Mary's County Comprehensive Plan advises preserving the County Commissioners’ railroad right 24 of way for such long range purposes. 25
4.4 Sidewalks 26
The Transportation Plan provides a general description of the county’s sidewalk system that is also applicable to Lexington Park: “Sidewalk networks 27 should be constructed between neighborhoods, schools, and parks. There are several neighborhood streets with sidewalks but no connection to 28 adjacent collector roadways. Additionally, many sidewalks are not ADA compatible, and some sidewalks are in need of repair or are overgrown with 29 foliage.” 30
14
http://www.co.saint-marys.md.us/docs/TDPFinalReport-BOCCapproved6-25-2013.pdf
PC August 2015 4-10 Lexington Park Development District Master Plan
The 2005 Lexington Park Development District Master Plan (page 50) reported that the areas with the most sidewalks are the Great Mills Road corridor 1 and the residential areas at the northern end of the Chancellor’s Run Road corridor. It then states that “conditions for pedestrians are poor for the most 2 part: sidewalks are close to the roadway with no buffer between vehicles and pedestrians; sidewalks are not continuous; and the large number of curb 3 cuts creates unsafe conditions.” 4
5
PC August 2015 4-10 Lexington Park Development District Master Plan
The areas in Lexington Park identified as high priority for sidewalks in the Transportation Plan are listed below. These segments, as well as those shown 1 on Figure DC-3b, should be constructed to help implement this Plan. 2
FDR Boulevard – Three Notch Road to Willows Road. 3
Along Great Mills Road – complete the sidewalk network where necessary. 4
Willows Road from South Shangri-La Dr. to Point Lookout Road. 5
Carver School Boulevard (east side). 6
Buck Hewitt Road – complete missing sections from Chancellor’s Run Road to Three Notch Road. 7
Great Mills Swimming Pool to Great Mills Road. 8
Pegg Road – entire length. 9
4.5 Bikeways 10
The vision for bicycles in the 2006 Transportation Plan is to “promote a safe, comfortable and bicycle friendly environment which encourages people to 11 use bicycle facilities both for transportation and leisure purposes.” The three goals for bikeways in the Transportation Plan are 12
To enhance public awareness of the bicycle so that it is considered a viable and safe mode of transportation. 13
To create and maintain an extensive network of bikeways, that will enhance access to cultural resources throughout the county including residential, 14 recreational, educational, institutional and commercial areas within St. Mary’s County. 15
To provide support (including safety and security) for people and their bicycles once they reach their destinations. 16
A map of countywide bikeways is included as Figure VI.2.in the Transportation Plan. The bikeways are graded for bicycle riding conditions using the 17 Bicycle Level of Comfort (BLOC) model. “The BLOC model reflects a perception of compatibility associated with road width, shoulder width, traffic 18 volume, pavement surface condition, motor vehicle speed and type, and presence or absence of on-street parking.” 19
This Plan supports creation of a bicycle-friendly environment within the Development District in accordance with the vision and goals from the 20 Transportation Plan. The Transportation Plan map and BLOC model should be used as a baseline in a future detailed plan for a safe and comprehensive 21 bicycle network. 22
4.6 Trails 23
Planned and existing trails range from footpaths to fully engineered and paved pathways. Trails are recommended in the Plan as a means of 24 transportation and also an opportunity for exercise. Their utility in the interconnection of communities and destinations within the Development District 25 may vary considerably, but they are fostered in the plan as a low impact transportation alternative. A complete description of existing and planned 26 trails within the Development District may be found at Figure DC-3b. 27
PC August 2015 4-10 Lexington Park Development District Master Plan
4.7 Airport 1
One of the strengths of the Development District is the regional airport. Business associations should emphasize the ease of access to the airport in 2 promoting the area. 3
The St. Mary’s County Regional Airport is a general aviation facility with annual aircraft operations between 38,000 and 56,000 takes-offs and landings. 4 Services provided at the airport include T-hangars and tie-downs, fuel sales, maintenance and repair, flight instruction, aircraft sales and rentals, charter 5 flights, and air ambulance. 6
The airport provides important benefits to the county that include 265 total jobs, personal income of $9.9 million, total business revenue of $14.5 7 million, local purchases of $6.1 million, and tax revenue of $994,000 (“The Economic Impact of Airports,” Maryland Department of Transportation, 8 Maryland Aviation Administration, 2013). In addition to its direct economic impact, the airport helps stimulate business development, is used by law 9 enforcement, and is used for medical evacuation. The Airport Layout Plan (ALP) approved by the Federal Aviation Administration depicts the 10 recommended location and configuration of facilities that will meet the twenty year operation needs in conformance with the airport master plan. 11
4.8 Objectives, Policies and Priorities 12
4.8.1 Transportation Objectives (pedestrian, bicycle, mass transit, automobile, aviation): 13
Provide for a safe, convenient, and efficient motorized and non-motorized transportation system throughout the Lexington Park Development A.14 District by creating a safe pedestrian, bikeway, and trail system connecting residential neighborhoods with transit stops, schools, parks, 15 employment, civic uses, and shopping. 16
Increase awareness of the accessibility of the regional airport and assist in the implementation of the airport master plan. B.17
4.8.2 Provide efficient mass transit and paratransit (i.e., transit with flexible routes and schedules) services with safe and convenient transit stops, and 18 improve accommodation of riders with special needs. 19
4.8.3 Transportation Policies and Implementation Strategies 20
Within 5 years of the adoption of the plan, complete the construction of FDR from First Colony to Pegg Road. A.21 Within 5 to 10 years of the adoption of the plan, develop and implement access management plans for major state roads. B.22 Conduct a study of and prepare an implementation plan for bikeways and pedestrian ways (sidewalks and trails). C.23
i. Within 18 months of the adoption of the plan initiate a sidewalk analysis. 24
a. Propose new links where gaps are found. 25 b. Determine needs for curb extensions (bump outs), islands, or other safety zones for pedestrians will be established to provide 26
comfortable and safe walkways across multi-lane, high traffic volume roads. 27 c. Implement the recommendations of an ADA (Americans with Disabilities Act) assessment and transition plan for sidewalks and ramps 28
along state and county roads. 29
30
PC August 2015 4-10 Lexington Park Development District Master Plan
ii. Identify locations for features such as benches and appropriate lighting along sidewalks, bikeways, and trails. Within 6 months of the 1 adoption of the plan initiate a study to: 2
a. Identify locations for new and improved bikeways within the Development District. 3 b. Identify options and the need for the high priority bikeway projects identified by the study. 4 c. Recommend traffic calming techniques to allow bicyclists to safely share travel lanes with automobile traffic when dedicated bikeways 5
are not feasible. 6
iii. Within 12 months of the adoption of the plan initiate a trails and greenways study to: 7
a. Identify locations and priorities for new and improved trails within the Development District. 8 b. Consider trails as a circulation element for development. Ensure provision of easements for public use of these trails. Prohibit fences, 9
walls or other barriers that prevent public access to trails. 10 c. Include the provision and interconnection of trails in long-range plans of St. Mary’s County Departments of Public Works and 11
Transportation and Recreation and Parks to include funding for constructions. 12 d. Develop and implement a schedule for the interconnection of the existing and proposed new trails 13
iv. Within 2 years of the adoption of the plan, seek funding for recommended projects. 14
Implement the recommendations of the latest completed transit study and other provisions to increase STS ridership. D.15
i. Provide safe and convenient covered waiting areas and easy transfer to other modes of transportation. Transit stops will include route 16 information, benches, bicycle parking, trash receptacles, and appropriate lighting. 17
ii. Implement system-wide efficiency improvements for connectivity and transfers. 18
iii. Transition to electronic fare boxes compatible with smart cards. 19
iv. Transition to 30-foot, heavy duty transit vehicles. 20
v. Sign the stops in Lexington Park and other locations in the urbanized area (i.e., discontinue the flag stop system). 21
vi. Add bus stop safety improvements. 22
vii. Increase coordination with Calvert and Charles Counties. 23
viii. Work with NAS to allow base access for STS buses. 24
ix. Increase park and ride / commuter bus connections. 25
x. Extend evening hours. 26
xi. Increase the frequency of buses to and from Lexington Park and extend the hours of operation. 27
xii. Coordinate with St. Mary’s Hospital for STS service to the Health Enterprise Zone. 28
xiii. Construct improved facilities at Tulagi Place. 29
xiv. Provide real-time bus information. 30
xv. Equip more buses with bicycle racks. 31
Continue to protect the airport from the encroachment of incompatible land uses and structures. E.32
4.8.4 Implementation Priorities Necessary to Achieve the Vision 33
PC August 2015 4-10 Lexington Park Development District Master Plan
A. This Plan supports but also refines and expands upon the list of road projects recommended in the adopted 2006 Transportation Plan. 1
B.2
PC August 2015 4-10 Lexington Park Development District Master Plan
Table 4-1 on the following pages identifies road and street C.1 connections needed to implement this Plan. These proposed 2 road improvements do not include all service or internal roads 3 and inter-parcel connections necessary to provide complete 4 streets networks within developments, to provide increased 5
circulation between adjacent properties, and to manage access 6 onto major roadways. These connections are considered on a 7 case-by-case basis at the time of subdivision or site plan 8 development. 9
10
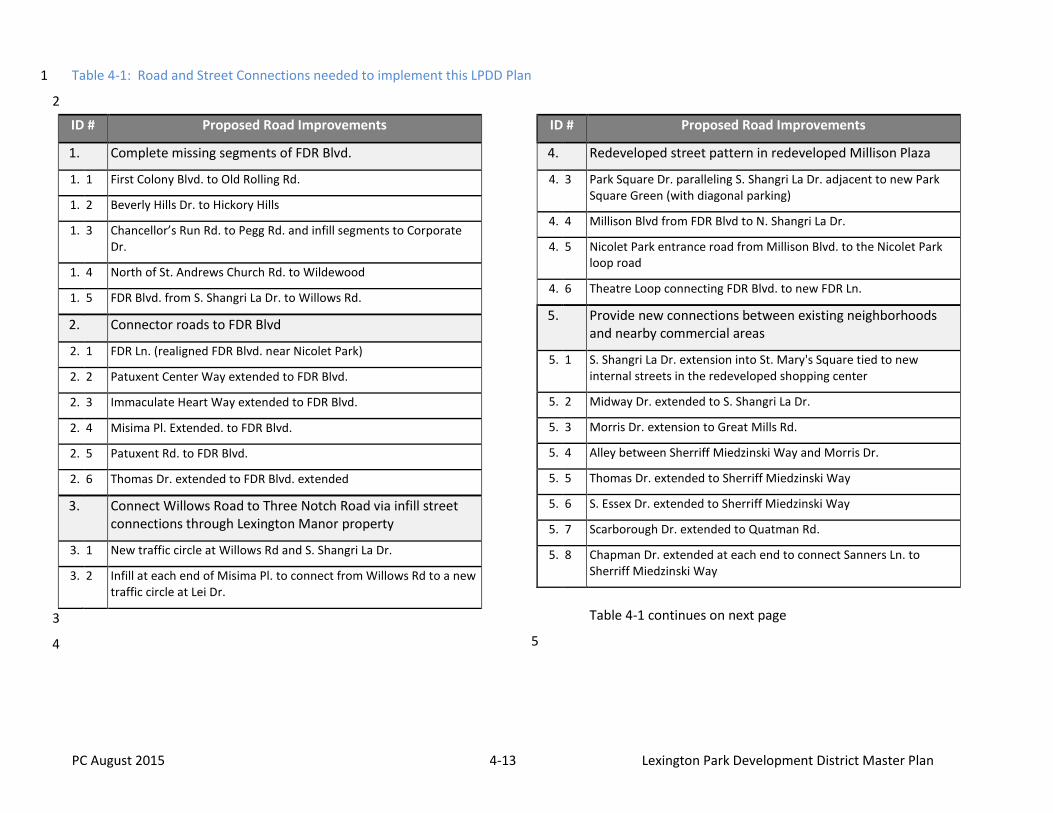
PC August 2015 4-13 Lexington Park Development District Master Plan
Table 4-1: Road and Street Connections needed to implement this LPDD Plan 1
2
ID # Proposed Road Improvements
1. 0 D.Complete missing segments of FDR Blvd.
1. 1 First Colony Blvd. to Old Rolling Rd.
1. 2 Beverly Hills Dr. to Hickory Hills
1. 3 Chancellor’s Run Rd. to Pegg Rd. and infill segments to Corporate Dr.
1. 4 North of St. Andrews Church Rd. to Wildewood
1. 5 FDR Blvd. from S. Shangri La Dr. to Willows Rd.
2. 0 E.Connector roads to FDR Blvd
2. 1 FDR Ln. (realigned FDR Blvd. near Nicolet Park)
2. 2 Patuxent Center Way extended to FDR Blvd.
2. 3 Immaculate Heart Way extended to FDR Blvd.
2. 4 Misima Pl. Extended. to FDR Blvd.
2. 5 Patuxent Rd. to FDR Blvd.
2. 6 Thomas Dr. extended to FDR Blvd. extended
3. 0 F.Connect Willows Road to Three Notch Road via infill street connections through Lexington Manor property
3. 1 New traffic circle at Willows Rd and S. Shangri La Dr.
3. 2 Infill at each end of Misima Pl. to connect from Willows Rd to a new traffic circle at Lei Dr.
3
4
ID # Proposed Road Improvements
4. 0 G.Redeveloped street pattern in redeveloped Millison Plaza
4. 3 Park Square Dr. paralleling S. Shangri La Dr. adjacent to new Park Square Green (with diagonal parking)
4. 4 Millison Blvd from FDR Blvd to N. Shangri La Dr.
4. 5 Nicolet Park entrance road from Millison Blvd. to the Nicolet Park loop road
4. 6 Theatre Loop connecting FDR Blvd. to new FDR Ln.
5. 0 H.Provide new connections between existing neighborhoods and nearby commercial areas
5. 1 S. Shangri La Dr. extension into St. Mary's Square tied to new internal streets in the redeveloped shopping center
5. 2 Midway Dr. extended to S. Shangri La Dr.
5. 3 Morris Dr. extension to Great Mills Rd.
5. 4 Alley between Sherriff Miedzinski Way and Morris Dr.
5. 5 Thomas Dr. extended to Sherriff Miedzinski Way
5. 6 S. Essex Dr. extended to Sherriff Miedzinski Way
5. 7 Scarborough Dr. extended to Quatman Rd.
5. 8 Chapman Dr. extended at each end to connect Sanners Ln. to Sherriff Miedzinski Way
Table 4-1 continues on next page
5
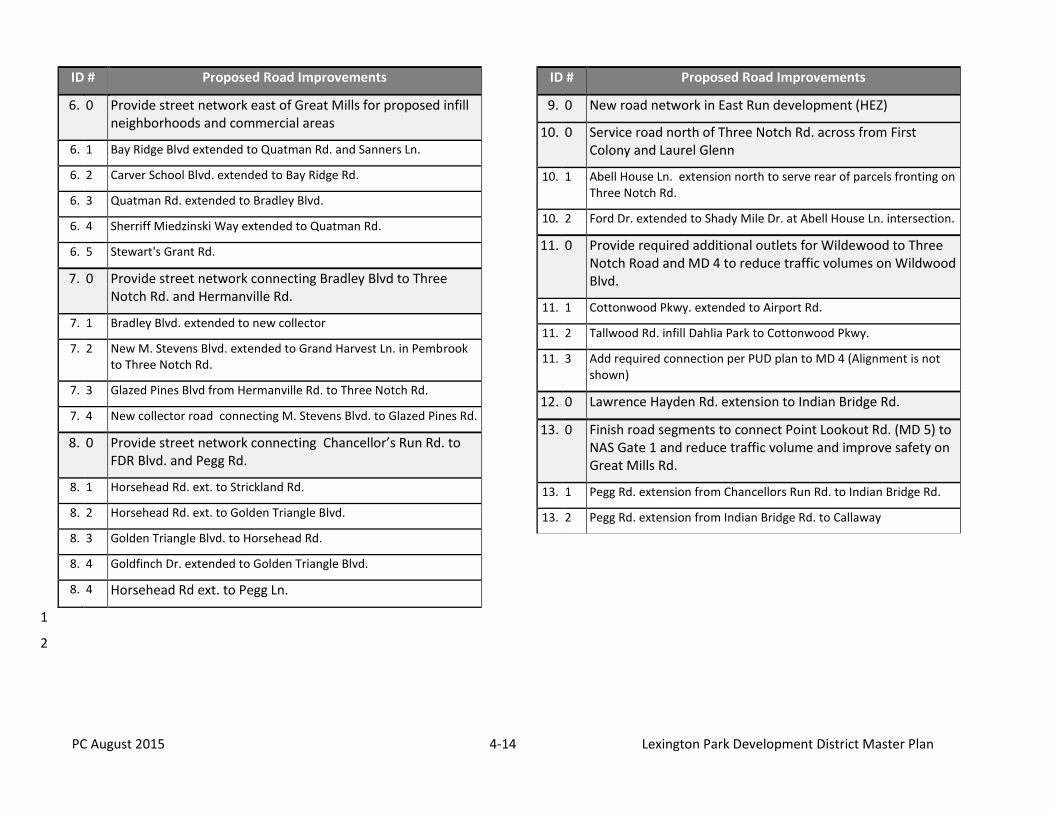
PC August 2015 4-14 Lexington Park Development District Master Plan
ID # Proposed Road Improvements
6. 0 Provide street network east of Great Mills for proposed infill neighborhoods and commercial areas
6. 1 Bay Ridge Blvd extended to Quatman Rd. and Sanners Ln.
6. 2 Carver School Blvd. extended to Bay Ridge Rd.
6. 3 Quatman Rd. extended to Bradley Blvd.
6. 4 Sherriff Miedzinski Way extended to Quatman Rd.
6. 5 Stewart's Grant Rd.
7. 0 Provide street network connecting Bradley Blvd to Three Notch Rd. and Hermanville Rd.
7. 1 Bradley Blvd. extended to new collector
7. 2 New M. Stevens Blvd. extended to Grand Harvest Ln. in Pembrook to Three Notch Rd.
7. 3 Glazed Pines Blvd from Hermanville Rd. to Three Notch Rd.
7. 4 New collector road connecting M. Stevens Blvd. to Glazed Pines Rd.
8. 0 Provide street network connecting Chancellor’s Run Rd. to FDR Blvd. and Pegg Rd.
8. 1 Horsehead Rd. ext. to Strickland Rd.
8. 2 Horsehead Rd. ext. to Golden Triangle Blvd.
8. 3 Golden Triangle Blvd. to Horsehead Rd.
8. 4 Goldfinch Dr. extended to Golden Triangle Blvd.
8. 4 Horsehead Rd ext. to Pegg Ln.
ID # Proposed Road Improvements
9. 0 New road network in East Run development (HEZ)
10. 0 Service road north of Three Notch Rd. across from First Colony and Laurel Glenn
10. 1 Abell House Ln. extension north to serve rear of parcels fronting on Three Notch Rd.
10. 2 Ford Dr. extended to Shady Mile Dr. at Abell House Ln. intersection.
11. 0 Provide required additional outlets for Wildewood to Three Notch Road and MD 4 to reduce traffic volumes on Wildwood Blvd.
11. 1 Cottonwood Pkwy. extended to Airport Rd.
11. 2 Tallwood Rd. infill Dahlia Park to Cottonwood Pkwy.
11. 3 Add required connection per PUD plan to MD 4 (Alignment is not shown)
12. 0 Lawrence Hayden Rd. extension to Indian Bridge Rd.
13. 0 Finish road segments to connect Point Lookout Rd. (MD 5) to NAS Gate 1 and reduce traffic volume and improve safety on Great Mills Rd.
13. 1 Pegg Rd. extension from Chancellors Run Rd. to Indian Bridge Rd.
13. 2 Pegg Rd. extension from Indian Bridge Rd. to Callaway
1
2
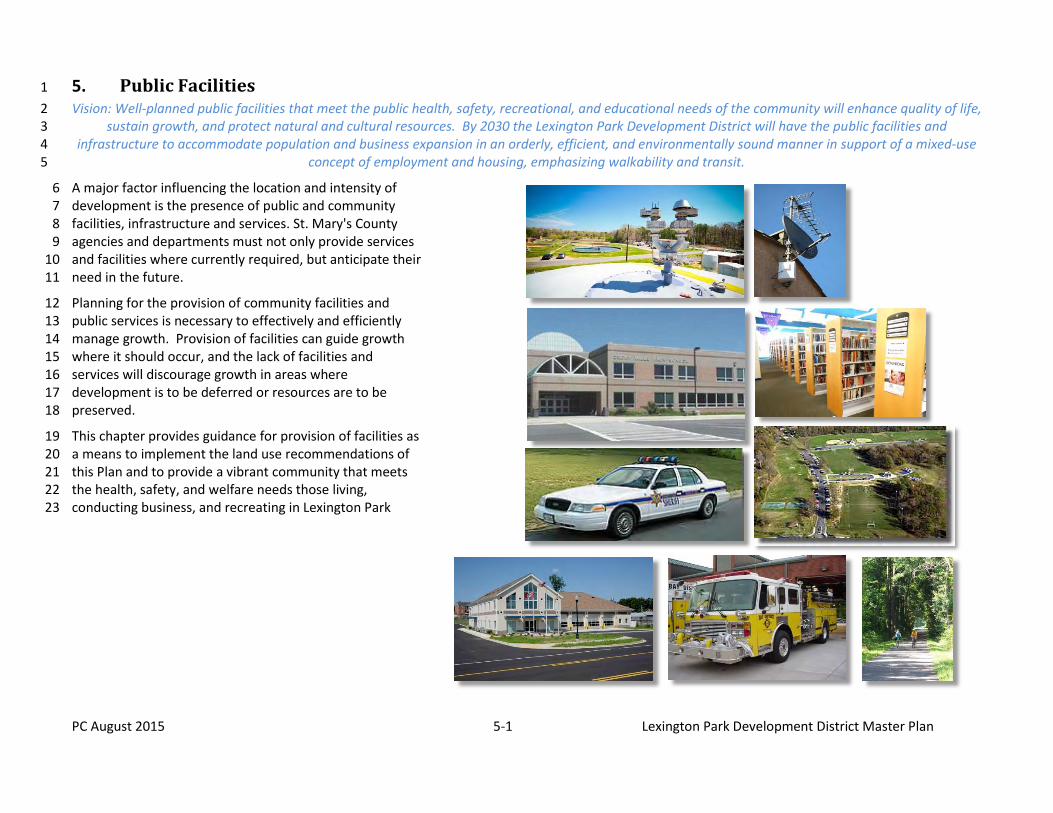
PC August 2015 5-1 Lexington Park Development District Master Plan
5. Public Facilities 1
Vision: Well-planned public facilities that meet the public health, safety, recreational, and educational needs of the community will enhance quality of life, 2 sustain growth, and protect natural and cultural resources. By 2030 the Lexington Park Development District will have the public facilities and 3
infrastructure to accommodate population and business expansion in an orderly, efficient, and environmentally sound manner in support of a mixed-use 4 concept of employment and housing, emphasizing walkability and transit. 5
A major factor influencing the location and intensity of 6 development is the presence of public and community 7 facilities, infrastructure and services. St. Mary's County 8 agencies and departments must not only provide services 9 and facilities where currently required, but anticipate their 10 need in the future. 11
Planning for the provision of community facilities and 12 public services is necessary to effectively and efficiently 13 manage growth. Provision of facilities can guide growth 14 where it should occur, and the lack of facilities and 15 services will discourage growth in areas where 16 development is to be deferred or resources are to be 17 preserved. 18
This chapter provides guidance for provision of facilities as 19 a means to implement the land use recommendations of 20 this Plan and to provide a vibrant community that meets 21 the health, safety, and welfare needs those living, 22 conducting business, and recreating in Lexington Park 23
PC August 2015 5-2 Lexington Park Development District Master Plan
5.1 Public water and Sewerage facilities 1
Vision: All structures requiring plumbing are connected to 2 central sewer and water services. 3
5.1.1 Sewerage 4
The Lexington Park Development District is within the Pine Hill 5 Run (No. 8) sanitary district, the largest in the county, and is 6 served by the Marlay Taylor Water Reclamation Facility (sewage 7 treatment plant) located south of the NAS. The plant has a 8 design capacity to treat 6.0 million gallons of sewage per day 9 (mgd). The average daily flow to the plant for the reporting 10 period of July 1, 2013 to June 30, 2014 (FY 2014) was 4.2 mgd 11 according to the annual report issued by the St. Mary’s County 12 Metropolitan Commission (MetCom). When the plant reaches 13 80% of its design capacity, or 4.8 mgd, planning and design for 14 its expansion will be needed. In spring 2015 MetCom initiated 15 capacity and expansion analysis. Calculation of 80% will include 16 treatment capacity that has been reserved for many unbuilt 17 projects, which means that planning for the expansion will 18 begin before the flow being treated reaches the 80% threshold. 19
Adequate sewage treatment capacity is not an obstacle to the 20 redevelopment of Lexington Park before 2020. However, to 21 remain so without prematurely expanding the plant, this Plan 22 encourages revising the way sewage capacity is reserved for 23 future projects so that new developments can be connected as 24 they are completed. To facilitate concentration of 25 development, this Plan recommends that service be 26 immediately available in the Central Focus Area. 27
5.1.2 Water 28
In 2005 the Maryland Geological Survey prepared a report 29 entitled The Water-Supply Potential of the Coastal Plain 30 Aquifers in Calvert, Charles, and St. Mary’s Counties, Maryland, 31 with Emphasis on the Upper Patapsco and Lower Patapsco 32 Aquifers. This report utilized the 2002 St. Mary’s County 33
Comprehensive Plan as a basis for forecasting future pumpage 34 scenarios, and for its conclusion that the water supply in these 35 counties will be sufficient to serve the needs of a growing 36 population through 2030. 37
This Plan recognizes the importance of planning for its future 38 water supply in secure, permanent, and protected sources in 39 areas available to serve anticipated long-range growth; 70% of 40 projected growth is expected in the Development District. The 41 county must therefore continue 1) identifying strategic 42 resources of water supply, 2) implementing strategies to protect 43 the water supply, and 3) monitoring the geological picture of 44 the water supply to assure an adequate, safe, and efficient 45 water supply. 46
MetCom plans to pursue reuse of effluent from Marlay Taylor 47 for various purposes on and outside the NAS, including cooling 48 towers, 350 acres of crop irrigation, irrigating the NAS golf 49 course, and using the effluent for recreational park and school 50 athletic field irrigation off base. MetCom estimates that this 51 project would reduce the amount of potable water withdrawn 52 from the aquifers by 10 to 12 million gallons per year. In its 53 planning justification for the project, MetCom states that “the 54 ground water supply in southern St. Mary’s County is not 55 unlimited. With the increased usage, the aquifer levels have 56 been dropping significantly.” This Plan recommends keeping 57 current on aquifer use and on the location and protection of 58 aquifer recharge areas throughout the county. Aquifer recharge 59 areas within and near the Development District need to be 60 located and protected to ensure that the water supply adequate 61 to 2030 and beyond. 62
5.1.3 Sewer and Water Service Recommendations 63
New or renovated structures requiring plumbing should be A.64 connected to a sewerage system that is capable of enhanced 65 nutrient removal (ENR). Phase the extension of sewer service to 66
PC August 2015 5-3 Lexington Park Development District Master Plan
promote the compact development that is supported by this 1 Plan. 2
i. Apply the guidelines of the Water and Sewer Connection 3 Task Force to phase connections to a community sewerage 4 system. 5
ii. If septic systems fail before connection to sewer is feasible, 6 require the replacement to utilize best available technology 7 (BAT). 8
a. Identify and require correction of malfunctioning septic 9 systems within the LPDD. 10
b. Continue to identify areas of failed or failing systems 11 and require connection to a public sewerage system or 12 best available technology (BAT) septic systems. 13
5.2 Public Education facilities 14
Vision: Public education facilities not only house educational programs, 15 but also serve the community as public resources through a variety of 16
community-based activities. The playfields and courts serve the 17 community as supplemental parks and recreational facilities. 18
Community organizations, both public and private, use the buildings for 19 meetings and other activities. 20
The 2014 St. Mary’s County Public Schools (SMCPS) Education Facilities 21 Master Plan15 reports that a new elementary school will be needed in 22 the Lexington Park Development District within the next six years 23 (Executive Summary, C. Historical Perspective). 24
Under the SMCPS site planning criteria, the preferred school site would 25 contain 25 to 30 acres and accommodate an enrollment of between 400 26 and 650 students. The county planning commission and SMCPS, in 27 coordination with local residents, should identify potential school sites 28 within the Development District. This Plan recommends consideration 29 of the following criteria in the selection of a site for a new elementary 30 school: 31
15
http://www.smcps.org/dss/cpgs/educational-facilities-master-plan
Selection should not be limited to sites of 25 to 30 acres, but include 32 smaller sites in order to expand the options within Lexington Park. 33
Sites that provide the greatest level of accessibility by walking and 34 bicycling should be considered. 35
Priority consideration should be given to the FDR Boulevard corridor 36 and the Great Mills Road corridor. 37
5.2.1 Southern Maryland Higher Education Center. 38
This Plan supports curricula and programs that further 39 economic development goals, including technical training and 40 continuing education for adults. One of the Development 41 District’s important educational assets is the Southern Maryland 42 Higher Education Center (HEC), located on Airport Road, across 43 from the regional airport. With a goal of providing knowledge-44 based graduate technology to help propel economic growth, the 45 nearly one hundred academic programs offered by 14 46 universities and colleges concentrate on advanced degrees in 47 science and technology to serve the needs of high-tech 48 businesses. The HEC also offers bachelor degree completion 49 programs, continuing education classes for public school 50 teachers and administrators, and programs for business, social 51 welfare and health care professionals. This Plan supports the 52 county’s cooperating with the University of Maryland to fund 53 “Building Three” for unmanned aerial systems research and 54 education. 55
5.2.2 Education Facilities Recommendations: 56
Locate new schools where they will contribute to the vision of 57 compact development and be accessible by way of sidewalks 58 and bikeways. 59
5.3 Library facilities 60
Vision: Libraries provide a physical and virtual gateway by which the 61 community may access information, congregate to freely exchange 62
PC August 2015 5-4 Lexington Park Development District Master Plan
ideas, celebrate literacy and cultural growth in a leisurely yet lively 1 atmosphere. 2
The Lexington Park Branch of the St. Mary's County Library System, 3 located at FDR Boulevard and Shangri La Drive, is the busiest of the 4 system’s three branches, and a key Downtown asset. In addition to 5 books, periodicals, CDs and DVDs, all St. Mary’s County libraries have a 6 large number of personal computers with Internet access. Patrons with 7 a library card are able to use a library PC for up to two hours per day. 8 Free Internet availability is an important resource for students who do 9 not otherwise have Internet access outside of school. This plan support 10 implementation of the Library facilities Master Plan. 11
5.4 Broadband infrastructure 12
Vision: Residential, business and public anchor institutions will be 13 provided with the opportunity to be served by the evolving and most 14
current information technologies available. 15
The Broadband Deployment Plan for Southern Maryland (2012) was 16 prepared by the Tri-County Council for Southern Maryland. It describes 17 the importance of broadband in Southern Maryland: “The 21st century 18 economic and educational success of Southern Maryland requires 19 universal access to high speed information technology which allows 20 college internet courses, telemedicine, telework, and home-based small 21 businesses to access cutting edge secure communications of 22 importance. In addition to the town center / development districts, the 23 remaining areas of the region need high speed internet to allow 24 business, education, health care and other communication services and 25 connectivity” (page 25). Until wireless service is available throughout 26 the county, the most desirable type of broadband is fiber optic (2012 27 Broadband Deployment Plan, pages 56-58). 28
Fiber optic broadband is available to the NAS and the technology-29 related businesses in and around Lexington Park, but the extent of its 30 availability elsewhere is not known because the companies that own 31 and provide fiber will not disclose details about their networks (2005 32 Broadband Study, p. 90; quoted in the 2012 Broadband Deployment 33 Plan, p. 57). 34
An answer to a Frequently Asked Question on the Maryland Broadband 35 Map site16 explains “availability”: The National Telecommunications 36 Information Administration defines broadband service availability as 37 ‘available’ to an end user at an address if a broadband service provider 38 does, or could provide within 7 to 10 business days without an 39 extraordinary commitment of resources: 40
two-way data transmission to and from the Internet with advertised 41 speeds of at least 768 kilobits per second (kbps) downstream and 42
at least 200 kbps upstream to the end user at the address. 43
The Maryland Broadband Map web site allows a prospective customer 44 to find out which types of broadband services might be available based 45 on an address. The site also has contact information for broadband 46 providers. 47
The availability of fiber optic broadband and wireless service should be 48 pursued through such groups as the Lexington Park Business and 49 Community Association, the St. Mary’s County Community 50 Development Corporation, and the Tri-County Council for Southern 51 Maryland. 52
5.4.1 Broadband Recommendations: 53
All property within the Development District should have access A.54 to affordable broadband service. 55
Expand the availability of broadband, especially fiber optic B.56 internet access. 57
i. Maintain an inventory of broadband services 58
a. Ask for the participation of such groups as the Lexington 59 Park Business and Community Association, the St. 60 Mary's County Community Development Corporation, 61 the St. Mary's County libraries, and Tri-County Council 62 for Southern Maryland to help research broadband 63 availability. 64
16
www.mdbroadband.map.org
PC August 2015 5-5 Lexington Park Development District Master Plan
b. Contact fiber optic providers to help determine 1 opportunities and constraints of the broadband market. 2
c. Use the Lexington Park Facebook page, and other 3 Internet communication tools, to glean data about 4 those currently served by fiber optic and those who 5 would like fiber optic internet access. 6
ii. Revise zoning and subdivision regulations to foster 7 expanded broadband service and to ensure streamlined 8 processing of permits for broadband infrastructure. 9
5.5 Public Safety: Fire, Sheriff and Emergency Medical Services 10
Vision: Services are available to protect of life and property, prevent 11 crime; and preserve peace and order to the people of Lexington Park, 12
who are served with respect, fairness, and compassion. 13
Fire, emergency, and ambulance services to the Development District 14 are provided by the Bay District Volunteer Fire Department (VFD) 15 Companies 3 and 9, the Patuxent River NAS Company, and Lexington 16 Park Volunteer Rescue Squad (VRS) Companies 38 and 39. In 2014 VRS 17 Company 38 relocated to a new facility on FDR Boulevard near the 18 library and the Bay District Volunteer Fire Department. This new 19 location, and the activity it brings with it, should have a positive impact 20 on the redevelopment of the Downtown. 21
Law enforcement is provided by the St. Mary’s County Sheriff’s Office17 22 and by the Leonardtown Barracks of the Maryland State Police. There 23 are two Sheriff’s facilities in Lexington Park: one on Lincoln Avenue, and 24 a second on South Shangri-La Drive that will be relocated to Great Mills 25 Road. The Sheriff’s Office also has a Community Oriented Policing 26 Services (COPS) patrol district in Lexington Park that includes Great Mills 27 Road from Three Notch Road to Point Lookout Road and most of the 28 Downtown. 29
This plan recognizes that a concept introduced in Chapter 2 “crime 30 prevention through environmental design,” or CPTED as important to 31 providing a safe and desirable community for Lexington Park ‘s residents 32
17
http://www.firstsheriff.com/lexingtonparkpolicing.asp
workers and visitors. The proper design and effective use of the built 33 environment can lead to a reduction in the fear of crime, the incidence 34 of crime, and to an improvement in quality of life. The fundamental 35 principle is to reduce opportunities for crime while increasing the 36 opportunities for residents to be able to safely observe and report crime 37 or suspicious persons and activities. CPTED emphasizes urban design, 38 building construction, landscaping, and lighting that are consciously 39 planned so as to eliminate areas where vagrants and criminals can hide. 40 In addition to eliminating places of concealment, CPTED promotes 41 unobstructed lines of sight from the street and neighboring buildings so 42 that loitering and suspicious activities can be observed and reported to 43 police (often referred to as “eyes on the street”). 44
SafeScape, a concept similar to CPTED, places primary importance for 45 public safety on the social community, especially the family. This Plan 46 emphasizes a total community approach that considers both social 47 factors and the physical environment of Lexington Park. 48
The Sheriff’s Office, together with the Department of Economic 49 Development, has formed the “B-Alert Program” to reduce crime and 50 the fear of crime in Lexington Park. The Sheriff’s Office will send e-mail 51 to participating businesses in or near the Great Mills Road corridor 52 providing information on criminal activity. 53
Opening a new Sheriff’s office on Great Mills Road, incorporating CPTED 54 and SafeScape principles throughout the community, and publicizing the 55 B-Alert Program and other “crime watch programs” are all ways to 56 reduce crime and the perception of crime in Lexington Park. 57
5.5.1 Fire and EMS Recommendations: 58
All buildings, residential and non-residential, within the 59 Lexington Park Development District shall be protected from 60 fire through a combination of prevention and suppression 61 activities. EMS facilities will be strategically located throughout 62 the district to ensure a uniform response time to all emergency 63 calls. 64
PC August 2015 5-6 Lexington Park Development District Master Plan
Ensure that EMS and fire departments are adequate and A.1 equitably financed. High quality services will be provided to all 2 neighborhoods within Lexington Park. 3
i. Maintain an adequate level of staffing and appropriate 4 equipment, for EMS and fire stations, to fully respond to 5 emergency. 6
ii. Achieve and maintain an average response time of 6 7 minutes. 8
iii. Ensure that developers make provisions for new, additional 9 or upgraded emergency response facilities or equipment, 10 etc. when the development can be directly linked to the 11 need for additional capital improvements. 12
5.5.2 Law Enforcement Recommendations 13
Reduce actual and perceived crime in Lexington Park. This Plan 14 supports continuation of the public safety provisions of the St. 15 Mary's County Comprehensive Plan. 16
Reduce resident concern about, and susceptibility to, crime. A.17
i. Locate sheriff facilities in areas that enable the deputies to 18 respond to calls as quickly as possible. Visibility of the 19 sheriff’s office and deputies will be emphasized to enhance 20 the feeling of security. 21
ii. Achieve and maintain adequate staffing levels to provide a 22 level of service of officers per the International Association 23 of Chiefs of Police Standards. 24
iii. Achieve and maintain an average response time of 4 25 minutes. 26
Increase awareness of crime prevention methods. B.27
i. Encourage and support citizen involvement in crime 28 prevention programs such as neighborhood watches. 29
ii. Promote participation of businesses in the B-Alert Program. 30 Pursue 100% participation. 31
iii. Incorporate CPTED principles in design guidelines for new 32 construction and redevelopment projects; ensure 33
conformance of buffer requirements pursuant to these 34 principles. 35
36
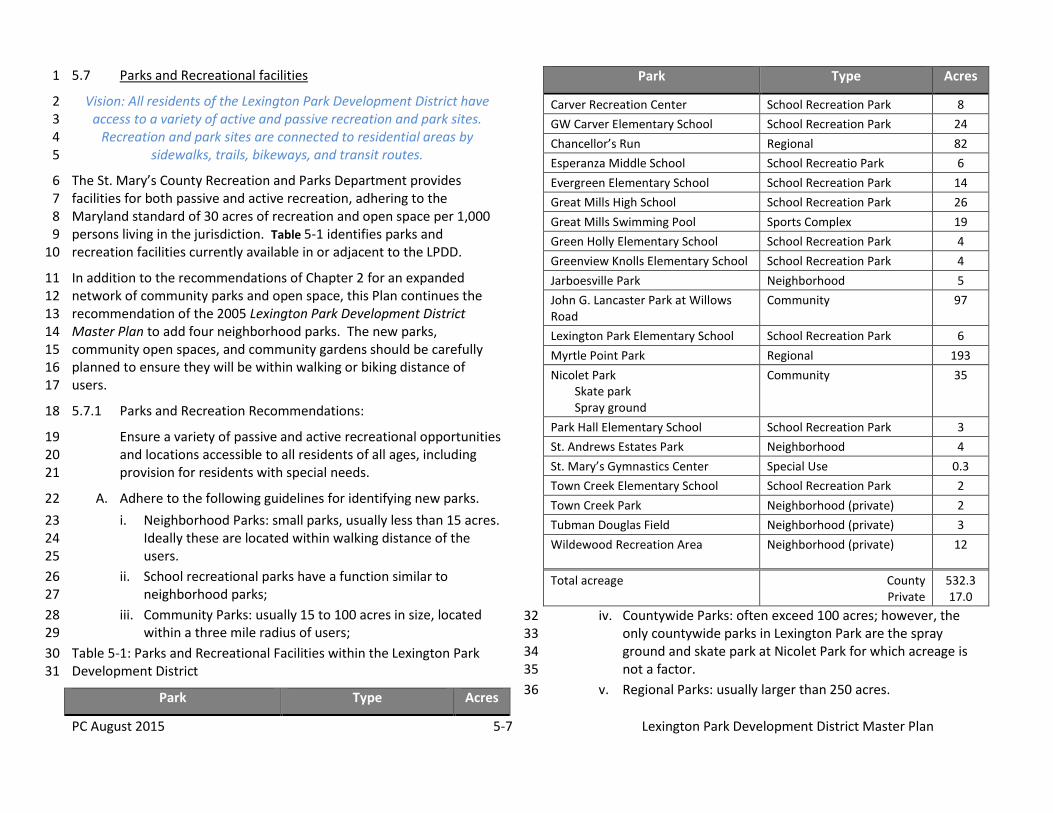
PC August 2015 5-7 Lexington Park Development District Master Plan
5.7 Parks and Recreational facilities 1
Vision: All residents of the Lexington Park Development District have 2 access to a variety of active and passive recreation and park sites. 3
Recreation and park sites are connected to residential areas by 4 sidewalks, trails, bikeways, and transit routes. 5
The St. Mary’s County Recreation and Parks Department provides 6 facilities for both passive and active recreation, adhering to the 7 Maryland standard of 30 acres of recreation and open space per 1,000 8 persons living in the jurisdiction. Table 5-1 identifies parks and 9 recreation facilities currently available in or adjacent to the LPDD. 10
In addition to the recommendations of Chapter 2 for an expanded 11 network of community parks and open space, this Plan continues the 12 recommendation of the 2005 Lexington Park Development District 13 Master Plan to add four neighborhood parks. The new parks, 14 community open spaces, and community gardens should be carefully 15 planned to ensure they will be within walking or biking distance of 16 users. 17
5.7.1 Parks and Recreation Recommendations: 18
Ensure a variety of passive and active recreational opportunities 19 and locations accessible to all residents of all ages, including 20 provision for residents with special needs. 21
Adhere to the following guidelines for identifying new parks. A.22
i. Neighborhood Parks: small parks, usually less than 15 acres. 23 Ideally these are located within walking distance of the 24 users. 25
ii. School recreational parks have a function similar to 26 neighborhood parks; 27
iii. Community Parks: usually 15 to 100 acres in size, located 28 within a three mile radius of users; 29
Table 5-1: Parks and Recreational Facilities within the Lexington Park 30 Development District 31
Park Type Acres
Park Type Acres
Carver Recreation Center School Recreation Park 8
GW Carver Elementary School School Recreation Park 24
Chancellor’s Run Regional 82
Esperanza Middle School School Recreatio Park 6
Evergreen Elementary School School Recreation Park 14
Great Mills High School School Recreation Park 26
Great Mills Swimming Pool Sports Complex 19
Green Holly Elementary School School Recreation Park 4
Greenview Knolls Elementary School School Recreation Park 4
Jarboesville Park Neighborhood 5
John G. Lancaster Park at Willows Road
Community 97
Lexington Park Elementary School School Recreation Park 6
Myrtle Point Park Regional 193
Nicolet Park Skate park Spray ground
Community 35
Park Hall Elementary School School Recreation Park 3
St. Andrews Estates Park Neighborhood 4
St. Mary’s Gymnastics Center Special Use 0.3
Town Creek Elementary School School Recreation Park 2
Town Creek Park Neighborhood (private) 2
Tubman Douglas Field Neighborhood (private) 3
Wildewood Recreation Area Neighborhood (private) 12
Total acreage County Private
532.3 17.0
iv. Countywide Parks: often exceed 100 acres; however, the 32 only countywide parks in Lexington Park are the spray 33 ground and skate park at Nicolet Park for which acreage is 34 not a factor. 35
v. Regional Parks: usually larger than 250 acres. 36
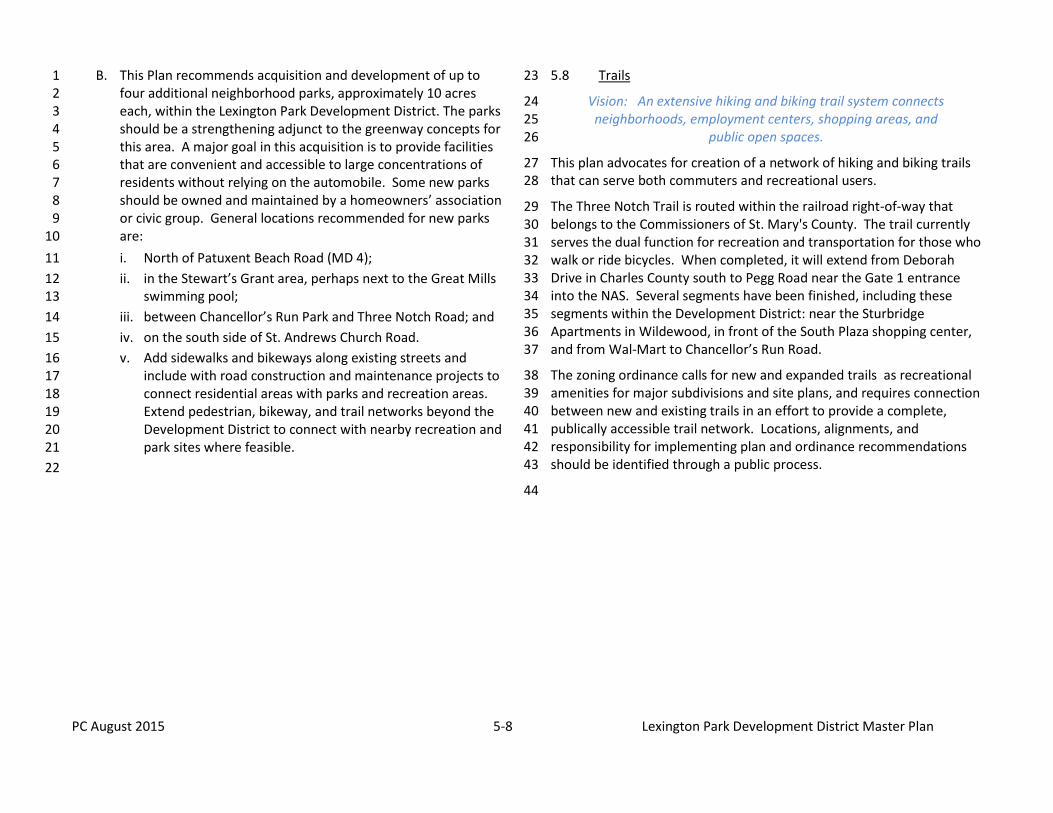
PC August 2015 5-8 Lexington Park Development District Master Plan
This Plan recommends acquisition and development of up to B.1 four additional neighborhood parks, approximately 10 acres 2 each, within the Lexington Park Development District. The parks 3 should be a strengthening adjunct to the greenway concepts for 4 this area. A major goal in this acquisition is to provide facilities 5 that are convenient and accessible to large concentrations of 6 residents without relying on the automobile. Some new parks 7 should be owned and maintained by a homeowners’ association 8 or civic group. General locations recommended for new parks 9 are: 10
i. North of Patuxent Beach Road (MD 4); 11
ii. in the Stewart’s Grant area, perhaps next to the Great Mills 12 swimming pool; 13
iii. between Chancellor’s Run Park and Three Notch Road; and 14
iv. on the south side of St. Andrews Church Road. 15
v. Add sidewalks and bikeways along existing streets and 16 include with road construction and maintenance projects to 17 connect residential areas with parks and recreation areas. 18 Extend pedestrian, bikeway, and trail networks beyond the 19 Development District to connect with nearby recreation and 20 park sites where feasible. 21
22
5.8 Trails 23
Vision: An extensive hiking and biking trail system connects 24 neighborhoods, employment centers, shopping areas, and 25
public open spaces. 26
This plan advocates for creation of a network of hiking and biking trails 27 that can serve both commuters and recreational users. 28
The Three Notch Trail is routed within the railroad right-of-way that 29 belongs to the Commissioners of St. Mary's County. The trail currently 30 serves the dual function for recreation and transportation for those who 31 walk or ride bicycles. When completed, it will extend from Deborah 32 Drive in Charles County south to Pegg Road near the Gate 1 entrance 33 into the NAS. Several segments have been finished, including these 34 segments within the Development District: near the Sturbridge 35 Apartments in Wildewood, in front of the South Plaza shopping center, 36 and from Wal-Mart to Chancellor’s Run Road. 37
The zoning ordinance calls for new and expanded trails as recreational 38 amenities for major subdivisions and site plans, and requires connection 39 between new and existing trails in an effort to provide a complete, 40 publically accessible trail network. Locations, alignments, and 41 responsibility for implementing plan and ordinance recommendations 42 should be identified through a public process. 43
44
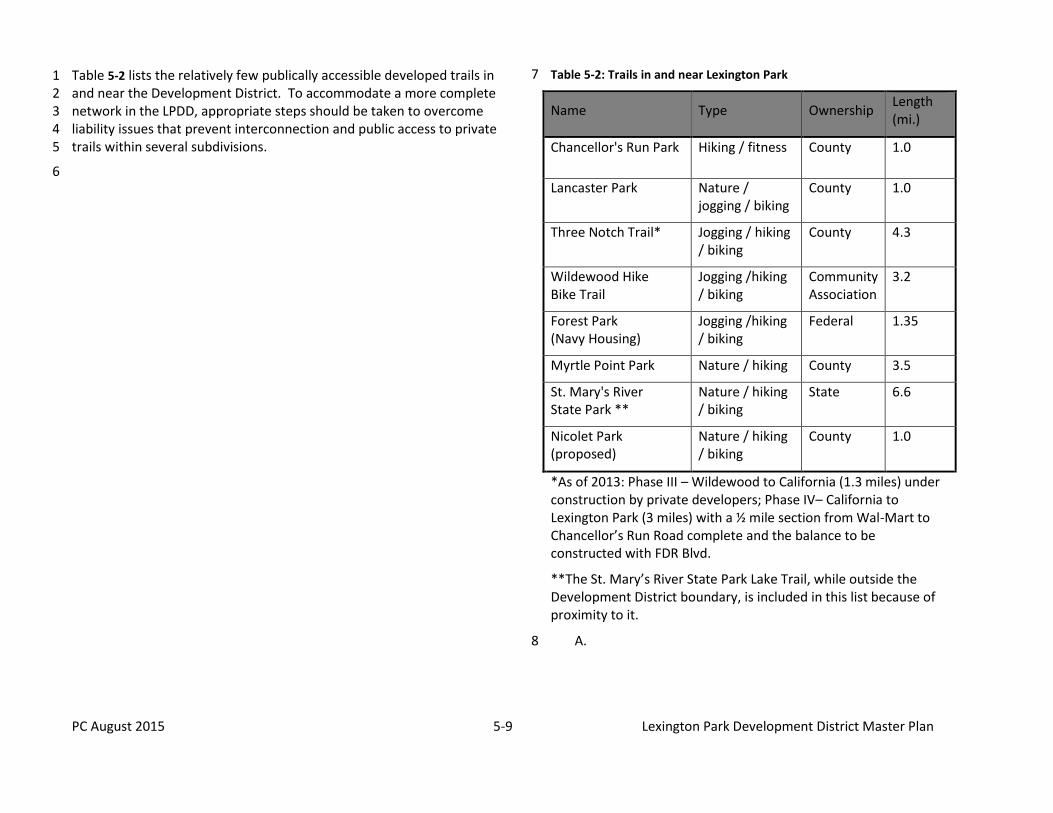
PC August 2015 5-9 Lexington Park Development District Master Plan
Table 5-2 lists the relatively few publically accessible developed trails in 1 and near the Development District. To accommodate a more complete 2 network in the LPDD, appropriate steps should be taken to overcome 3 liability issues that prevent interconnection and public access to private 4 trails within several subdivisions. 5
6
Table 5-2: Trails in and near Lexington Park 7
Name Type Ownership Length (mi.)
Chancellor's Run Park Hiking / fitness County 1.0
Lancaster Park Nature / jogging / biking
County 1.0
Three Notch Trail* Jogging / hiking / biking
County 4.3
Wildewood Hike Bike Trail
Jogging /hiking / biking
Community Association
3.2
Forest Park (Navy Housing)
Jogging /hiking / biking
Federal 1.35
Myrtle Point Park Nature / hiking County 3.5
St. Mary's River State Park **
Nature / hiking / biking
State 6.6
Nicolet Park (proposed)
Nature / hiking / biking
County 1.0
*As of 2013: Phase III – Wildewood to California (1.3 miles) under construction by private developers; Phase IV– California to Lexington Park (3 miles) with a ½ mile section from Wal-Mart to Chancellor’s Run Road complete and the balance to be constructed with FDR Blvd.
**The St. Mary’s River State Park Lake Trail, while outside the Development District boundary, is included in this list because of proximity to it.
A.8
PC August 2015 5-10 Lexington Park Development District Master Plan
5.9 Historic and Cultural Sites 1
Vision: The historical and cultural heritage of Development District 2 contributes to the economic and social well-being of the community and 3
enhances quality of life for county residents. 4
Lexington Park is sometimes referred to as “The Instant City” because of 5 its sudden emergence along with the naval base during World War II. A 6 partial history of Lexington Park can be found by reviewing the 7 Maryland Historical Trust survey18 of the nearly 40 sites within the area 8 and review of Painting A Self Portrait: A Historic Preservation Plan for St. 9 Mary's County (2000) . 10
Goals of this Plan regarding historical and cultural sites include 11 continued documentation of the history of the area (from prehistory 12 through World War II to the recent past) and development of a walking 13 / driving tour booklet highlighting the following historically and 14 culturally significant sites:. 15
The Patuxent River Naval Air Museum, which is an eye-catching 16 Lexington Park landmark due to its large outdoor collection of Navy 17 aircraft. In addition to the airplanes and helicopters, there is also an 18 indoor exhibit hall. 19
The cupola from the Cedar Point Lighthouse, which once marked 20 the confluence of the Chesapeake Bay and Patuxent River, and 21 which is on the grounds of the air museum. “Against the Odds,” a 22 historical marker on the Star-Spangled Banner National Trail that 23 tells the story of Joshua Barney and the Chesapeake Flotilla during 24 the War of 1812 is also at the museum. 25
Freedom Park, the home of the African American Monument of St. 26 Mary’s County, beside Tulagi Place. A Civil War Memorial 27 Monument and Marker honoring “United States Colored Troops” is 28 in Lancaster Park. This display explains that there were 700 United 29
18
Posted at http://msa.maryland.gov/megafile/msa/stagsere/se1/se5/026000/026800/026823/pdf/msa_se5_26823.pdf
States Colored Troops from St. Mary’s County and, in fact, the 30 majority of Union soldiers from the county were of African descent. 31 In December 2014, following its renovation, the last remaining 32 structure in Lexington Manor (also known as the “Flat Tops”) was 33 dedicated as the United States Colored Troops (USCT) Memorial 34 Interpretive Center. The new center provides space for meetings 35 and community activities. In the future it will include displays and 36 information about the Civil War Memorial, as well as African 37 American history in St. Mary’s County. 38
Two historic markers not far from the African American Monument, 39 on Rennell Avenue west of S. Coral Place. One, “St. Mary’s County 40 and U.S. Navy History,” briefly tells the history of NAS Patuxent 41 River. The second, “Architectural Significance of the First Lexington 42 Park Community” explains the “flattop” duplexes that were built to 43 house the civilian workers who built the air station during World 44 War II. The Flat Tops, and other homes in Lexington Park, were 45 designed by the architectural firm of Kahn and Jacobs. 46
The “Saint Nicholas Church” historical marker located on the east 47 side of Three Notch Road, south of Great Mills Road. The marker 48 provides information on the Jesuit Missions from the 17th to 19th 49 centuries. 50
The Three Notch Theatre, a valuable cultural resource within 51 Lexington Park. The Theatre, home of the Newtowne Players, is a 52 black box theater located in the former library building near 53 Freedom Park. The Theatre and Players develop local actors, both 54 children and adults, and conduct workshops and programs with 55 local schools. The Newtowne Players mission is to promote all 56 aspects of the performing arts in Southern Maryland; to provide an 57 outlet for people in the community interested in theatre 58 production, and to provide quality entertainment to the 59 communities. The Newtowne Players goal is to foster, promote and 60 increase the public knowledge and appreciation of the arts and 61 cultural activities in St. Mary's County and Southern Maryland, and 62
PC August 2015 5-11 Lexington Park Development District Master Plan
to make live theatre affordable and available to members of the 1 surrounding communities. 2
5.9.1 Historical and Cultural Sites Recommendations: 3
Promote balanced heritage activities and programs that A.4 capitalize on the historical and cultural resources within the 5 Development District. Take actions to maintain heritage 6 resources 7
Seek and support increased opportunities for conservation, B.8 preservation, and maintenance of heritage resources through 9
i. Official State and Federal recognition of County sites and of 10 Southern Maryland as a "Heritage Area." 11
ii. Support local, regional, State and Federal heritage program 12 efforts, such as the national register of historic places and 13 Maryland historical trust grants programs, which provide 14 incentives to foster the preservation or restoration of 15 significant structures. 16
iii. Support public and private community preservation efforts. 17
Review and document the historic and architectural significance C.18 of all structures slated for demolition that are fifty years or 19 older. Inform landowners of the resources available for 20 conservation and adaptive reuse of significant historic 21 structures 22
Ensure implementation of ordinance requirements for D.23 protection of designated scenic and historic resources. 24
Ensure review of all development proposals for potential E.25 adverse impacts on historic resources: 26
i. Identify known resources on all development plans: 27
ii. Identify cemeteries, burial grounds, and archeological 28 resources prior to any disturbance of a site. 29
iii. Document resources discovered during development. 30
Promote historic resources for economic opportunity. Continue F.31 to participate in the Chesapeake Gateways network and to 32 utilize network resources to develop and interpret the Naval Air 33 Station Museum and Myrtle Point Park. 34
35
5.10 Solid Waste management 36
Vision: A comprehensive program for solid waste collection, processing, 37 and disposal, for waste stream reduction and for recycling management 38
addresses solid waste and recycling needs of the residents and 39 businesses in Lexington Park 40
This plan supports recommendations of the St. Mary’s County Solid 41 Waste Management and Recycling Plan and the State of Maryland 42 requirements for achieving waste reduction. The county owns and 43 operates six convenience centers where its residents may drop off 44 waste, recyclables, used motor oil, and antifreeze. Information about 45 use and operation of these facilities may be found on the county’s web 46 site. The St. Andrews Land Fill and Convenience center are located 47 within the Development District on St. Andrew’s Church Road. 48
5.10.1 Solid Waste Recommendations: 49
All properties within the Lexington Park Development District 50 should be serviced by a solid waste collection company that will 51 include single stream recycling pickup. Recycling for multi-52 family and non-residential uses shall be via dedicated 53 containers, sized and located to ensure efficiency and ease of 54 use. 55
PC August 2015 5-12 Lexington Park Development District Master Plan
1
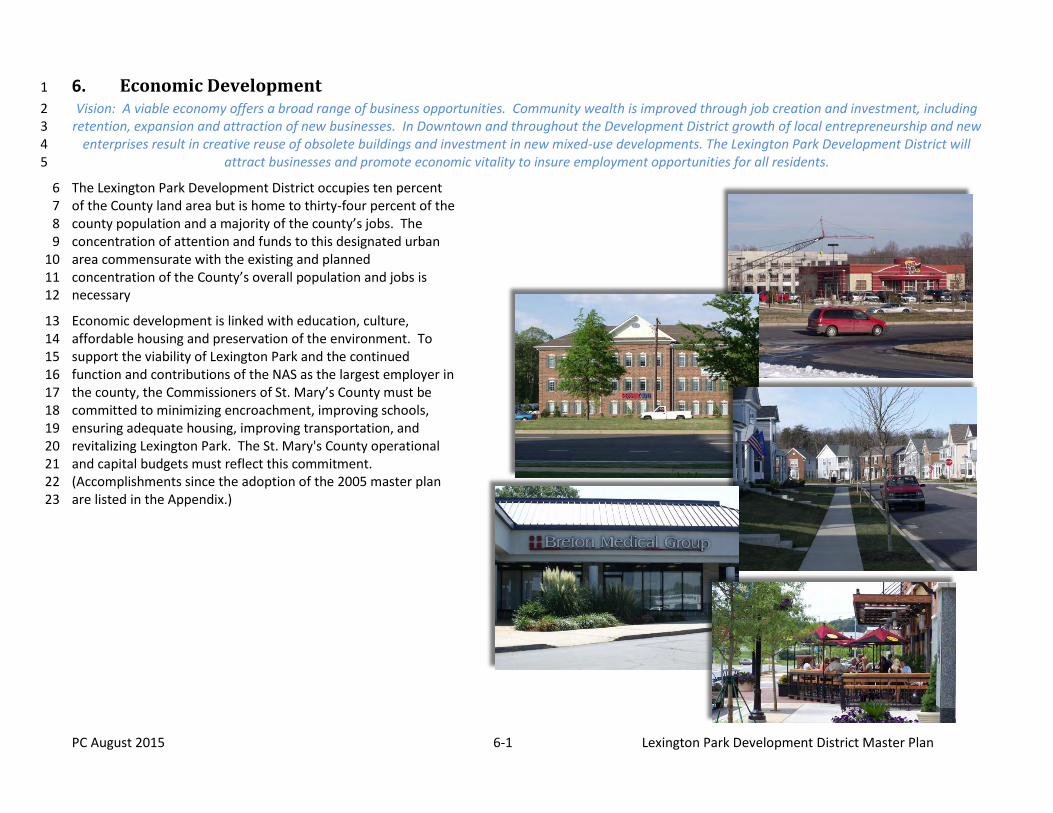
PC August 2015 6-1 Lexington Park Development District Master Plan
6. Economic Development 1
Vision: A viable economy offers a broad range of business opportunities. Community wealth is improved through job creation and investment, including 2 retention, expansion and attraction of new businesses. In Downtown and throughout the Development District growth of local entrepreneurship and new 3
enterprises result in creative reuse of obsolete buildings and investment in new mixed-use developments. The Lexington Park Development District will 4 attract businesses and promote economic vitality to insure employment opportunities for all residents.5
The Lexington Park Development District occupies ten percent 6 of the County land area but is home to thirty-four percent of the 7 county population and a majority of the county’s jobs. The 8 concentration of attention and funds to this designated urban 9 area commensurate with the existing and planned 10 concentration of the County’s overall population and jobs is 11 necessary 12
Economic development is linked with education, culture, 13 affordable housing and preservation of the environment. To 14 support the viability of Lexington Park and the continued 15 function and contributions of the NAS as the largest employer in 16 the county, the Commissioners of St. Mary’s County must be 17 committed to minimizing encroachment, improving schools, 18 ensuring adequate housing, improving transportation, and 19 revitalizing Lexington Park. The St. Mary's County operational 20 and capital budgets must reflect this commitment. 21 (Accomplishments since the adoption of the 2005 master plan 22 are listed in the Appendix.) 23
PC August 2015 6-2 Lexington Park Development District Master Plan
6.1 Introduction 1
The Maryland Economic Development Commission reported in 2014 2 that the largest employer in the three counties of Southern Maryland is 3 government (the federal government employs fourteen percent of the 4 workforce), followed by transportation, trade, and utilities; professional 5 and business services (particularly federal contractors), education and 6 health services; and leisure and hospitality. Sixty-five per cent of 7 residents are employed in either management, professional and related 8 occupations or sales and office occupations. 9
Creating new markets and broadening opportunities for business 10 growth is a necessary and important goal for St. Mary’s County. In 11 2012, about 22,400 or just over one-third of the jobs in the county were 12 tied directly to the NAS or its private-sector contractors. The 13 overreliance on defense spending makes the county vulnerable to 14 reductions in federal defense spending, downsizing or relocation of 15 Navy programs via the BRAC process. This plan calls for efforts to 16 stimulate economic growth through private investment as well as 17 promotion of businesses in proximity to the NAS. 18
Private sector investment with the principal goal of growing the number 19 of entrepreneurs in the Lexington Park area is needed. Lexington Park is 20 a center for engineering services, computer systems design, scientific 21 research, and technology development. The highly skilled and educated 22 workforce in these sectors provides an excellent starting point to grow 23 entrepreneurial activities and new businesses. 24
Diversifying the economy is recognized as necessary to reduce the 25 decades-long dependence on the NAS as the economic engine for the 26 county. Thus the Commissioners have also committed to encouraging 27 technology commercialization and development policies that 28 concentrate new jobs and business opportunities in the Development 29 District. Commercialization of existing and emerging defense 30 technologies, such as unmanned and autonomous systems, could 31 broaden employment opportunities. 32
Diversification will also ensure long-term economic resiliency and 33 greater stability. Plan strategies support quality education for all age 34 and income groups, an adequate supply of affordable workforce 35
housing, and enhanced transportation options for access to jobs and 36 services. There are complementing strategies to recruit new firms and 37 industries, to train incumbent and prospective workers, and to develop 38 a private capital fund for entrepreneurship. 39
In addition to unmanned and autonomous systems, other types of 40 businesses should be recruited. Light industrial, manufacturing, and 41 technology-based businesses are needed. Medical practitioners, 42 medical laboratories, diagnostic imaging centers, home health care 43 services, and services for the elderly and disabled are also needed. The 44 shortage of medical professionals is particularly acute in Lexington Park 45 where a state designated Health Enterprise Zone (HEZ) was established 46 in 2013 to address the shortage of medical services. There is also a 47 need to increase the availability of cultural arts and art enterprises 48 which are important to attracting and retaining a highly-skilled and 49 educated workforce. 50
6.1.1 Economic Redevelopment Tools and Activities 51
The following economic development tools and activities are 52 recommended to fuel the revitalization of the core area of 53 Lexington Park. 54
St. Mary's County Community Development Corporation (CDC) A.55
To revitalize Lexington Park, the county created the CDC to be 56 its redevelopment authority. The CDC can buy and sell land, 57 issue bonds and raise private capital; administer state, local and 58 federal grants and contracts and distribute funds to other 59 organizations participating in the redevelopment of Lexington 60 Park. The CDC manages a revolving loan fund and a variety of 61 programs designed to implement the revitalization of Lexington 62 Park. In 2012, the Corporation created the Lexington Park 63 Business and Community Association to manage promotions 64 and marketing of the Lexington Park. This Plan is predicated on 65 the county’s commitment of key resources to maximizing 66 revitalization efforts. Such resources should include dedicated 67 staff for pursuit of public-private partnerships, grants, etc. 68
PC August 2015 6-3 Lexington Park Development District Master Plan
The creation of a BID would require approval of the 1 Commissioners of St. Mary’s County because it involves 2 taxation. Once established, the BID should be the responsibility 3 of the private sector. 4
Sustainable Communities Designation B.5
In 2014, portions of the Downtown and surrounding areas 6 became a State designated Sustainable Community. This 7 designation provides the county with a variety of tools to 8 support revitalization of Lexington Park. Specifically, the 9 designation establishes a Tax Increment Financing (TIF) district 10 (see the following map). TIFs are used to advance funding for 11 improvements in distressed, underdeveloped, or underutilized 12 parts of a community where development might otherwise not 13 occur. A TIF uses future gains in taxes to subsidize current 14 infrastructure improvements and other community projects 15 that leverage private investment. Recognizing that new real 16 estate investment yields higher taxes, bond funds are raised to 17 finance the construction of infrastructure in a public-private TIF 18 redevelopment project. While the base taxes generated for 19 county government remain the same, the increased taxes 20 generated as a result of the new investment are used to repay 21 the bonds. Any shortfall in the debt repayment is collateralized 22 by the project becomes the sole responsibility of the developer. 23 A TIF reduces the developer’s cost of financing expensive and 24 necessary site work for a major redevelopment project. This 25 tool has been used nation-wide to increase the likelihood of 26 attracting property owner and developer interest to an area 27 that has otherwise been ignored. Because TIF’s involve 28 taxation, creation of a TIF project requires the approval of the 29 Commissioners of St. Mary's County. 30
Sustainable Communities are eligible for Community Legacy 31 grants and Neighborhood Business Works Loans as well as 32 enhanced funding through the State’s sidewalk retrofit and 33 bikeways programs. 34
35
The Lexington Park Business and Community Association 36 (LPBCA) created the community’s iconic logo; successfully 37 managed the Navy’s Centennial Celebration and the annual 38 Pride in the Park Parades. Direct marketing and event program 39 should increase. The LPBCA could create an annual marketing 40 and promotion strategy for Lexington Park to include farmers 41 markets, arts and cultural events, film festivals, outdoor 42 concerts and “Walk in the Park” days to attract greater interest 43 from businesses and shoppers to Lexington Park. The Lexington 44 Park logo should be used in all marketing 45
Business Improvement District C.46
This Plan recommends that the businesses and commercial 47 property owners form a Business Improvement District (BID). A 48 BID is a defined area wherein a portion of the existing taxes paid 49 by those property owners is dedicated to provide services which 50 improve the immediate community and leverage additional 51 private sector investment. [No new taxes!] Funds from a 52 Lexington Park BID could be used for security improvements, 53 beautification, and marketing and promotions among other 54 things. Building upon the early success of the Lexington Park 55 Business and Community Association, the business and property 56 owners should work through a BID to advance shared interests. 57
Angel and Venture Capital Funds D.58
Angel and venture capital funds, equity crowd-funding and 59 other seed funding options are designed to provide funding for 60 early staged companies with limited operating history and no 61 access to traditional lenders. Venture capitalists usually take an 62 equity stake in the company while angel investors are often 63 motivated to invest for entirely different reasons, often having 64 to do with supporting the next wave of entrepreneurs. 65
With the county’s growing interest and support for technology 66 commercialization, early staged companies are likely to be 67 attracted to locate in Lexington Park to achieve less expensive 68 and more flexible leases. Identifying angel and venture investors 69 who would support technology commercialization business 70
PC August 2015 6-4 Lexington Park Development District Master Plan
locating in Lexington Park could prove to be a very successful 1 marketing tool for the area. 2
Arts, Entertainment and Heritage Tourism District E.3
An arts, entertainment and heritage district can play a role in 4 the revitalization of Lexington Park. Year-round performances 5 at the Three Notch Theater, the gallery for local artists located 6 in the Lexington Park Library, annual summer stock 7 performances at Great Mills High School, and the Patuxent River 8 Navy Museum and Visitor Center are existing heritage tourism 9 and arts and entertainment destinations. A designated arts, 10 entertainment and heritage district will allow the community to 11 compete for state capital improvement and programing grants. 12 A Lexington Park Arts, Entertainment and Heritage District 13 would further the positive brand identity of the community and 14 provide additional opportunities for weekend and nightlife to 15 diversify the attractiveness of the Downtown. It could attract 16 artists and young professionals to the Downtown. 17
Community Development Financial Institutions Program (CDFI). F.18
The purpose of the CDFI Program is to use federal resources to 19 invest in CDFIs and to build their capacity to serve low-income 20 people and communities that lack access to affordable financial 21 products and services. Either the Community Development 22 Corporation or the Housing Authority of St. Mary’s County 23 should be encouraged to secure a CDFI designation. CDFIs may 24 use the funds to pursue a variety of objectives, including: 25
To promote economic development, to develop businesses, 26 to create jobs, and to develop commercial real estate; 27
To develop affordable housing and to promote 28 homeownership; and 29
To provide community development financial services, such 30 as basic banking services, financial literacy programs, and 31 alternatives to predatory lending. 32
33
6.2 Economic Development Recommendations 34
In addition to the using the tools and implementing the actions offered 35 above, the following economic development initiatives should be 36 considered and undertaken to attract business and encourage job 37 growth throughout Development District. 38
6.2.1 Create an inventory of existing federal, state, local and private 39 assets including runways, labs and research facilities to use in 40 marketing the Development District for technology business 41 growth. 42
6.2.2 Work with the University System of Maryland and other 43 educational institutions to develop state-of-the-art research 44 facilities accessible to private industry and designed to drive 45 innovation and the development of new commercial 46 technologies and applications. 47
6.2.3 Support advanced work force educational opportunities to 48 ensure job employment skills are available to meet existing and 49 new technology requirements. 50
6.2.4 Update zoning regulations, when required, to: 51
Ensure availability of property for office, business and A.52 technology parks, industrial and research labs, warehouses, 53 production, and flex space. 54
Streamline the development approval processes to reduce the B.55 time between application and permitting. 56
Provide incentives to attract new businesses. C.57
6.2.5 Expand availability of high-speed Internet service and address 58 the “last mile” connectivity for neighborhoods located 59 throughout the Development District. 60
6.2.6 Provide incentives, training and other tools to encourage 61 business growth and diversification. 62
6.2.7 Emphasize business diversity and international marketing, and 63 invite research and technology companies seeking a highly-64 skilled and educated workforce. 65
6.2.8 Encourage renewable, clean and green energy development. 66
PC August 2015 6-2 Lexington Park Development District Master Plan
6.2.9 Attract businesses offering products, services and amenities to 1 support consumer and community demand. 2
Attract specialized retailers and other businesses such as A.3 specialty shops and outdoor recreation experiences. 4
Increase cultural, recreational and entertainment amenities and B.5 venues. 6
Promote retailing of antiques, local handy-crafts, and C.7 restaurants serving local fare. 8
Publish a marketing campaign for business recruitment. D.9 Promote the proximity of the airport to Lexington Park as a E.10
benefit that can be used to attract new businesses to Lexington 11 Park. 12
Actively pursue extension of the regional airport runway, apron F.13 and road improvements. 14
6.2.10 Revitalize established business and commercial centers. 15
Ensure availability of supportive infrastructure and public A.16 services. 17
Encourage mixed-use development that reinforces existing B.18 small businesses or attracts locally-owned businesses. 19
6.2.11 Support the diversity of the arts, cultural, entertainment and 20 sports (indoor and outdoor) enterprises as important and 21 necessary to attracting and retaining a highly-skilled and 22 educated workforce, including young professionals and growing 23 families who represent an increasing portion of the local 24 workforce. 25
Provide infrastructure to support arts programing accessible to A.26 residents and visitors alike. 27
Encourage participation in state and national programs to B.28 develop arts and cultural heritage focal areas in appropriate 29 sectors of the Development District. 30
Support the incorporation of public art and art spaces where C.31 appropriate. 32
6.2.12 Improve the physical environment. 33
A. Provide design standards for buildings and public spaces to 34 foster attractive architecture on Complete Streets. Urban 35 design overlay districts should be adopted for Downtown, the 36 Great Mills Road Corridor and the FDR Boulevard Corridor. 37 Development in these districts will favor the creation of 38 walkable places supported by transit and cycling. 39
B. Design new street connections to break away from suburban 40 street patterns, to improve accessibility, visibility and security, 41 and to open up land for new development. First priority should 42 be given to transportation improvements that serve retail areas. 43 The proposed network of road connections will help transform 44 these areas into walkable commercial and civic destinations. 45
6.2.13 Improve public safety. 46
A. Provide more street lights. The lack of adequate street lighting 47 was identified as a key concern of residents, business and 48 property owners. Adequate street lighting deters crime, creates 49 a sense of place and develops a visual boundary for the 50 commercial area. No public street in Lexington Park should be 51 built or improved without the installation of streetlights. Create 52 incentives to encourage property owners to enhance lighting on 53 private property. Lighting must adhere to policies to avoid 54 illuminating the night sky and avoid offsite glare. 55
B. Support establishment of a Sheriff’s District 4 Station on Great 56 Mills Road as discussed in Chapter 5. 57
58
PC August 2015 6-3 Lexington Park Development District Master Plan
1
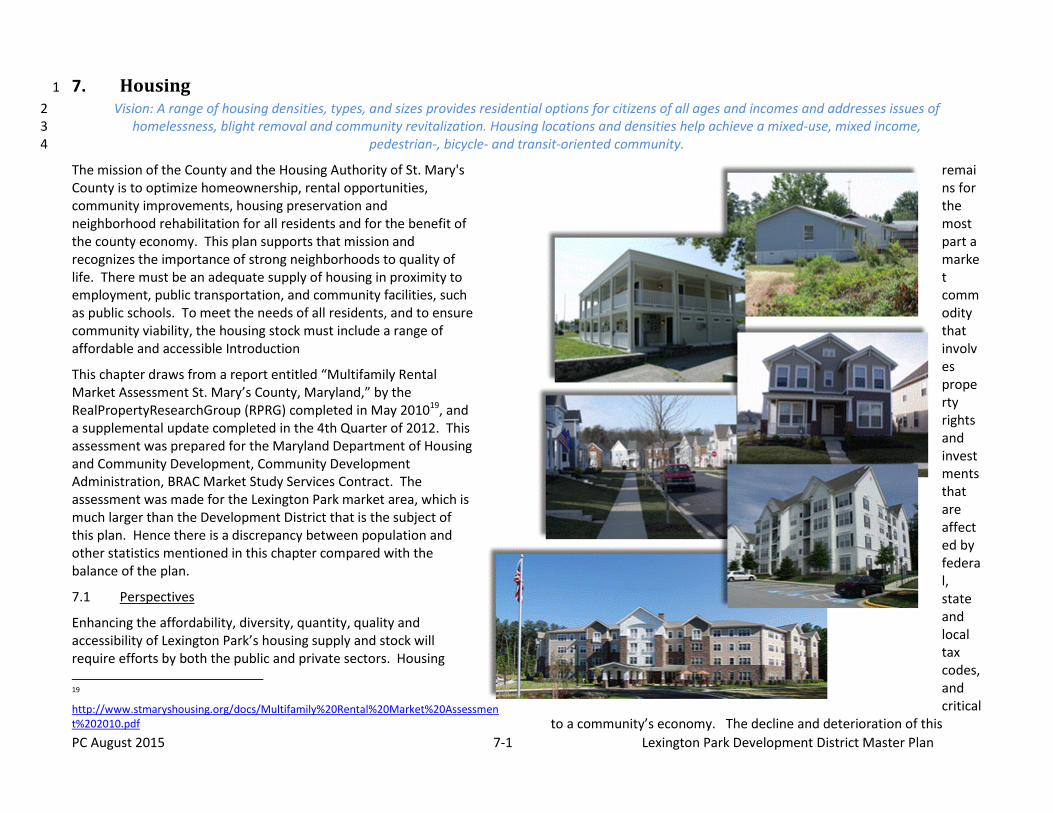
PC August 2015 7-1 Lexington Park Development District Master Plan
7. Housing 1
Vision: A range of housing densities, types, and sizes provides residential options for citizens of all ages and incomes and addresses issues of 2 homelessness, blight removal and community revitalization. Housing locations and densities help achieve a mixed-use, mixed income, 3
pedestrian-, bicycle- and transit-oriented community. 4
The mission of the County and the Housing Authority of St. Mary's County is to optimize homeownership, rental opportunities, community improvements, housing preservation and neighborhood rehabilitation for all residents and for the benefit of the county economy. This plan supports that mission and recognizes the importance of strong neighborhoods to quality of life. There must be an adequate supply of housing in proximity to employment, public transportation, and community facilities, such as public schools. To meet the needs of all residents, and to ensure community viability, the housing stock must include a range of affordable and accessible Introduction
This chapter draws from a report entitled “Multifamily Rental Market Assessment St. Mary’s County, Maryland,” by the RealPropertyResearchGroup (RPRG) completed in May 201019, and a supplemental update completed in the 4th Quarter of 2012. This assessment was prepared for the Maryland Department of Housing and Community Development, Community Development Administration, BRAC Market Study Services Contract. The assessment was made for the Lexington Park market area, which is much larger than the Development District that is the subject of this plan. Hence there is a discrepancy between population and other statistics mentioned in this chapter compared with the balance of the plan.
7.1 Perspectives
Enhancing the affordability, diversity, quantity, quality and accessibility of Lexington Park’s housing supply and stock will require efforts by both the public and private sectors. Housing
19
http://www.stmaryshousing.org/docs/Multifamily%20Rental%20Market%20Assessment%202010.pdf
remains for the most part a market commodity that involves property rights and investments that are affected by federal, state and local tax codes, and critical
to a community’s economy. The decline and deterioration of this
PC August 2015 7-2 Lexington Park Development District Master Plan
commodity directly impacts families, neighborhoods, the county’s economy and investments coming into the county.
Lexington Park is defined as a Census-Designated Place (CDP) in St. Mary's County, and also is designated as a Micropolitan Statistical Area. That is, it includes an urban core with a population of at least 10,000, but less than 50,000. Within this area are a significant number of households with only elderly persons. Housing and services must remain available for this segment of the population, because a majority of these households have incomes that remain static or fall well below any ability to pay for their homes, or afford rental housing without some form of subsidy.
7.1.1 Tools and Incentives to Promote Affordable Housing
Some of the numerous tools and incentives available to support affordable home ownership have been grouped in three general categories below. This plan recommends that the County utilize the following tools and incentives (and others that may be identified during the planning period ) as necessary to achieve the housing recommendations of this Chapter:
Housing Production: A.
i. Housing Trust Funds
ii. Inclusionary Zoning Ordinances
iii. Low-Income Housing Tax Credits
iv. Tax Increment Financing
v. The County’s Workforce Capital Fund
vi. State Financing Programs
vii. Flexible Development Standards
viii. Property tax exemption
ix. Parking reductions
x. Fee waivers or exemptions
xi. Fees paid at closing
xii. Process revisions
xiii. Expedited Reviews
xiv. Quick turn-around for County Commissioners support letters, resolutions or funding applications
xv. Mixed income housing communities
Owner Occupancy: B.
i. Individual Development Accounts (IDAs)
ii. Homeownership and Education Counseling
iii. Earned Income Tax Credit
iv. Section 8 Homeownership Program
v. Below Market Mortgage Products
vi. Down payment and Closing Cost Assistance
Housing Retention. Items in the Housing Production list of tools C.& incentives apply to preserving affordable workforce housing. The following also apply:
i. Code Enforcement
ii. Ongoing Property Assessment and Inventory
iii. Tax Relief Assistance
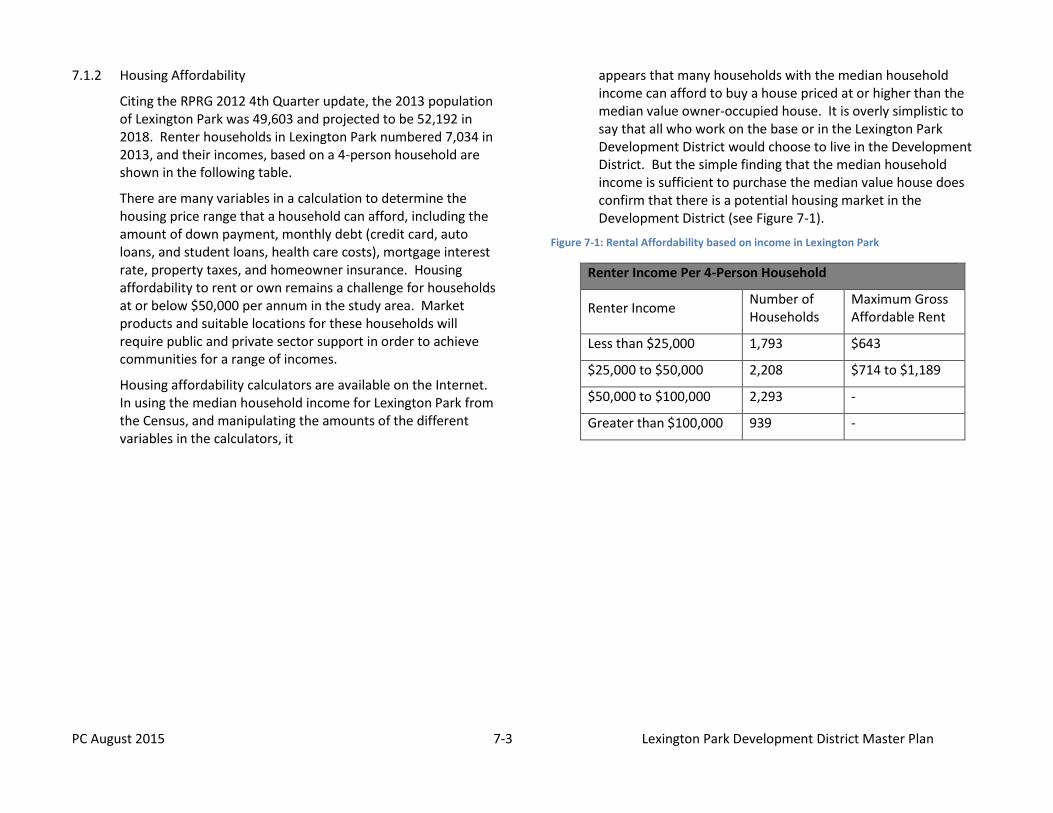
PC August 2015 7-3 Lexington Park Development District Master Plan
7.1.2 Housing Affordability
Citing the RPRG 2012 4th Quarter update, the 2013 population of Lexington Park was 49,603 and projected to be 52,192 in 2018. Renter households in Lexington Park numbered 7,034 in 2013, and their incomes, based on a 4-person household are shown in the following table.
There are many variables in a calculation to determine the housing price range that a household can afford, including the amount of down payment, monthly debt (credit card, auto loans, and student loans, health care costs), mortgage interest rate, property taxes, and homeowner insurance. Housing affordability to rent or own remains a challenge for households at or below $50,000 per annum in the study area. Market products and suitable locations for these households will require public and private sector support in order to achieve communities for a range of incomes.
Housing affordability calculators are available on the Internet. In using the median household income for Lexington Park from the Census, and manipulating the amounts of the different variables in the calculators, it
appears that many households with the median household income can afford to buy a house priced at or higher than the median value owner-occupied house. It is overly simplistic to say that all who work on the base or in the Lexington Park Development District would choose to live in the Development District. But the simple finding that the median household income is sufficient to purchase the median value house does confirm that there is a potential housing market in the Development District (see Figure 7-1).
Figure 7-1: Rental Affordability based on income in Lexington Park
Renter Income Per 4-Person Household
Renter Income Number of Households
Maximum Gross Affordable Rent
Less than $25,000 1,793 $643
$25,000 to $50,000 2,208 $714 to $1,189
$50,000 to $100,000 2,293 -
Greater than $100,000 939 -
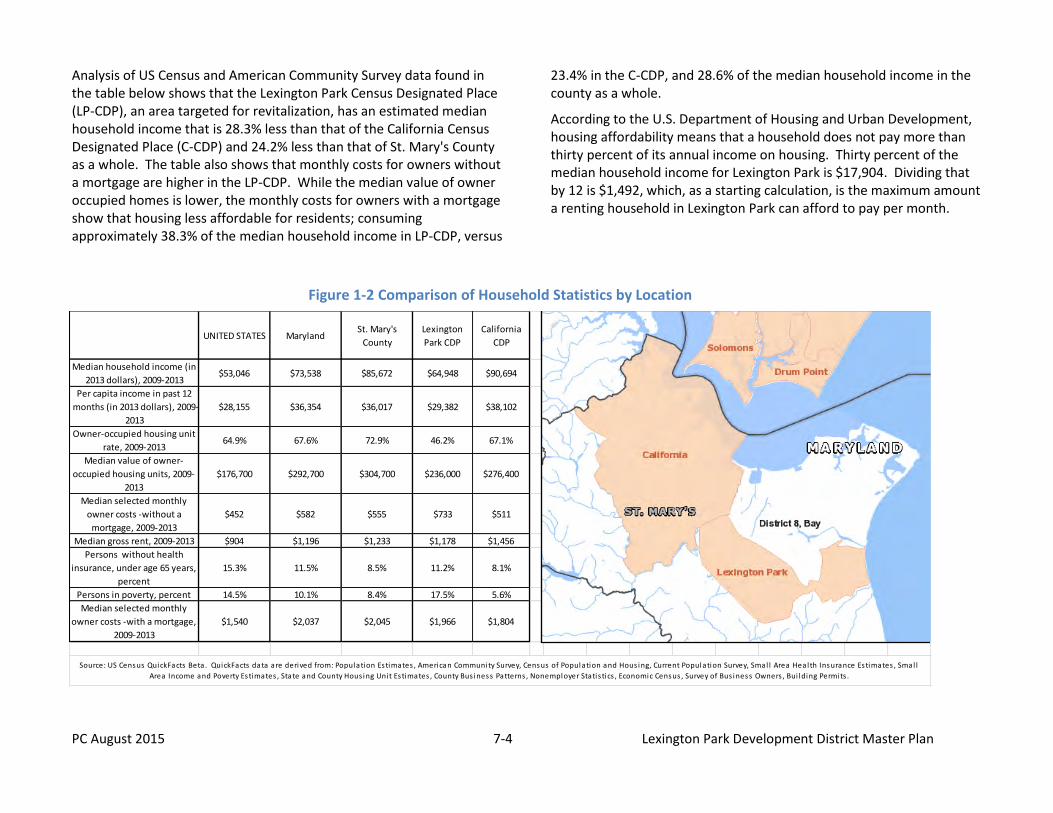
PC August 2015 7-4 Lexington Park Development District Master Plan
Analysis of US Census and American Community Survey data found in the table below shows that the Lexington Park Census Designated Place (LP-CDP), an area targeted for revitalization, has an estimated median household income that is 28.3% less than that of the California Census Designated Place (C-CDP) and 24.2% less than that of St. Mary's County as a whole. The table also shows that monthly costs for owners without a mortgage are higher in the LP-CDP. While the median value of owner occupied homes is lower, the monthly costs for owners with a mortgage show that housing less affordable for residents; consuming approximately 38.3% of the median household income in LP-CDP, versus
23.4% in the C-CDP, and 28.6% of the median household income in the county as a whole.
According to the U.S. Department of Housing and Urban Development, housing affordability means that a household does not pay more than thirty percent of its annual income on housing. Thirty percent of the median household income for Lexington Park is $17,904. Dividing that by 12 is $1,492, which, as a starting calculation, is the maximum amount a renting household in Lexington Park can afford to pay per month.
UNITED STATES MarylandSt. Mary's
County
Lexington
Park CDP
California
CDP
Median household income (in
2013 dollars), 2009-2013$53,046 $73,538 $85,672 $64,948 $90,694
Per capita income in past 12
months (in 2013 dollars), 2009-
2013
$28,155 $36,354 $36,017 $29,382 $38,102
Owner-occupied housing unit
rate, 2009-201364.9% 67.6% 72.9% 46.2% 67.1%
Median value of owner-
occupied housing units, 2009-
2013
$176,700 $292,700 $304,700 $236,000 $276,400
Median selected monthly
owner costs -without a
mortgage, 2009-2013
$452 $582 $555 $733 $511
Median gross rent, 2009-2013 $904 $1,196 $1,233 $1,178 $1,456
Persons without health
insurance, under age 65 years,
percent
15.3% 11.5% 8.5% 11.2% 8.1%
Persons in poverty, percent 14.5% 10.1% 8.4% 17.5% 5.6%
Median selected monthly
owner costs -with a mortgage,
2009-2013
$1,540 $2,037 $2,045 $1,966 $1,804
Source: US Census QuickFacts Beta. QuickFacts data are derived from: Population Estimates , American Community Survey, Census of Population and Hous ing, Current Population Survey, Smal l Area Health Insurance Estimates , Smal l
Area Income and Poverty Estimates , State and County Hous ing Unit Estimates , County Bus iness Patterns , Nonemployer Statis tics , Economic Census , Survey of Bus iness Owners , Bui lding Permits .
Figure 1-2 Comparison of Household Statistics by Location
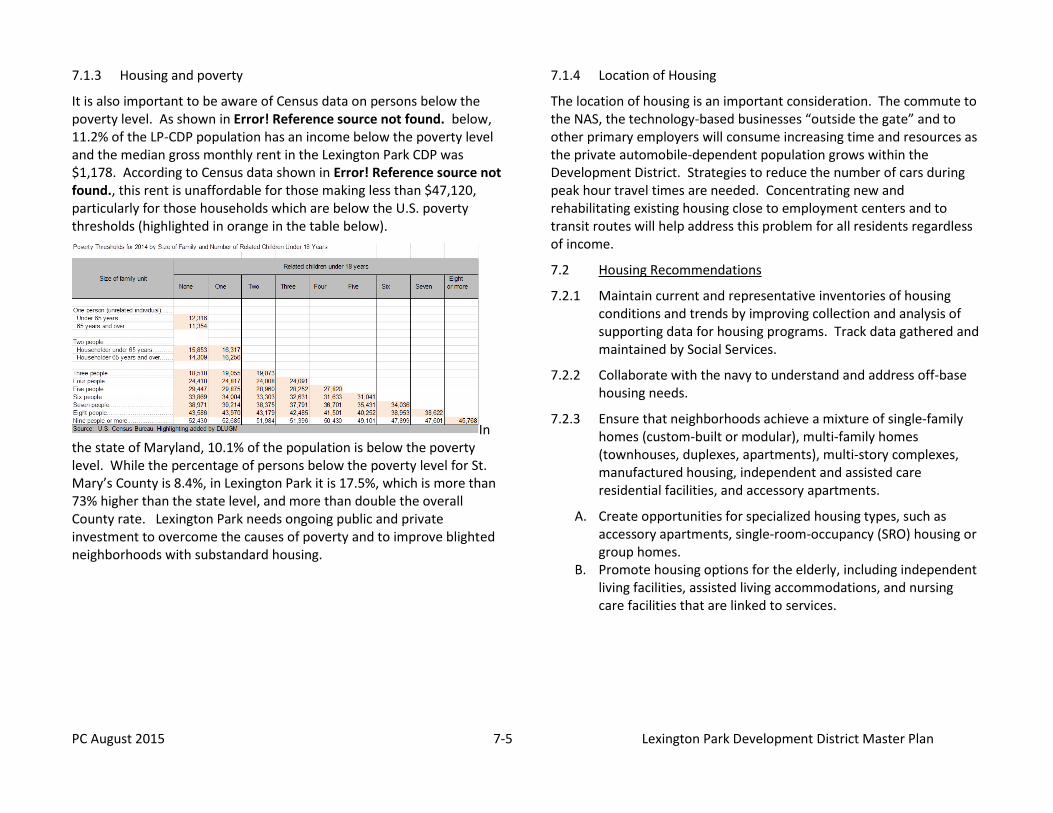
PC August 2015 7-5 Lexington Park Development District Master Plan
7.1.3 Housing and poverty
It is also important to be aware of Census data on persons below the poverty level. As shown in Error! Reference source not found. below, 11.2% of the LP-CDP population has an income below the poverty level and the median gross monthly rent in the Lexington Park CDP was $1,178. According to Census data shown in Error! Reference source not found., this rent is unaffordable for those making less than $47,120, particularly for those households which are below the U.S. poverty thresholds (highlighted in orange in the table below).
In the state of Maryland, 10.1% of the population is below the poverty level. While the percentage of persons below the poverty level for St. Mary’s County is 8.4%, in Lexington Park it is 17.5%, which is more than 73% higher than the state level, and more than double the overall County rate. Lexington Park needs ongoing public and private investment to overcome the causes of poverty and to improve blighted neighborhoods with substandard housing.
7.1.4 Location of Housing
The location of housing is an important consideration. The commute to the NAS, the technology-based businesses “outside the gate” and to other primary employers will consume increasing time and resources as the private automobile-dependent population grows within the Development District. Strategies to reduce the number of cars during peak hour travel times are needed. Concentrating new and rehabilitating existing housing close to employment centers and to transit routes will help address this problem for all residents regardless of income.
7.2 Housing Recommendations
7.2.1 Maintain current and representative inventories of housing conditions and trends by improving collection and analysis of supporting data for housing programs. Track data gathered and maintained by Social Services.
7.2.2 Collaborate with the navy to understand and address off-base housing needs.
7.2.3 Ensure that neighborhoods achieve a mixture of single-family homes (custom-built or modular), multi-family homes (townhouses, duplexes, apartments), multi-story complexes, manufactured housing, independent and assisted care residential facilities, and accessory apartments.
Create opportunities for specialized housing types, such as A.accessory apartments, single-room-occupancy (SRO) housing or group homes.
Promote housing options for the elderly, including independent B.living facilities, assisted living accommodations, and nursing care facilities that are linked to services.
PC August 2015 7-6 Lexington Park Development District Master Plan
7.2.4 Improve the collaboration between the Housing Authority and County Government, to foster a working partnership, possibly providing working capital funds and other supporting tools.
7.2.5 Create incentives for housing preservation and rehabilitation, including adaptive reuse projects.
7.2.6 Consider options to integrate a reasonable number of housing units for all income groups into all new housing developments to minimize the extent to which the Development District is comprised of income based neighborhoods
Develop an inclusionary zoning policy. A. Utilize available tools and incentives (see 7.1.2).to promote B.
construction and retention of affordable housing
7.2.7 Develop strategies and programs to improve substandard housing stock.
Enforce regulations for property maintenance and elimination A.of unsafe structures and blight.
Encourage public-private partnerships dedicated to bringing B.investment to the Lexington Park housing stock and preserving the existing affordable housing stock as demonstrated by St. Mary’s County Housing Authority’s public – private partnerships.
Invite land assembly strategies and land banking. C. Pursue grants and participate in state and federal programs. D.
7.2.8 Assure adequate privacy and comfort, safety from fire, flood and other hazards, and protection from health threats while maintaining home affordability.
Increase awareness of code requirements, their impact on A.affordability, and availability of programs and techniques that can offset some increased costs.
Utilize building designs and materials that increase overall B.housing affordability, considering not only initial construction costs but also including energy efficiency, structural durability (maintenance), and access to infrastructure and transit.
7.2.9 Promote, recognize and reward good design.
Provide bonus densities and other incentives for enhanced A.design of neighborhoods.
Seek planning commission recognition for innovative and B.effective community design.
Seek Chesapeake Bay Commission recognition of "Bay Friendly" C.environmental design.
Support green building design for energy efficiency and long-D.term affordability of the housing.
1 2
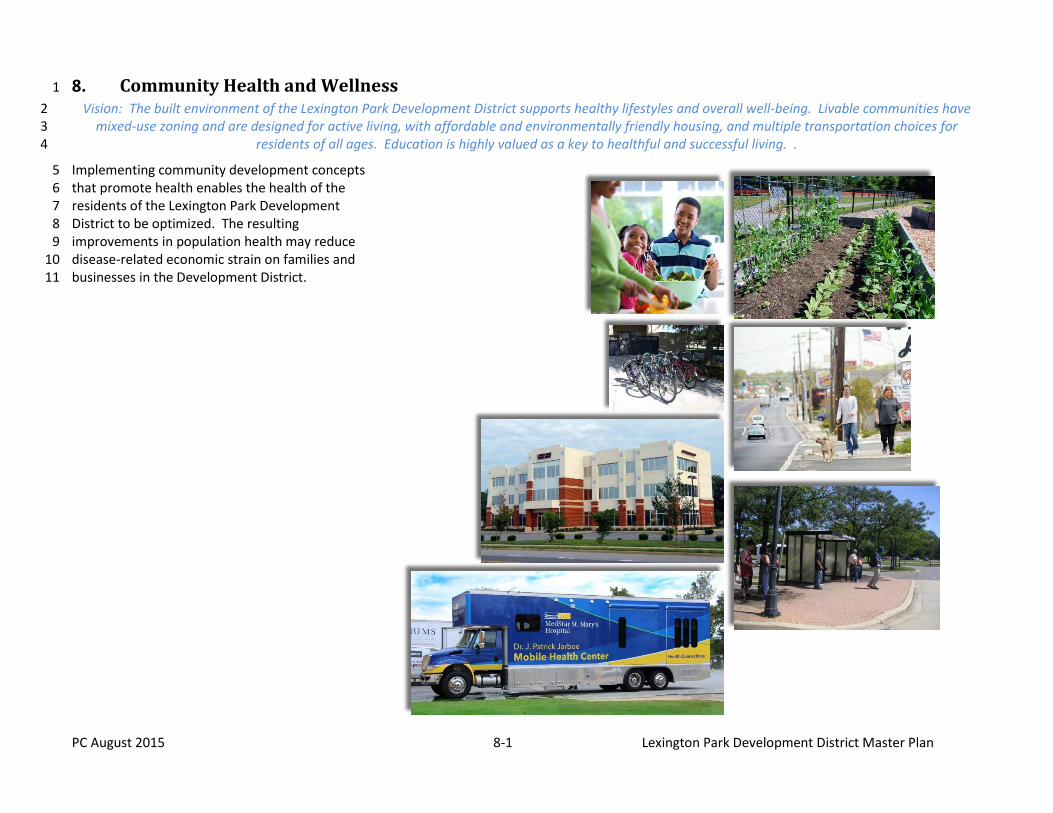
PC August 2015 8-1 Lexington Park Development District Master Plan
8. Community Health and Wellness 1
Vision: The built environment of the Lexington Park Development District supports healthy lifestyles and overall well-being. Livable communities have 2 mixed-use zoning and are designed for active living, with affordable and environmentally friendly housing, and multiple transportation choices for 3
residents of all ages. Education is highly valued as a key to healthful and successful living. . 4
Implementing community development concepts 5 that promote health enables the health of the 6 residents of the Lexington Park Development 7 District to be optimized. The resulting 8 improvements in population health may reduce 9 disease-related economic strain on families and 10 businesses in the Development District. 11
PC August 2015 8-2 Lexington Park Development District Master Plan
8.1 Impact of Community Design on Population Health 1
Community design and the environment in which people live, learn, 2 work, and play, critically impact the health of a population and the 3 opportunity for individuals within that population to make healthy 4 choices. The built environment – the physical design and parts of a 5 community, such as buildings, infrastructure, open spaces, and 6 transportation corridors – influences a variety of population health 7 indicators, including key health measures linked to chronic disease and 8 behavioral health. 9
This Plan recommends adding health impact assessments (HIAs) into 10 decision making processes to advance the building of a safe and thriving 11 community. HIAs differ from other commonly used tools, such as 12 health risk assessments and public health assessments. HIAs are 13 intended to 1)inform deliberations on a specific proposal such as 14 legislation, rulemaking, or development authorization; 2) systematically 15 assess the multiple influences on health that can occur as a result of 16 social, economic, and environmental changes; and 3) use a broad 17 definition of health that includes physical and psychological health and 18 general well-being. HIAs bring together scientific data, health expertise 19 and public input to identify the potential—and often overlooked—20 health effects of proposed new laws, regulations, projects and 21 programs. They offer practical recommendations for ways to minimize 22 risks and capitalize on opportunities to improve health. 23
As supported by the U.S. Centers for Disease Control and Prevention 24 (CDC)20, healthy community design improves residents’ health in the 25 ways discussed below. 26
27
20
Centers for Disease Control and Prevention, US Department of Health and Human Services. www.cdc.gov/healthyplaces. “Designing and Building Healthy Places.” Accessed March 31, 2013.
8.1.1 Increasing physical activity and access to healthy food. 28
Numerous case studies demonstrate the positive impact of 29 community design practices on the physical activity levels and 30 nutritional choices of residents21. Increasing physical activity 31 and eating healthier foods reduce chronic diseases such as 32 diabetes and heart disease22. Transportation planning 33 decisions, including those related to sidewalks, bike paths, and 34 mass transit, affect population health and physical activity 35 levels.23 Complete Streets and other community design 36 principles supporting pedestrian and bicycle transportation are 37 key factors in promoting physical activity. Convenient and 38 affordable public transit can increase access to a variety of 39 grocery stores to take advantage of weekly sales prices, while 40 walking to and from bus stops provides more exercise than 41 driving. Easy access to nearby healthy food options, including 42 fresh produce available in grocery stores and farmer’s markets, 43 is essential to ensuring adequate fruit and vegetable 44 consumption by residents. Similarly, an abundance of 45 unhealthy food options in proximity to schools, workplaces, and 46 homes demonstrated by the density of fast food retailers may 47 be linked to poor nutritional decisions. 48
21
Guide to Community Preventive Services. “Environmental and policy approaches to increase physical activity.” www.thecommunityguide.org/pa/environmental-policy. Accessed March 14, 2013.
Active Living Research, Robert Wood Johnson Foundation. “Designing for Active Living Among Adults.” 2008. http://www.activelivingresearch.org/files/Active_Adults.pdf Boone-Heinonen, J. et al., What neighborhood area captures built environment features related to adolescent physical activity? Health and Place. November 2010. 16(6):1280-1286. 22
Auchincloss, A. H., A. V. Diez Roux, et al., Neighborhood resources for physical activity and healthy foods and incidence of type 2 diabetes mellitus: the Multi-Ethnic study of Atherosclerosis. Arch Intern Med. 2009; 169(18): 1698-704. 23
Litman, T. “Integrating Public Health Objectives in Transportation Planning.” American Journal of Health Promotion 18(1): 103-108, 2003.
Wener, RE and Evans, G.W. “A Morning Stroll: Levels of Physical Activity in Car and Mass Transit Commuting”. Environment and Behavior 39(1): 62—72, 2007.
PC August 2015 8-3 Lexington Park Development District Master Plan
8.1.2 Improving air and water quality while minimizing the impact of 1 climate change. 2
Air quality is largely influenced by transportation-related 3 pollutants, including respiratory irritants that trigger asthma 4 and lead to poor population-level control of asthma. 5 Community design practices promoting non-motorized 6 transportation, such as walking and bicycling, may reduce air 7 pollutants linked to asthma and other respiratory diseases. 8 Public transit availability that results in decreased vehicular 9 congestion24 and compact, mixed-use development25 that 10 reduces the distance between work and home can have positive 11 impacts on air quality. 12
8.1.3 Strengthening the social fabric of a community and decreasing 13 mental health stresses. 14
Community design policies which ensure easy access to 15 nature/green spaces is positively associated with decreased 16 depression, anxiety, stress, mental fatigue, and problems with 17 attention deficit in children26. The American Planning 18 Association also suggests that “Green residential spaces are 19 gathering places where neighbors form social ties that produce 20 stronger, safer neighborhoods.”27 Housing should be located 21
24
Friedman MS, Powell Ke, Hutwagner L, et al: Impact of changes in transportation and commuting behaviors during the 1996 Summer Olympic Games in Atlanta on air quality and childhood asthma. JAMA 285(7):897-905, 2001.
25 Litman, T. “Integrating Public Health Objectives in Transportation Planning.” American
Journal of Health Promotion 18(1): 103-108, 2003. 26
Evans GW. “The built environment and mental health.” Journal of Urban Health 80(4):536-555, 2003. Sullivan W.C., Chang C.Y. “Mental health and the built environment.” In: Dannenberg A.L., Frumkin H., Jackson R.L. Making healthy places: designing and building for health, well-being, and sustainability. Washington DC: Island Press, 2011. 27
American Planning Association. “How Cities Use Parks to Create Safer Neighborhoods.” https://www.planning.org/cityparks/briefingpapers/saferneighborhoods.htm. Accessed March 31, 2013.
near active and passive parks and open space, and all recreation 22 areas should be accessible by sidewalks, bicycles, and transit. 23
The concept of behavioral health includes the prevention and 24 control of substance misuse and abuse, such as that related to 25 alcoholic beverages. Community design policies and 26 management practices may impact substance abuse at the 27 population level. For example, excessive alcohol consumption 28 has been linked to increased alcohol outlet density in 29 communities28. Regulation of alcoholic beverage outlet density 30 through licensing is an evidence-based community strategy to 31 decrease population-level problems with excessive alcohol 32 consumption harms29. 33
8.1.4 Reducing injuries to pedestrians and bicyclists from motor 34 vehicles. 35
Ensuring safe recreational places and safe transportation 36 corridors for pedestrians and bicyclists not only encourages 37 physical activity (as residents often cite lack of safe places to 38 exercise as a reason for physical inactivity), but also results in 39 decreased injuries from motor vehicles30. Traffic calming 40 measures, sidewalks, bikeways, and separating major motor 41 vehicle traffic from housing areas are examples of 42 environmental interventions to reduce injuries to pedestrians 43 and bicyclists31. Residents who live in communities applying 44
28
Campbell C.A., Hahn R.A., Elder R., Brewer R., Chattopadhyay S., Fielding J., Naimi T.S., Toomey T., Briana Lawrence B., Middleton J.C., Task Force on Community Preventive Services. “The effectiveness of limiting alcohol outlet density as a means of reducing excessive alcohol consumption and alcohol-related harms.” Am J Prev Med 2009;37(6):556-69. 29
Task Force on Community Preventive Services. “Recommendations for reducing excessive alcohol consumption and alcohol-related harms by limiting alcohol outlet
density.” Am J Prev Med 2009; 37(6):570-1. 30
Cummins S.K., Jackson R.J., "The Built Environment and Children's Health". Pediatric Clinics of North America 48(5): pp. 1241-1252.
31 Roberts I., Norton R., Jackson R., et al. “Effect of environmental factors on risk of
injury of child pedestrians by motor vehicles: a case-control study.” BMJ 310(6972):91-
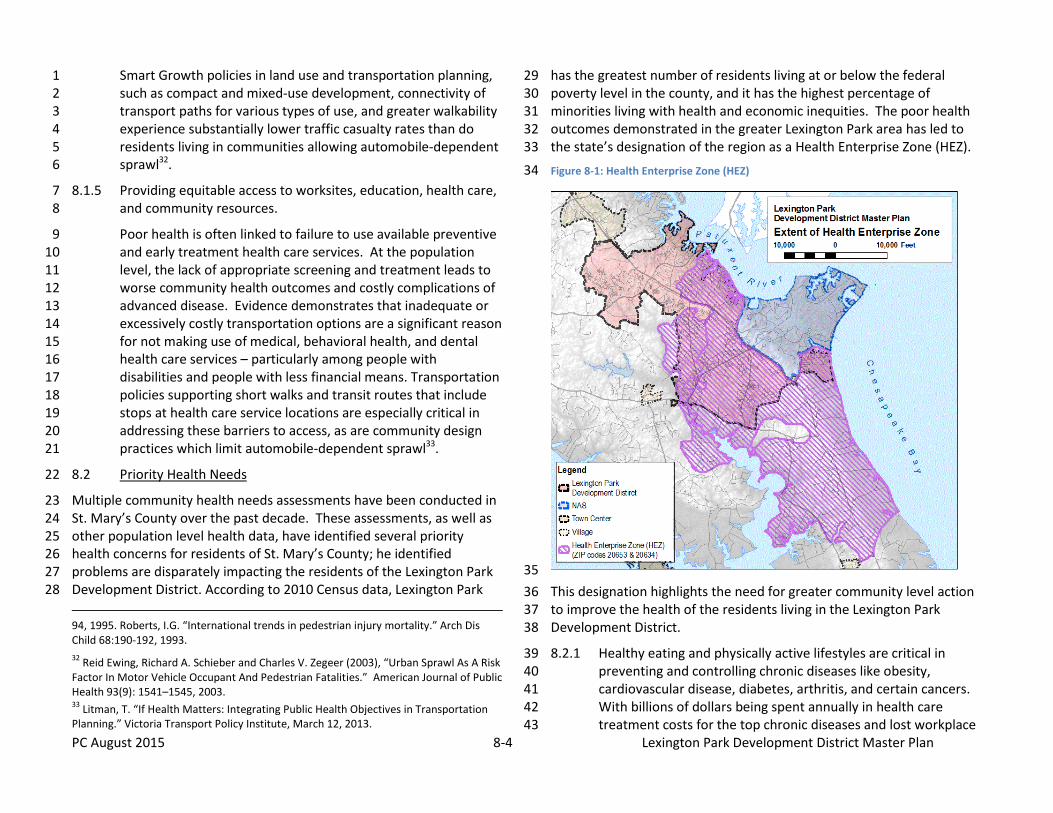
PC August 2015 8-4 Lexington Park Development District Master Plan
Smart Growth policies in land use and transportation planning, 1 such as compact and mixed-use development, connectivity of 2 transport paths for various types of use, and greater walkability 3 experience substantially lower traffic casualty rates than do 4 residents living in communities allowing automobile-dependent 5 sprawl32. 6
8.1.5 Providing equitable access to worksites, education, health care, 7 and community resources. 8
Poor health is often linked to failure to use available preventive 9 and early treatment health care services. At the population 10 level, the lack of appropriate screening and treatment leads to 11 worse community health outcomes and costly complications of 12 advanced disease. Evidence demonstrates that inadequate or 13 excessively costly transportation options are a significant reason 14 for not making use of medical, behavioral health, and dental 15 health care services – particularly among people with 16 disabilities and people with less financial means. Transportation 17 policies supporting short walks and transit routes that include 18 stops at health care service locations are especially critical in 19 addressing these barriers to access, as are community design 20 practices which limit automobile-dependent sprawl33. 21
8.2 Priority Health Needs 22
Multiple community health needs assessments have been conducted in 23 St. Mary’s County over the past decade. These assessments, as well as 24 other population level health data, have identified several priority 25 health concerns for residents of St. Mary’s County; he identified 26 problems are disparately impacting the residents of the Lexington Park 27 Development District. According to 2010 Census data, Lexington Park 28
94, 1995. Roberts, I.G. “International trends in pedestrian injury mortality.” Arch Dis Child 68:190-192, 1993.
32 Reid Ewing, Richard A. Schieber and Charles V. Zegeer (2003), “Urban Sprawl As A Risk
Factor In Motor Vehicle Occupant And Pedestrian Fatalities.” American Journal of Public Health 93(9): 1541–1545, 2003. 33
Litman, T. “If Health Matters: Integrating Public Health Objectives in Transportation Planning.” Victoria Transport Policy Institute, March 12, 2013.
has the greatest number of residents living at or below the federal 29 poverty level in the county, and it has the highest percentage of 30 minorities living with health and economic inequities. The poor health 31 outcomes demonstrated in the greater Lexington Park area has led to 32 the state’s designation of the region as a Health Enterprise Zone (HEZ). 33
Figure 8-1: Health Enterprise Zone (HEZ) 34
35
This designation highlights the need for greater community level action 36 to improve the health of the residents living in the Lexington Park 37 Development District. 38
8.2.1 Healthy eating and physically active lifestyles are critical in 39 preventing and controlling chronic diseases like obesity, 40 cardiovascular disease, diabetes, arthritis, and certain cancers. 41 With billions of dollars being spent annually in health care 42 treatment costs for the top chronic diseases and lost workplace 43
PC August 2015 8-5 Lexington Park Development District Master Plan
productivity related to chronic diseases34, these conditions are 1 the most costly to both individual quality of life and the 2 economic sustainability of families and businesses. 3
Although limited, information does suggest that poor nutrition 4 and inadequate exercise continue to be a significant issue for 5 residents of Lexington Park, St. Mary’s County, and the state of 6 Maryland overall. Over 13% of the population in St. Mary’s 7 County has low access to grocery stores35. Over 72% of 8 Marylanders report eating less than five servings of fruits and 9 vegetables per day36. Less than 20% of Marylanders participate 10 in enough exercise to meet recommended levels37. These all 11 contribute to an extraordinary 65% of Marylander adults who 12 are either overweight or obese. Significant health inequities 13 exist related to obesity. African-American adults and children in 14 St. Mary’s County are disparately impacted by risk factors for 15 obesity when compared to white adults and children in the 16 county. These health inequalities confirm the need for greater 17 public health action serving the Lexington Park Development 18 District, where approximately 27% of the population self-19 identified as African-American in the 2010 Census. Data is not 20 available to adequately describe the disparities affecting other 21 race or ethnic groups that may be at risk. 22
8.2.2 Behavioral Health, which consists of mental health as well as 23 prevention and control of substance abuse, remains a top 24 priority for the Lexington Park area. Past community health 25 needs assessments indicated that addressing substance use 26 disorders is a top priority for community members. According 27 to the St. Mary's County Department of Aging and Human 28 Services, rates of substance abuse have consistently increased 29 in the county over the last several years. Get Connected to 30
34
DeVol, Ross, and Armen Bedroussian. “An Unhealthy America: The Economic Burden of Chronic Disease.” Milken Institute, October 2007. 35
USDA Food Environment Atlas, accessed Feb 2013 36
2009 Maryland Behavioral Risk Factor Surveillance System 37
2011 Maryland Behavioral Risk Factor Surveillance System
Health, a mobile primary care service offered in the Lexington 31 Park region by MedStar St. Mary’s Hospital, documents 32 approximately 60% of its patients in its first three years of 33 operation as having primary or secondary mental health 34 conditions. Alcohol abuse and other substance use disorders 35 frequently occur with mental health conditions such as anxiety, 36 depression, or other mood disorders38. 37
8.2.3 The greater Lexington Park area is federally designated as a 38 Health Professional Shortage Area for primary medical, mental 39 health, and dental providers. In the Lexington Park area Health 40 Enterprise Zone, residents experience a disproportionately high 41 number of hospital emergency department visits related to 42 barriers in accessing health care services within the community. 43 According to the 2010 American Community Survey (ACS), at 44 least 10% of adults in Lexington Park did not own a vehicle. 45 Additionally, past community health needs assessments found 46 transportation to be a barrier in accessing health care services. 47
8.3 Community Health and Wellness Recommendations based on 48 the Healthy St. Mary’s 2020 Plan 49
The Healthy St. Mary’s Partnership, the County’s health improvement 50 coalition, has adopted the Healthy St Mary’s 2020 Plan, to address 51 issues identified in community health needs assessments. This LPDD 52 Plan directly addresses key health issues affecting those currently living 53 in the Lexington Park area. The following recommendations are relevant 54 to land use and community design: 55
8.3.1 Increase access to healthy foods and beverages. 56
Identify “food deserts, utilizing an accepted definition of a Food A.57 Desert as developed by the US Department of Agriculture 58
38
Conway K.P., Compton W., Stinson F.S., Grant B.F. Lifetime comorbidity of DSM-IV mood and anxiety disorders and specific drug use disorders: results from the National Epidemiologic Survey on Alcohol and Related Conditions. Journal of Clinical Psychiatry, 2006 Feb; 67(2):247–257.
PC August 2015 8-6 Lexington Park Development District Master Plan
(USDA)39 or Johns Hopkins Center for a Livable Future40, 1 modified as appropriate for St. Mary’s County. 2
Support recruitment and retention of markets providing fresh B.3 and healthy foods, including grocery stores, with particular 4 attention to identified food deserts. 5
Ensure transportation options to support easy access to C.6 markets carrying fresh produce, with particular attention to 7 identified food deserts. 8
Increase access to locally produced, healthy food via transit-D.9 accessible farmers markets and stands that accept the 10 Electronic Benefits Transfer (EBT) Supplemental Nutrition 11 Assistance Program (SNAP) 12
Assess feasibility of converting vacant lots to community E.13 gardens. 14
8.3.2 Increase opportunities for regular physical activity. 15
Establish and implement a complete streets policy that A.16 considers the needs of all users, including pedestrians, cyclists, 17 and people with disabilities through strategies suggested by or 18 adapted from the National Complete Streets Coalition of Smart 19 Growth America41 and as supported in this plan: 20
i. Work with the county health improvement coalition, the 21 Healthy St. Mary’s Partnership, to establish a multi-22 disciplinary collaboration that will develop and implement a 23 complete streets policy. 24
39
United States Department of Agriculture (USDA) Food Environment Atlas. Accessed February 2013. 40
Johns Hopkins Center for a Livable Future. “2012 Baltimore City Food Environment Map Methodology,” page 2. Food Desert: “An area where the distance to a supermarket is more than ¼ mile, the median household income is at or below 185% of the Federal Poverty Level, over 40% of households have no vehicle available, and the average Healthy Food Availability Index score for supermarkets, convenience and corner stores is low (measured using the Nutrition Environment Measurement Survey).” 41
Smart Growth America. “Changing Procedure and Process.” www.smartgrowthamerica.org/complete-streets/implementation/changing-procedure-and-process. Accessed March 31, 2013.
ii. Systematically review and revise county design documents 25 related to transportation and community planning affecting 26 the Lexington Park Development District to include 27 complete streets language, ensuring that complete streets 28 considerations are applied to new construction, 29 retrofitting/reconstruction, repair, 30 resurfacing/restoration/rehabilitation, master planned 31 neighborhoods and planned unit developments, transit, and 32 other project types. 33
iii. Formally prioritize multi-modal projects, including those 34 projects that close gaps in the multi-modal network. 35
iv. Adopt or update relevant plans, such as: Bicycle & 36 Pedestrian Master Plan (or the relevant components in the 37 St. Mary’s County Transportation Plan), and Non-Motorized 38 Network Plan to include complete streets concepts. 39
v. As recommended in Section 4.4.1, require consultants and 40 developers to use a complete streets approach in project 41 design. 42
Implement traffic calming measures42 (e.g., narrowing lanes, B.43 traffic circles, chokers, reduced speed limits, use of trees next to 44 streets, and raised pedestrian crossings) in new and 45 maintenance construction projects. 46
Prioritize availability of parks and open green spaces for C.47 resident recreational use by establishing a policy for new 48 housing development to incorporate green space. 49
Prioritize development and maintenance of trail transportation D.50 corridors and trail-related facilities for pedestrians and 51 bicyclists. 52
Prioritize development of a network of bikeways and bicycle E.53 facilities safely connecting cyclists from housing to transit stops, 54 worksites, schools, recreational areas, and key community 55 destinations. 56
42
Bunn F., Collier T., Frost C., Ker K., Steinbach R., Roberts I., Wentz R. Area-wide traffic calming for preventing traffic related injuries. Cochrane Database of Systematic Reviews 2003, Issue 1.
PC August 2015 8-7 Lexington Park Development District Master Plan
Attract adequate indoor recreation facilities. F.1 Achieve national recognition as a Bicycle Friendly Community by G.2
the League of American Bicyclists. 3 Implement a policy ensuring that housing and other community H.4
development projects include safe and continuous sidewalks 5 buffered from busy roadways, and that sidewalks link to 6 locations of interest, such as schools, workplaces, community 7 centers, and recreational areas. 8
Improve availability of the St. Mary’s Transit System and I.9 increase hours of service. 10
8.3.3 Improve behavioral health outcomes, including those related to 11 mental health and substance abuse. 12
Use community design practices that encourage social support A.13 networks and improve mental health, including housing projects 14 with open green spaces adjacent to homes and sidewalks to 15 enhance sense of community through better connections to 16 neighbors. 17
Recognize the health impacts of the number of alcoholic B.18 beverage outlet locations. 19
20
8.3.4 Improve access to health care and human services. 21
Identify physical sites for medical, behavioral, and dental health A.22 care providers in community development plans. 23
Ensure affordable and easily accessible transit options that link B.24 housing developments to health and human service delivery 25 locations, such as primary care providers, behavioral health care 26 providers, dentists, and pharmacies – for example, by sustaining 27 the Health Enterprise Zone Medical Transport Route as part of 28 the St. Mary’s Transit System. 29
Expand transport and mobility services for individuals with C.30 varying disabilities. 31
8.3.5 Include Health Impact Assessments (HIA) in the development 32 review process of approving community design and 33 transportation policies and projects. 34
Train community and transit planners on HIA utilization, such as A.35 through the online training course offered by the American 36 Planning Association and the National Association of City and 37 County Health Officials. 38
Integrate HIA into the process of decision-making by B.39 community, transit planners, appointed boards, and the 40 Commissioners of St. Mary’s County.41
42
PC August 2015 8-8 Lexington Park Development District Master Plan
1
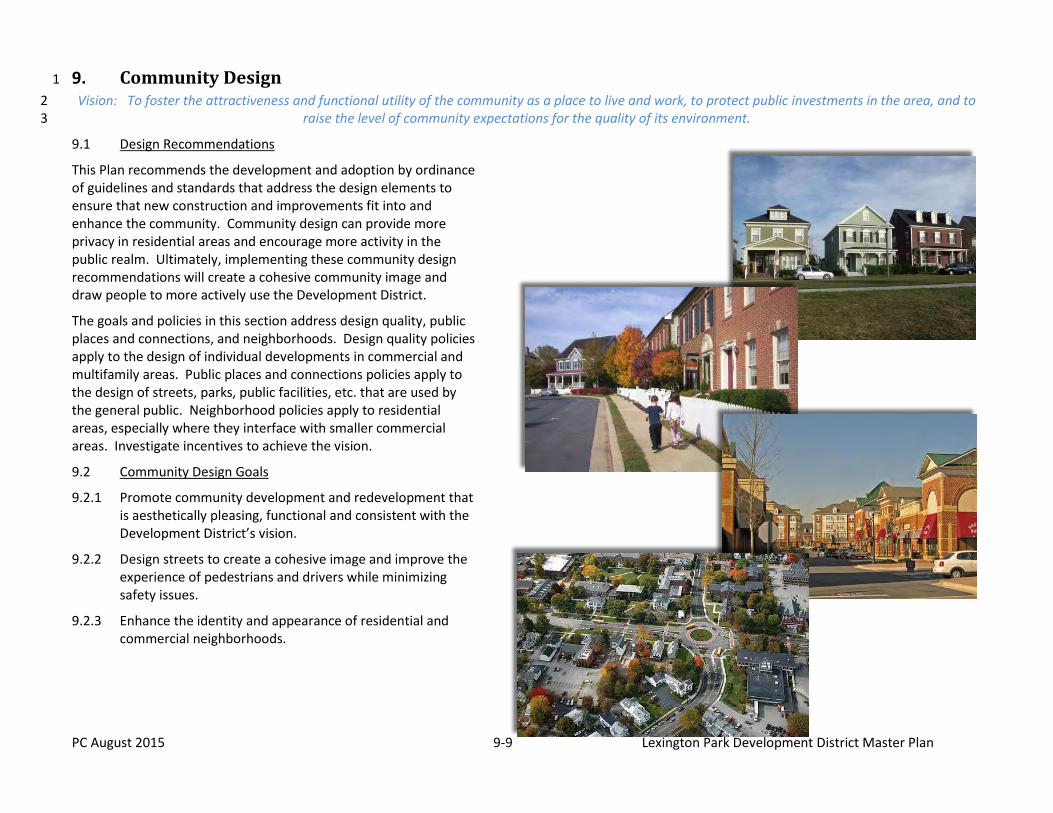
PC August 2015 9-9 Lexington Park Development District Master Plan
9. Community Design 1
Vision: To foster the attractiveness and functional utility of the community as a place to live and work, to protect public investments in the area, and to 2 raise the level of community expectations for the quality of its environment. 3
9.1 Design Recommendations
This Plan recommends the development and adoption by ordinance of guidelines and standards that address the design elements to ensure that new construction and improvements fit into and enhance the community. Community design can provide more privacy in residential areas and encourage more activity in the public realm. Ultimately, implementing these community design recommendations will create a cohesive community image and draw people to more actively use the Development District.
The goals and policies in this section address design quality, public places and connections, and neighborhoods. Design quality policies apply to the design of individual developments in commercial and multifamily areas. Public places and connections policies apply to the design of streets, parks, public facilities, etc. that are used by the general public. Neighborhood policies apply to residential areas, especially where they interface with smaller commercial areas. Investigate incentives to achieve the vision.
9.2 Community Design Goals
9.2.1 Promote community development and redevelopment that is aesthetically pleasing, functional and consistent with the Development District’s vision.
9.2.2 Design streets to create a cohesive image and improve the experience of pedestrians and drivers while minimizing safety issues.
9.2.3 Enhance the identity and appearance of residential and commercial neighborhoods.
PC August 2015 9-2 Lexington Park Development District Master Plan
9.3 Community Design Policies
9.3.1 Site and Building Design
Encourage design of major private and public buildings to create A.important focal points in the community.
Ensure that development proposals are consistent with adopted B.design standards so that new projects contribute to the community and complement adjacent development.
Investigate incentives to encourage development that is visually C.stimulating and thoughtful, and that convey quality architecture.
Ensure that development and redevelopment relates, connects, D.and continues design quality and site functions from site to site in multifamily, public facilities and commercial areas.
Encourage human-scaled new development that surrounds or is E.located adjacent to public spaces that will enrich the public space and encourage people to use them, enhanced architectural elements and building materials (e.g., windows with displays or activity inside to provide interest, street furniture, etc.).
Encourage development to provide public amenities, such as F.public and pedestrian access, pedestrian-oriented building design, mid-block connections, public spaces, activities, openness, sunlight, and view preservation.
Encourage private and institutional developers to incorporate G.artwork into public areas of their projects.
To minimize negative visual impacts, encourage rooftop H.mechanical equipment, loading areas and dumpster screening to be designed so that it is integral to the building’s architecture.
Buffer the visual impact of commercial, office, industrial and I.institutional development on residential areas by requiring appropriate building and site design, landscaping, and shielded lighting to be used.
Encourage architectural elements that provide rain cover and J.solar access to pedestrian areas.
Ensure clear and ample walkways for pedestrians to connect K.public sidewalks and parking areas to building entrances, and to connect within and between developments.
9.3.2 Signs
Encourage signage to be unique and complimentary in scale to A.the building’s architecture.
Encourage signage to be in keeping with the character of the B.community in which the sign is located.
Discourage multiple or large signs that clutter, distract, and C.dominate the streetscape of commercial areas.
Initiate removal of billboards using an amortization schedule. D. Encourage the consolidation of road-oriented signs on a single E.
structure where a commercial development includes multiple businesses.
9.3.3 Vegetation and Landscaping
Public projects and those on county owned property should use A.native, drought tolerant plantings and natural pesticides and fertilizers.
Encourage large scale, residential and commercial development B.to consolidate onsite landscape areas, especially when site frontage can be enhanced.
Preserve the Chesapeake regional environmental character C.through the retention of existing vegetation and use of native plants in new landscaping.
Encourage water conservation in landscape designs. D. Preserve significant trees and mature vegetation. E.
9.3.4 Open Space
Preserve, encourage, and enhance open space as a significant A.element of the community’s character through parks, trails, water features, and other significant properties that provide public benefit.
Encourage development to integrate public and private open B.spaces where appropriate.
PC August 2015 9-3 Lexington Park Development District Master Plan
9.3.5 Public Spaces
Encourage designs and practices that preserve and enhance A.views from public places of unique landmarks as valuable civic assets.
Provide public spaces of various sizes and types throughout the B.community.
Encourage public spaces that are designed to provide public C.amenities and facilities such as seating, landscaping, kiosks, connections to surrounding uses and activities, lighting, appropriate noise levels and a sense of security.
Consider the edges of public spaces that abut residential D.property for special design treatment to create a buffer effect, while providing visual access and security.
9.3.6 Public Art
Encourage a variety of artwork and arts activities in public A.places, such as parks, public buildings, rights-of-way, and plazas.
Encourage private donations of art to the county. B.
9.3.7 Sidewalks, Walkways and Trails
Provide sidewalks, walkways, and trails with lighting, seating, landscaping, street trees, public art, bike racks, railings, trash receptacles, etc.
9.3.8 Street Corridors
Develop a program to implement “Green Street” improvements that prioritizes connections to schools, parks, neighborhood centers and other key destinations.
9.3.9 Transit Facility
Encourage site and building designs that support and connect with existing or planned transit facilities in the vicinity.
9.3.10 Neighborhood Commercial Areas
Develop attractive, functional, and cohesive commercial areas A.that are harmonious with adjacent neighborhoods, by considering the impacts of land use, building scale, views and through-traffic.
Encourage buildings to be sited at or near the public sidewalk as B.long as safe access and space for improvements (e.g., benches, lighting) are not diminished.
9.3.11 Residential Areas
Encourage improvements to neighborhood appearance and function, including supporting neighborhood improvement projects with Development District grants. Appropriate neighborhood improvement projects include, signs, crosswalks, traffic calming, fencing, special lighting, landscaping, etc., as long as pedestrian and vehicular safety are ensured.
PC Draft – July 2015 9-2 Lexington Park Development District Master Plan
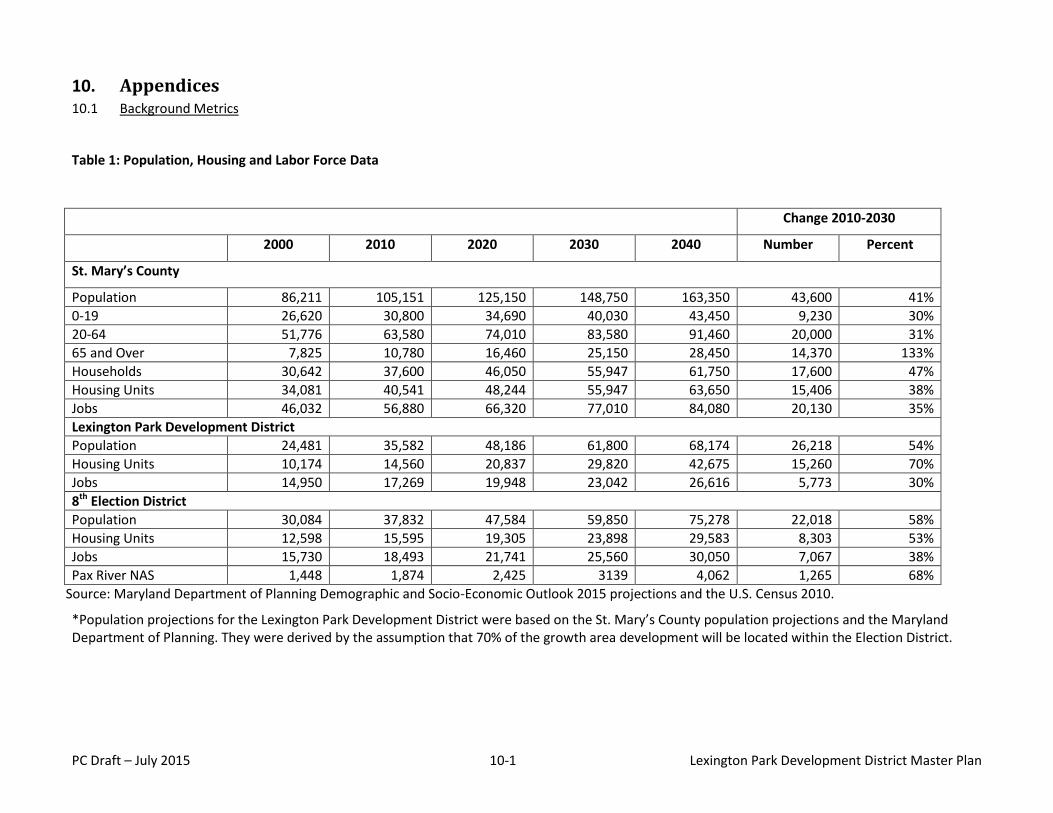
PC Draft – July 2015 10-1 Lexington Park Development District Master Plan
10. Appendices 10.1 Background Metrics
Table 1: Population, Housing and Labor Force Data
Change 2010-2030
2000 2010 2020 2030 2040 Number Percent
St. Mary’s County
Population 86,211 105,151 125,150 148,750 163,350 43,600 41%
0-19 26,620 30,800 34,690 40,030 43,450 9,230 30%
20-64 51,776 63,580 74,010 83,580 91,460 20,000 31%
65 and Over 7,825 10,780 16,460 25,150 28,450 14,370 133%
Households 30,642 37,600 46,050 55,947 61,750 17,600 47%
Housing Units 34,081 40,541 48,244 55,947 63,650 15,406 38%
Jobs 46,032 56,880 66,320 77,010 84,080 20,130 35%
Lexington Park Development District
Population 24,481 35,582 48,186 61,800 68,174 26,218 54%
Housing Units 10,174 14,560 20,837 29,820 42,675 15,260 70%
Jobs 14,950 17,269 19,948 23,042 26,616 5,773 30%
8th Election District
Population 30,084 37,832 47,584 59,850 75,278 22,018 58%
Housing Units 12,598 15,595 19,305 23,898 29,583 8,303 53%
Jobs 15,730 18,493 21,741 25,560 30,050 7,067 38%
Pax River NAS 1,448 1,874 2,425 3139 4,062 1,265 68%
Source: Maryland Department of Planning Demographic and Socio-Economic Outlook 2015 projections and the U.S. Census 2010.
*Population projections for the Lexington Park Development District were based on the St. Mary’s County population projections and the Maryland Department of Planning. They were derived by the assumption that 70% of the growth area development will be located within the Election District.
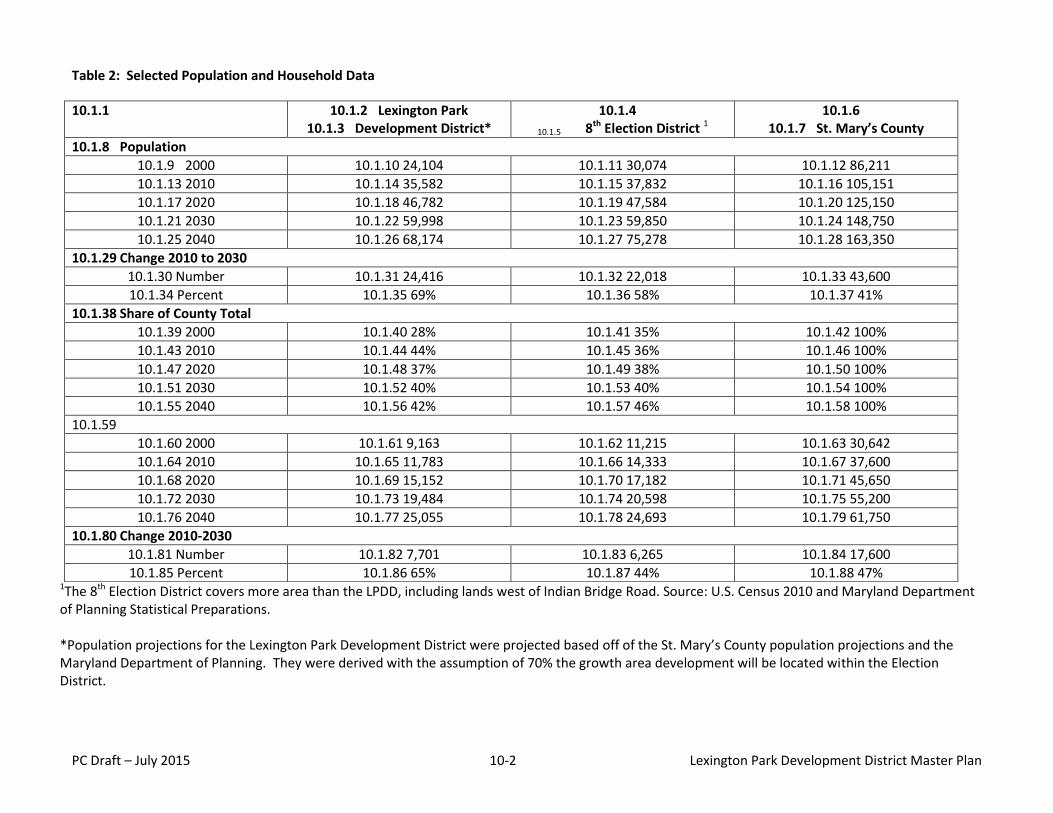
PC Draft – July 2015 10-2 Lexington Park Development District Master Plan
Table 2: Selected Population and Household Data
1The 8th Election District covers more area than the LPDD, including lands west of Indian Bridge Road. Source: U.S. Census 2010 and Maryland Department of Planning Statistical Preparations. *Population projections for the Lexington Park Development District were projected based off of the St. Mary’s County population projections and the Maryland Department of Planning. They were derived with the assumption of 70% the growth area development will be located within the Election District.
10.1.1 10.1.2 Lexington Park 10.1.3 Development District*
10.1.4
10.1.5 8th Election District 1
10.1.6 10.1.7 St. Mary’s County
10.1.8 Population
10.1.9 2000 10.1.10 24,104 10.1.11 30,074 10.1.12 86,211
10.1.13 2010 10.1.14 35,582 10.1.15 37,832 10.1.16 105,151
10.1.17 2020 10.1.18 46,782 10.1.19 47,584 10.1.20 125,150
10.1.21 2030 10.1.22 59,998 10.1.23 59,850 10.1.24 148,750
10.1.25 2040 10.1.26 68,174 10.1.27 75,278 10.1.28 163,350
10.1.29 Change 2010 to 2030
10.1.30 Number 10.1.31 24,416 10.1.32 22,018 10.1.33 43,600
10.1.34 Percent 10.1.35 69% 10.1.36 58% 10.1.37 41%
10.1.38 Share of County Total
10.1.39 2000 10.1.40 28% 10.1.41 35% 10.1.42 100%
10.1.43 2010 10.1.44 44% 10.1.45 36% 10.1.46 100%
10.1.47 2020 10.1.48 37% 10.1.49 38% 10.1.50 100%
10.1.51 2030 10.1.52 40% 10.1.53 40% 10.1.54 100%
10.1.55 2040 10.1.56 42% 10.1.57 46% 10.1.58 100%
10.1.59
10.1.60 2000 10.1.61 9,163 10.1.62 11,215 10.1.63 30,642
10.1.64 2010 10.1.65 11,783 10.1.66 14,333 10.1.67 37,600
10.1.68 2020 10.1.69 15,152 10.1.70 17,182 10.1.71 45,650
10.1.72 2030 10.1.73 19,484 10.1.74 20,598 10.1.75 55,200
10.1.76 2040 10.1.77 25,055 10.1.78 24,693 10.1.79 61,750
10.1.80 Change 2010-2030
10.1.81 Number 10.1.82 7,701 10.1.83 6,265 10.1.84 17,600
10.1.85 Percent 10.1.86 65% 10.1.87 44% 10.1.88 47%
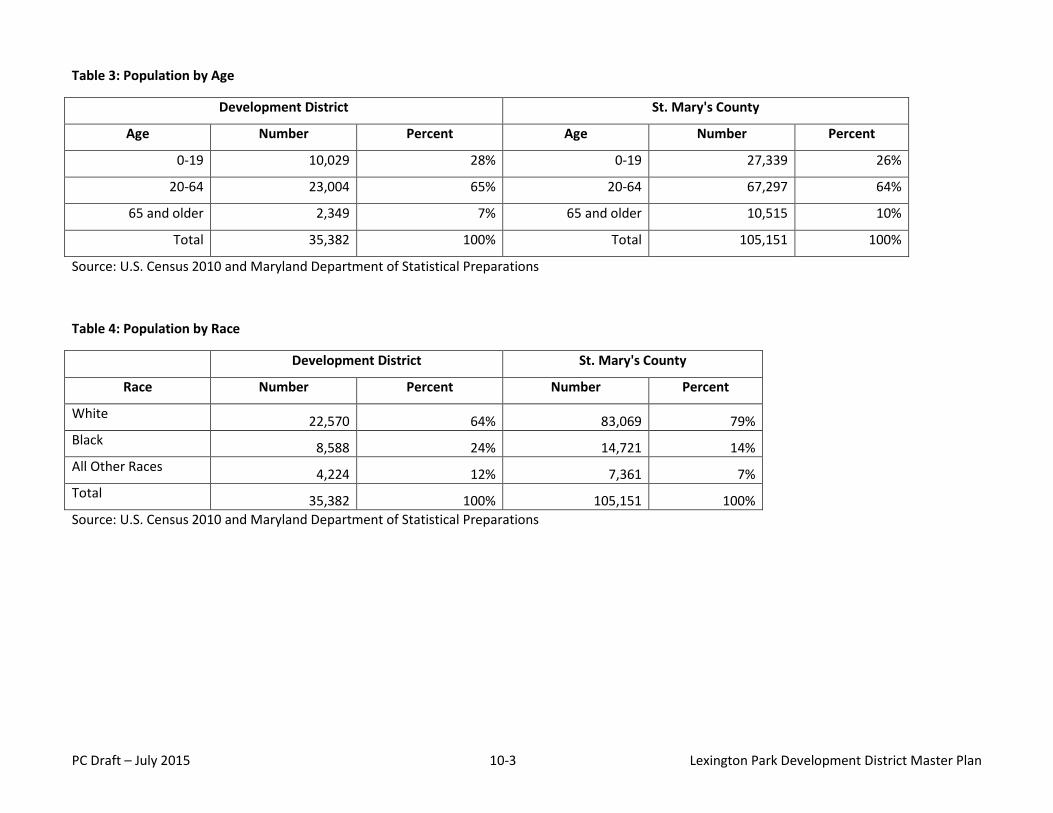
PC Draft – July 2015 10-3 Lexington Park Development District Master Plan
Table 3: Population by Age
Development District St. Mary's County
Age Number Percent Age Number Percent
0-19 10,029 28% 0-19 27,339 26%
20-64 23,004 65% 20-64 67,297 64%
65 and older 2,349 7% 65 and older 10,515 10%
Total 35,382 100% Total 105,151 100%
Source: U.S. Census 2010 and Maryland Department of Statistical Preparations
Table 4: Population by Race
Development District St. Mary's County
Race Number Percent Number Percent
White 22,570 64% 83,069 79%
Black 8,588 24% 14,721 14%
All Other Races 4,224 12% 7,361 7%
Total 35,382 100% 105,151 100%
Source: U.S. Census 2010 and Maryland Department of Statistical Preparations
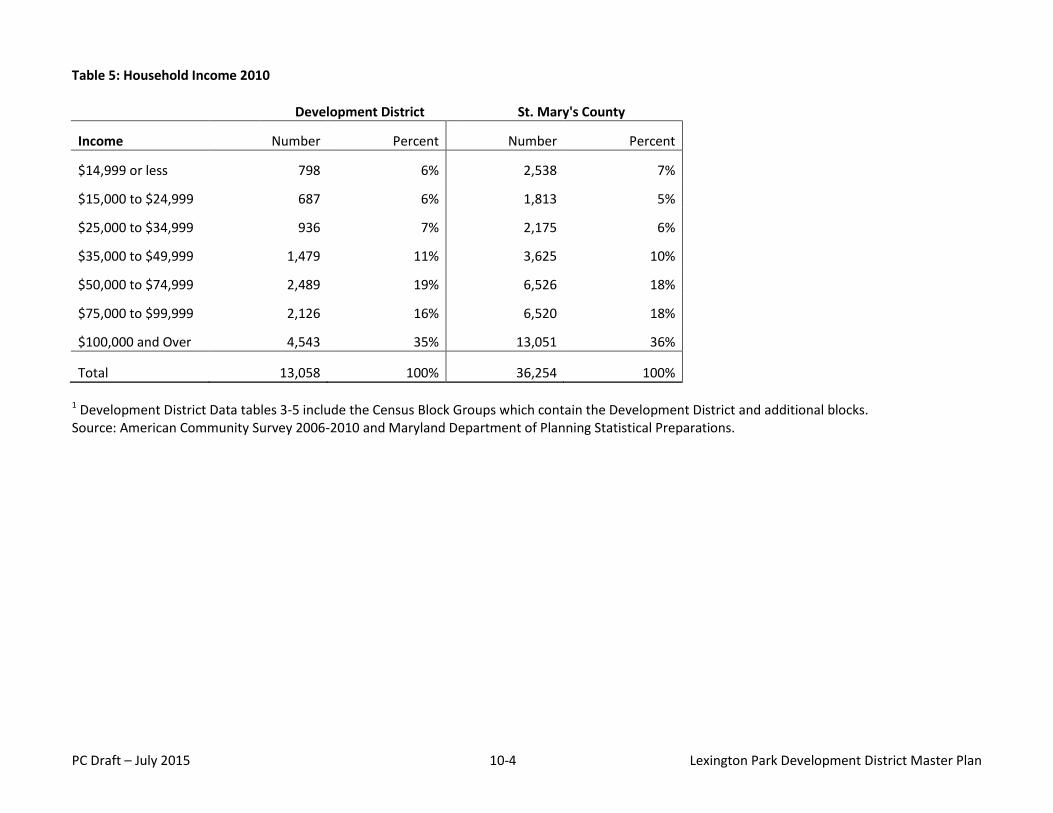
PC Draft – July 2015 10-4 Lexington Park Development District Master Plan
Table 5: Household Income 2010
Development District St. Mary's County
Income Number Percent Number Percent
$14,999 or less 798 6% 2,538 7%
$15,000 to $24,999 687 6% 1,813 5%
$25,000 to $34,999 936 7% 2,175 6%
$35,000 to $49,999 1,479 11% 3,625 10%
$50,000 to $74,999 2,489 19% 6,526 18%
$75,000 to $99,999 2,126 16% 6,520 18%
$100,000 and Over 4,543 35% 13,051 36%
Total 13,058 100% 36,254 100%
1 Development District Data tables 3-5 include the Census Block Groups which contain the Development District and additional blocks. Source: American Community Survey 2006-2010 and Maryland Department of Planning Statistical Preparations.
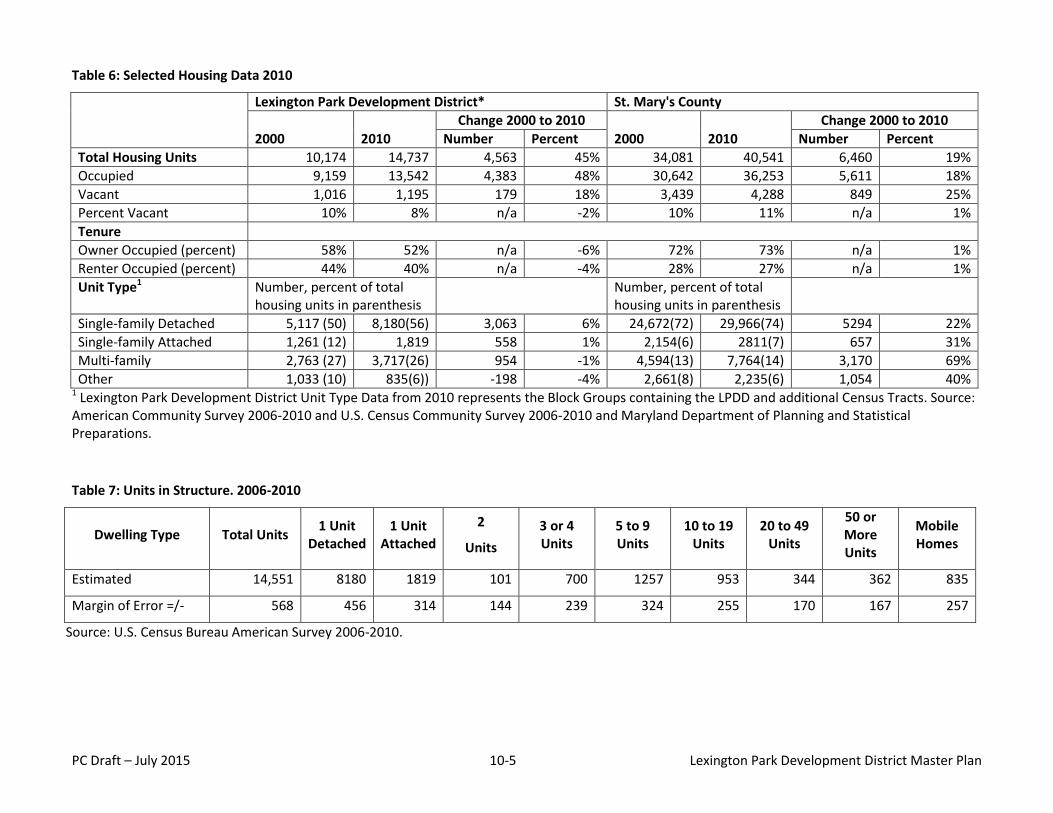
PC Draft – July 2015 10-5 Lexington Park Development District Master Plan
Table 6: Selected Housing Data 2010
Lexington Park Development District* St. Mary's County
2000 2010
Change 2000 to 2010
2000 2010
Change 2000 to 2010
Number Percent Number Percent
Total Housing Units 10,174 14,737 4,563 45% 34,081 40,541 6,460 19%
Occupied 9,159 13,542 4,383 48% 30,642 36,253 5,611 18%
Vacant 1,016 1,195 179 18% 3,439 4,288 849 25%
Percent Vacant 10% 8% n/a -2% 10% 11% n/a 1%
Tenure
Owner Occupied (percent) 58% 52% n/a -6% 72% 73% n/a 1%
Renter Occupied (percent) 44% 40% n/a -4% 28% 27% n/a 1%
Unit Type1 Number, percent of total housing units in parenthesis
Number, percent of total housing units in parenthesis
Single-family Detached 5,117 (50) 8,180(56) 3,063 6% 24,672(72) 29,966(74) 5294 22%
Single-family Attached 1,261 (12) 1,819 558 1% 2,154(6) 2811(7) 657 31%
Multi-family 2,763 (27) 3,717(26) 954 -1% 4,594(13) 7,764(14) 3,170 69%
Other 1,033 (10) 835(6)) -198 -4% 2,661(8) 2,235(6) 1,054 40% 1 Lexington Park Development District Unit Type Data from 2010 represents the Block Groups containing the LPDD and additional Census Tracts. Source: American Community Survey 2006-2010 and U.S. Census Community Survey 2006-2010 and Maryland Department of Planning and Statistical Preparations.
Table 7: Units in Structure. 2006-2010
Dwelling Type Total Units 1 Unit
Detached 1 Unit
Attached
2
Units
3 or 4 Units
5 to 9 Units
10 to 19 Units
20 to 49 Units
50 or More Units
Mobile Homes
Estimated 14,551 8180 1819 101 700 1257 953 344 362 835
Margin of Error =/- 568 456 314 144 239 324 255 170 167 257
Source: U.S. Census Bureau American Survey 2006-2010.
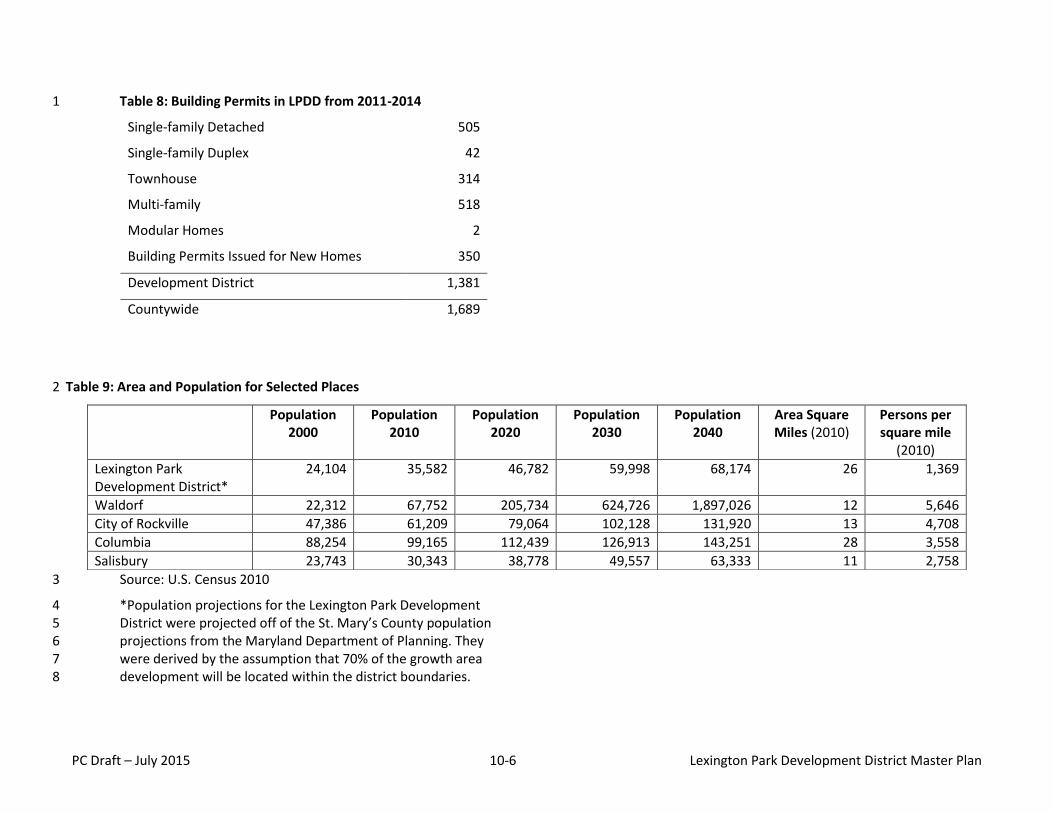
PC Draft – July 2015 10-6 Lexington Park Development District Master Plan
Table 8: Building Permits in LPDD from 2011-2014 1
Single-family Detached 505
Single-family Duplex 42
Townhouse 314
Multi-family 518
Modular Homes 2
Building Permits Issued for New Homes 350
Development District 1,381
Countywide 1,689
Table 9: Area and Population for Selected Places 2
Source: U.S. Census 2010 3
*Population projections for the Lexington Park Development 4 District were projected off of the St. Mary’s County population 5 projections from the Maryland Department of Planning. They 6 were derived by the assumption that 70% of the growth area 7 development will be located within the district boundaries. 8
Population 2000
Population 2010
Population 2020
Population 2030
Population 2040
Area Square Miles (2010)
Persons per square mile
(2010)
Lexington Park Development District*
24,104 35,582 46,782 59,998 68,174 26 1,369
Waldorf 22,312 67,752 205,734 624,726 1,897,026 12 5,646
City of Rockville 47,386 61,209 79,064 102,128 131,920 13 4,708
Columbia 88,254 99,165 112,439 126,913 143,251 28 3,558
Salisbury 23,743 30,343 38,778 49,557 63,333 11 2,758
PC Draft – July 2015 10-7 Lexington Park Development District Master Plan
10.2 Maryland’s Twelve Planning Visions 1
The Twelve Planning Visions prescribed by the enabling statutes 2 (Annotated Code of Maryland, Land Use Article, Section 1-201) are 3 embodied by the St. Mary’s County Comprehensive Plan (see Chapter 3 4 of the 2010 St. Mary’s County Comprehensive Plan), and are in turn 5 supported by this Plan: 6
1. Quality of life and sustainability: a high quality of life is achieved 7 through universal stewardship of the land, water, and air resulting 8 in sustainable communities and protection of the environment. 9
2. Public participation: citizens are active partners in the planning and 10 implementation of community initiatives and are sensitive to their 11 responsibilities in achieving community goals. 12
3. Growth areas: growth is concentrated in existing population and 13 business centers, growth areas adjacent to these centers, or 14 strategically selected new centers. 15
4. Community design: compact, mixed-use, walkable design consistent 16 with existing community character and located near available or 17 planned transit options is encouraged to ensure efficient use of land 18 and transportation resources and preservation and enhancement of 19 natural systems, open spaces, recreational areas, and historical, 20 cultural, and archeological resources. 21
5. Infrastructure: growth areas have the water resources and 22 infrastructure to accommodate population and business expansion 23 in an orderly, efficient, and environmentally sustainable manner. 24
6. Transportation: a well-maintained, multimodal transportation 25 system facilitates the safe, convenient, affordable, and efficient 26 movement of people, goods, and services within and between 27 population and business centers. 28
7. Housing: a range of housing densities, types, and sizes provides 29 residential options for citizens of all ages and incomes and 30 addresses issues of homelessness, blight removal and community 31 revitalization. 32
8. Economic development: economic development and natural 33 resource-based businesses that promote employment opportunities 34
for all income levels within the capacity of the state's natural 35 resources, public services, and public facilities are encouraged. 36
9. Environmental protection: land and water resources, including the 37 Chesapeake and coastal bays, are carefully managed to restore and 38 maintain healthy air and water, natural systems, and living 39 resources. 40
10. Resource conservation: waterways, forests, agricultural areas, open 41 space, natural systems, and scenic areas are conserved. 42
11. Stewardship: government, business entities, and residents are 43 responsible for the creation of sustainable communities by 44 collaborating to balance efficient growth with resource protection. 45
12. Implementation: strategies, policies, programs, and funding for 46 growth and development, resource conservation, infrastructure, 47 and transportation are integrated across the local, regional, state, 48 and interstate levels to achieve these visions. 49
50
PC Draft – July 2015 10-8 Lexington Park Development District Master Plan
10.3 Planned Bicycle Routes 1
Various bicycle plans have been developed for St. Mary’s 2 County. These plans recommend county and state roads that 3 provide a safe environment for bicycles. There are three 4 principle sources that provide this information. The State of 5 Maryland Bicycle Map identifies State routes within each county 6 that have the potential to accommodate bicycle traffic. The 7 Southern Maryland Bicycle Map evaluates both state and local 8 roads in Charles, Calvert, and St. Mary’s Counties. The Southern 9 Maryland Regional Trail and Bikeway System (SMRTABS) study 10 provides an analysis of both existing and planned facilities for 11 the tri-county area (Charles, Calvert, and St. Mary’s Counties) of 12 Southern Maryland. These and associated plans are presented 13 below: 14
10.3.1 Maryland State Bicycle Map 15
The Maryland State Bicycle Map is one source that identifies the 16 suitability of State routes for cyclists. The criteria used to 17 identify these routes include a generalization of shoulder widths 18 and the average daily traffic (ADT). 19
10.3.2 Southern Maryland Bicycle Map 20
The Southern Maryland Bicycle Map classifies state and county 21 roads with a rating scheme of “Good” to “Dangerous”. There 22 are ten (10) loops represented in the three Southern Maryland 23 Counties. These loops are linked roads that form a circuitous 24 path for cyclist and have the common thread of providing a 25 connection to historic and/or scenic sites. 26
10.3.3 Southern Maryland Regional Trail and Bikeway System 27
The Southern Maryland Regional Trail and Bikeway System 28 (SMRTABS) study recommends a network of on-street and off-29 road bicycle routes, multi-use trails and greenways that will 30 provide access to the environmental, historic, cultural, 31 recreational, residential and commercial areas. The five routes 32 identified in St. Mary’s County are the Amish Country Route, St. 33 Clements Island Route, Leonardtown Route, St. George Island 34 Route and Point Lookout Route. 35
10.3.4 Three Notch Trail 36
St. Mary’s County Department of Recreation, Parks and 37 Community Services is moving forward with plans to construct a 38 recreational trail along the 28-mile county railroad ROW which 39 runs south from Hughesville (in Charles County) to Lexington 40 Park (to the NAS). The trail will be a non-motorized pedestrian, 41 bicycle and equestrian trail. 42
Phase one of the trail begins at MD 236 in New Market and 43 proceeds approximately one mile north to the new Northern 44 County Senior Center in Charlotte Hall. This area of the trail will 45 provide a connection between the southern Maryland Regional 46 Library, the St. Mary’s County farmers market, the Veteran’s 47 Home, the Charlotte Hall Welcome Center, and the Northern 48 County Senior Center, and link the villages of New Market and 49 Charlotte Hall. Phase II will continue north from the senior 50 center, another two miles to the county line. The remainder of 51 the trail – from Lexington Park north to New Market – may be 52 constructed in phases over the next several years as funding 53 permits. Some of the sections are proposed to be constructed 54 by private developers. 55
A trails advocacy group, the Friends of the Three Notch Trail, 56 was recently formed to assist with promoting awareness of the 57 Three Notch Trail project and will coordinate volunteer work on 58 the trail once completed. The “Friends” group is comprised of 59 cyclists, runners, equestrians and hikers who are dedicated to 60 the creation and maintenance of the non-motorized trail. 61
10.3.5 Potomac Trail Council 62
Numerous opportunities to explore the Potomac shoreline are 63 offered throughout St. Mary’s County. However, the 64 topography of this area does not provide a practicable route for 65 a continuous trail. The Potomac Heritage System utilizes existing 66 roads along the Potomac River, between Point Lookout State 67 Park and the, Piscataway Park in Charles County to identify an 68 on-road bicycle route connecting numerous points along the 69 Potomac River. 70
PC Draft – July 2015 10-9 Lexington Park Development District Master Plan
10.3.6 Maryland Scenic Byways 1
The Maryland State Highway Administration (SHA) has 2 designated 31 state Scenic Byways reflecting the rich heritage of 3 the region surrounding each of the routes. The southern region 4 scenic byway explores the shores of the Chesapeake Bay and its 5 tributary rivers, Maryland’s first capital-St. Mary’s City and 6 Chesapeake’s rich maritime history. 7
10.3.7 Star Spangled Banner National Historic Trail Study 8
The purpose of this study is to evaluate the feasibility and 9 desirability of designating the routes used by the British and 10 Americans during the Chesapeake Campaign of the War of 1812 11 as a National Historic Trail. The proposed National Historic Trail 12 would commemorate the British invasion of Washington, DC 13 and the Battle for Baltimore in 1814. 14
10.3.8 Southern Maryland Bicycle Routes 15
The Southern Maryland Bicycle Route map has four routes in St. 16 Mary’s County. The routes were developed by the Southern 17 Maryland Travel and Tourism Committee. The bicycle route 18 names are “To the Point Route,” “Rolling Hills and Tall Timbers 19 Route,” “The Historic Seventh Route,” and Hollywood on the 20 Patuxent Route.” 21
22
10.4 Sustainable Communities 23
Provide more transportation choices. Develop safe, reliable, 24 and economical transportation choices to decrease household 25 transportation costs, reduce our nation’s dependence on 26 foreign oil, improve air quality, reduce greenhouse gas 27 emissions, and promote public health. 28
Promote equitable, affordable housing. Expand location- and 29 energy-efficient housing choices for people of all ages, incomes, 30 races, and ethnicities to increase mobility and lower the 31 combined cost of housing and transportation. 32
Enhance economic competitiveness. Improve economic 33 competitiveness through reliable and timely access to 34 employment centers, educational opportunities, services and 35 other basic needs by workers, as well as expanded business 36 access to markets. 37
Support existing communities. Target federal funding toward 38 existing communities—through strategies like transit-oriented, 39 mixed-use development, and land recycling—to increase 40 community revitalization and the efficiency of public works 41 investments and safeguard rural landscapes. 42
Coordinate and leverage policies and investment. Align policies 43 and funding to remove barriers to collaboration, leverage 44 funding, and increase the accountability and effectiveness of all 45 levels of government to plan for future growth, including 46 making smart energy choices such as locally generated 47 renewable energy. 48
Value communities and neighborhoods. Enhance the unique 49 characteristics of all communities by investing in healthy, safe, 50 and walkable neighborhoods—rural, urban, or suburban. 51
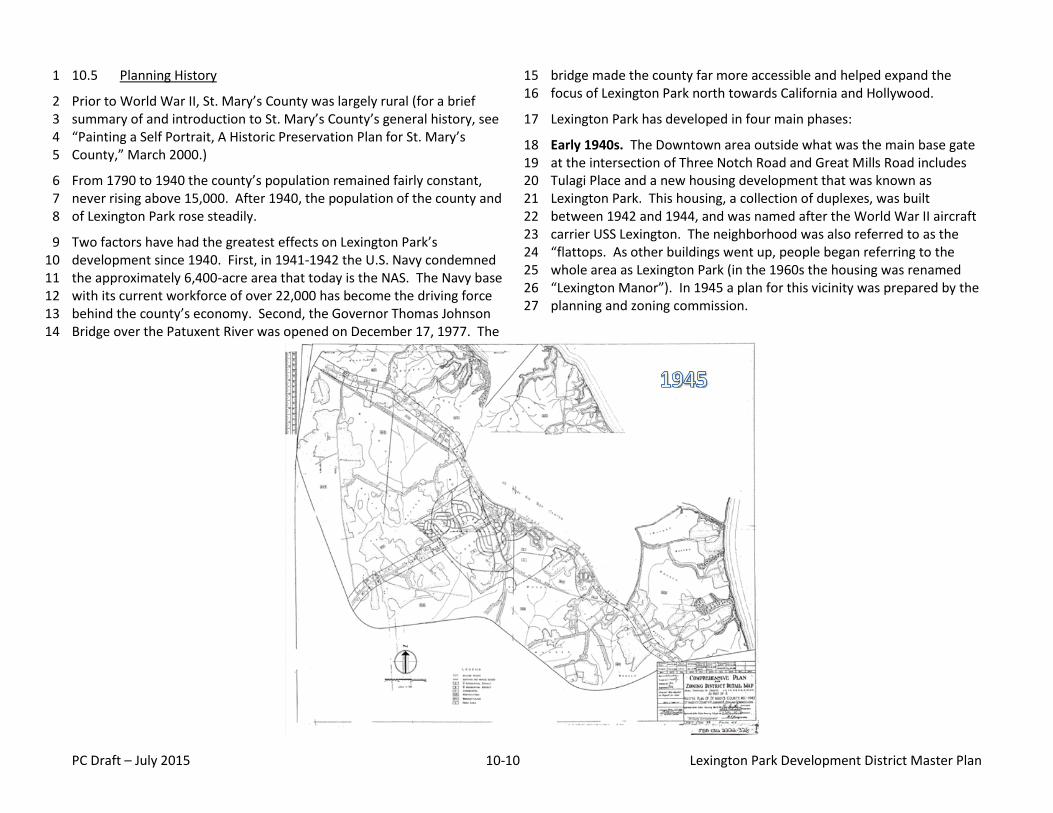
PC Draft – July 2015 10-10 Lexington Park Development District Master Plan
10.5 Planning History 1
Prior to World War II, St. Mary’s County was largely rural (for a brief 2 summary of and introduction to St. Mary’s County’s general history, see 3 “Painting a Self Portrait, A Historic Preservation Plan for St. Mary’s 4 County,” March 2000.) 5
From 1790 to 1940 the county’s population remained fairly constant, 6 never rising above 15,000. After 1940, the population of the county and 7 of Lexington Park rose steadily. 8
Two factors have had the greatest effects on Lexington Park’s 9 development since 1940. First, in 1941-1942 the U.S. Navy condemned 10 the approximately 6,400-acre area that today is the NAS. The Navy base 11 with its current workforce of over 22,000 has become the driving force 12 behind the county’s economy. Second, the Governor Thomas Johnson 13 Bridge over the Patuxent River was opened on December 17, 1977. The 14
bridge made the county far more accessible and helped expand the 15 focus of Lexington Park north towards California and Hollywood. 16
Lexington Park has developed in four main phases: 17
Early 1940s. The Downtown area outside what was the main base gate 18 at the intersection of Three Notch Road and Great Mills Road includes 19 Tulagi Place and a new housing development that was known as 20 Lexington Park. This housing, a collection of duplexes, was built 21 between 1942 and 1944, and was named after the World War II aircraft 22 carrier USS Lexington. The neighborhood was also referred to as the 23 “flattops. As other buildings went up, people began referring to the 24 whole area as Lexington Park (in the 1960s the housing was renamed 25 “Lexington Manor”). In 1945 a plan for this vicinity was prepared by the 26 planning and zoning commission. 27
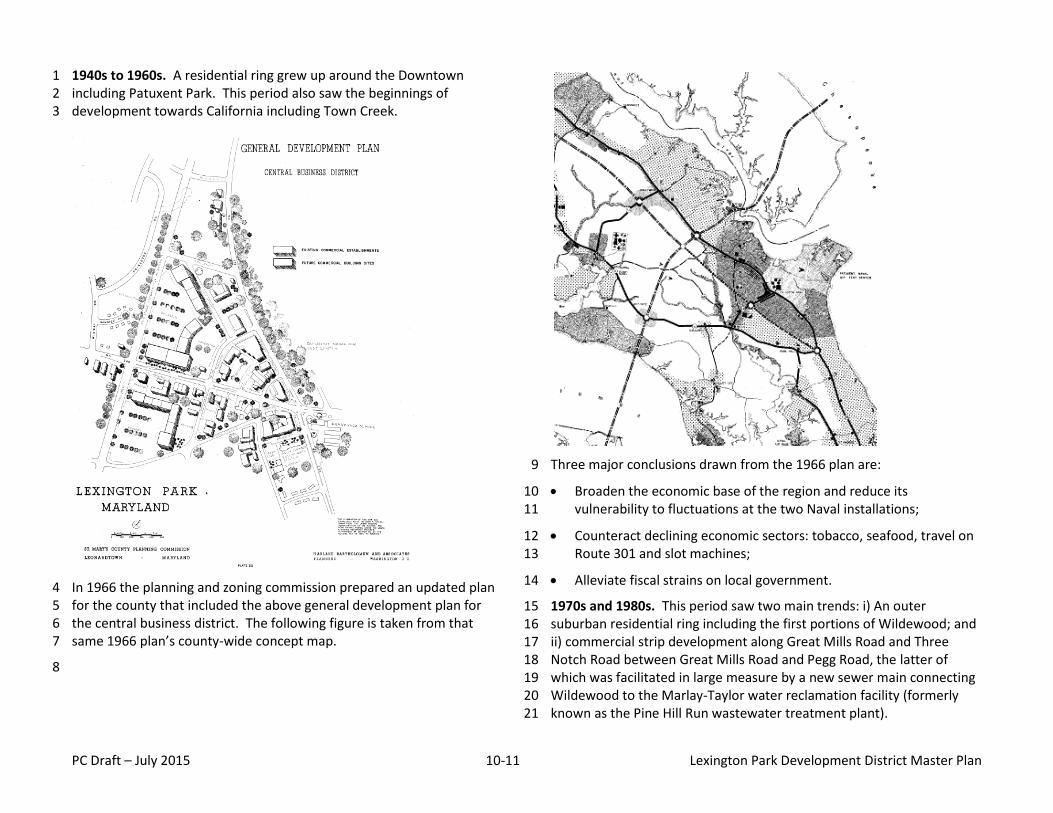
PC Draft – July 2015 10-11 Lexington Park Development District Master Plan
1940s to 1960s. A residential ring grew up around the Downtown 1 including Patuxent Park. This period also saw the beginnings of 2 development towards California including Town Creek. 3
In 1966 the planning and zoning commission prepared an updated plan 4 for the county that included the above general development plan for 5 the central business district. The following figure is taken from that 6 same 1966 plan’s county-wide concept map. 7
8
Three major conclusions drawn from the 1966 plan are: 9
Broaden the economic base of the region and reduce its 10 vulnerability to fluctuations at the two Naval installations; 11
Counteract declining economic sectors: tobacco, seafood, travel on 12 Route 301 and slot machines; 13
Alleviate fiscal strains on local government. 14
1970s and 1980s. This period saw two main trends: i) An outer 15 suburban residential ring including the first portions of Wildewood; and 16 ii) commercial strip development along Great Mills Road and Three 17 Notch Road between Great Mills Road and Pegg Road, the latter of 18 which was facilitated in large measure by a new sewer main connecting 19 Wildewood to the Marlay-Taylor water reclamation facility (formerly 20 known as the Pine Hill Run wastewater treatment plant). 21
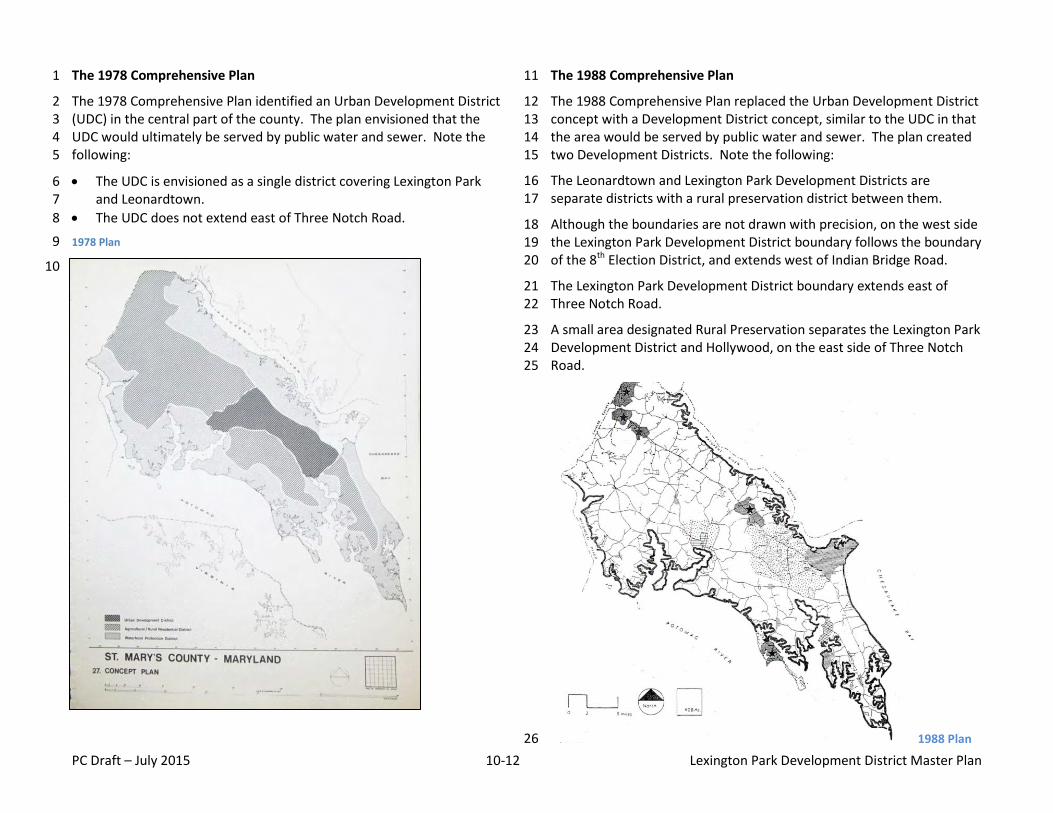
PC Draft – July 2015 10-12 Lexington Park Development District Master Plan
The 1978 Comprehensive Plan 1
The 1978 Comprehensive Plan identified an Urban Development District 2 (UDC) in the central part of the county. The plan envisioned that the 3 UDC would ultimately be served by public water and sewer. Note the 4 following: 5
The UDC is envisioned as a single district covering Lexington Park 6 and Leonardtown. 7
The UDC does not extend east of Three Notch Road. 8
1978 Plan 9
10
The 1988 Comprehensive Plan 11
The 1988 Comprehensive Plan replaced the Urban Development District 12 concept with a Development District concept, similar to the UDC in that 13 the area would be served by public water and sewer. The plan created 14 two Development Districts. Note the following: 15
The Leonardtown and Lexington Park Development Districts are 16 separate districts with a rural preservation district between them. 17
Although the boundaries are not drawn with precision, on the west side 18 the Lexington Park Development District boundary follows the boundary 19 of the 8th Election District, and extends west of Indian Bridge Road. 20
The Lexington Park Development District boundary extends east of 21 Three Notch Road. 22
A small area designated Rural Preservation separates the Lexington Park 23 Development District and Hollywood, on the east side of Three Notch 24 Road. 25
1988 Plan 26
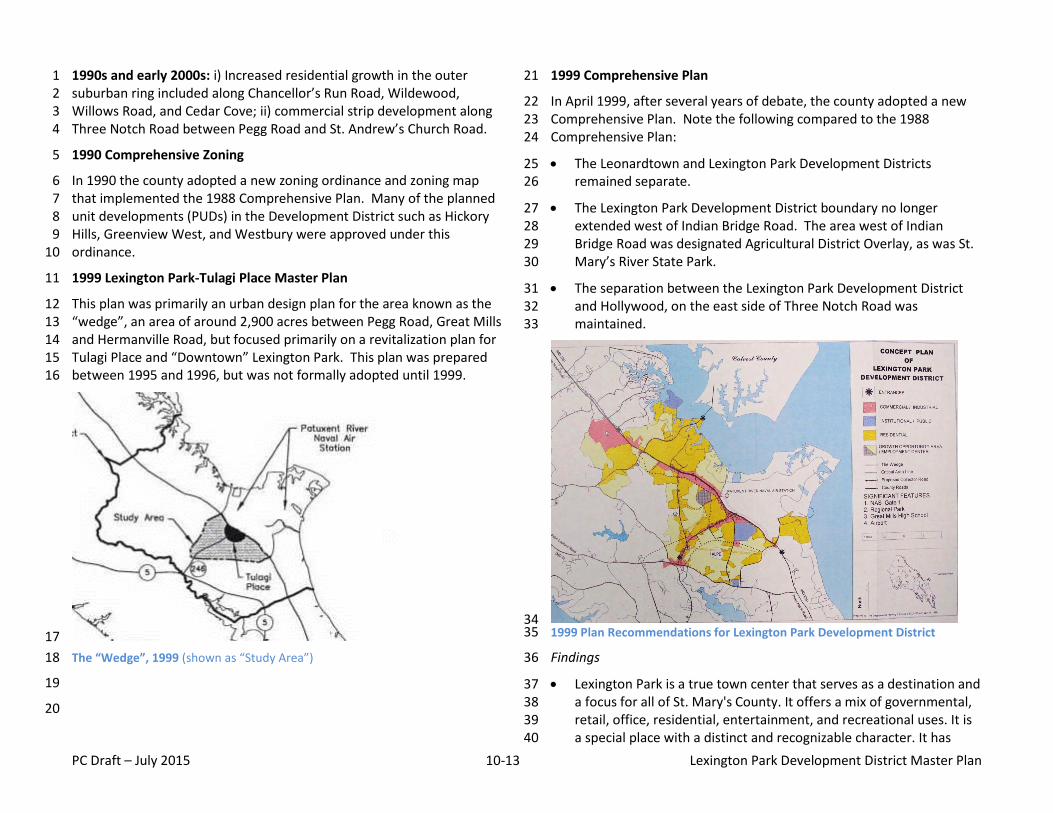
PC Draft – July 2015 10-13 Lexington Park Development District Master Plan
1990s and early 2000s: i) Increased residential growth in the outer 1 suburban ring included along Chancellor’s Run Road, Wildewood, 2 Willows Road, and Cedar Cove; ii) commercial strip development along 3 Three Notch Road between Pegg Road and St. Andrew’s Church Road. 4
1990 Comprehensive Zoning 5
In 1990 the county adopted a new zoning ordinance and zoning map 6 that implemented the 1988 Comprehensive Plan. Many of the planned 7 unit developments (PUDs) in the Development District such as Hickory 8 Hills, Greenview West, and Westbury were approved under this 9 ordinance. 10
1999 Lexington Park-Tulagi Place Master Plan 11
This plan was primarily an urban design plan for the area known as the 12 “wedge”, an area of around 2,900 acres between Pegg Road, Great Mills 13 and Hermanville Road, but focused primarily on a revitalization plan for 14 Tulagi Place and “Downtown” Lexington Park. This plan was prepared 15 between 1995 and 1996, but was not formally adopted until 1999. 16
17
The “Wedge”, 1999 (shown as “Study Area”) 18
19
20
1999 Comprehensive Plan 21
In April 1999, after several years of debate, the county adopted a new 22 Comprehensive Plan. Note the following compared to the 1988 23 Comprehensive Plan: 24
The Leonardtown and Lexington Park Development Districts 25 remained separate. 26
The Lexington Park Development District boundary no longer 27 extended west of Indian Bridge Road. The area west of Indian 28 Bridge Road was designated Agricultural District Overlay, as was St. 29 Mary’s River State Park. 30
The separation between the Lexington Park Development District 31 and Hollywood, on the east side of Three Notch Road was 32 maintained. 33
34 1999 Plan Recommendations for Lexington Park Development District 35
Findings 36
Lexington Park is a true town center that serves as a destination and 37 a focus for all of St. Mary's County. It offers a mix of governmental, 38 retail, office, residential, entertainment, and recreational uses. It is 39 a special place with a distinct and recognizable character. It has 40
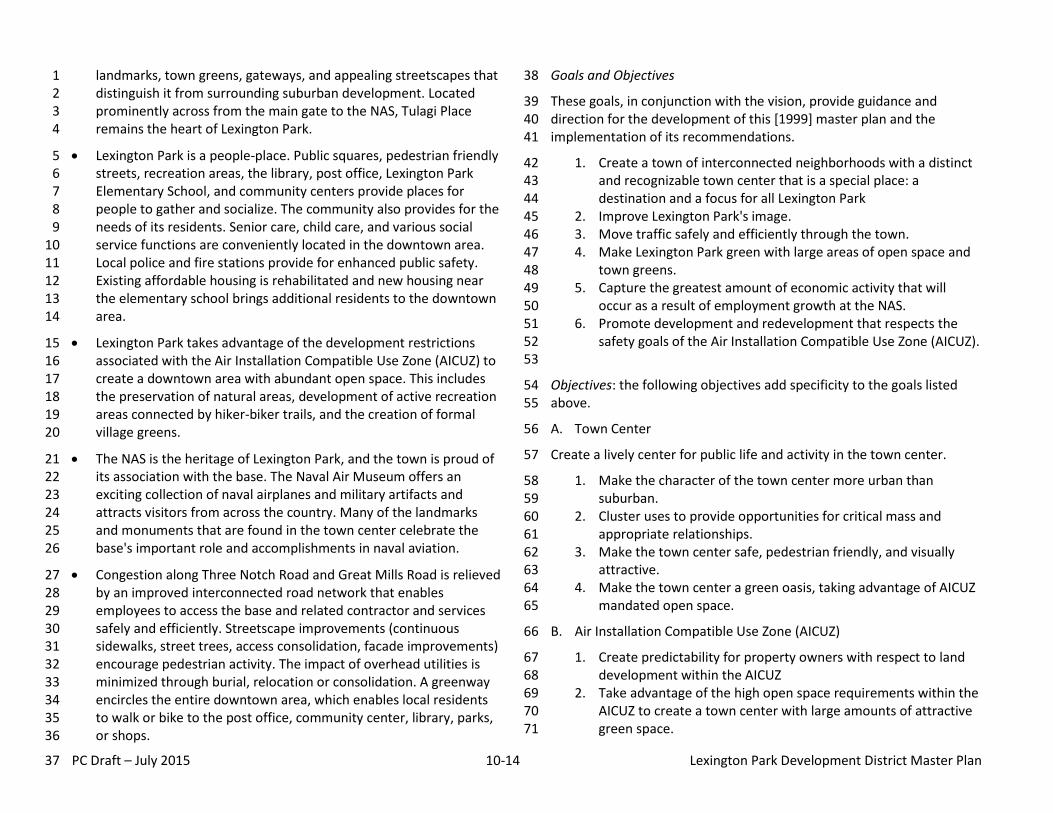
PC Draft – July 2015 10-14 Lexington Park Development District Master Plan
landmarks, town greens, gateways, and appealing streetscapes that 1 distinguish it from surrounding suburban development. Located 2 prominently across from the main gate to the NAS, Tulagi Place 3 remains the heart of Lexington Park. 4
Lexington Park is a people-place. Public squares, pedestrian friendly 5 streets, recreation areas, the library, post office, Lexington Park 6 Elementary School, and community centers provide places for 7 people to gather and socialize. The community also provides for the 8 needs of its residents. Senior care, child care, and various social 9 service functions are conveniently located in the downtown area. 10 Local police and fire stations provide for enhanced public safety. 11 Existing affordable housing is rehabilitated and new housing near 12 the elementary school brings additional residents to the downtown 13 area. 14
Lexington Park takes advantage of the development restrictions 15 associated with the Air Installation Compatible Use Zone (AICUZ) to 16 create a downtown area with abundant open space. This includes 17 the preservation of natural areas, development of active recreation 18 areas connected by hiker-biker trails, and the creation of formal 19 village greens. 20
The NAS is the heritage of Lexington Park, and the town is proud of 21 its association with the base. The Naval Air Museum offers an 22 exciting collection of naval airplanes and military artifacts and 23 attracts visitors from across the country. Many of the landmarks 24 and monuments that are found in the town center celebrate the 25 base's important role and accomplishments in naval aviation. 26
Congestion along Three Notch Road and Great Mills Road is relieved 27 by an improved interconnected road network that enables 28 employees to access the base and related contractor and services 29 safely and efficiently. Streetscape improvements (continuous 30 sidewalks, street trees, access consolidation, facade improvements) 31 encourage pedestrian activity. The impact of overhead utilities is 32 minimized through burial, relocation or consolidation. A greenway 33 encircles the entire downtown area, which enables local residents 34 to walk or bike to the post office, community center, library, parks, 35 or shops. 36
37
Goals and Objectives 38
These goals, in conjunction with the vision, provide guidance and 39 direction for the development of this [1999] master plan and the 40 implementation of its recommendations. 41
1. Create a town of interconnected neighborhoods with a distinct 42 and recognizable town center that is a special place: a 43 destination and a focus for all Lexington Park 44
2. Improve Lexington Park's image. 45 3. Move traffic safely and efficiently through the town. 46 4. Make Lexington Park green with large areas of open space and 47
town greens. 48 5. Capture the greatest amount of economic activity that will 49
occur as a result of employment growth at the NAS. 50 6. Promote development and redevelopment that respects the 51
safety goals of the Air Installation Compatible Use Zone (AICUZ). 52 53
Objectives: the following objectives add specificity to the goals listed 54 above. 55
A. Town Center 56
Create a lively center for public life and activity in the town center. 57
1. Make the character of the town center more urban than 58 suburban. 59
2. Cluster uses to provide opportunities for critical mass and 60 appropriate relationships. 61
3. Make the town center safe, pedestrian friendly, and visually 62 attractive. 63
4. Make the town center a green oasis, taking advantage of AICUZ 64 mandated open space. 65
B. Air Installation Compatible Use Zone (AICUZ) 66
1. Create predictability for property owners with respect to land 67 development within the AICUZ 68
2. Take advantage of the high open space requirements within the 69 AICUZ to create a town center with large amounts of attractive 70 green space. 71
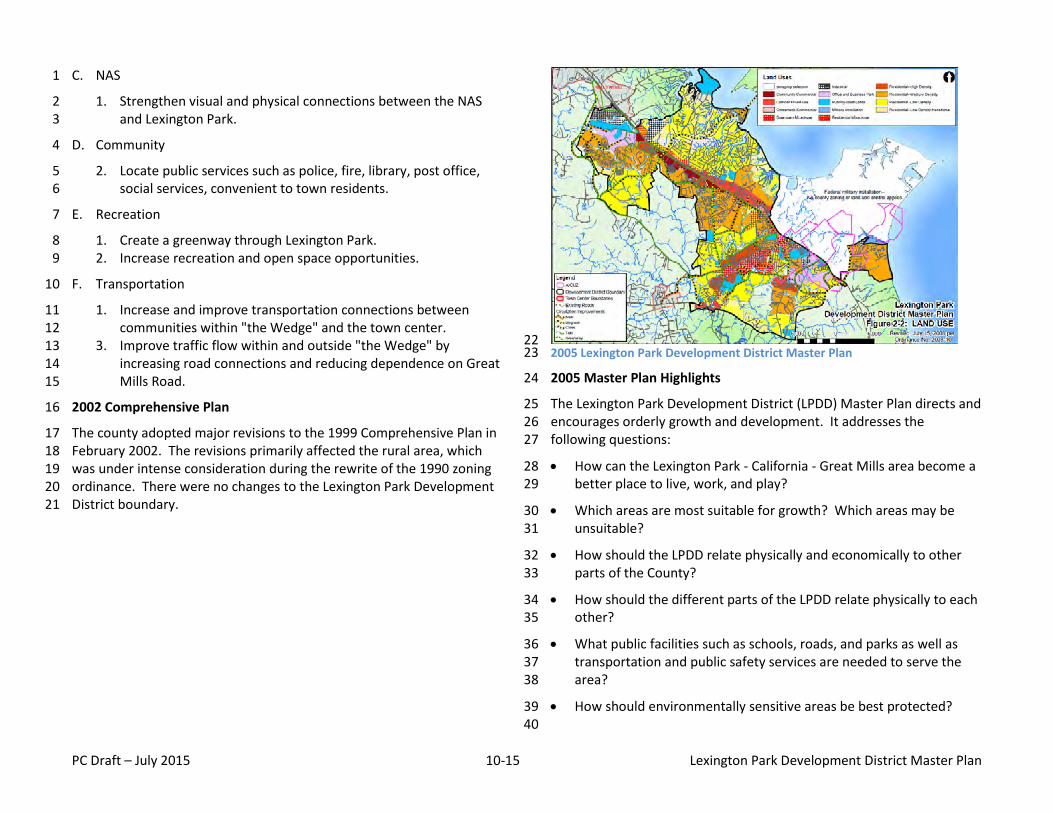
PC Draft – July 2015 10-15 Lexington Park Development District Master Plan
C. NAS 1
1. Strengthen visual and physical connections between the NAS 2 and Lexington Park. 3
D. Community 4
2. Locate public services such as police, fire, library, post office, 5 social services, convenient to town residents. 6
E. Recreation 7
1. Create a greenway through Lexington Park. 8 2. Increase recreation and open space opportunities. 9
F. Transportation 10
1. Increase and improve transportation connections between 11 communities within "the Wedge" and the town center. 12
3. Improve traffic flow within and outside "the Wedge" by 13 increasing road connections and reducing dependence on Great 14 Mills Road. 15
2002 Comprehensive Plan 16
The county adopted major revisions to the 1999 Comprehensive Plan in 17 February 2002. The revisions primarily affected the rural area, which 18 was under intense consideration during the rewrite of the 1990 zoning 19 ordinance. There were no changes to the Lexington Park Development 20 District boundary. 21
22 2005 Lexington Park Development District Master Plan 23
2005 Master Plan Highlights 24
The Lexington Park Development District (LPDD) Master Plan directs and 25 encourages orderly growth and development. It addresses the 26 following questions: 27
How can the Lexington Park - California - Great Mills area become a 28 better place to live, work, and play? 29
Which areas are most suitable for growth? Which areas may be 30 unsuitable? 31
How should the LPDD relate physically and economically to other 32 parts of the County? 33
How should the different parts of the LPDD relate physically to each 34 other? 35
What public facilities such as schools, roads, and parks as well as 36 transportation and public safety services are needed to serve the 37 area? 38
How should environmentally sensitive areas be best protected? 39 40
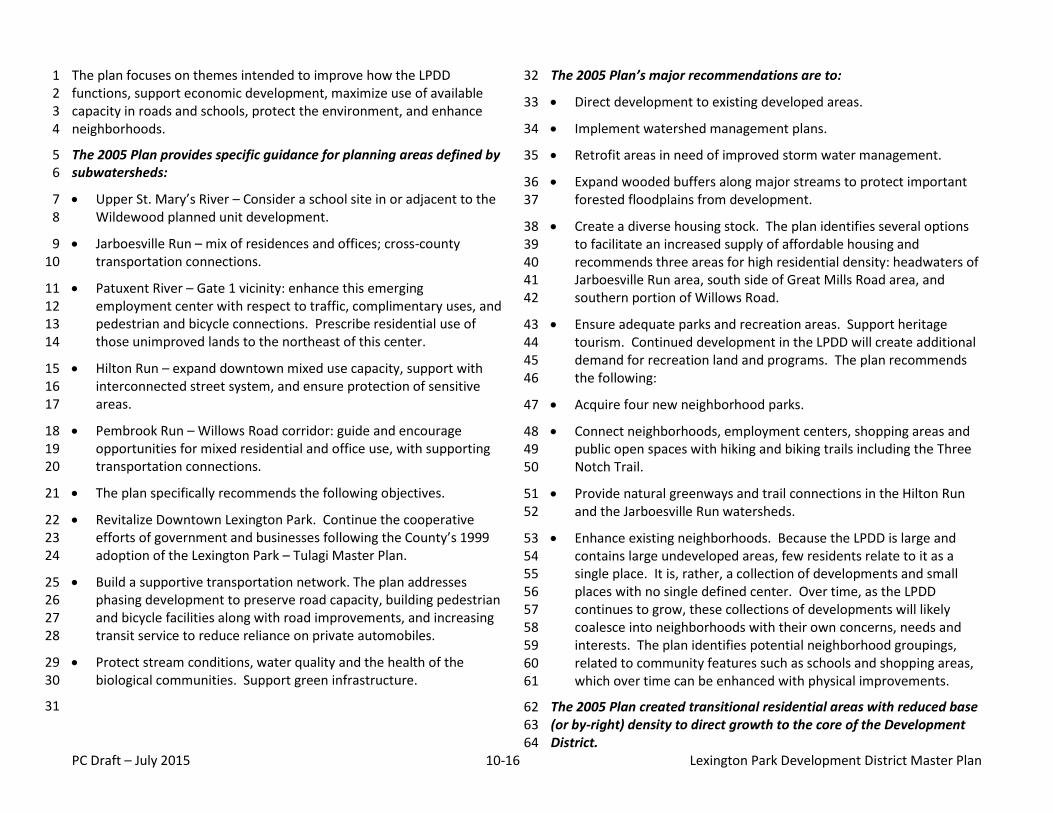
PC Draft – July 2015 10-16 Lexington Park Development District Master Plan
The plan focuses on themes intended to improve how the LPDD 1 functions, support economic development, maximize use of available 2 capacity in roads and schools, protect the environment, and enhance 3 neighborhoods. 4
The 2005 Plan provides specific guidance for planning areas defined by 5 subwatersheds: 6
Upper St. Mary’s River – Consider a school site in or adjacent to the 7 Wildewood planned unit development. 8
Jarboesville Run – mix of residences and offices; cross-county 9 transportation connections. 10
Patuxent River – Gate 1 vicinity: enhance this emerging 11 employment center with respect to traffic, complimentary uses, and 12 pedestrian and bicycle connections. Prescribe residential use of 13 those unimproved lands to the northeast of this center. 14
Hilton Run – expand downtown mixed use capacity, support with 15 interconnected street system, and ensure protection of sensitive 16 areas. 17
Pembrook Run – Willows Road corridor: guide and encourage 18 opportunities for mixed residential and office use, with supporting 19 transportation connections. 20
The plan specifically recommends the following objectives. 21
Revitalize Downtown Lexington Park. Continue the cooperative 22 efforts of government and businesses following the County’s 1999 23 adoption of the Lexington Park – Tulagi Master Plan. 24
Build a supportive transportation network. The plan addresses 25 phasing development to preserve road capacity, building pedestrian 26 and bicycle facilities along with road improvements, and increasing 27 transit service to reduce reliance on private automobiles. 28
Protect stream conditions, water quality and the health of the 29 biological communities. Support green infrastructure. 30
31
The 2005 Plan’s major recommendations are to: 32
Direct development to existing developed areas. 33
Implement watershed management plans. 34
Retrofit areas in need of improved storm water management. 35
Expand wooded buffers along major streams to protect important 36 forested floodplains from development. 37
Create a diverse housing stock. The plan identifies several options 38 to facilitate an increased supply of affordable housing and 39 recommends three areas for high residential density: headwaters of 40 Jarboesville Run area, south side of Great Mills Road area, and 41 southern portion of Willows Road. 42
Ensure adequate parks and recreation areas. Support heritage 43 tourism. Continued development in the LPDD will create additional 44 demand for recreation land and programs. The plan recommends 45 the following: 46
Acquire four new neighborhood parks. 47
Connect neighborhoods, employment centers, shopping areas and 48 public open spaces with hiking and biking trails including the Three 49 Notch Trail. 50
Provide natural greenways and trail connections in the Hilton Run 51 and the Jarboesville Run watersheds. 52
Enhance existing neighborhoods. Because the LPDD is large and 53 contains large undeveloped areas, few residents relate to it as a 54 single place. It is, rather, a collection of developments and small 55 places with no single defined center. Over time, as the LPDD 56 continues to grow, these collections of developments will likely 57 coalesce into neighborhoods with their own concerns, needs and 58 interests. The plan identifies potential neighborhood groupings, 59 related to community features such as schools and shopping areas, 60 which over time can be enhanced with physical improvements. 61
The 2005 Plan created transitional residential areas with reduced base 62 (or by-right) density to direct growth to the core of the Development 63 District. 64
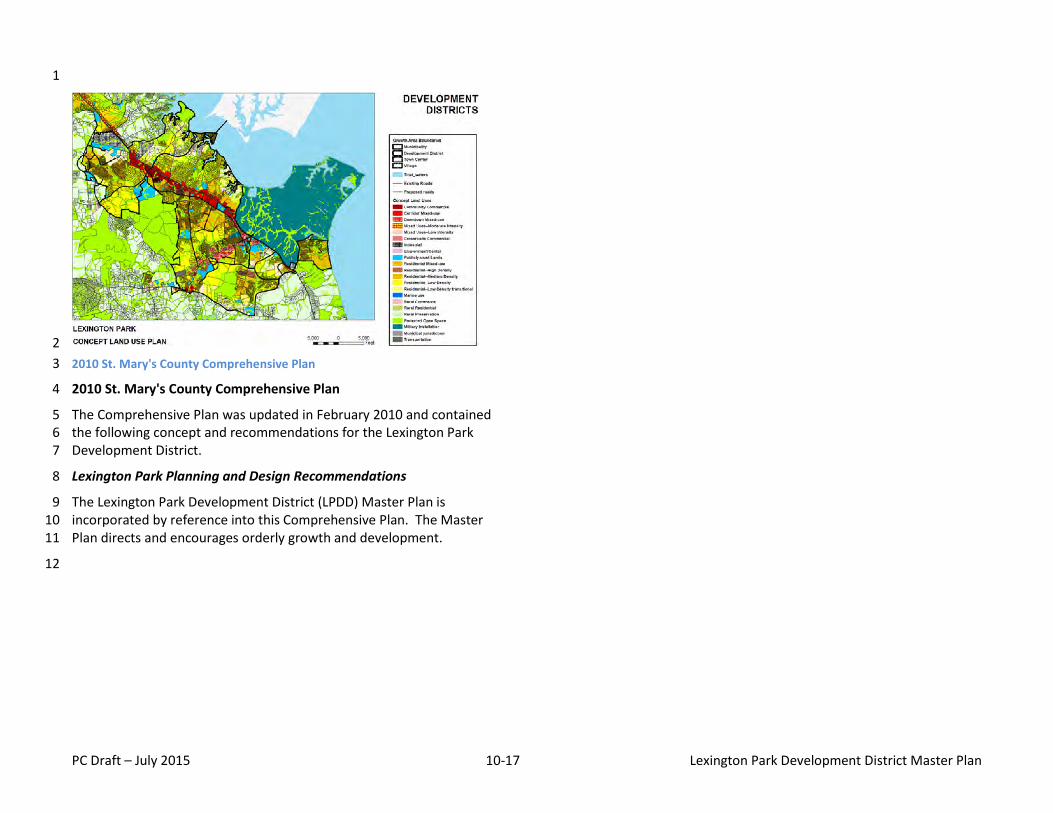
PC Draft – July 2015 10-17 Lexington Park Development District Master Plan
1
2
2010 St. Mary's County Comprehensive Plan 3
2010 St. Mary's County Comprehensive Plan 4
The Comprehensive Plan was updated in February 2010 and contained 5 the following concept and recommendations for the Lexington Park 6 Development District. 7
Lexington Park Planning and Design Recommendations 8
The Lexington Park Development District (LPDD) Master Plan is 9 incorporated by reference into this Comprehensive Plan. The Master 10 Plan directs and encourages orderly growth and development. 11
12
PC Draft – July 2015 10-18 Lexington Park Development District Master Plan
10.6 Incentives 1
10.6.1 St. Mary’s County and the State of Maryland have a number of 2 financing programs to assist small businesses. 3
County Programs A.4
Community Development Corporation Guarantees 5
Small Business Loan Guarantee Program provides 6 guarantees for under collateralized loans for startup or early 7 stage small businesses located in one or more of the 8 County’s Priority Funding Areas. 9
Industrial Revenue Bonds are tax exempt bonds financed by 10 the County. 11
Brownfields Incentives (Leonardtown) Encourage the 12 cleanup and revitalization of brownfields. 13
PILOT (Payment in Lieu of Taxes) allows property owners of 14 rental complexes to pay an annual percentage of revenues 15 rather than the traditional taxed rate on assessed value to 16 maintain units at affordable rent level. 17
IMPACT Fee Waiver/Deferral Program creates an incentive 18 for builders and developers to create communities that are 19 affordable for lower income residents. 20
State of Maryland Business Finance Programs: Direct Loan 21 Guarantees provides financing for small businesses unable 22 to qualify for financing from traditional lenders. 23
The Contract Financing Program 24
The Equity Participation Investment 25
The Long-Term Guaranty Program 26
The Surety Bonding Program 27
Community Development Block Grant Economic 28 Development Program provides funding to commercial 29 industrial economic development projects. 30
Maryland Economic Development Assistance Authority and 31 Fund offers five financing capabilities with assistance 32 provided to the business community and local jurisdictions. 33
Maryland Industrial Development Financing Authority 34 encourages private sector financing in economic 35 development projects located in Priority Funding Areas. 36
Maryland Venture Fund financed and operated by the MD 37 Department of Business and Economic Development, makes 38 direct investments in emerging technology and life sciences 39 companies 40
Tax Incentives are offered to businesses that create new 41 jobs, hire disabled employees or employees from low-42 income population or make investments in targeted 43 geographic areas. 44
Maryland Grants Office provides businesses with resources 45 to research potential funding opportunities, including 46 federal and state grants, federal procurement and private 47 foundations. 48
Training Grants to assist Maryland businesses to retain and 49 grow their existing workforce are offered by The 50 Department of Labor, Licensing and Regulation, Division of 51 Workforce Development. The program is intended to 52 provide a dollar for dollar match for grants designed to 53 increase the skills of existing employees. 54
10.6.2 Types of incentives that may be considered for Plan 55 implementation 56
This Plan supports use of incentives as one of the means to 57 achieve its vision and its goals. While the phrase “provide 58 incentives”: is most frequently thought of in financial terms, 59 implying a cost paid from public or private funds, incentives can 60 take many forms. Although, many development incentives do 61 provide some form of material reward in exchange for acting in 62 a particular way, those rewards can come from reduced time or 63 cost and increased value to the developer/investor. 64
PC Draft – July 2015 10-19 Lexington Park Development District Master Plan
Incentives also exists when a particular choice or action is 1 widely regarded as the right thing to do, or as particularly 2 admirable and where failure to act brings some form of censure. 3 Recognition and branding programs or participation in public-4 private partnerships can provide the second type of incentive by 5 providing a sense of self-esteem, approval or even admiration 6 from the community. 7
A third form of incentive, which often takes the form of 8 regulations, sets minimum standards to encourage desired 9 performance by the regulated sector, but offers flexibility in the 10 standard in exchange for performance that achieves alternative 11 desired outcomes. Incentive-based zoning, inclusionary 12 regulations, and form-based codes fall within this category of 13 potential incentives. 14
Incentives may come from various levels of government on the 15 local, state and national level or from the private sector. The 16 following provides examples, but not an exclusive list, of 17 incentives that could be considered to encourage 18 implementation of this Plan. 19
10.6.3 Potential incentives, tools and minimum regulations identified 20 in the LPDD Plan 21
Numerous tools and incentives available to support affordable A.22 home ownership are identified in Chapter 6. A description of 23 each item listed below is provided in the Glossary. 24
Housing Trust Funds 25
Inclusionary Zoning Ordinances 26
Low-Income Housing Tax Credits 27
Tax Increment Financing 28
The County’s Workforce Capital Fund 29
State Financing Programs 30
Flexible Development Standards 31
Property tax exemption 32
Parking reductions 33
Fee waivers or exemptions 34
Fees paid at closing 35
Process revisions 36
Expedited Reviews 37
Mixed income housing communities 38
Individual Development Accounts (IDAs) 39
Homeownership and Education Counseling 40
Earned Income Tax Credit 41
Section 8 Homeownership Program 42
Below Market Mortgage Products 43
Down payment and Closing Cost Assistance 44
Code Enforcement 45
Ongoing Property Assessment and Inventory 46
Tax Relief Assistance 47
Promote, recognize and reward good design. B.48
i. Provide bonus densities and other incentives for enhanced 49 design of neighborhoods. 50
ii. Seek planning commission recognition for innovative and 51 effective community design. 52
iii. Seek Chesapeake Bay Commission recognition of "Bay 53 Friendly" environmental design. 54
iv. Support green building design for energy efficiency and 55 long-term affordability of the housing. 56
v. Develop a St. Mary’s County “Smart Housing Choice” 57 standard and offer “branding” opportunities for residential 58 and residential-mixed use developments meeting the 59 standard. 60
PC Draft – July 2015 10-20 Lexington Park Development District Master Plan
Examples of incentives and regulations to serve transit, biking C.1 and pedestrian travelers include: 2
i. Based on floor area and distance to existing services, 3 dedicate land for and install an approved bus stop. 4
ii. Provide a bicycle rack if there is none within 100 feet of an 5 approved bus stop 6
iii. Provide marked pedestrian crosswalks across new and 7 existing public roads and connections to existing sidewalks 8 and hiking and biking trails. 9
Incentives and regulations to maintain and enhance tree canopy D.10 for community character and energy conservation purposes 11 include: 12
i. Provide a greater than 100% credit for natural forest buffers 13 and street trees retained above FCA threshold than 14 awarded for planted buffers: 15
ii. On sites 10 acres or larger, retain and credit existing forest 16 vegetation within the drip line of canopy trees (20 feet tall 17 or taller) whose trunk base is within 35 feet of the rights-of-18 way for existing roads and proposed streets toward 19 minimum landscaping requirements. 20
iii. Where there is no retained forest canopy adjacent to the 21 street(s), plant large nursery stock native canopy trees at 22 approximately 40 feet on center along existing or new 23 onsite street centerlines in lieu of requiring standard buffer 24 yard standards. 25
Utilize Height and Setback Criteria to provide incentives for E.26 design goals that are not included as regulations. Examples 27 include: 28
i. Increase in setback may be traded for publicly accessible 29 open space amenities placed between the building and the 30 build-to line. 31
ii. Single story structures may be traded for publicly accessible 32 open space amenities, streetscape improvements, and 33 removal of existing impervious surfaces. 34
iii. Increase of up to 50% of FAR for each floor above the first, 35 total FAR not to exceed 200% of base FAR. 36
iv. Up to one drive aisle and 1 row of parking may be located 37 between structure and street in exchange for publicly 38 accessible open space amenities placed between the 39 building and the build-to line. 40
v. Consider developing design regulations and incentives for 41 the following items: public parks, urban public gardens and 42 arboreta, public building landscaping, urban forests, 43 roadway and highway landscaping, landscaping of utility 44 and rail easements, urban trails and pathways, urban 45 riparian corridors, private residential, commercial and 46 industrial landscaping, private open space, landscape 47 architecture, xeriscaping and water conserving landscaping, 48 landscaping with native plants, low or no chemical 49 landscaping, and integrated pest management. 50
10.6.4 Additional incentives that may be considered for Plan 51 implementation 52
Fee waivers for conservation development projects. These A.53 include waivers of application fees, review and inspection fees, 54 permit fees, and park land in lieu fees that are normally charged 55 in association with development projects. 56
Transfer of Impervious Cover and Conservation Area Credits: If B.57 the owner provides more conservation area than the minimum 58 required or less impervious cover than is maximum allowed, the 59 amount of the extra conservation acreage or impervious cover 60 can be transferred to other conservation development projects. 61
Building Reuse: C.62
i. Developed to reutilize vacant downtown buildings built 63 before 1950, the Building Reuse Incentive Program (BRIP) 64 assists developers by reducing the cost of rehabilitation. 65
ii. These "self-amortizing" grants include improvements such 66 as facade updates, fire-safety upgrades, utility upgrades, 67 installation of barrier-free access and facilities, and exterior 68 and streetscape renovations to eligible buildings. Financial 69 assistance may not exceed $50,000 or 50% of the total 70 project cost. 71
72
PC Draft – July 2015 10-21 Lexington Park Development District Master Plan
Streetscape Improvement: The Streetscape Improvement D.1 Incentive Program helps qualifying property owners improve 2 adjacent public sidewalks and other public pedestrian walkways 3 in downtown Grand Rapids buildings. The program is a 4 matching grant, with a portion paid by a Downtown 5 Development Authority (DDA) grant, and the remainder paid by 6 the building owner. 7
Development Support Policy: The purpose of this program is to E.8 provide financial incentives and support for major development 9 projects. For major development projects with a construction 10 value exceeding $5 million, the DDA can provide support for a 11 development or redevelopment project in the district by 12 reimbursing the developer for eligible expenses related to the 13 construction of necessary public facilities. Program guidelines 14 are available at www.grcity.us/dda (quick link to Government 15 Downtown Development Authority) or contact the DDA office at 16 (616) 456-3163. 17
Design Manual. Design manual that removes strict use F.18 separation of zoning and encourages more creativity to create a 19 traditional, walkable community, make specifications in the 20 manual mandatory in some areas and optional in other parts of 21 the community; however, the planners are giving incentives for 22 developers to use it (setback exemptions, parking exemptions 23 and coverage exemptions). The manual makes sure there’s 24 more uniform look between downtown lots and buildings, make 25 communities more pedestrian friendly and encourage people to 26 walk more, reducing the need for parking. 27
Green building incentives: G.28
i. Residential Deconstruction: If you are removing housing, a 29 residential deconstruction permit may allow you to begin 30 the process before a new building permit for the site is 31 issued. (Deconstruction is taking apart a building in order to 32 save the maximum amount of reusable building materials.) 33
ii. See additional examples in PowerPoint presentation 34 Planning Incentives for Green Buildings 35 http://www.rmla.org.nz/upload/files/mp_green_building.p36 df 37
Historic Preservation Tax incentives: Federal, state and local H.38 programs offer tax programs that provide substantial savings to 39 property owners that maintain and restore historic structures. 40
i. Special Valuation Program: 41 (reference http://www.clark.wa.gov/planning/historic/incentives.html ) 42
ii. A "special valuation" law makes it possible for the county to 43 insure that property taxes will not reflect substantial 44 improvements made to historic properties for 10 years. 45 (Maryland enabling legislation to be confirmed.) 46
iii. Similar program could be extended to substantial 47 improvements made to structures in targeted 48 redevelopment areas such as Downtown and Great Mills 49 focus areas 50
I. Incentive Zoning: Incentive zoning allows developers more 51 density in exchange for community improvements. An increase 52 in density encourages high density development supportive of 53 compact development. In exchange, the developer would be 54 encouraged to include some community improvements in their 55 projects. Community improvements may include additional 56 open space, affordable housing, special building features, or 57 public art. Public benefit zoning (PBZ) – also known as Land 58 Value Recapture - is based on the premise that land use changes 59 and enhancement enacted by a public agency contribute to 60 increased real estate values. It is reasonable to expect that if a 61 private landowner benefits from public action that benefits are 62 extended towards the community as well. In addition to the 63 value created by the up-zoning for the developer (as under 64 incentive zoning) additional value is extracted from the 65 landowner and dedicated to community benefits. More 66 information found at: 67
i. http://www.dca.state.ga.us/intra_nonpub/Toolkit/Guides/I68 ncntvZng.pdf ) 69
ii. http://www.abag.ca.gov/files/IncentiveZoning.pdf includes 70 bibliography for additional references) 71
72
PC Draft – July 2015 10-22 Lexington Park Development District Master Plan
Small Business Revolving Loan: Funds are available to loan to J.1 small businesses for working capital, inventory, leasehold 2 improvements, or fixed asset purchases. To be eligible, a 3 business must create new jobs, increase the county’s tax base 4 or eliminate blight. Terms are negotiable and available for 5 commercial projects only. 6
Vacant Property Tax Reimbursement Program: Property owners K.7 who rehabilitate vacant property for commercial reuse are 8 eligible to apply. 50% of the 2.5% payroll tax collected from the 9 new jobs created in the previously vacant building is paid 10 annually to the property owner for a period of five years. 25% 11 of the 2.5% payroll tax collected from any existing jobs 12 relocated to the previously vacant building also qualifies for the 13 reinvestment program. This reimbursement will be paid for five 14 years. The property must have been substantially vacant for the 15 previous 36 months and be at least 50 years old. 16
Grow Lexington Park Fund: Such a fund developed via a L.17 partnership between the county and the Grow America Fund, 18 Inc., a nonprofit lending arm of the National Development 19 Council could be designed to provide financing for small 20 businesses that need expansion capital. . In other locations 21 similar funds make loans ranging from $35,000 to $2 million at 22 or below market rates, for terms up to 25 years depending on 23 proposed use of funds. All loans must be adequately 24 collateralized. This program does not fund startup businesses. 25
Arts & Technology District Small Business Loan Program: A M.26 program designed to encourage the growth and development of 27 arts and technology related small businesses. Existing and 28 startup businesses located within a defined “Loan Zone” (such 29 as downtown and the Great Mills Corridor) would be eligible to 30 apply. All projects must result in the retention and/or creation 31 of jobs for persons of low and moderate income households. 32 Loan funds may be used for equipment, inventory, leasehold 33 improvements, and real estate improvements. The county can 34 loan up 50% of the total project costs, not to exceed $25,000. 35 All loans must be adequately collateralized. 36
New Home Owner Rehabilitation Loan Program: A New Home N.37 Owner Rehabilitation Loan Program could be administered by 38
the county’s Housing Development Department. Under the 39 program households purchasing residential or mixed use 40 structures for use as their primary residence are eligible for a 41 cash incentive of up to $6,000. This incentive is available only in 42 a defined area (suggest downtown and Great Mills Corridor) 43
Architectural Assistance Grant: A grant of up to $2,000 O.44 (suggested) made available to pay for the assistance of a 45 registered architect in mixed-use buildings located in 46 Downtown and Great Mills Corridors. Architectural assistance 47 should address obstacles related to converting upper floors of 48 downtown commercial buildings for residential use. Available 49 for mixed-use projects. 50
Assessment Moratorium (or property tax freeze): County to P.51 freeze property taxes at the pre-rehab level for a period of five 52 years. The program is available for the repair, rehabilitation or 53 restoration of existing commercial and residential buildings 25 54 years or older. 55
Investment Tax Credits: A 20% Federal Investment Tax Credit is Q.56 available for substantial rehabilitation of certified historic 57 buildings that are income producing (commercial, industrial, or 58 rental residential). The project must meet the Secretary of the 59 Interior’s Standards for Rehabilitation and then be certified 60 through the State Historic Preservation Office and the National 61 Park Service. A 10% credit is available for buildings built before 62 1936 that are not certified as historic. This credit is also 63 available for income producing properties. 64
i. The State of Maryland also offers a 30% credit against state 65 income tax liability for the rehabilitation of historic owner-66 occupied residential and a 20% tax credit for the 67 rehabilitate of other properties. Eligible projects must meet 68 the Secretary of the Interior’s Standards for Rehabilitation 69 and other program requirements. 70
Community Development Block Grant (CDBG): The CDBG R.71 program provides funds for the rehabilitation of both owner-72 occupied and investor-owned property. The county has various 73 rehabilitation programs as well as the capacity to design special 74 loans to specific projects with City Commission approval. All 75
PC Draft – July 2015 10-23 Lexington Park Development District Master Plan
projects must benefit low and moderate income citizens or 1 eliminate blight. Supportive public improvements and 2 acquisition of real estate may also be funded through this 3 program. Available for residential projects only. 4
“HOME”: A HOME program provides funds to assist in the S.5 development and maintenance of low and moderate income 6 housing. Funds may be used for acquisition, rehabilitation, and 7 new construction. A first time homebuyer’s program is a 8 feature of the program. Available for residential projects only. 9
Economic Development Revolving Loan Program: A loan pool T.10 that provides access to capital for small businesses, 11 entrepreneurs, developers and non-profits that are seeking to 12 stimulate the revitalization of neighborhoods and promote 13 permanent job creation for low to moderate income citizens. 14 Example found at 15 http://www.yesrichmondva.com/sites/default/files/documents/Arts%20%2616 %20Cultural%20District%20Micro-17 Enterprise%20Revolving%20Loan%20Program%20Application.pdf 18
CONTRACTORS ASSISTANCE LOAN PROGRAM: The purpose of a U.19 CAP Program is to provide access to capital to small contractors 20 that are doing business within community that lack access to 21 traditional financing. The goal is to provide contractors with 22 flexible terms and conditions, which may or may not be 23 available in the conventional marketplace. 24 Example found at 25 http://www.yesrichmondva.com/sites/default/files/documents/ContractorLo26 anBrochure_Final.pdf 27
Economic Development Fund (EDF) incentives for small and new V.28 businesses. An Economic Development Fund Authority (EDFA) 29 would commit a set amount for grants in each fiscal year 30 beginning on July 1and would be replenished on a fiscal year 31 basis. Each grant awarded on a first come, first serve basis and 32 provided until the annual funds have been depleted. 33
i. Rent Assistance Incentive Program: A program designed to 34 promote and encourage the recruitment of new small 35 targeted businesses locating in a targeted area. Eligible 36 properties that are current on real estate tax payments may 37 be considered for this matching grant incentive, which 38 provides cash grants to property owners to assist in the buy 39
down of lease rates to attract new tenants or the expansion 40 of existing tenants of buildings. Grant is only for small 41 businesses and must be duly authorized. The new 42 businesses selected will be within a specific target industry 43 identified in a strategic plan. The Economic Development 44 Fund Authority (EDFA) will provide a percentage of the 45 monthly lease rate for a twelve month period based on 46 proof of 3-year signed lease with the property owner up to 47 a set limit. 48
ii. Property Improvement Matching Grant Incentive: This 49 program is designed to promote and encourage small 50 business recruitment and retention by providing assistance 51 to property owners for renovations and build-out to attract 52 new tenants. All properties located in LPDD that are current 53 on real estate tax payments may be considered for this 54 matching grant incentive. The building must be an existing 55 building or redevelopment project. Projects covered in this 56 improvement incentive include new floors, ceiling tiles, 57 windows, doors, painting and other interior improvements 58 that will not be removed if vacated. The building will also 59 be listed on an inventory to assist in finding a new tenant 60 through the county. To illustrate, begin with an application 61 from the owners of the property to be improved (or the 62 applicant may confirm that the property owner has given 63 permission for the improvements to be made). A quote for 64 the proposed project and photographs of the area identified 65 for improvements would be attached to the application. 66 The application would provide color schemes if painting is 67 being proposed, and material specifications to be used. 68 Photographs of the improvements made and proof of 69 payment would be submitted prior to disbursement of EDA 70 funds. The EDFA would then review and consider funding 71 to assist in the buy-down of costs for the property owners 72 portion. If approved, the EDFA would provide $0.50 for 73 every dollar the property owner spends on interior 74 improvements up to $5,000. 75
76
PC Draft – July 2015 10-24 Lexington Park Development District Master Plan
iii. Façade Improvement Matching Grant: A program is 1 designed to provide assistance to property owners or 2 business owners for exterior façade improvements, new 3 signage and/or landscaping for business retention or to 4 attract new tenants. All properties located in LPDD that are 5 current on real estate tax payments may be considered for 6 this matching grant. To illustrate, begin with an application 7 from the owners of the property to be improved (or the 8 applicant may confirm that the property owner has given 9 permission for the improvements to be made). A quote for 10 the proposed project and photographs of the area identified 11 for improvements would be attached to the application. 12 The application would provide color schemes if painting is 13 being proposed, and material specifications to be used. 14 Photographs of the improvements made and proof of 15 payment would be submitted prior to disbursement of EDA 16 funds. The EDFA would then review and consider funding 17 to assist in the buy-down of costs for the property owners 18 portion. If approved, the EDFA would provide $0.50 for 19 every dollar the property owner spends on interior 20 improvements up to $2,000. This grant is awarded on a first 21 come, first serve basis and will be provided until the annual 22 funds have been depleted. 23
iv. Co-op Advertising Grant Program: A program is designed to 24 provide assistance to small businesses (businesses with at 25 least a one-year lease or own their buildings) with 26 advertising and promotional activities. Funds will be 27 allocated quarterly to this program to enable more 28 participation throughout the fiscal year. The EDFA staff will 29 review the applications for approval in the order in which 30 they are received. Funding will be provided until grant 31 allocations for the current fiscal year are depleted. A 32 maximum quarterly grant of $500 for multiple 33 advertising/marketing projects can be awarded to one 34 business. Applications must be submitted with proof of 35 advertising and marketing project and prior payment to be 36 considered. Funding cannot exceed 25% or $500 of the 37 total advertising/marketing costs. 38
v. E-Commerce Matching Grant Program: A program is 39 designed to provide assistance with new website design and 40 development. All properties that are current on real estate 41 tax payments may be considered for this matching grant 42 incentive. A new website must be established, where none 43 previously existed for the business; or, the applicant’s 44 existing website must include such upgrades as on-line 45 shopping, search engine optimization or other new 46 enhancements. Applicants must provide a minimum of two 47 quotes from a certified web designer for the website work. 48 The grant application must be signed and include the 2 49 quotes and selected provider information at time of 50 submittal. Upon website completion, the applicant will 51 submit the paid invoice and The EDFA will reimburse 50 52 cents for every dollar the business owner spends up to 53 $500. Minority, women and veteran owned businesses may 54 receive a matching grant up to $1,000. 55
Incentives for infill development W.56
i. Infrastructure-Related Incentives 57
a. Upgrading infrastructure and amenities. A key strategy 58 for encouraging infill development, particularly housing, 59 is a focused public investment strategy to improve 60 antiquated infrastructure and add public amenities such 61 as parks, libraries and streetscapes. These upgrades can 62 make a target area more attractive. Such infrastructure 63 upgrades are generally implemented by the 64 jurisdiction's public works or parks department in 65 response to locally set priorities. 66
b. Lowering of impact fees. Jurisdictions charge impact 67 fees to offset the costs of public facilities and services 68 necessary to serve the new development. Most 69 localities charge a uniform fee that may not account for 70 the higher costs to serve more distant suburban 71 locations. Offering lower impact fees for infill projects 72 can more accurately reflect the true costs for providing 73 services through existing infrastructure. This more 74 calibrated approach makes infill parcels more attractive, 75
PC Draft – July 2015 10-25 Lexington Park Development District Master Plan
and builds greater equity into metropolitan growth 1 patterns. Local governments can also waive 2 infrastructure hookup fees for infill projects to lower 3 costs to developers. Impact fees are included in the 4 jurisdiction's development regulations; the lowering or 5 waiving of such fees in response to priorities enacted by 6 the jurisdiction. 7
ii. Incentives related to the zoning and development process. 8
a. Incentives relating to the zoning regulations and 9 development permitting process fall under the purview 10 of the jurisdiction's planning and building department 11 as well as the planning commission, and are enacted in 12 response to direction from the county. 13
b. Fast Track and Streamlined Permitting. Fast track 14 permitting, applied within targeted infill development 15 areas, allows developers of infill parcels to get their 16 application processed ahead of non-infill applications. 17 Some localities consolidate or streamline permit 18 processing to allow concurrent review and processing of 19 related development permits. Since developers face 20 holding costs during the development review process, 21 long delays jeopardize the financial viability of a project. 22 Affordable housing projects with slim profit margins can 23 benefit substantially from speedy development review 24 and approval. Related strategies include "one stop" 25 centers for processing applications, and assignment of 26 one city staff as point person to help navigate a project 27 through the various departments and processes that 28 constitute the development review process. 29
c. Reduce lot sizes, setbacks, and parking requirements. 30 Many localities are updating their zoning code to 31 address the challenges of developing smaller parcels. 32 Key incentives modify regulations to allow for reduced 33 residential lot sizes, reduced setback requirements, and 34 reduced street and parking standards. Older standards 35 often make development of infill parcels impractical 36 because they tie up a large percentage of a site's total 37
land area. Some requirements, in particular for on-site 38 parking, may be inappropriate or unnecessary for infill 39 areas where transit service and other alternatives to 40 auto use exist. 41
d. Zone for mixed-use development. Traditional zoning 42 has emphasized the separation of land uses. Smart 43 growth principles emphasize the creation of integrated, 44 multi-use districts that blend housing, services, 45 recreation and jobs. Local governments may put in 46 place a residential/mixed-use zoning designation to 47 specifically encourage infill practices such as allowing 48 housing development above stores. This enables 49 residents to be closer to the services they use on a daily 50 basis. To ensure availability of affordable housing, the 51 jurisdiction can amend the zoning regulations to 52 establish an overlay zone for the residential/mixed-use 53 district that permits the development of affordable 54 housing "by right" on the areas covered in the overlay. 55 A "by right" zoning designation makes affordable 56 housing development easier by eliminating the need to 57 obtain a special use permit or undergo a zoning change 58 approval process. 59
e. Increase density allowances. Increasing the maximum 60 allowed density for infill areas in the zoning regulations 61 is an important incentive. Higher densities permit more 62 intensive development of a parcel and allow the 63 developer the opportunity to spread development costs 64 over more units. Local governments can also provide 65 "density bonuses" to developers of infill sites that 66 designate a certain percentage of housing units as 67 affordable. In this way, localities can both encourage 68 efficient use of the land and promote the inclusion of 69 affordable housing units within a project. 70
Other Incentives. Localities can offer property tax abatement X.71 for infill multi-family housing, or for housing priced under a 72 certain threshold. For example, Portland, Oregon offers tax 73 abatement for affordable homeownership projects in particular 74
PC Draft – July 2015 10-26 Lexington Park Development District Master Plan
districts. Some local governments or regional planning agencies 1 offer grants or loans (usually from federal government sources) 2 to encourage specific infill strategies such as transit-oriented 3 development. Local governments can also facilitate infill 4 development through land assembly by assembling small, 5 individual parcels into large blocks under common ownership. 6 The jurisdiction then undertakes property improvements and 7 packages the properties for resale. Cleveland, Ohio operates a 8 successful land assembly program whereby the city receives 9 delinquent properties and transfers most of the developable 10 parcels to the public housing agency or non-profit affordable 11 housing developers. 12
13
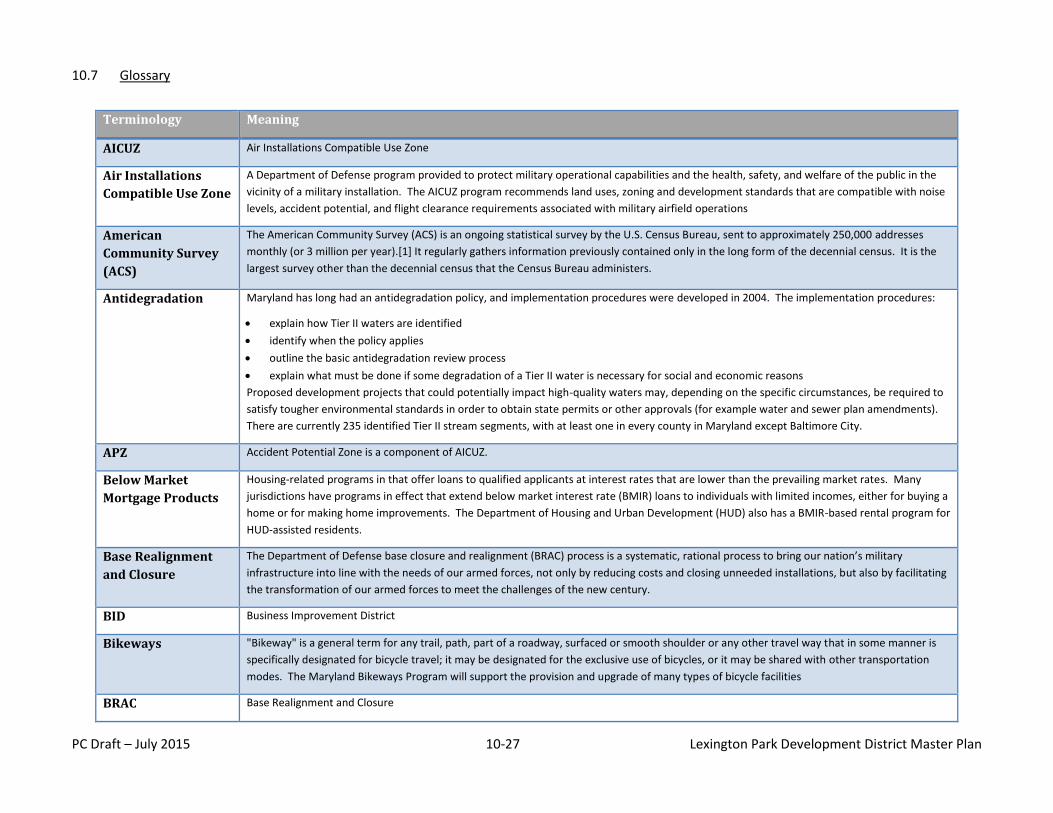
PC Draft – July 2015 10-27 Lexington Park Development District Master Plan
10.7 Glossary
Terminology Meaning
AICUZ Air Installations Compatible Use Zone
Air Installations
Compatible Use Zone
A Department of Defense program provided to protect military operational capabilities and the health, safety, and welfare of the public in the
vicinity of a military installation. The AICUZ program recommends land uses, zoning and development standards that are compatible with noise
levels, accident potential, and flight clearance requirements associated with military airfield operations
American
Community Survey
(ACS)
The American Community Survey (ACS) is an ongoing statistical survey by the U.S. Census Bureau, sent to approximately 250,000 addresses
monthly (or 3 million per year).[1] It regularly gathers information previously contained only in the long form of the decennial census. It is the
largest survey other than the decennial census that the Census Bureau administers.
Antidegradation Maryland has long had an antidegradation policy, and implementation procedures were developed in 2004. The implementation procedures:
explain how Tier II waters are identified
identify when the policy applies
outline the basic antidegradation review process
explain what must be done if some degradation of a Tier II water is necessary for social and economic reasons
Proposed development projects that could potentially impact high-quality waters may, depending on the specific circumstances, be required to
satisfy tougher environmental standards in order to obtain state permits or other approvals (for example water and sewer plan amendments).
There are currently 235 identified Tier II stream segments, with at least one in every county in Maryland except Baltimore City.
APZ Accident Potential Zone is a component of AICUZ.
Below Market
Mortgage Products
Housing-related programs in that offer loans to qualified applicants at interest rates that are lower than the prevailing market rates. Many
jurisdictions have programs in effect that extend below market interest rate (BMIR) loans to individuals with limited incomes, either for buying a
home or for making home improvements. The Department of Housing and Urban Development (HUD) also has a BMIR-based rental program for
HUD-assisted residents.
Base Realignment
and Closure
The Department of Defense base closure and realignment (BRAC) process is a systematic, rational process to bring our nation’s military
infrastructure into line with the needs of our armed forces, not only by reducing costs and closing unneeded installations, but also by facilitating
the transformation of our armed forces to meet the challenges of the new century.
BID Business Improvement District
Bikeways "Bikeway" is a general term for any trail, path, part of a roadway, surfaced or smooth shoulder or any other travel way that in some manner is
specifically designated for bicycle travel; it may be designated for the exclusive use of bicycles, or it may be shared with other transportation
modes. The Maryland Bikeways Program will support the provision and upgrade of many types of bicycle facilities
BRAC Base Realignment and Closure
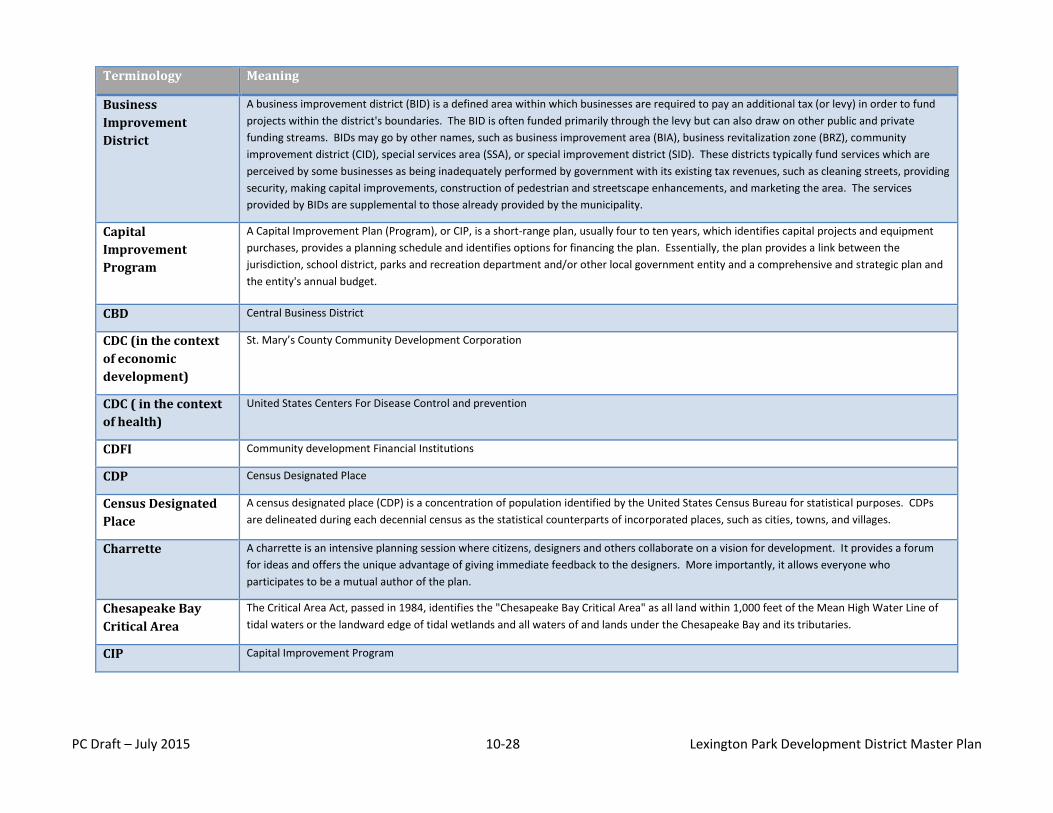
PC Draft – July 2015 10-28 Lexington Park Development District Master Plan
Terminology Meaning
Business
Improvement
District
A business improvement district (BID) is a defined area within which businesses are required to pay an additional tax (or levy) in order to fund
projects within the district's boundaries. The BID is often funded primarily through the levy but can also draw on other public and private
funding streams. BIDs may go by other names, such as business improvement area (BIA), business revitalization zone (BRZ), community
improvement district (CID), special services area (SSA), or special improvement district (SID). These districts typically fund services which are
perceived by some businesses as being inadequately performed by government with its existing tax revenues, such as cleaning streets, providing
security, making capital improvements, construction of pedestrian and streetscape enhancements, and marketing the area. The services
provided by BIDs are supplemental to those already provided by the municipality.
Capital
Improvement
Program
A Capital Improvement Plan (Program), or CIP, is a short-range plan, usually four to ten years, which identifies capital projects and equipment
purchases, provides a planning schedule and identifies options for financing the plan. Essentially, the plan provides a link between the
jurisdiction, school district, parks and recreation department and/or other local government entity and a comprehensive and strategic plan and
the entity's annual budget.
CBD Central Business District
CDC (in the context
of economic
development)
St. Mary’s County Community Development Corporation
CDC ( in the context
of health)
United States Centers For Disease Control and prevention
CDFI Community development Financial Institutions
CDP Census Designated Place
Census Designated
Place
A census designated place (CDP) is a concentration of population identified by the United States Census Bureau for statistical purposes. CDPs
are delineated during each decennial census as the statistical counterparts of incorporated places, such as cities, towns, and villages.
Charrette A charrette is an intensive planning session where citizens, designers and others collaborate on a vision for development. It provides a forum
for ideas and offers the unique advantage of giving immediate feedback to the designers. More importantly, it allows everyone who
participates to be a mutual author of the plan.
Chesapeake Bay
Critical Area
The Critical Area Act, passed in 1984, identifies the "Chesapeake Bay Critical Area" as all land within 1,000 feet of the Mean High Water Line of
tidal waters or the landward edge of tidal wetlands and all waters of and lands under the Chesapeake Bay and its tributaries.
CIP Capital Improvement Program
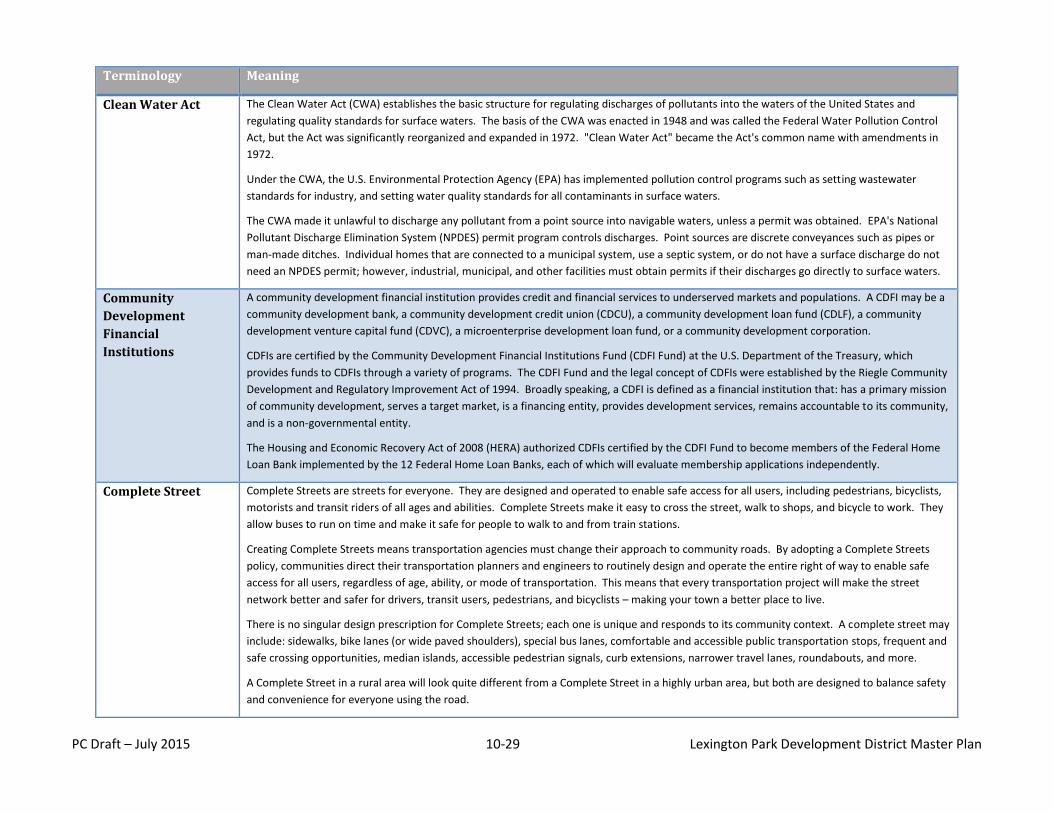
PC Draft – July 2015 10-29 Lexington Park Development District Master Plan
Terminology Meaning
Clean Water Act The Clean Water Act (CWA) establishes the basic structure for regulating discharges of pollutants into the waters of the United States and
regulating quality standards for surface waters. The basis of the CWA was enacted in 1948 and was called the Federal Water Pollution Control
Act, but the Act was significantly reorganized and expanded in 1972. "Clean Water Act" became the Act's common name with amendments in
1972.
Under the CWA, the U.S. Environmental Protection Agency (EPA) has implemented pollution control programs such as setting wastewater
standards for industry, and setting water quality standards for all contaminants in surface waters.
The CWA made it unlawful to discharge any pollutant from a point source into navigable waters, unless a permit was obtained. EPA's National
Pollutant Discharge Elimination System (NPDES) permit program controls discharges. Point sources are discrete conveyances such as pipes or
man-made ditches. Individual homes that are connected to a municipal system, use a septic system, or do not have a surface discharge do not
need an NPDES permit; however, industrial, municipal, and other facilities must obtain permits if their discharges go directly to surface waters.
Community
Development
Financial
Institutions
A community development financial institution provides credit and financial services to underserved markets and populations. A CDFI may be a
community development bank, a community development credit union (CDCU), a community development loan fund (CDLF), a community
development venture capital fund (CDVC), a microenterprise development loan fund, or a community development corporation.
CDFIs are certified by the Community Development Financial Institutions Fund (CDFI Fund) at the U.S. Department of the Treasury, which
provides funds to CDFIs through a variety of programs. The CDFI Fund and the legal concept of CDFIs were established by the Riegle Community
Development and Regulatory Improvement Act of 1994. Broadly speaking, a CDFI is defined as a financial institution that: has a primary mission
of community development, serves a target market, is a financing entity, provides development services, remains accountable to its community,
and is a non-governmental entity.
The Housing and Economic Recovery Act of 2008 (HERA) authorized CDFIs certified by the CDFI Fund to become members of the Federal Home
Loan Bank implemented by the 12 Federal Home Loan Banks, each of which will evaluate membership applications independently.
Complete Street Complete Streets are streets for everyone. They are designed and operated to enable safe access for all users, including pedestrians, bicyclists,
motorists and transit riders of all ages and abilities. Complete Streets make it easy to cross the street, walk to shops, and bicycle to work. They
allow buses to run on time and make it safe for people to walk to and from train stations.
Creating Complete Streets means transportation agencies must change their approach to community roads. By adopting a Complete Streets
policy, communities direct their transportation planners and engineers to routinely design and operate the entire right of way to enable safe
access for all users, regardless of age, ability, or mode of transportation. This means that every transportation project will make the street
network better and safer for drivers, transit users, pedestrians, and bicyclists – making your town a better place to live.
There is no singular design prescription for Complete Streets; each one is unique and responds to its community context. A complete street may
include: sidewalks, bike lanes (or wide paved shoulders), special bus lanes, comfortable and accessible public transportation stops, frequent and
safe crossing opportunities, median islands, accessible pedestrian signals, curb extensions, narrower travel lanes, roundabouts, and more.
A Complete Street in a rural area will look quite different from a Complete Street in a highly urban area, but both are designed to balance safety
and convenience for everyone using the road.
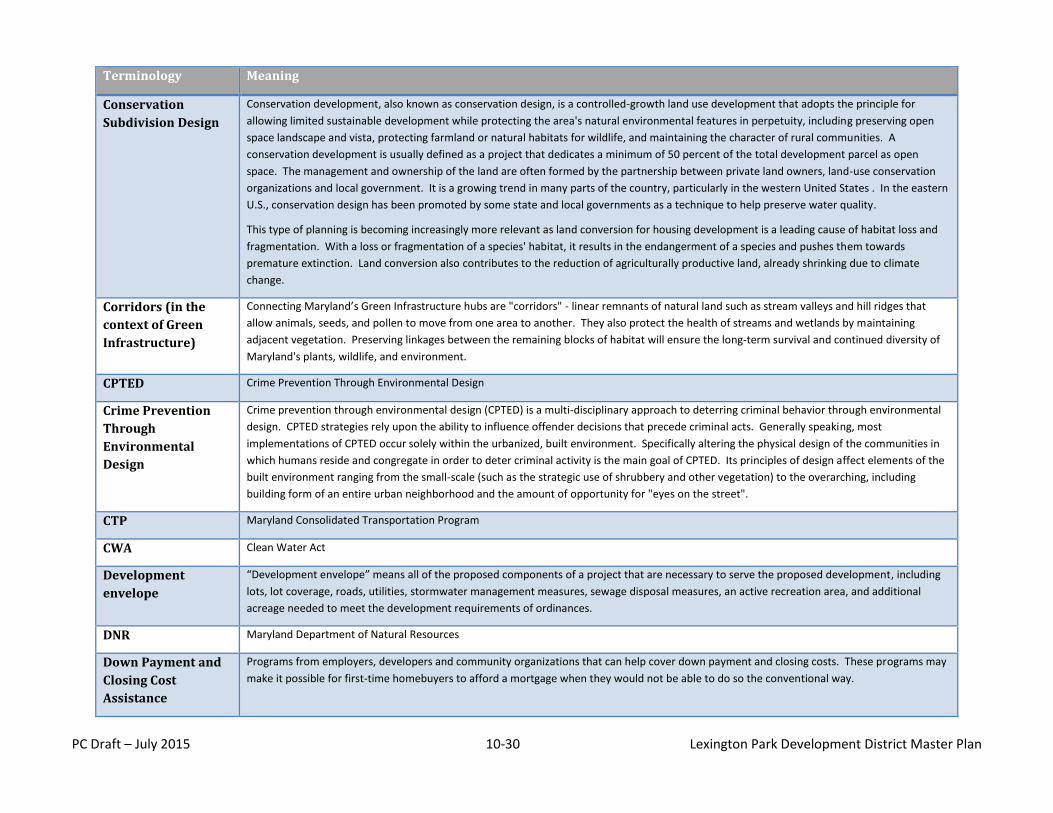
PC Draft – July 2015 10-30 Lexington Park Development District Master Plan
Terminology Meaning
Conservation
Subdivision Design
Conservation development, also known as conservation design, is a controlled-growth land use development that adopts the principle for
allowing limited sustainable development while protecting the area's natural environmental features in perpetuity, including preserving open
space landscape and vista, protecting farmland or natural habitats for wildlife, and maintaining the character of rural communities. A
conservation development is usually defined as a project that dedicates a minimum of 50 percent of the total development parcel as open
space. The management and ownership of the land are often formed by the partnership between private land owners, land-use conservation
organizations and local government. It is a growing trend in many parts of the country, particularly in the western United States . In the eastern
U.S., conservation design has been promoted by some state and local governments as a technique to help preserve water quality.
This type of planning is becoming increasingly more relevant as land conversion for housing development is a leading cause of habitat loss and
fragmentation. With a loss or fragmentation of a species' habitat, it results in the endangerment of a species and pushes them towards
premature extinction. Land conversion also contributes to the reduction of agriculturally productive land, already shrinking due to climate
change.
Corridors (in the
context of Green
Infrastructure)
Connecting Maryland’s Green Infrastructure hubs are "corridors" - linear remnants of natural land such as stream valleys and hill ridges that
allow animals, seeds, and pollen to move from one area to another. They also protect the health of streams and wetlands by maintaining
adjacent vegetation. Preserving linkages between the remaining blocks of habitat will ensure the long-term survival and continued diversity of
Maryland's plants, wildlife, and environment.
CPTED Crime Prevention Through Environmental Design
Crime Prevention
Through
Environmental
Design
Crime prevention through environmental design (CPTED) is a multi-disciplinary approach to deterring criminal behavior through environmental
design. CPTED strategies rely upon the ability to influence offender decisions that precede criminal acts. Generally speaking, most
implementations of CPTED occur solely within the urbanized, built environment. Specifically altering the physical design of the communities in
which humans reside and congregate in order to deter criminal activity is the main goal of CPTED. Its principles of design affect elements of the
built environment ranging from the small-scale (such as the strategic use of shrubbery and other vegetation) to the overarching, including
building form of an entire urban neighborhood and the amount of opportunity for "eyes on the street".
CTP Maryland Consolidated Transportation Program
CWA Clean Water Act
Development
envelope
“Development envelope” means all of the proposed components of a project that are necessary to serve the proposed development, including
lots, lot coverage, roads, utilities, stormwater management measures, sewage disposal measures, an active recreation area, and additional
acreage needed to meet the development requirements of ordinances.
DNR Maryland Department of Natural Resources
Down Payment and
Closing Cost
Assistance
Programs from employers, developers and community organizations that can help cover down payment and closing costs. These programs may
make it possible for first-time homebuyers to afford a mortgage when they would not be able to do so the conventional way.
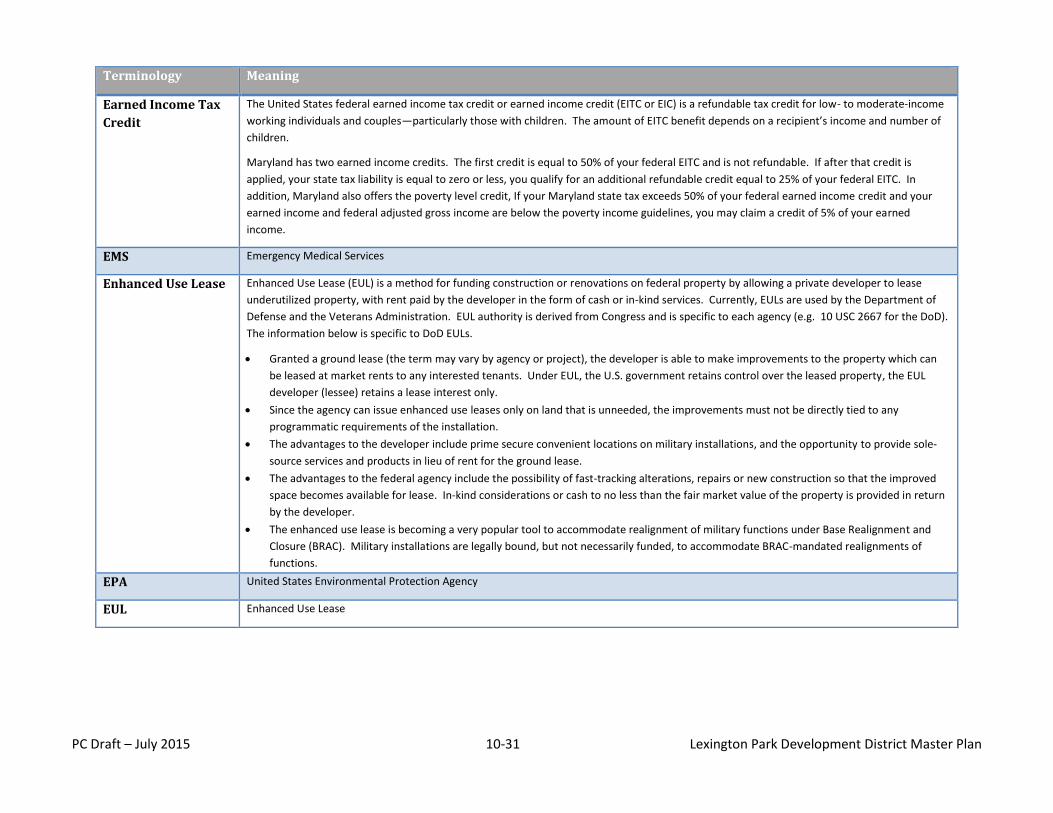
PC Draft – July 2015 10-31 Lexington Park Development District Master Plan
Terminology Meaning
Earned Income Tax
Credit
The United States federal earned income tax credit or earned income credit (EITC or EIC) is a refundable tax credit for low- to moderate-income
working individuals and couples—particularly those with children. The amount of EITC benefit depends on a recipient’s income and number of
children.
Maryland has two earned income credits. The first credit is equal to 50% of your federal EITC and is not refundable. If after that credit is
applied, your state tax liability is equal to zero or less, you qualify for an additional refundable credit equal to 25% of your federal EITC. In
addition, Maryland also offers the poverty level credit, If your Maryland state tax exceeds 50% of your federal earned income credit and your
earned income and federal adjusted gross income are below the poverty income guidelines, you may claim a credit of 5% of your earned
income.
EMS Emergency Medical Services
Enhanced Use Lease Enhanced Use Lease (EUL) is a method for funding construction or renovations on federal property by allowing a private developer to lease
underutilized property, with rent paid by the developer in the form of cash or in-kind services. Currently, EULs are used by the Department of
Defense and the Veterans Administration. EUL authority is derived from Congress and is specific to each agency (e.g. 10 USC 2667 for the DoD).
The information below is specific to DoD EULs.
Granted a ground lease (the term may vary by agency or project), the developer is able to make improvements to the property which can
be leased at market rents to any interested tenants. Under EUL, the U.S. government retains control over the leased property, the EUL
developer (lessee) retains a lease interest only.
Since the agency can issue enhanced use leases only on land that is unneeded, the improvements must not be directly tied to any
programmatic requirements of the installation.
The advantages to the developer include prime secure convenient locations on military installations, and the opportunity to provide sole-
source services and products in lieu of rent for the ground lease.
The advantages to the federal agency include the possibility of fast-tracking alterations, repairs or new construction so that the improved
space becomes available for lease. In-kind considerations or cash to no less than the fair market value of the property is provided in return
by the developer.
The enhanced use lease is becoming a very popular tool to accommodate realignment of military functions under Base Realignment and
Closure (BRAC). Military installations are legally bound, but not necessarily funded, to accommodate BRAC-mandated realignments of
functions.
EPA United States Environmental Protection Agency
EUL Enhanced Use Lease
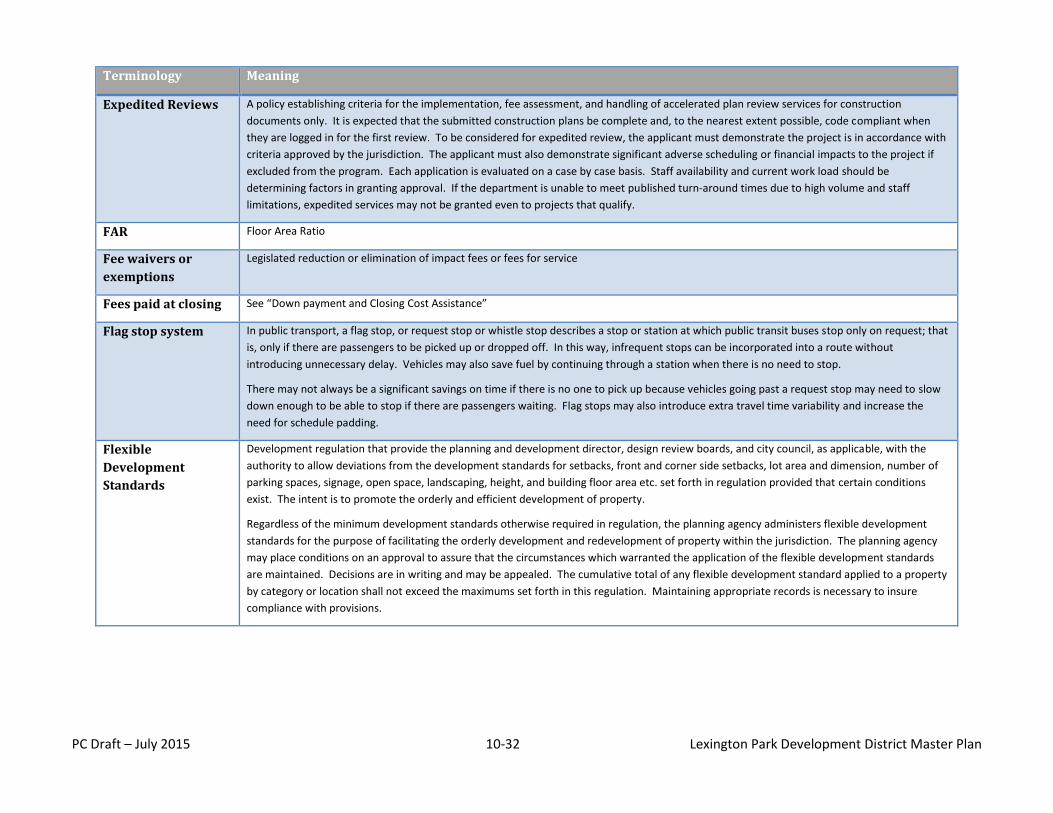
PC Draft – July 2015 10-32 Lexington Park Development District Master Plan
Terminology Meaning
Expedited Reviews A policy establishing criteria for the implementation, fee assessment, and handling of accelerated plan review services for construction
documents only. It is expected that the submitted construction plans be complete and, to the nearest extent possible, code compliant when
they are logged in for the first review. To be considered for expedited review, the applicant must demonstrate the project is in accordance with
criteria approved by the jurisdiction. The applicant must also demonstrate significant adverse scheduling or financial impacts to the project if
excluded from the program. Each application is evaluated on a case by case basis. Staff availability and current work load should be
determining factors in granting approval. If the department is unable to meet published turn-around times due to high volume and staff
limitations, expedited services may not be granted even to projects that qualify.
FAR Floor Area Ratio
Fee waivers or
exemptions
Legislated reduction or elimination of impact fees or fees for service
Fees paid at closing See “Down payment and Closing Cost Assistance”
Flag stop system In public transport, a flag stop, or request stop or whistle stop describes a stop or station at which public transit buses stop only on request; that
is, only if there are passengers to be picked up or dropped off. In this way, infrequent stops can be incorporated into a route without
introducing unnecessary delay. Vehicles may also save fuel by continuing through a station when there is no need to stop.
There may not always be a significant savings on time if there is no one to pick up because vehicles going past a request stop may need to slow
down enough to be able to stop if there are passengers waiting. Flag stops may also introduce extra travel time variability and increase the
need for schedule padding.
Flexible
Development
Standards
Development regulation that provide the planning and development director, design review boards, and city council, as applicable, with the
authority to allow deviations from the development standards for setbacks, front and corner side setbacks, lot area and dimension, number of
parking spaces, signage, open space, landscaping, height, and building floor area etc. set forth in regulation provided that certain conditions
exist. The intent is to promote the orderly and efficient development of property.
Regardless of the minimum development standards otherwise required in regulation, the planning agency administers flexible development
standards for the purpose of facilitating the orderly development and redevelopment of property within the jurisdiction. The planning agency
may place conditions on an approval to assure that the circumstances which warranted the application of the flexible development standards
are maintained. Decisions are in writing and may be appealed. The cumulative total of any flexible development standard applied to a property
by category or location shall not exceed the maximums set forth in this regulation. Maintaining appropriate records is necessary to insure
compliance with provisions.
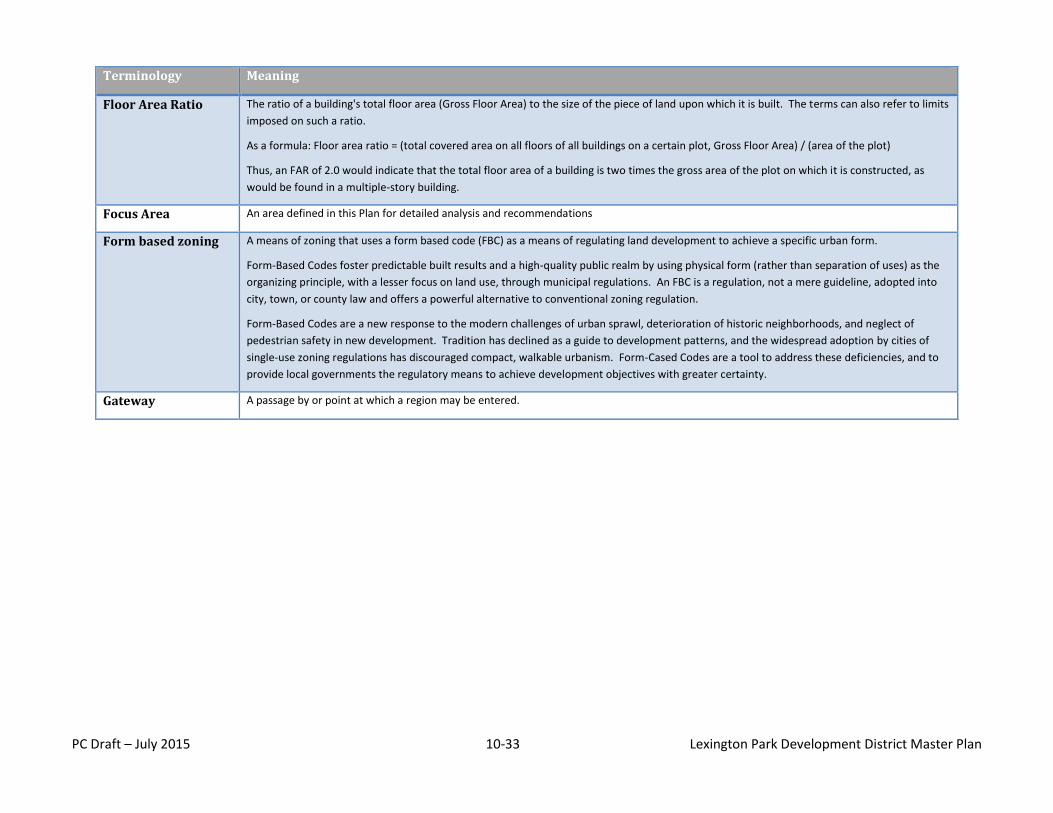
PC Draft – July 2015 10-33 Lexington Park Development District Master Plan
Terminology Meaning
Floor Area Ratio The ratio of a building's total floor area (Gross Floor Area) to the size of the piece of land upon which it is built. The terms can also refer to limits
imposed on such a ratio.
As a formula: Floor area ratio = (total covered area on all floors of all buildings on a certain plot, Gross Floor Area) / (area of the plot)
Thus, an FAR of 2.0 would indicate that the total floor area of a building is two times the gross area of the plot on which it is constructed, as
would be found in a multiple-story building.
Focus Area An area defined in this Plan for detailed analysis and recommendations
Form based zoning A means of zoning that uses a form based code (FBC) as a means of regulating land development to achieve a specific urban form.
Form-Based Codes foster predictable built results and a high-quality public realm by using physical form (rather than separation of uses) as the
organizing principle, with a lesser focus on land use, through municipal regulations. An FBC is a regulation, not a mere guideline, adopted into
city, town, or county law and offers a powerful alternative to conventional zoning regulation.
Form-Based Codes are a new response to the modern challenges of urban sprawl, deterioration of historic neighborhoods, and neglect of
pedestrian safety in new development. Tradition has declined as a guide to development patterns, and the widespread adoption by cities of
single-use zoning regulations has discouraged compact, walkable urbanism. Form-Cased Codes are a tool to address these deficiencies, and to
provide local governments the regulatory means to achieve development objectives with greater certainty.
Gateway A passage by or point at which a region may be entered.
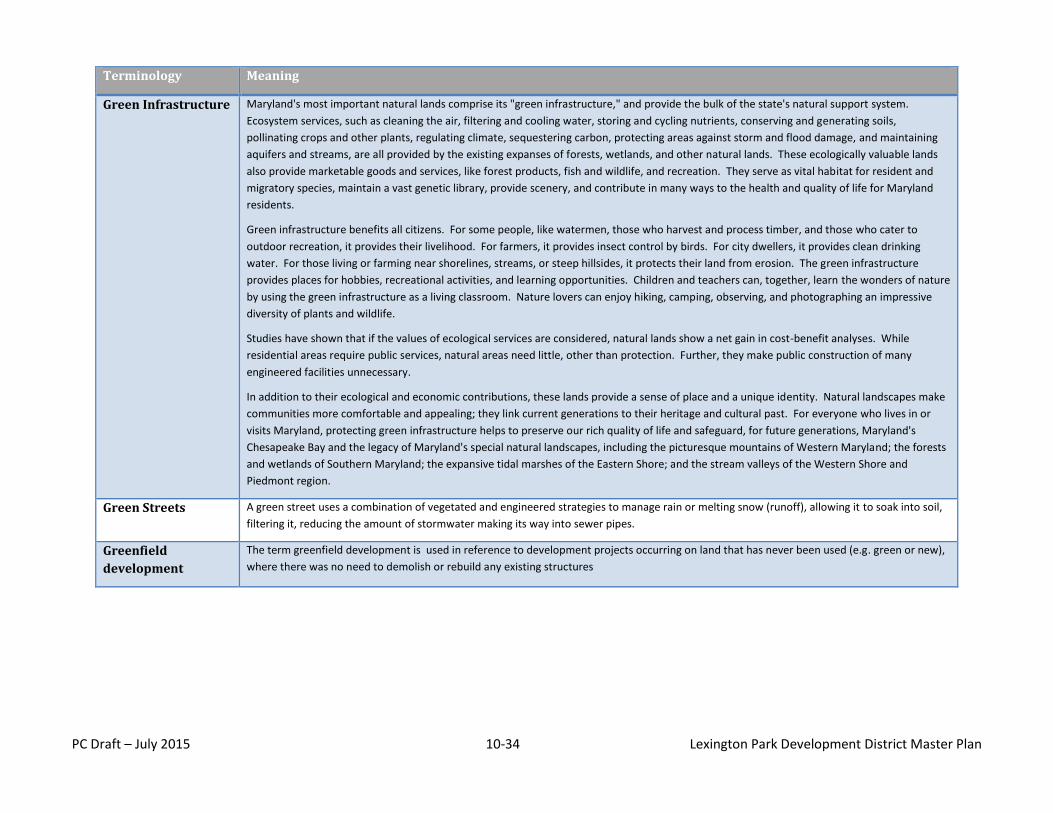
PC Draft – July 2015 10-34 Lexington Park Development District Master Plan
Terminology Meaning
Green Infrastructure Maryland's most important natural lands comprise its "green infrastructure," and provide the bulk of the state's natural support system.
Ecosystem services, such as cleaning the air, filtering and cooling water, storing and cycling nutrients, conserving and generating soils,
pollinating crops and other plants, regulating climate, sequestering carbon, protecting areas against storm and flood damage, and maintaining
aquifers and streams, are all provided by the existing expanses of forests, wetlands, and other natural lands. These ecologically valuable lands
also provide marketable goods and services, like forest products, fish and wildlife, and recreation. They serve as vital habitat for resident and
migratory species, maintain a vast genetic library, provide scenery, and contribute in many ways to the health and quality of life for Maryland
residents.
Green infrastructure benefits all citizens. For some people, like watermen, those who harvest and process timber, and those who cater to
outdoor recreation, it provides their livelihood. For farmers, it provides insect control by birds. For city dwellers, it provides clean drinking
water. For those living or farming near shorelines, streams, or steep hillsides, it protects their land from erosion. The green infrastructure
provides places for hobbies, recreational activities, and learning opportunities. Children and teachers can, together, learn the wonders of nature
by using the green infrastructure as a living classroom. Nature lovers can enjoy hiking, camping, observing, and photographing an impressive
diversity of plants and wildlife.
Studies have shown that if the values of ecological services are considered, natural lands show a net gain in cost-benefit analyses. While
residential areas require public services, natural areas need little, other than protection. Further, they make public construction of many
engineered facilities unnecessary.
In addition to their ecological and economic contributions, these lands provide a sense of place and a unique identity. Natural landscapes make
communities more comfortable and appealing; they link current generations to their heritage and cultural past. For everyone who lives in or
visits Maryland, protecting green infrastructure helps to preserve our rich quality of life and safeguard, for future generations, Maryland's
Chesapeake Bay and the legacy of Maryland's special natural landscapes, including the picturesque mountains of Western Maryland; the forests
and wetlands of Southern Maryland; the expansive tidal marshes of the Eastern Shore; and the stream valleys of the Western Shore and
Piedmont region.
Green Streets A green street uses a combination of vegetated and engineered strategies to manage rain or melting snow (runoff), allowing it to soak into soil,
filtering it, reducing the amount of stormwater making its way into sewer pipes.
Greenfield
development
The term greenfield development is used in reference to development projects occurring on land that has never been used (e.g. green or new),
where there was no need to demolish or rebuild any existing structures
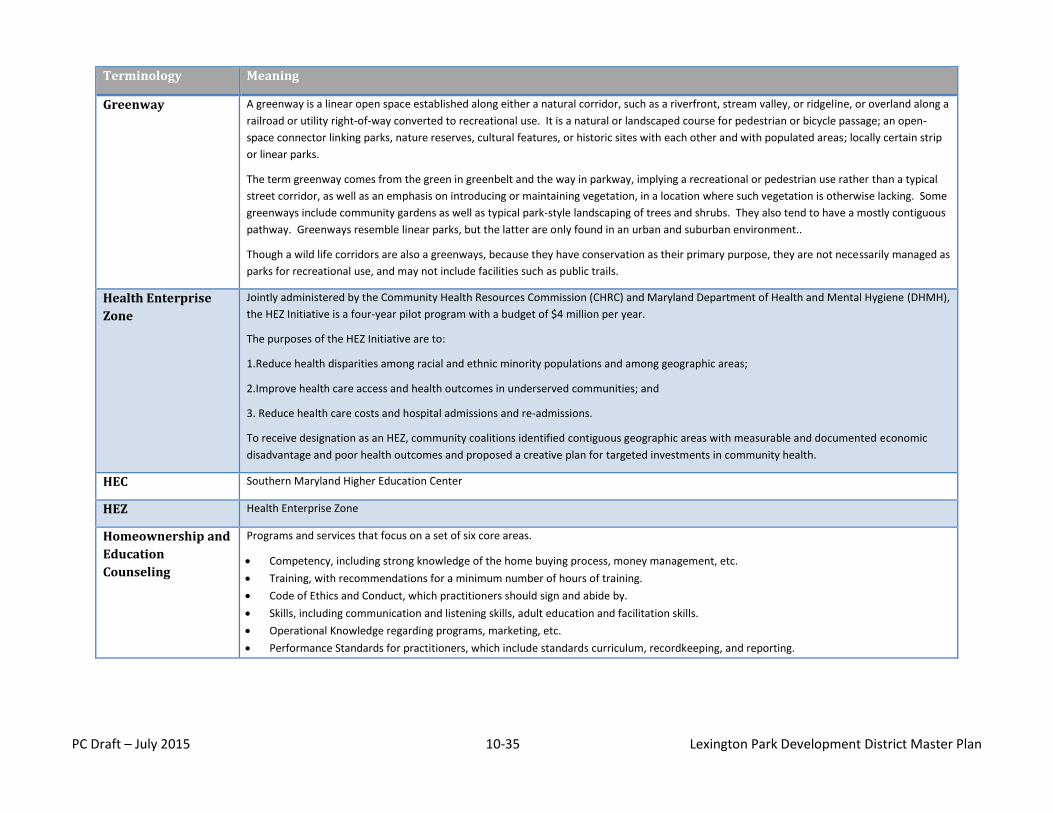
PC Draft – July 2015 10-35 Lexington Park Development District Master Plan
Terminology Meaning
Greenway A greenway is a linear open space established along either a natural corridor, such as a riverfront, stream valley, or ridgeline, or overland along a
railroad or utility right-of-way converted to recreational use. It is a natural or landscaped course for pedestrian or bicycle passage; an open-
space connector linking parks, nature reserves, cultural features, or historic sites with each other and with populated areas; locally certain strip
or linear parks.
The term greenway comes from the green in greenbelt and the way in parkway, implying a recreational or pedestrian use rather than a typical
street corridor, as well as an emphasis on introducing or maintaining vegetation, in a location where such vegetation is otherwise lacking. Some
greenways include community gardens as well as typical park-style landscaping of trees and shrubs. They also tend to have a mostly contiguous
pathway. Greenways resemble linear parks, but the latter are only found in an urban and suburban environment..
Though a wild life corridors are also a greenways, because they have conservation as their primary purpose, they are not necessarily managed as
parks for recreational use, and may not include facilities such as public trails.
Health Enterprise
Zone
Jointly administered by the Community Health Resources Commission (CHRC) and Maryland Department of Health and Mental Hygiene (DHMH),
the HEZ Initiative is a four-year pilot program with a budget of $4 million per year.
The purposes of the HEZ Initiative are to:
1.Reduce health disparities among racial and ethnic minority populations and among geographic areas;
2.Improve health care access and health outcomes in underserved communities; and
3. Reduce health care costs and hospital admissions and re-admissions.
To receive designation as an HEZ, community coalitions identified contiguous geographic areas with measurable and documented economic
disadvantage and poor health outcomes and proposed a creative plan for targeted investments in community health.
HEC Southern Maryland Higher Education Center
HEZ Health Enterprise Zone
Homeownership and
Education
Counseling
Programs and services that focus on a set of six core areas.
Competency, including strong knowledge of the home buying process, money management, etc.
Training, with recommendations for a minimum number of hours of training.
Code of Ethics and Conduct, which practitioners should sign and abide by.
Skills, including communication and listening skills, adult education and facilitation skills.
Operational Knowledge regarding programs, marketing, etc.
Performance Standards for practitioners, which include standards curriculum, recordkeeping, and reporting.
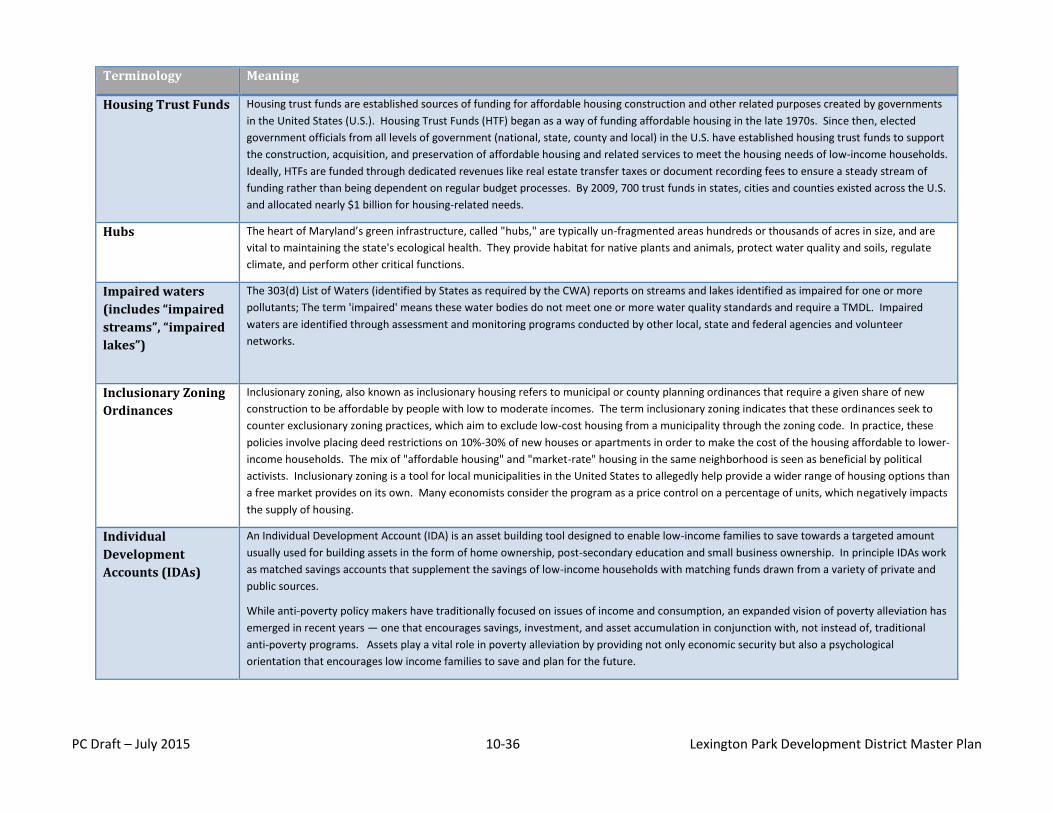
PC Draft – July 2015 10-36 Lexington Park Development District Master Plan
Terminology Meaning
Housing Trust Funds Housing trust funds are established sources of funding for affordable housing construction and other related purposes created by governments
in the United States (U.S.). Housing Trust Funds (HTF) began as a way of funding affordable housing in the late 1970s. Since then, elected
government officials from all levels of government (national, state, county and local) in the U.S. have established housing trust funds to support
the construction, acquisition, and preservation of affordable housing and related services to meet the housing needs of low-income households.
Ideally, HTFs are funded through dedicated revenues like real estate transfer taxes or document recording fees to ensure a steady stream of
funding rather than being dependent on regular budget processes. By 2009, 700 trust funds in states, cities and counties existed across the U.S.
and allocated nearly $1 billion for housing-related needs.
Hubs The heart of Maryland’s green infrastructure, called "hubs," are typically un-fragmented areas hundreds or thousands of acres in size, and are
vital to maintaining the state's ecological health. They provide habitat for native plants and animals, protect water quality and soils, regulate
climate, and perform other critical functions.
Impaired waters
(includes “impaired
streams”, “impaired
lakes”)
The 303(d) List of Waters (identified by States as required by the CWA) reports on streams and lakes identified as impaired for one or more
pollutants; The term 'impaired' means these water bodies do not meet one or more water quality standards and require a TMDL. Impaired
waters are identified through assessment and monitoring programs conducted by other local, state and federal agencies and volunteer
networks.
Inclusionary Zoning
Ordinances
Inclusionary zoning, also known as inclusionary housing refers to municipal or county planning ordinances that require a given share of new
construction to be affordable by people with low to moderate incomes. The term inclusionary zoning indicates that these ordinances seek to
counter exclusionary zoning practices, which aim to exclude low-cost housing from a municipality through the zoning code. In practice, these
policies involve placing deed restrictions on 10%-30% of new houses or apartments in order to make the cost of the housing affordable to lower-
income households. The mix of "affordable housing" and "market-rate" housing in the same neighborhood is seen as beneficial by political
activists. Inclusionary zoning is a tool for local municipalities in the United States to allegedly help provide a wider range of housing options than
a free market provides on its own. Many economists consider the program as a price control on a percentage of units, which negatively impacts
the supply of housing.
Individual
Development
Accounts (IDAs)
An Individual Development Account (IDA) is an asset building tool designed to enable low-income families to save towards a targeted amount
usually used for building assets in the form of home ownership, post-secondary education and small business ownership. In principle IDAs work
as matched savings accounts that supplement the savings of low-income households with matching funds drawn from a variety of private and
public sources.
While anti-poverty policy makers have traditionally focused on issues of income and consumption, an expanded vision of poverty alleviation has
emerged in recent years — one that encourages savings, investment, and asset accumulation in conjunction with, not instead of, traditional
anti-poverty programs. Assets play a vital role in poverty alleviation by providing not only economic security but also a psychological
orientation that encourages low income families to save and plan for the future.
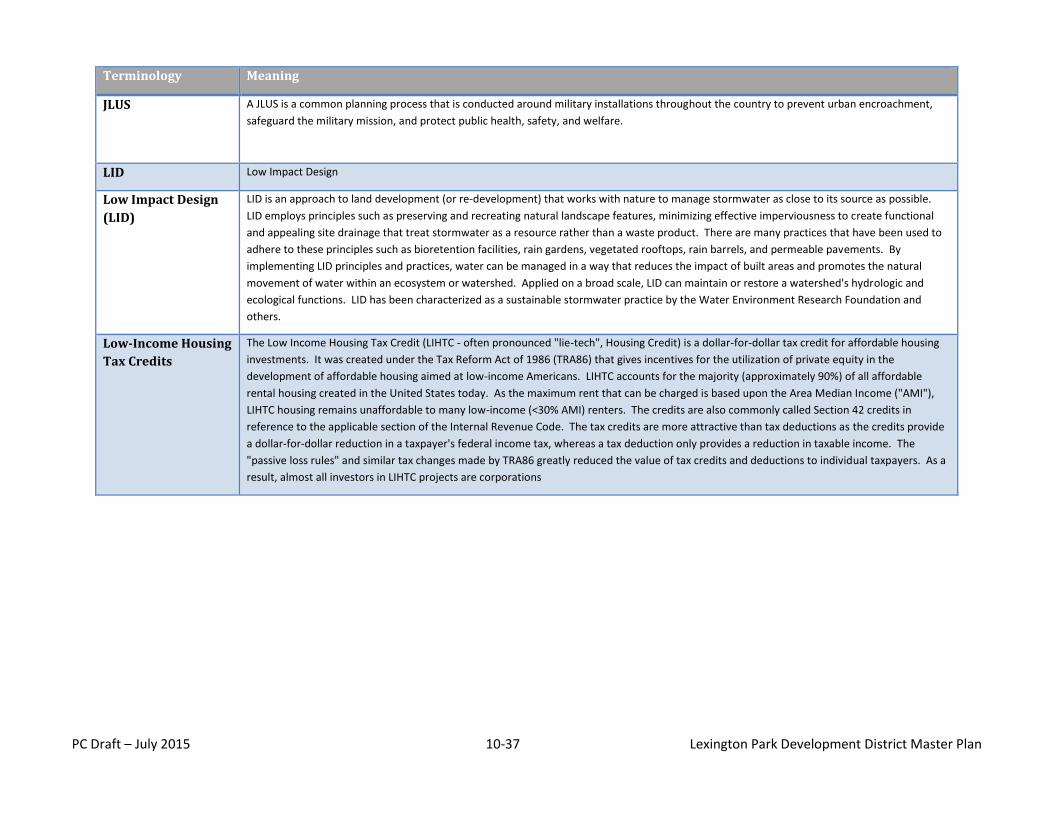
PC Draft – July 2015 10-37 Lexington Park Development District Master Plan
Terminology Meaning
JLUS A JLUS is a common planning process that is conducted around military installations throughout the country to prevent urban encroachment,
safeguard the military mission, and protect public health, safety, and welfare.
LID Low Impact Design
Low Impact Design
(LID)
LID is an approach to land development (or re-development) that works with nature to manage stormwater as close to its source as possible.
LID employs principles such as preserving and recreating natural landscape features, minimizing effective imperviousness to create functional
and appealing site drainage that treat stormwater as a resource rather than a waste product. There are many practices that have been used to
adhere to these principles such as bioretention facilities, rain gardens, vegetated rooftops, rain barrels, and permeable pavements. By
implementing LID principles and practices, water can be managed in a way that reduces the impact of built areas and promotes the natural
movement of water within an ecosystem or watershed. Applied on a broad scale, LID can maintain or restore a watershed's hydrologic and
ecological functions. LID has been characterized as a sustainable stormwater practice by the Water Environment Research Foundation and
others.
Low-Income Housing
Tax Credits
The Low Income Housing Tax Credit (LIHTC - often pronounced "lie-tech", Housing Credit) is a dollar-for-dollar tax credit for affordable housing
investments. It was created under the Tax Reform Act of 1986 (TRA86) that gives incentives for the utilization of private equity in the
development of affordable housing aimed at low-income Americans. LIHTC accounts for the majority (approximately 90%) of all affordable
rental housing created in the United States today. As the maximum rent that can be charged is based upon the Area Median Income ("AMI"),
LIHTC housing remains unaffordable to many low-income (<30% AMI) renters. The credits are also commonly called Section 42 credits in
reference to the applicable section of the Internal Revenue Code. The tax credits are more attractive than tax deductions as the credits provide
a dollar-for-dollar reduction in a taxpayer's federal income tax, whereas a tax deduction only provides a reduction in taxable income. The
"passive loss rules" and similar tax changes made by TRA86 greatly reduced the value of tax credits and deductions to individual taxpayers. As a
result, almost all investors in LIHTC projects are corporations
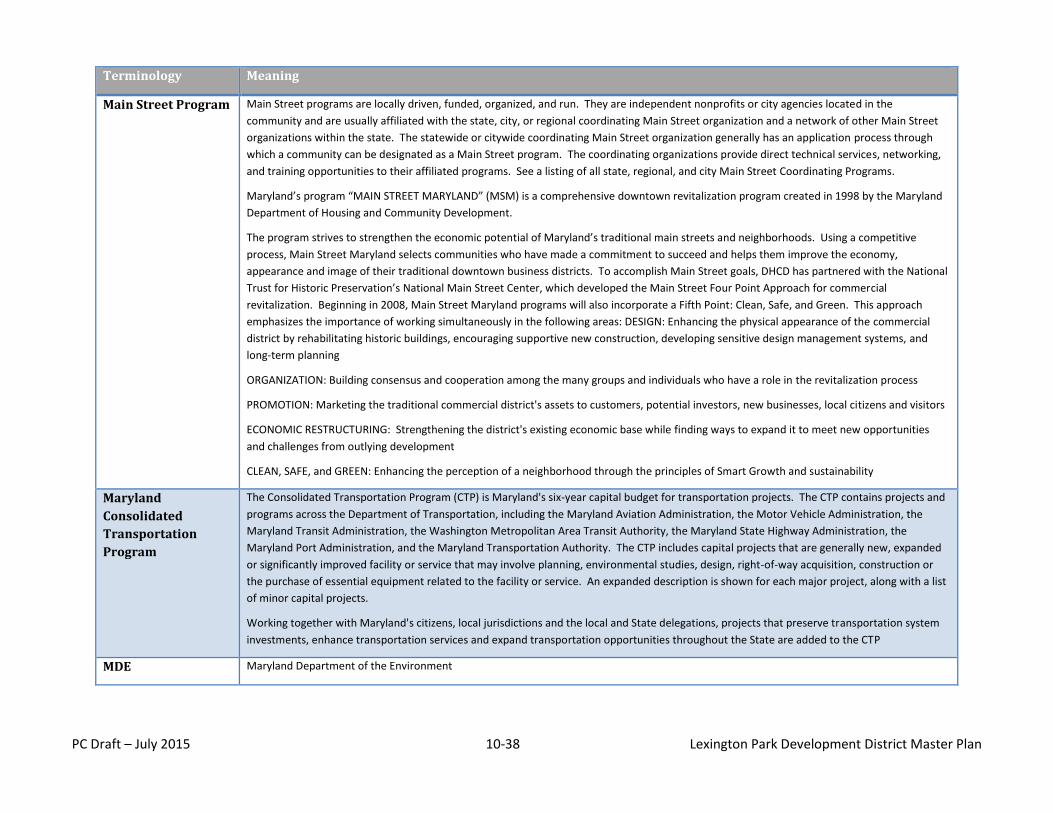
PC Draft – July 2015 10-38 Lexington Park Development District Master Plan
Terminology Meaning
Main Street Program Main Street programs are locally driven, funded, organized, and run. They are independent nonprofits or city agencies located in the
community and are usually affiliated with the state, city, or regional coordinating Main Street organization and a network of other Main Street
organizations within the state. The statewide or citywide coordinating Main Street organization generally has an application process through
which a community can be designated as a Main Street program. The coordinating organizations provide direct technical services, networking,
and training opportunities to their affiliated programs. See a listing of all state, regional, and city Main Street Coordinating Programs.
Maryland’s program “MAIN STREET MARYLAND” (MSM) is a comprehensive downtown revitalization program created in 1998 by the Maryland
Department of Housing and Community Development.
The program strives to strengthen the economic potential of Maryland’s traditional main streets and neighborhoods. Using a competitive
process, Main Street Maryland selects communities who have made a commitment to succeed and helps them improve the economy,
appearance and image of their traditional downtown business districts. To accomplish Main Street goals, DHCD has partnered with the National
Trust for Historic Preservation’s National Main Street Center, which developed the Main Street Four Point Approach for commercial
revitalization. Beginning in 2008, Main Street Maryland programs will also incorporate a Fifth Point: Clean, Safe, and Green. This approach
emphasizes the importance of working simultaneously in the following areas: DESIGN: Enhancing the physical appearance of the commercial
district by rehabilitating historic buildings, encouraging supportive new construction, developing sensitive design management systems, and
long-term planning
ORGANIZATION: Building consensus and cooperation among the many groups and individuals who have a role in the revitalization process
PROMOTION: Marketing the traditional commercial district's assets to customers, potential investors, new businesses, local citizens and visitors
ECONOMIC RESTRUCTURING: Strengthening the district's existing economic base while finding ways to expand it to meet new opportunities
and challenges from outlying development
CLEAN, SAFE, and GREEN: Enhancing the perception of a neighborhood through the principles of Smart Growth and sustainability
Maryland
Consolidated
Transportation
Program
The Consolidated Transportation Program (CTP) is Maryland's six-year capital budget for transportation projects. The CTP contains projects and
programs across the Department of Transportation, including the Maryland Aviation Administration, the Motor Vehicle Administration, the
Maryland Transit Administration, the Washington Metropolitan Area Transit Authority, the Maryland State Highway Administration, the
Maryland Port Administration, and the Maryland Transportation Authority. The CTP includes capital projects that are generally new, expanded
or significantly improved facility or service that may involve planning, environmental studies, design, right-of-way acquisition, construction or
the purchase of essential equipment related to the facility or service. An expanded description is shown for each major project, along with a list
of minor capital projects.
Working together with Maryland's citizens, local jurisdictions and the local and State delegations, projects that preserve transportation system
investments, enhance transportation services and expand transportation opportunities throughout the State are added to the CTP
MDE Maryland Department of the Environment
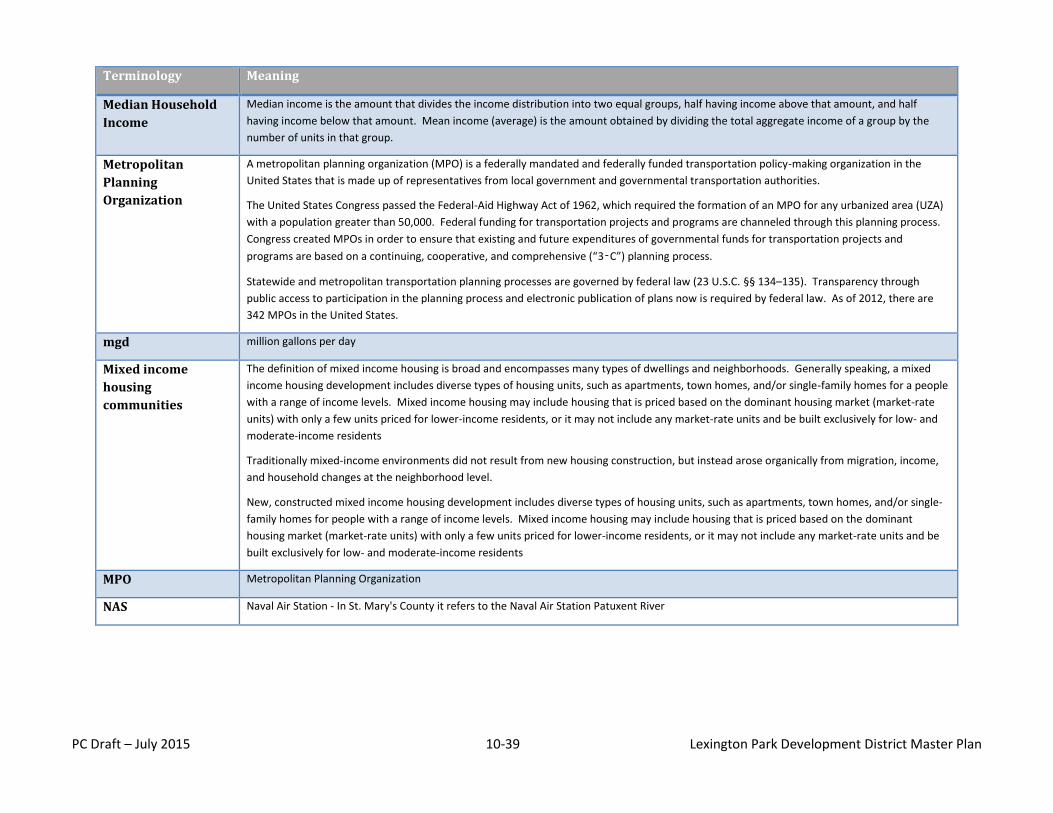
PC Draft – July 2015 10-39 Lexington Park Development District Master Plan
Terminology Meaning
Median Household
Income
Median income is the amount that divides the income distribution into two equal groups, half having income above that amount, and half
having income below that amount. Mean income (average) is the amount obtained by dividing the total aggregate income of a group by the
number of units in that group.
Metropolitan
Planning
Organization
A metropolitan planning organization (MPO) is a federally mandated and federally funded transportation policy-making organization in the
United States that is made up of representatives from local government and governmental transportation authorities.
The United States Congress passed the Federal-Aid Highway Act of 1962, which required the formation of an MPO for any urbanized area (UZA)
with a population greater than 50,000. Federal funding for transportation projects and programs are channeled through this planning process.
Congress created MPOs in order to ensure that existing and future expenditures of governmental funds for transportation projects and
programs are based on a continuing, cooperative, and comprehensive (“3‑C”) planning process.
Statewide and metropolitan transportation planning processes are governed by federal law (23 U.S.C. §§ 134–135). Transparency through
public access to participation in the planning process and electronic publication of plans now is required by federal law. As of 2012, there are
342 MPOs in the United States.
mgd million gallons per day
Mixed income
housing
communities
The definition of mixed income housing is broad and encompasses many types of dwellings and neighborhoods. Generally speaking, a mixed
income housing development includes diverse types of housing units, such as apartments, town homes, and/or single-family homes for a people
with a range of income levels. Mixed income housing may include housing that is priced based on the dominant housing market (market-rate
units) with only a few units priced for lower-income residents, or it may not include any market-rate units and be built exclusively for low- and
moderate-income residents
Traditionally mixed-income environments did not result from new housing construction, but instead arose organically from migration, income,
and household changes at the neighborhood level.
New, constructed mixed income housing development includes diverse types of housing units, such as apartments, town homes, and/or single-
family homes for people with a range of income levels. Mixed income housing may include housing that is priced based on the dominant
housing market (market-rate units) with only a few units priced for lower-income residents, or it may not include any market-rate units and be
built exclusively for low- and moderate-income residents
MPO Metropolitan Planning Organization
NAS Naval Air Station - In St. Mary's County it refers to the Naval Air Station Patuxent River
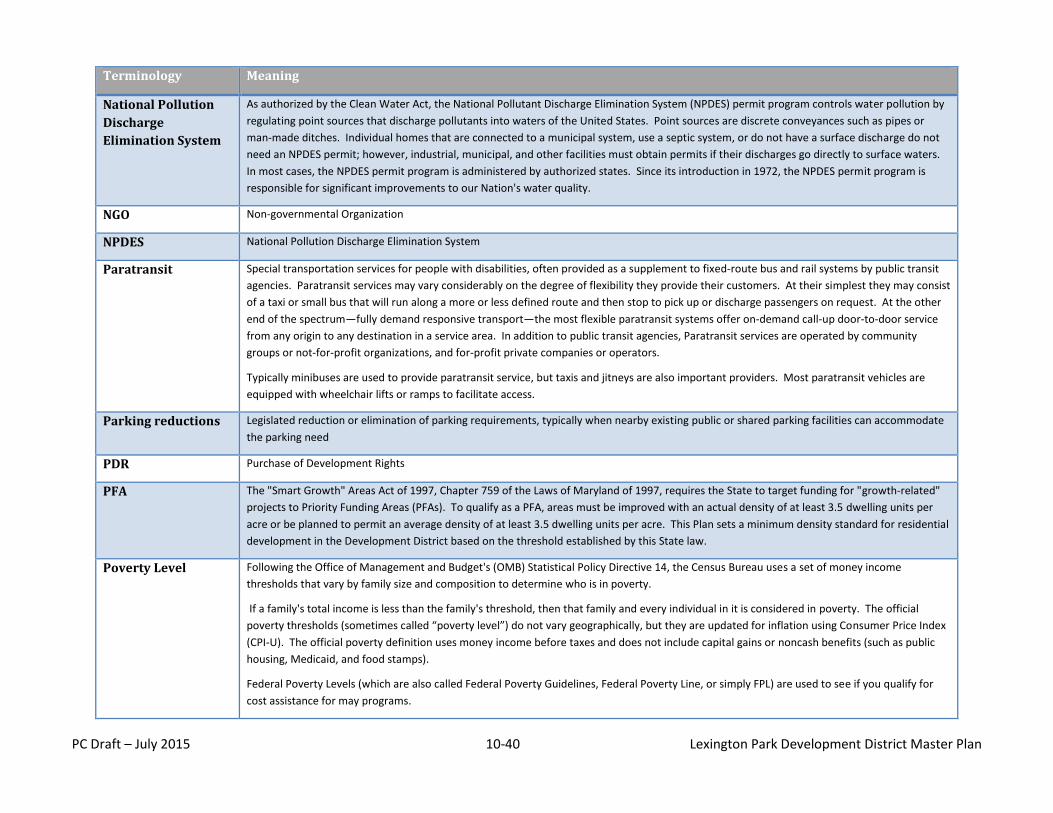
PC Draft – July 2015 10-40 Lexington Park Development District Master Plan
Terminology Meaning
National Pollution
Discharge
Elimination System
As authorized by the Clean Water Act, the National Pollutant Discharge Elimination System (NPDES) permit program controls water pollution by
regulating point sources that discharge pollutants into waters of the United States. Point sources are discrete conveyances such as pipes or
man-made ditches. Individual homes that are connected to a municipal system, use a septic system, or do not have a surface discharge do not
need an NPDES permit; however, industrial, municipal, and other facilities must obtain permits if their discharges go directly to surface waters.
In most cases, the NPDES permit program is administered by authorized states. Since its introduction in 1972, the NPDES permit program is
responsible for significant improvements to our Nation's water quality.
NGO Non-governmental Organization
NPDES National Pollution Discharge Elimination System
Paratransit Special transportation services for people with disabilities, often provided as a supplement to fixed-route bus and rail systems by public transit
agencies. Paratransit services may vary considerably on the degree of flexibility they provide their customers. At their simplest they may consist
of a taxi or small bus that will run along a more or less defined route and then stop to pick up or discharge passengers on request. At the other
end of the spectrum—fully demand responsive transport—the most flexible paratransit systems offer on-demand call-up door-to-door service
from any origin to any destination in a service area. In addition to public transit agencies, Paratransit services are operated by community
groups or not-for-profit organizations, and for-profit private companies or operators.
Typically minibuses are used to provide paratransit service, but taxis and jitneys are also important providers. Most paratransit vehicles are
equipped with wheelchair lifts or ramps to facilitate access.
Parking reductions Legislated reduction or elimination of parking requirements, typically when nearby existing public or shared parking facilities can accommodate
the parking need
PDR Purchase of Development Rights
PFA The "Smart Growth" Areas Act of 1997, Chapter 759 of the Laws of Maryland of 1997, requires the State to target funding for "growth-related"
projects to Priority Funding Areas (PFAs). To qualify as a PFA, areas must be improved with an actual density of at least 3.5 dwelling units per
acre or be planned to permit an average density of at least 3.5 dwelling units per acre. This Plan sets a minimum density standard for residential
development in the Development District based on the threshold established by this State law.
Poverty Level Following the Office of Management and Budget's (OMB) Statistical Policy Directive 14, the Census Bureau uses a set of money income
thresholds that vary by family size and composition to determine who is in poverty.
If a family's total income is less than the family's threshold, then that family and every individual in it is considered in poverty. The official
poverty thresholds (sometimes called “poverty level”) do not vary geographically, but they are updated for inflation using Consumer Price Index
(CPI-U). The official poverty definition uses money income before taxes and does not include capital gains or noncash benefits (such as public
housing, Medicaid, and food stamps).
Federal Poverty Levels (which are also called Federal Poverty Guidelines, Federal Poverty Line, or simply FPL) are used to see if you qualify for
cost assistance for may programs.
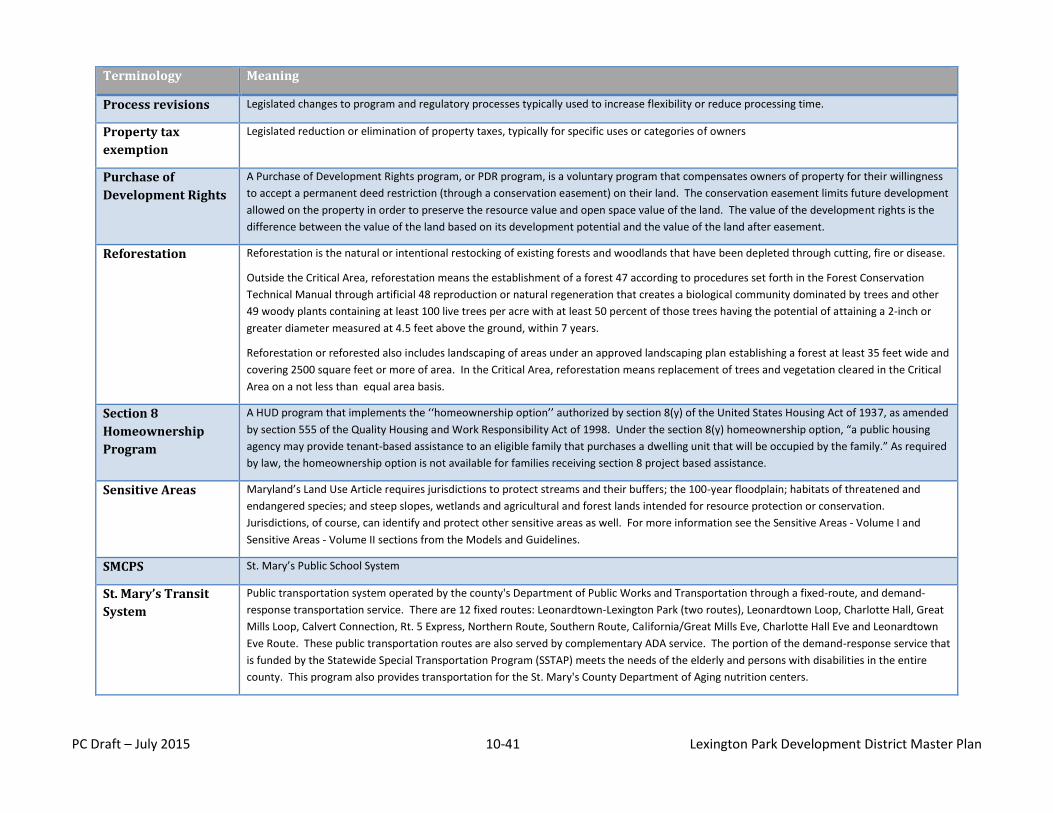
PC Draft – July 2015 10-41 Lexington Park Development District Master Plan
Terminology Meaning
Process revisions Legislated changes to program and regulatory processes typically used to increase flexibility or reduce processing time.
Property tax
exemption
Legislated reduction or elimination of property taxes, typically for specific uses or categories of owners
Purchase of
Development Rights
A Purchase of Development Rights program, or PDR program, is a voluntary program that compensates owners of property for their willingness
to accept a permanent deed restriction (through a conservation easement) on their land. The conservation easement limits future development
allowed on the property in order to preserve the resource value and open space value of the land. The value of the development rights is the
difference between the value of the land based on its development potential and the value of the land after easement.
Reforestation Reforestation is the natural or intentional restocking of existing forests and woodlands that have been depleted through cutting, fire or disease.
Outside the Critical Area, reforestation means the establishment of a forest 47 according to procedures set forth in the Forest Conservation
Technical Manual through artificial 48 reproduction or natural regeneration that creates a biological community dominated by trees and other
49 woody plants containing at least 100 live trees per acre with at least 50 percent of those trees having the potential of attaining a 2-inch or
greater diameter measured at 4.5 feet above the ground, within 7 years.
Reforestation or reforested also includes landscaping of areas under an approved landscaping plan establishing a forest at least 35 feet wide and
covering 2500 square feet or more of area. In the Critical Area, reforestation means replacement of trees and vegetation cleared in the Critical
Area on a not less than equal area basis.
Section 8
Homeownership
Program
A HUD program that implements the ‘‘homeownership option’’ authorized by section 8(y) of the United States Housing Act of 1937, as amended
by section 555 of the Quality Housing and Work Responsibility Act of 1998. Under the section 8(y) homeownership option, “a public housing
agency may provide tenant-based assistance to an eligible family that purchases a dwelling unit that will be occupied by the family.” As required
by law, the homeownership option is not available for families receiving section 8 project based assistance.
Sensitive Areas Maryland’s Land Use Article requires jurisdictions to protect streams and their buffers; the 100-year floodplain; habitats of threatened and
endangered species; and steep slopes, wetlands and agricultural and forest lands intended for resource protection or conservation.
Jurisdictions, of course, can identify and protect other sensitive areas as well. For more information see the Sensitive Areas - Volume I and
Sensitive Areas - Volume II sections from the Models and Guidelines.
SMCPS St. Mary’s Public School System
St. Mary’s Transit
System
Public transportation system operated by the county's Department of Public Works and Transportation through a fixed-route, and demand-
response transportation service. There are 12 fixed routes: Leonardtown-Lexington Park (two routes), Leonardtown Loop, Charlotte Hall, Great
Mills Loop, Calvert Connection, Rt. 5 Express, Northern Route, Southern Route, California/Great Mills Eve, Charlotte Hall Eve and Leonardtown
Eve Route. These public transportation routes are also served by complementary ADA service. The portion of the demand-response service that
is funded by the Statewide Special Transportation Program (SSTAP) meets the needs of the elderly and persons with disabilities in the entire
county. This program also provides transportation for the St. Mary's County Department of Aging nutrition centers.
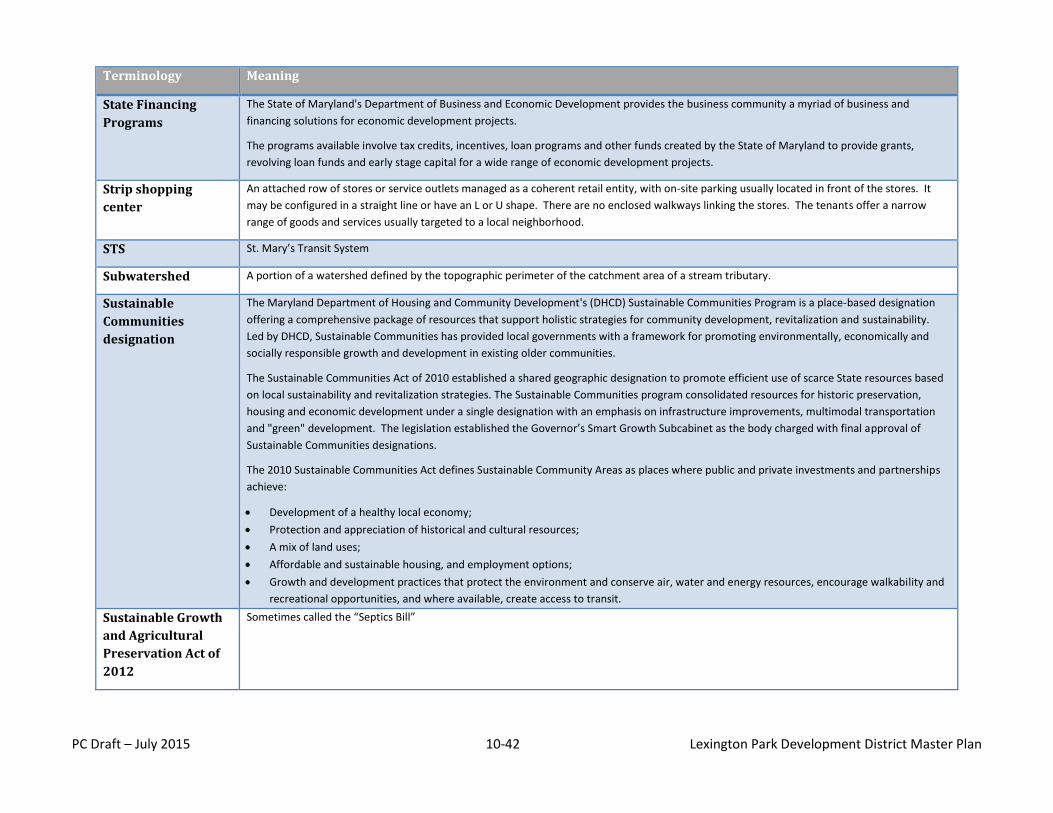
PC Draft – July 2015 10-42 Lexington Park Development District Master Plan
Terminology Meaning
State Financing
Programs
The State of Maryland's Department of Business and Economic Development provides the business community a myriad of business and
financing solutions for economic development projects.
The programs available involve tax credits, incentives, loan programs and other funds created by the State of Maryland to provide grants,
revolving loan funds and early stage capital for a wide range of economic development projects.
Strip shopping
center
An attached row of stores or service outlets managed as a coherent retail entity, with on-site parking usually located in front of the stores. It
may be configured in a straight line or have an L or U shape. There are no enclosed walkways linking the stores. The tenants offer a narrow
range of goods and services usually targeted to a local neighborhood.
STS St. Mary’s Transit System
Subwatershed A portion of a watershed defined by the topographic perimeter of the catchment area of a stream tributary.
Sustainable
Communities
designation
The Maryland Department of Housing and Community Development's (DHCD) Sustainable Communities Program is a place-based designation
offering a comprehensive package of resources that support holistic strategies for community development, revitalization and sustainability.
Led by DHCD, Sustainable Communities has provided local governments with a framework for promoting environmentally, economically and
socially responsible growth and development in existing older communities.
The Sustainable Communities Act of 2010 established a shared geographic designation to promote efficient use of scarce State resources based
on local sustainability and revitalization strategies. The Sustainable Communities program consolidated resources for historic preservation,
housing and economic development under a single designation with an emphasis on infrastructure improvements, multimodal transportation
and "green" development. The legislation established the Governor’s Smart Growth Subcabinet as the body charged with final approval of
Sustainable Communities designations.
The 2010 Sustainable Communities Act defines Sustainable Community Areas as places where public and private investments and partnerships
achieve:
Development of a healthy local economy;
Protection and appreciation of historical and cultural resources;
A mix of land uses;
Affordable and sustainable housing, and employment options;
Growth and development practices that protect the environment and conserve air, water and energy resources, encourage walkability and
recreational opportunities, and where available, create access to transit.
Sustainable Growth
and Agricultural
Preservation Act of
2012
Sometimes called the “Septics Bill”
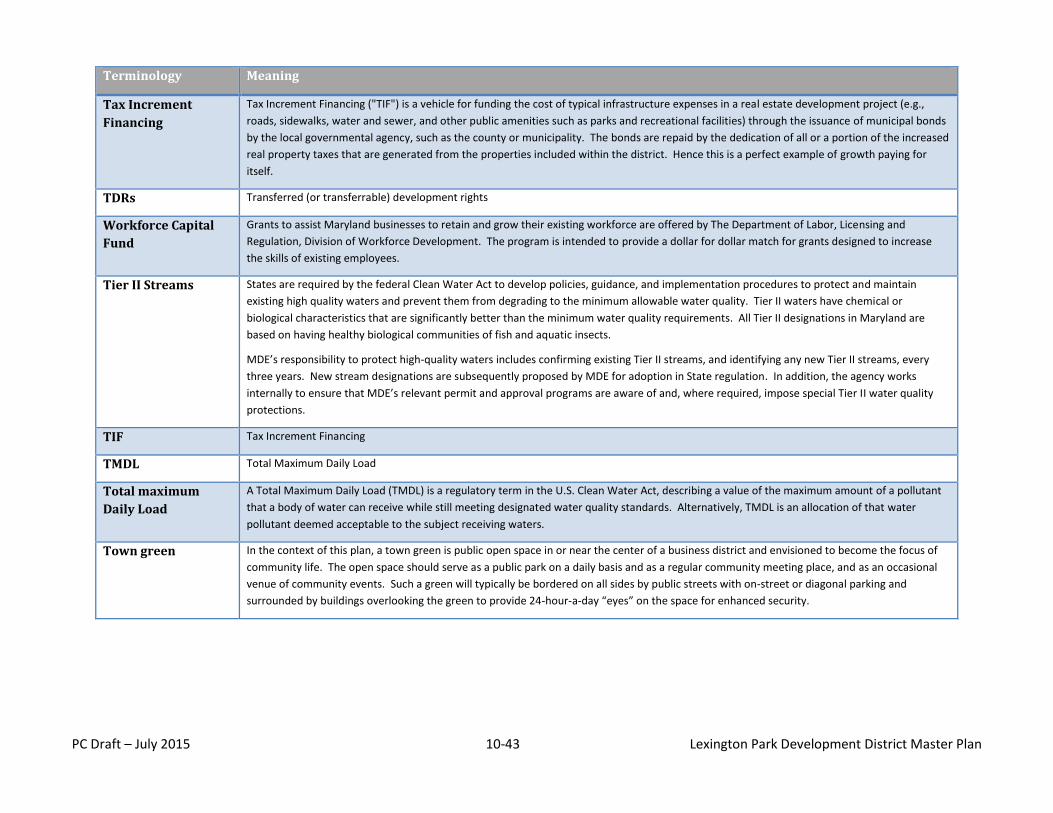
PC Draft – July 2015 10-43 Lexington Park Development District Master Plan
Terminology Meaning
Tax Increment
Financing
Tax Increment Financing ("TIF") is a vehicle for funding the cost of typical infrastructure expenses in a real estate development project (e.g.,
roads, sidewalks, water and sewer, and other public amenities such as parks and recreational facilities) through the issuance of municipal bonds
by the local governmental agency, such as the county or municipality. The bonds are repaid by the dedication of all or a portion of the increased
real property taxes that are generated from the properties included within the district. Hence this is a perfect example of growth paying for
itself.
TDRs Transferred (or transferrable) development rights
Workforce Capital
Fund
Grants to assist Maryland businesses to retain and grow their existing workforce are offered by The Department of Labor, Licensing and
Regulation, Division of Workforce Development. The program is intended to provide a dollar for dollar match for grants designed to increase
the skills of existing employees.
Tier II Streams States are required by the federal Clean Water Act to develop policies, guidance, and implementation procedures to protect and maintain
existing high quality waters and prevent them from degrading to the minimum allowable water quality. Tier II waters have chemical or
biological characteristics that are significantly better than the minimum water quality requirements. All Tier II designations in Maryland are
based on having healthy biological communities of fish and aquatic insects.
MDE’s responsibility to protect high-quality waters includes confirming existing Tier II streams, and identifying any new Tier II streams, every
three years. New stream designations are subsequently proposed by MDE for adoption in State regulation. In addition, the agency works
internally to ensure that MDE’s relevant permit and approval programs are aware of and, where required, impose special Tier II water quality
protections.
TIF Tax Increment Financing
TMDL Total Maximum Daily Load
Total maximum
Daily Load
A Total Maximum Daily Load (TMDL) is a regulatory term in the U.S. Clean Water Act, describing a value of the maximum amount of a pollutant
that a body of water can receive while still meeting designated water quality standards. Alternatively, TMDL is an allocation of that water
pollutant deemed acceptable to the subject receiving waters.
Town green In the context of this plan, a town green is public open space in or near the center of a business district and envisioned to become the focus of
community life. The open space should serve as a public park on a daily basis and as a regular community meeting place, and as an occasional
venue of community events. Such a green will typically be bordered on all sides by public streets with on-street or diagonal parking and
surrounded by buildings overlooking the green to provide 24-hour-a-day “eyes” on the space for enhanced security.
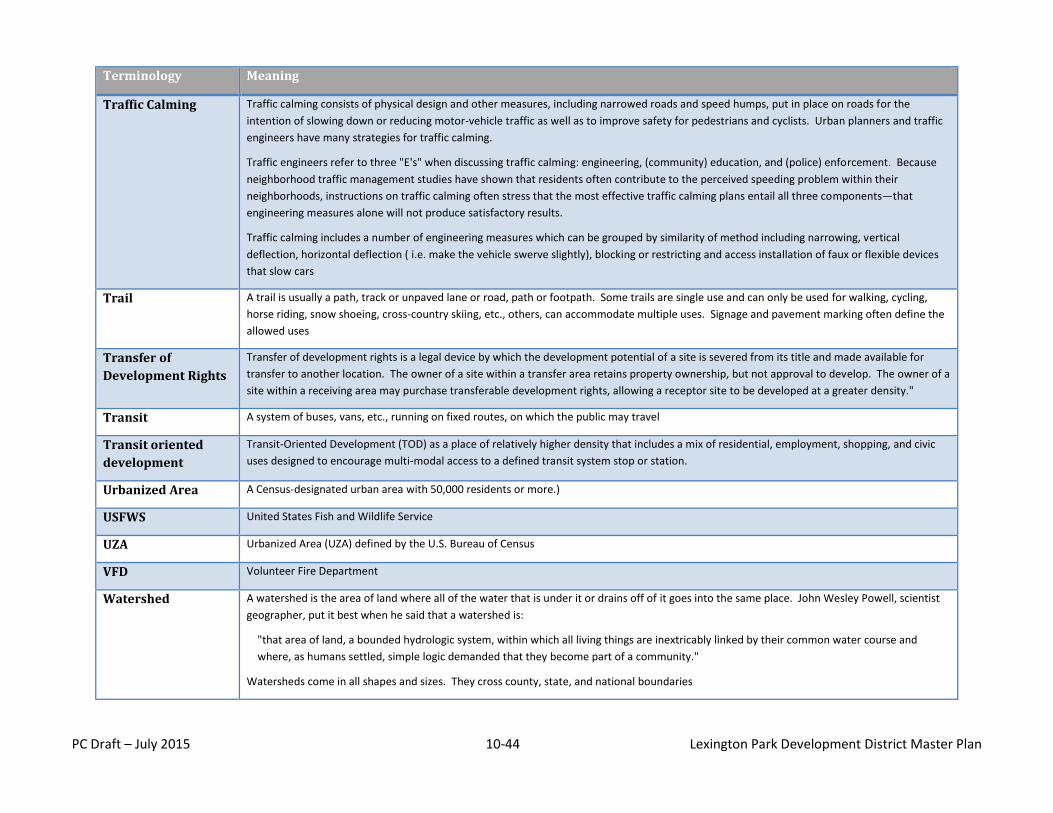
PC Draft – July 2015 10-44 Lexington Park Development District Master Plan
Terminology Meaning
Traffic Calming Traffic calming consists of physical design and other measures, including narrowed roads and speed humps, put in place on roads for the
intention of slowing down or reducing motor-vehicle traffic as well as to improve safety for pedestrians and cyclists. Urban planners and traffic
engineers have many strategies for traffic calming.
Traffic engineers refer to three "E's" when discussing traffic calming: engineering, (community) education, and (police) enforcement. Because
neighborhood traffic management studies have shown that residents often contribute to the perceived speeding problem within their
neighborhoods, instructions on traffic calming often stress that the most effective traffic calming plans entail all three components—that
engineering measures alone will not produce satisfactory results.
Traffic calming includes a number of engineering measures which can be grouped by similarity of method including narrowing, vertical
deflection, horizontal deflection ( i.e. make the vehicle swerve slightly), blocking or restricting and access installation of faux or flexible devices
that slow cars
Trail A trail is usually a path, track or unpaved lane or road, path or footpath. Some trails are single use and can only be used for walking, cycling,
horse riding, snow shoeing, cross-country skiing, etc., others, can accommodate multiple uses. Signage and pavement marking often define the
allowed uses
Transfer of
Development Rights
Transfer of development rights is a legal device by which the development potential of a site is severed from its title and made available for
transfer to another location. The owner of a site within a transfer area retains property ownership, but not approval to develop. The owner of a
site within a receiving area may purchase transferable development rights, allowing a receptor site to be developed at a greater density."
Transit A system of buses, vans, etc., running on fixed routes, on which the public may travel
Transit oriented
development
Transit-Oriented Development (TOD) as a place of relatively higher density that includes a mix of residential, employment, shopping, and civic
uses designed to encourage multi-modal access to a defined transit system stop or station.
Urbanized Area A Census-designated urban area with 50,000 residents or more.)
USFWS United States Fish and Wildlife Service
UZA Urbanized Area (UZA) defined by the U.S. Bureau of Census
VFD Volunteer Fire Department
Watershed A watershed is the area of land where all of the water that is under it or drains off of it goes into the same place. John Wesley Powell, scientist
geographer, put it best when he said that a watershed is:
"that area of land, a bounded hydrologic system, within which all living things are inextricably linked by their common water course and
where, as humans settled, simple logic demanded that they become part of a community."
Watersheds come in all shapes and sizes. They cross county, state, and national boundaries
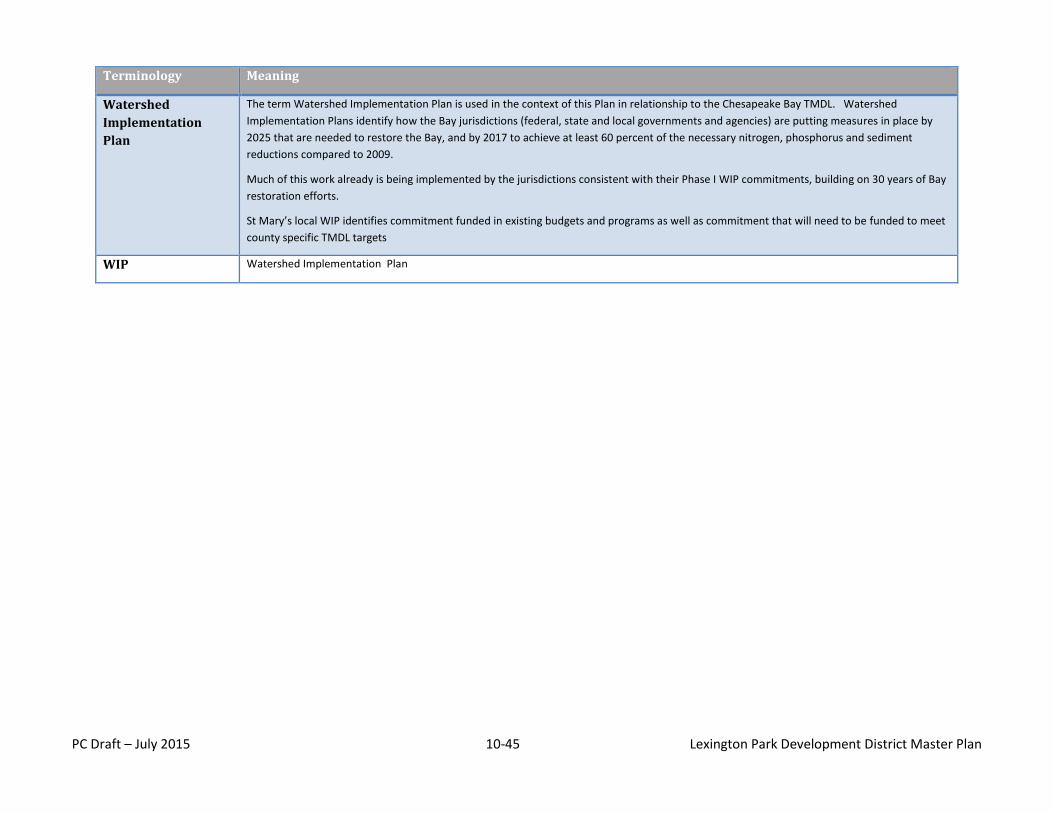
PC Draft – July 2015 10-45 Lexington Park Development District Master Plan
Terminology Meaning
Watershed
Implementation
Plan
The term Watershed Implementation Plan is used in the context of this Plan in relationship to the Chesapeake Bay TMDL. Watershed
Implementation Plans identify how the Bay jurisdictions (federal, state and local governments and agencies) are putting measures in place by
2025 that are needed to restore the Bay, and by 2017 to achieve at least 60 percent of the necessary nitrogen, phosphorus and sediment
reductions compared to 2009.
Much of this work already is being implemented by the jurisdictions consistent with their Phase I WIP commitments, building on 30 years of Bay
restoration efforts.
St Mary’s local WIP identifies commitment funded in existing budgets and programs as well as commitment that will need to be funded to meet
county specific TMDL targets
WIP Watershed Implementation Plan
PC Draft – July 2015 10-46 Lexington Park Development District Master Plan
PC Draft – July 2015 11-1 Lexington Park Development District Master Plan
11. Maps
Environmental Context Maps
Figure EC- 1: Characteristics of soils ..............................................11-2 Figure EC- 2: Steep Slopes .............................................................11-3 Figure EC- 3: Topography ..............................................................11-4 Figure EC- 4: Watershed boundaries .............................................11-5 Figure EC- 5: Surface water and wetland resources ......................11-6 Figure EC- 6: Floodplains, floodways, and drainageway protection buffers ...........................................................................................11-7 Figure EC- 7: 2010 Forest cover and Green Infrastructure ...........11-8 Figure EC- 8: Resource management areas, overlays and easements11-9 Figure EC- 9: Soils with mining potential .................................... 11-10 Figure EC- 10: Prime soils for forest and agriculture .................. 11-11
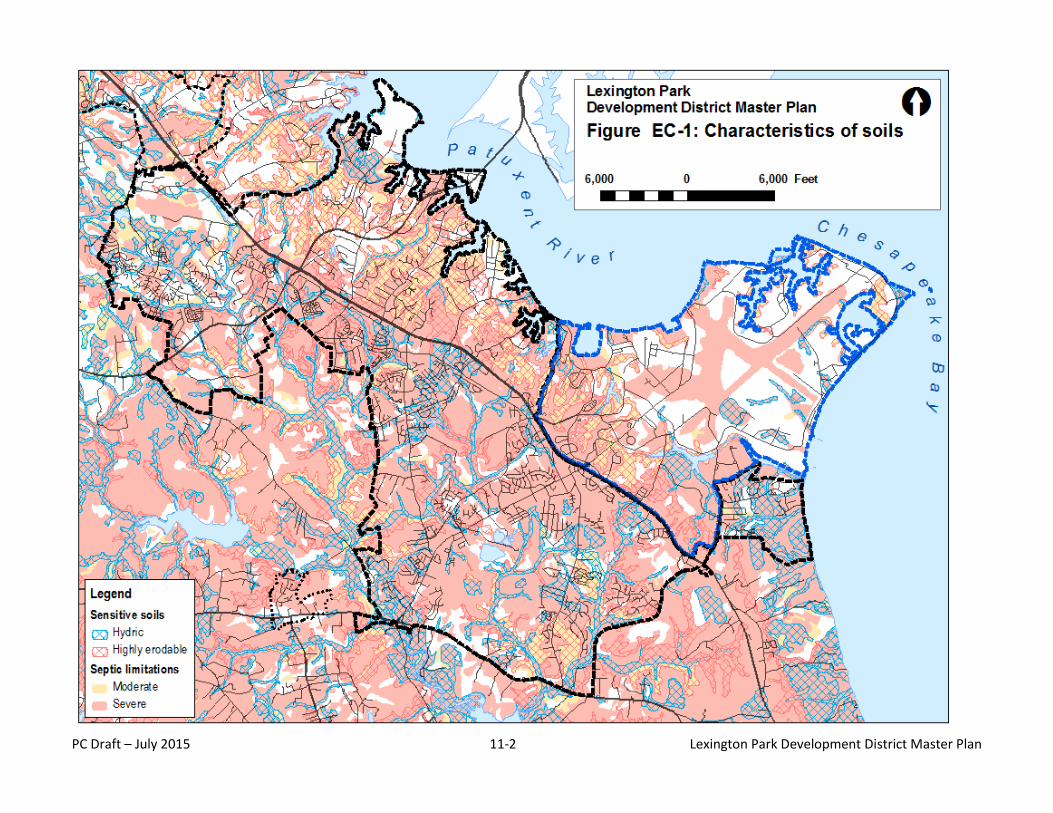
PC Draft – July 2015 11-2 Lexington Park Development District Master Plan
Figure EC- 1: Characteristics of soils
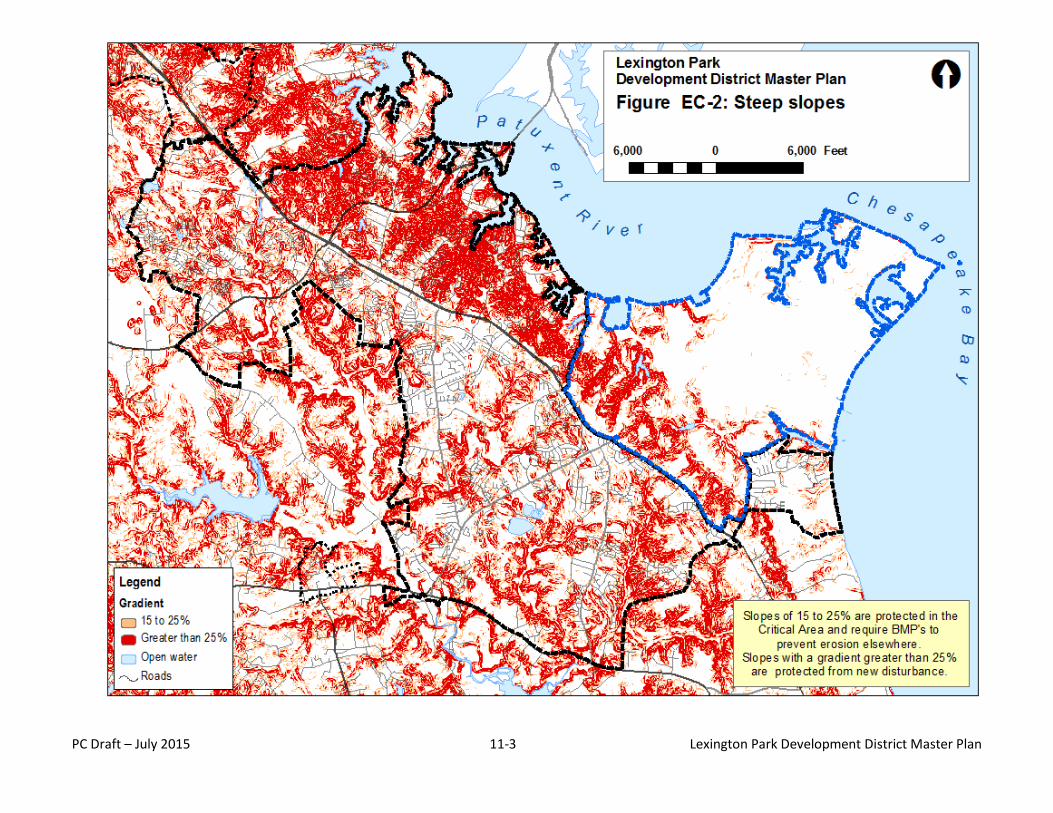
PC Draft – July 2015 11-3 Lexington Park Development District Master Plan
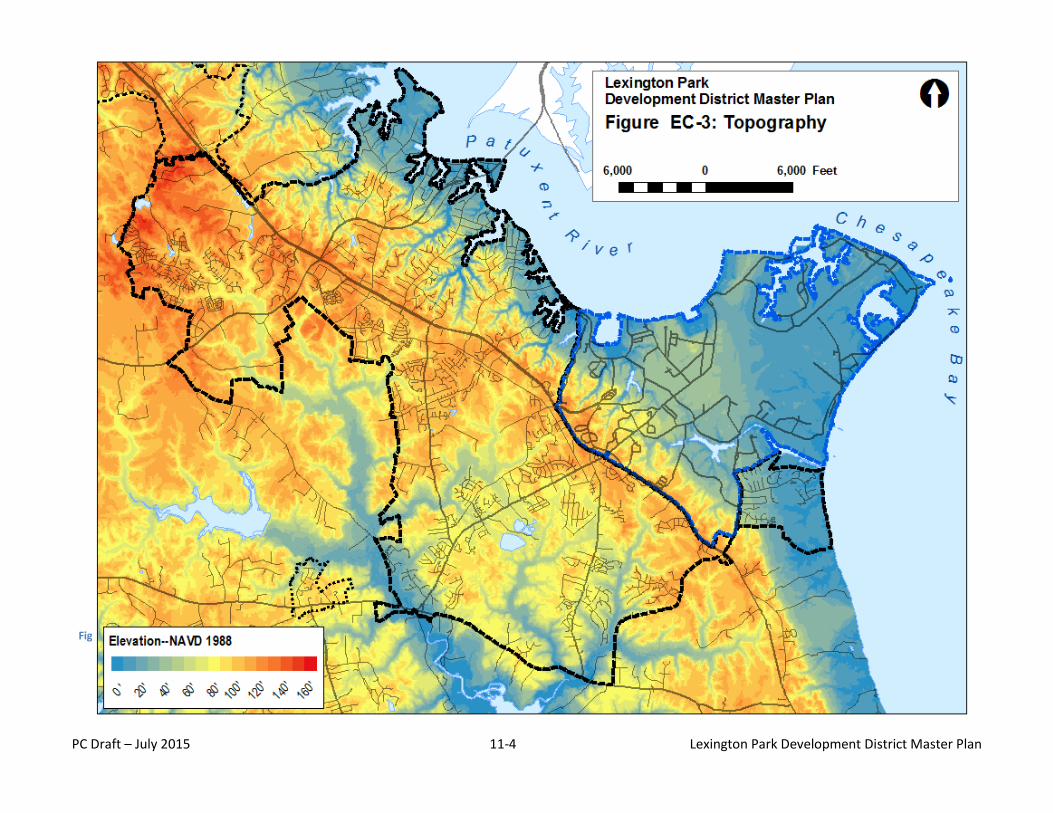
PC Draft – July 2015 11-4 Lexington Park Development District Master Plan
Figure EC- 3: Topography
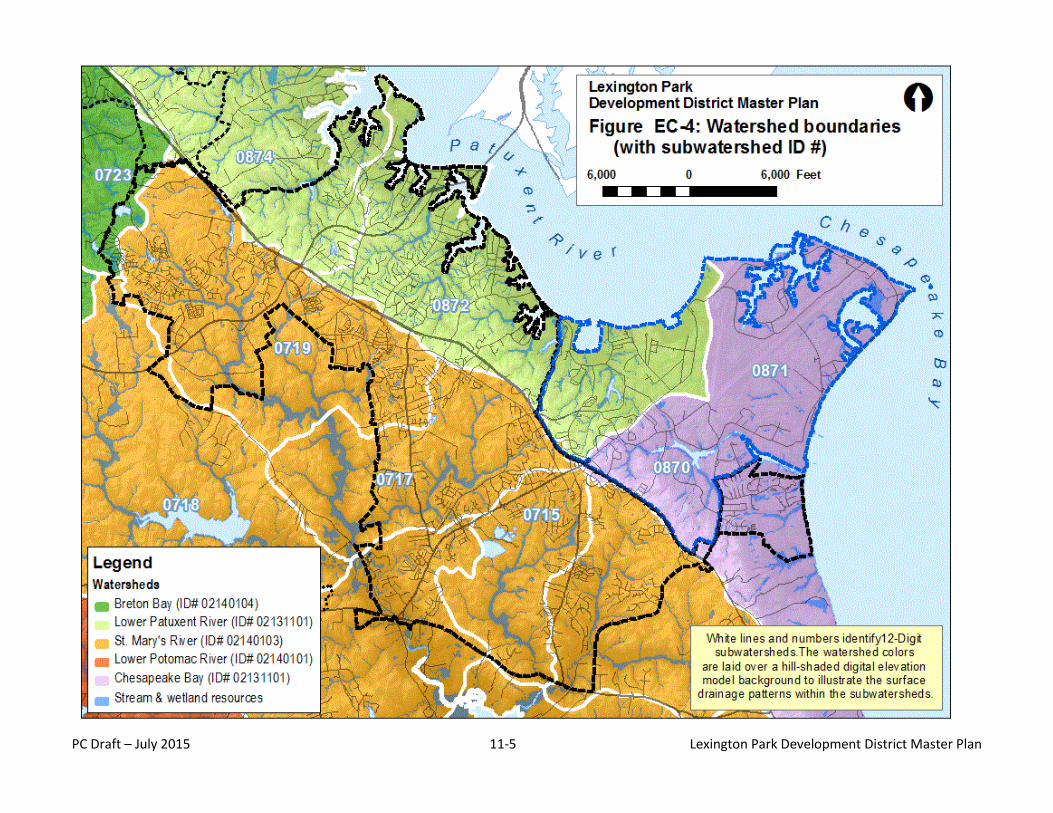
PC Draft – July 2015 11-5 Lexington Park Development District Master Plan
Figure EC- 4: Watershed boundaries
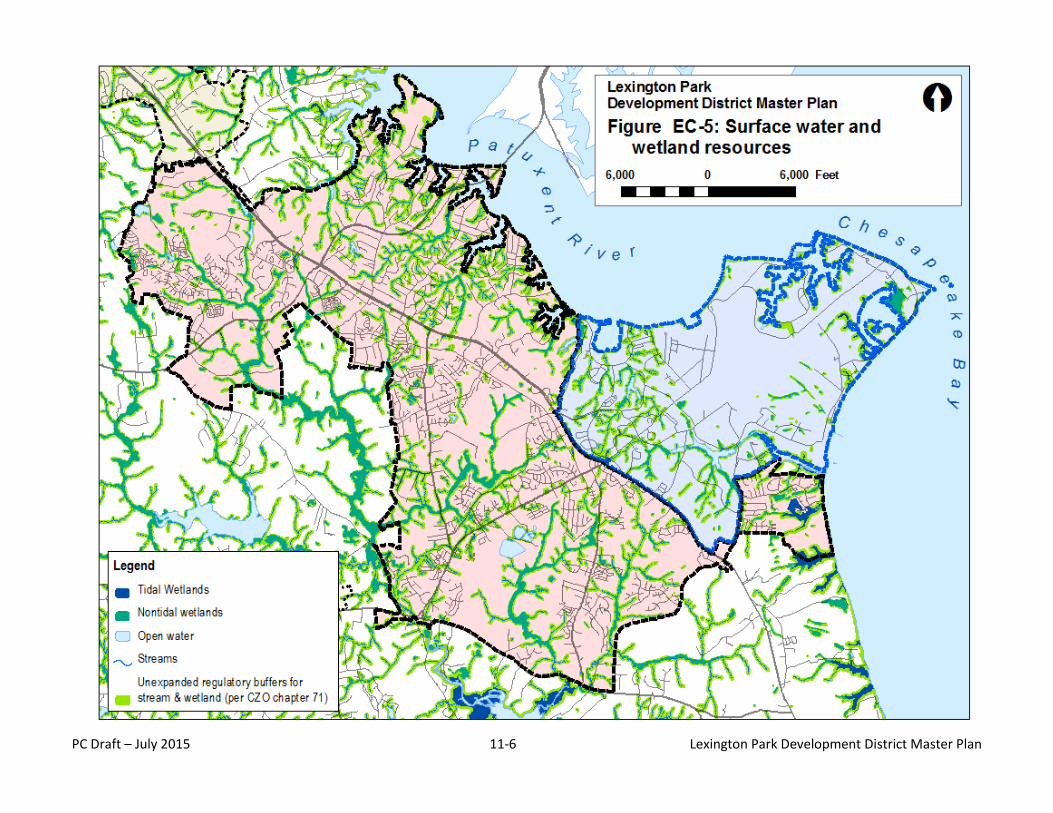
PC Draft – July 2015 11-6 Lexington Park Development District Master Plan
Figure EC- 5: Surface water and wetland resources
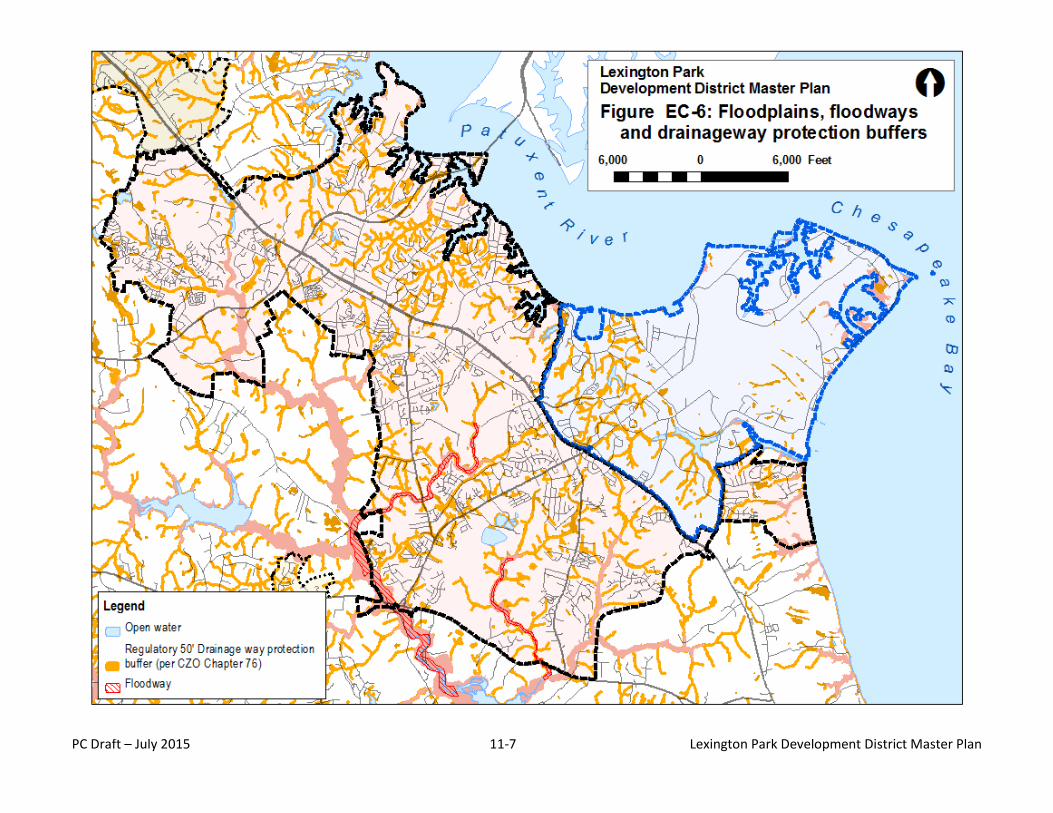
PC Draft – July 2015 11-7 Lexington Park Development District Master Plan
Figure EC- 6: Floodplains, floodways, and drainageway protection buffers
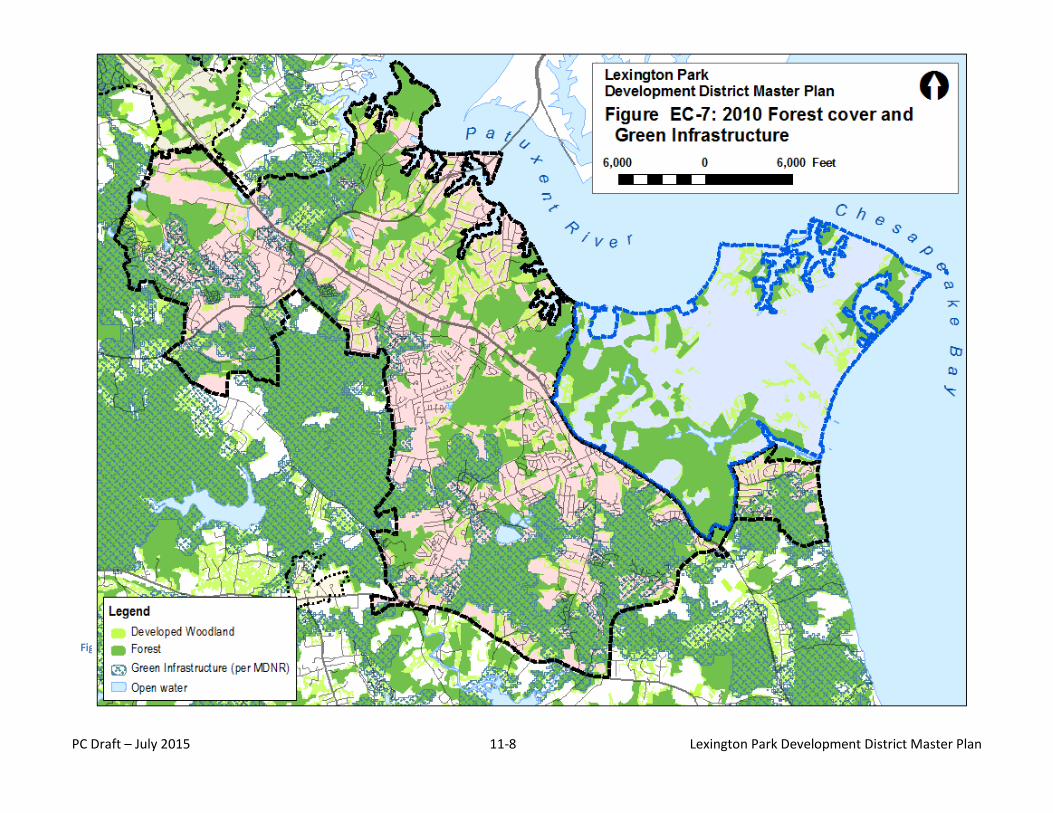
PC Draft – July 2015 11-8 Lexington Park Development District Master Plan
Figure EC- 7: 2010 Forest cover and Green Infrastructure
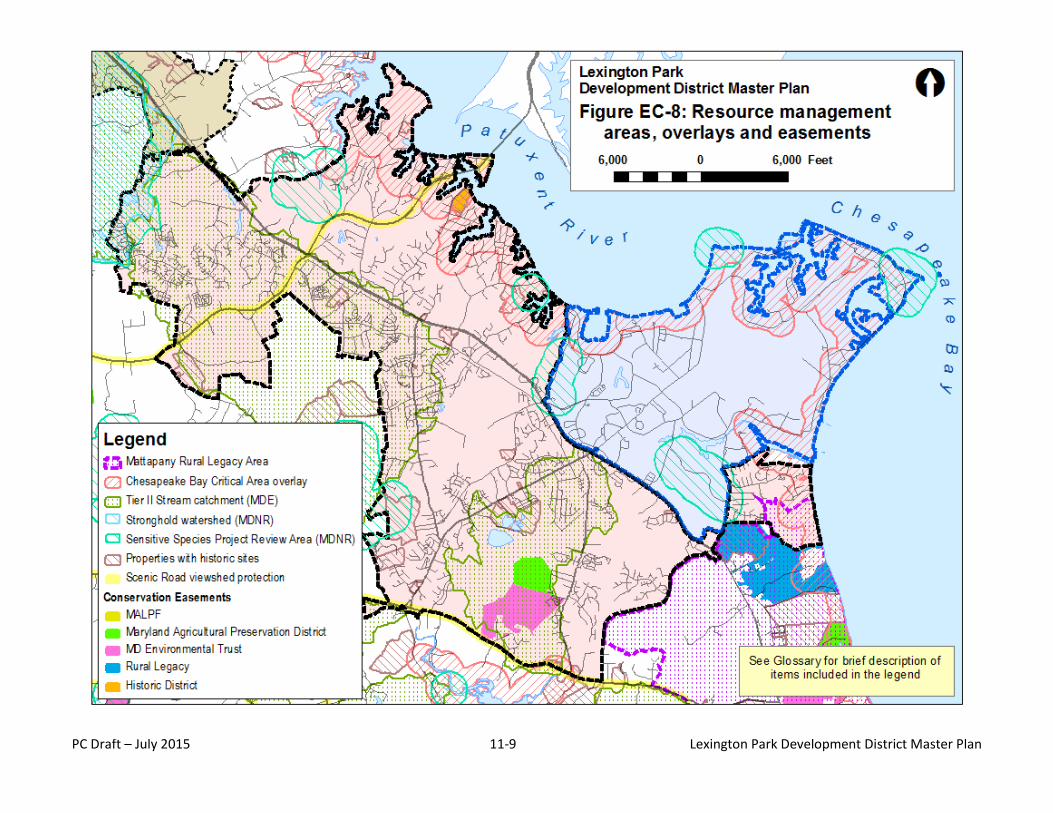
PC Draft – July 2015 11-9 Lexington Park Development District Master Plan
Map EC-8 PENDING
Figure EC- 8: Resource management areas, overlays and easements
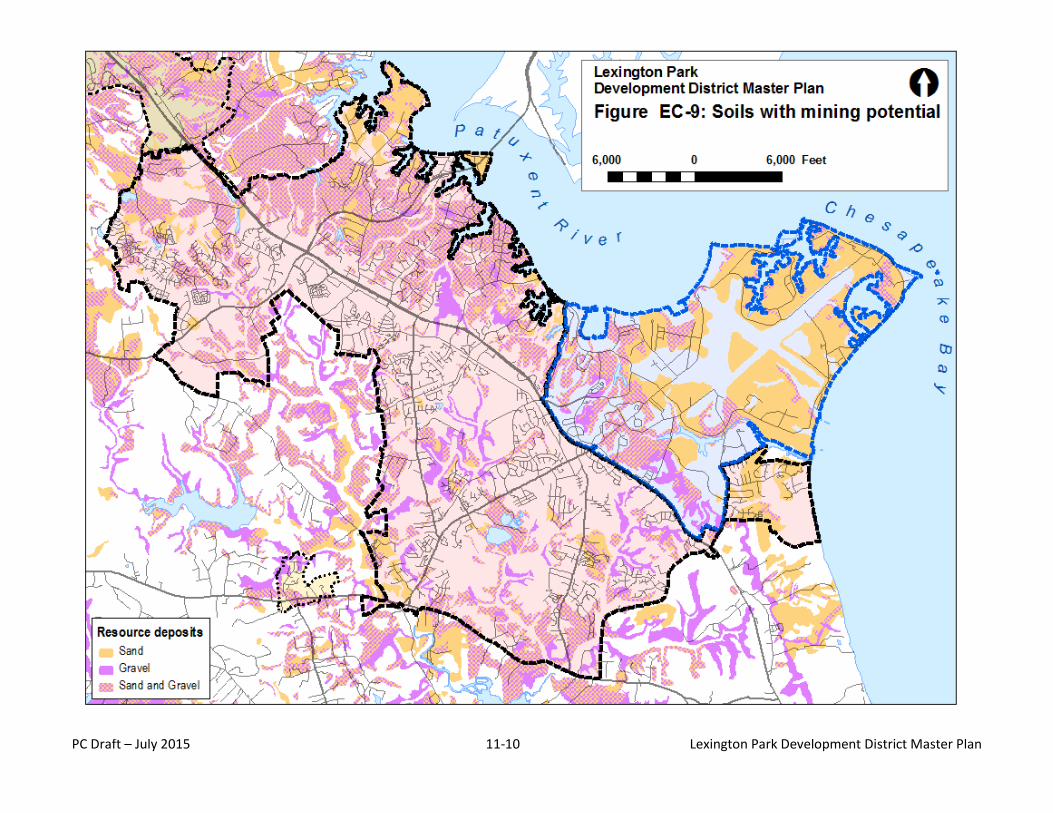
PC Draft – July 2015 11-10 Lexington Park Development District Master Plan
Figure EC- 9: Soils with mining potential
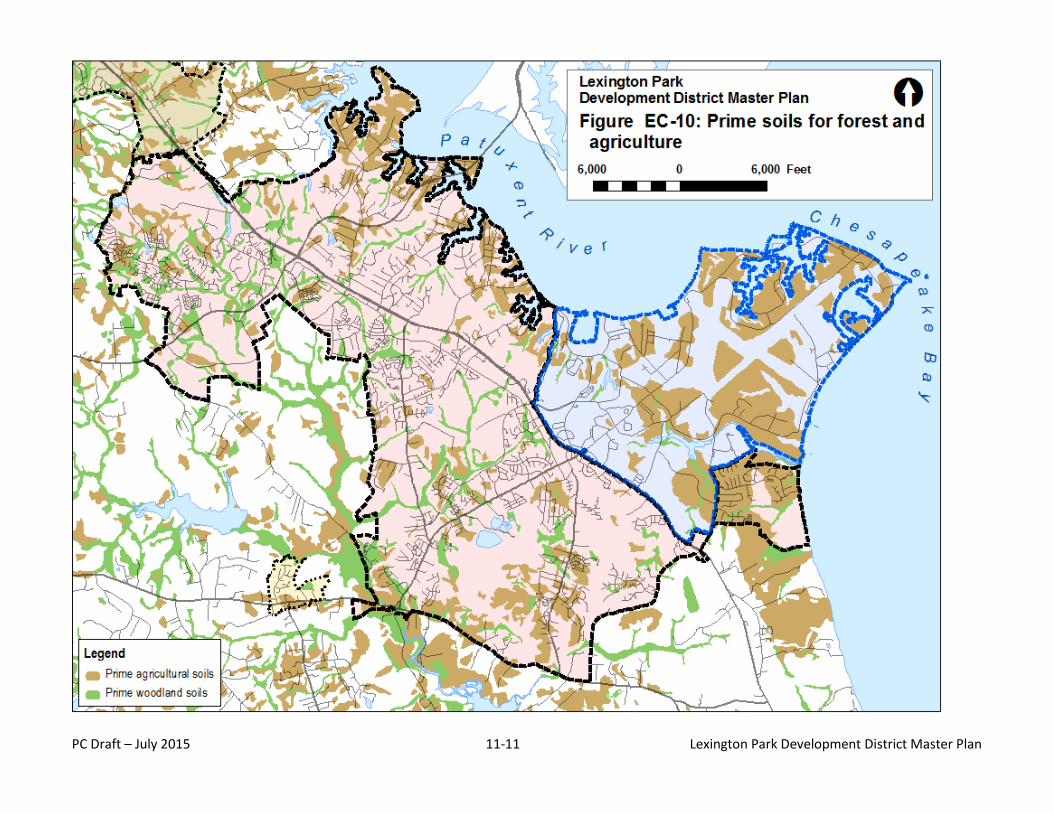
PC Draft – July 2015 11-11 Lexington Park Development District Master Plan
Figure EC- 10: Prime soils for forest and agriculture
PC Draft – July 2015 11-12 Lexington Park Development District Master Plan
This page is intentionally blank.
PC Draft – July 2015 11-13 Lexington Park Development District Master Plan
Development Context Maps
Figure DC- 1: 2011 Land Use/ Land Cover (For descriptions of Land Use/Land Cover, see Table DC-1 that follows this figure) ............................................................................. 11-14
Figure DC- 2: 2011 Existing Development .................................. 11-16 Figure DC- 3: Existing Development ........................................... 11-16 Figure DC- 4: Road Improvement Plan ....................................... 11-18 Figure DC- 5: Pedestrian network............................................... 11-19 Figure DC- 6: Bike and greenway network ................................. 11-20 Figure DC- 7: Transit Routes and areas within 5 minute walking distance
............................................................................. 11-21 Figure DC- 8: Public Facilities ..................................................... 11-22
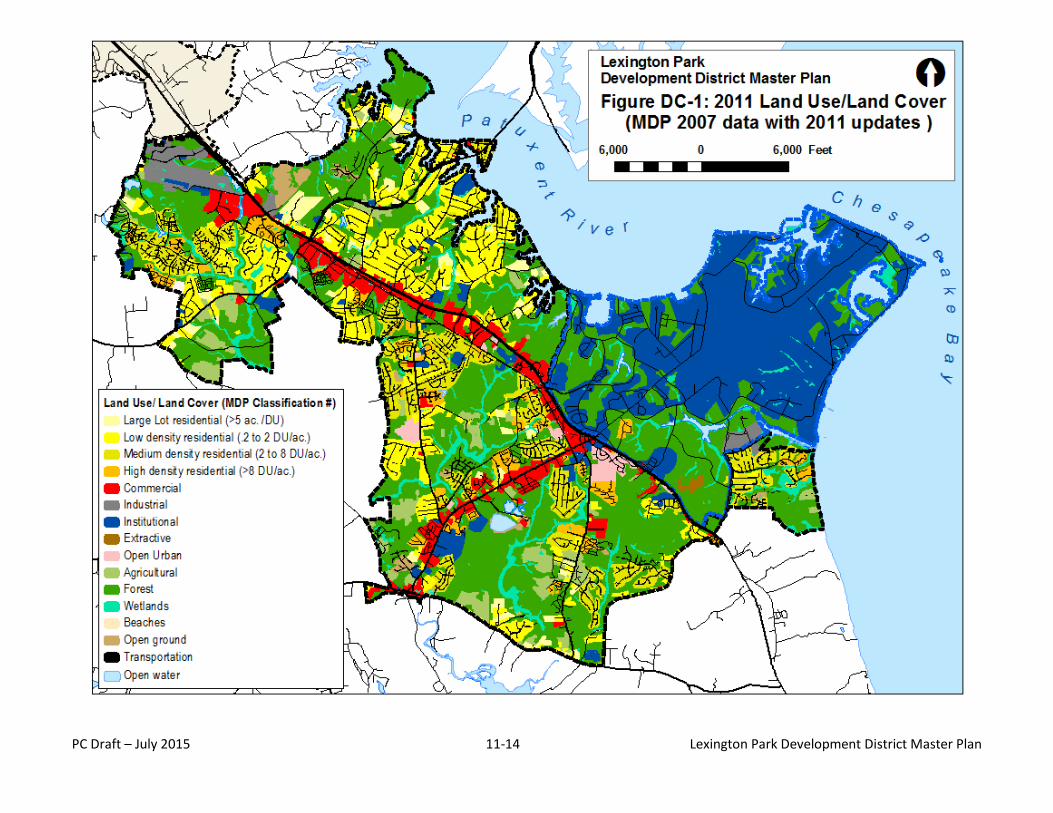
PC Draft – July 2015 11-14 Lexington Park Development District Master Plan
Figure DC- 1: 2011 Land Use/ Land Cover (For descriptions of Land Use/Land Cover, see Table DC-1 that follows this figure)
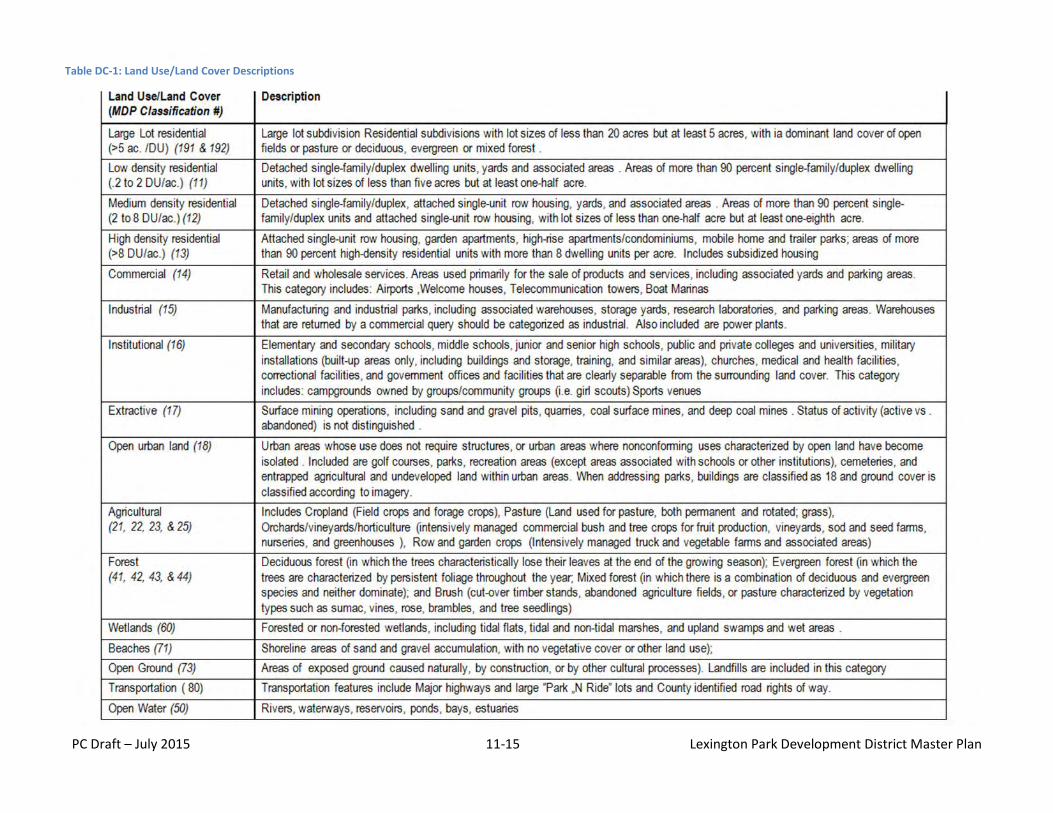
PC Draft – July 2015 11-15 Lexington Park Development District Master Plan
Table DC-1: Land Use/Land Cover Descriptions
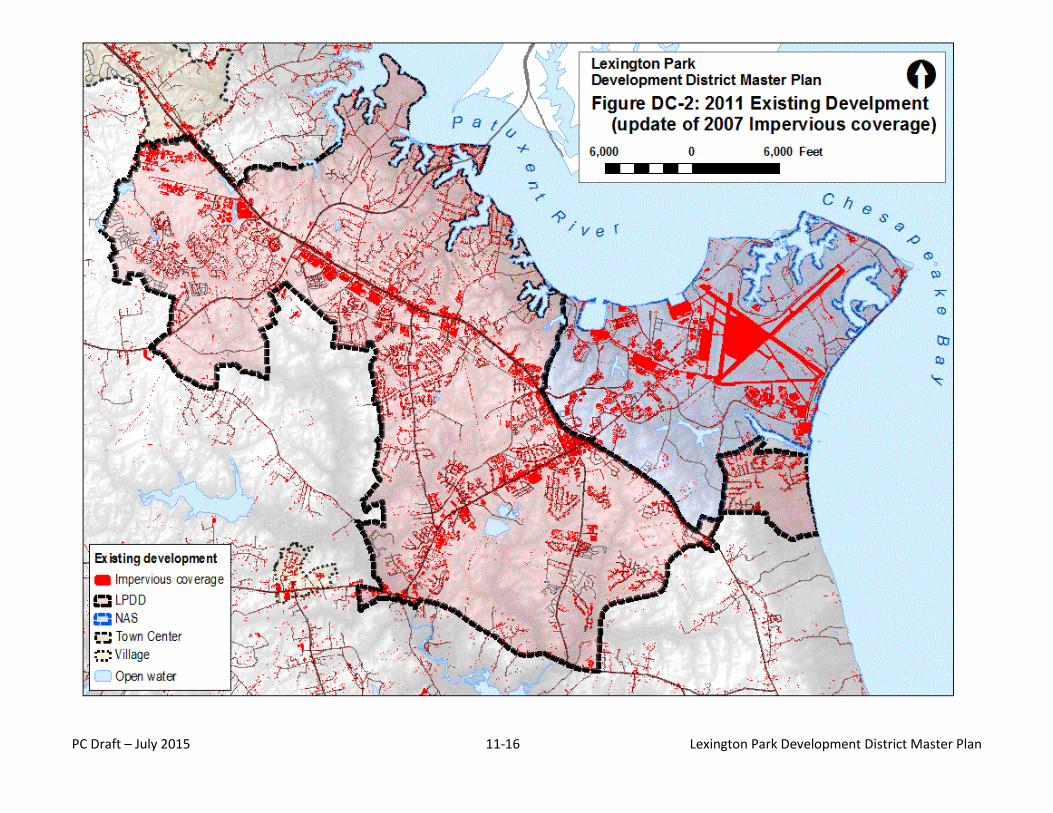
PC Draft – July 2015 11-16 Lexington Park Development District Master Plan
DC-2: Existing Development
Figure DC- 3: Existing Development Figure DC- 2: 2011 Existing Development
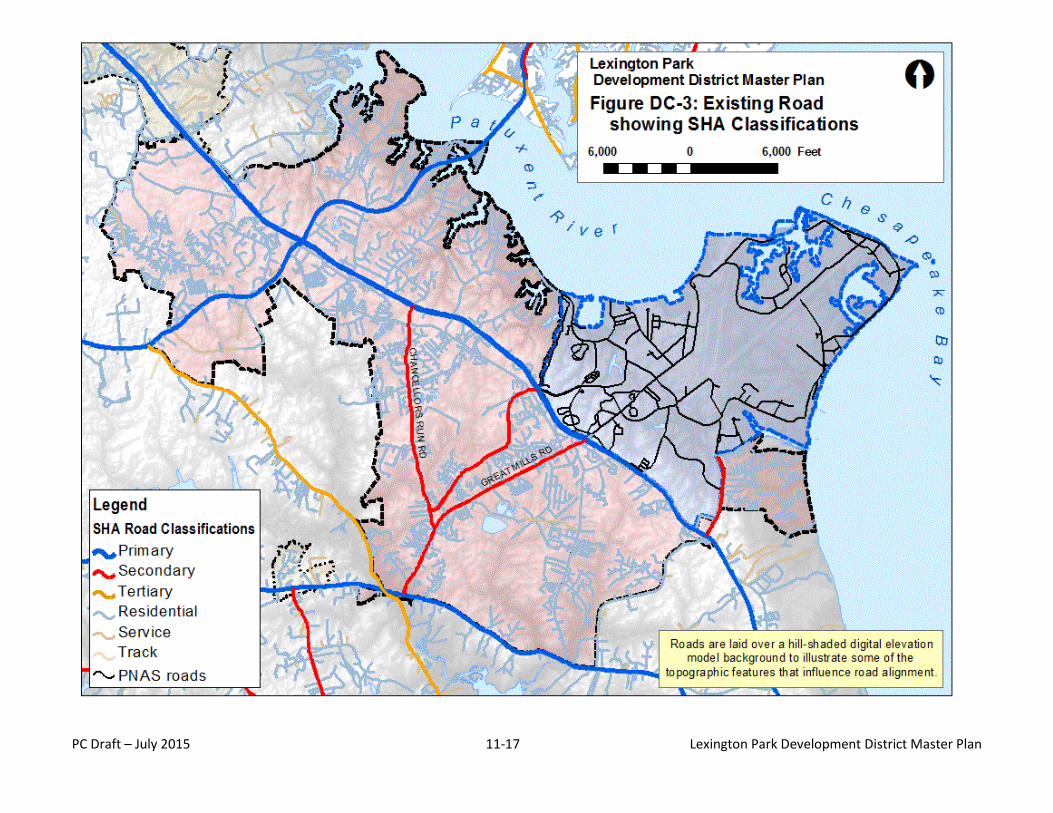
PC Draft – July 2015 11-17 Lexington Park Development District Master Plan
Figure DC- 3: Existing Roads showing State Highway Administration Classifications
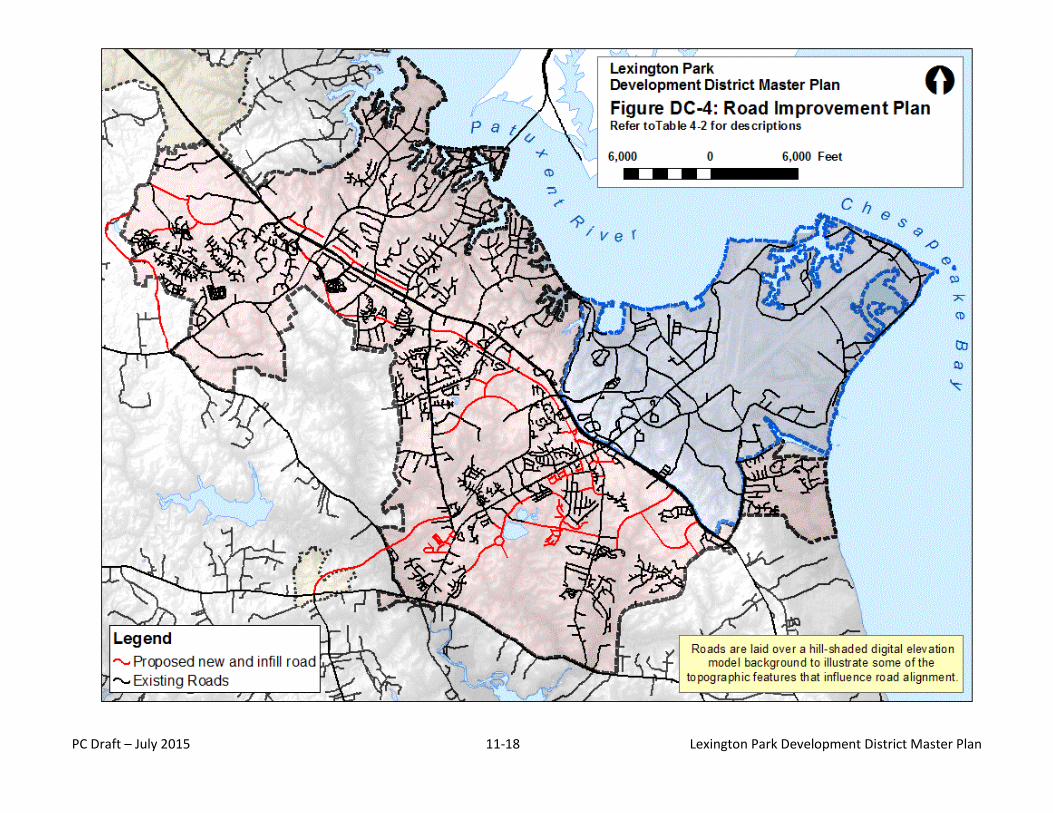
PC Draft – July 2015 11-18 Lexington Park Development District Master Plan
Figure DC- 4: Road Improvement Plan
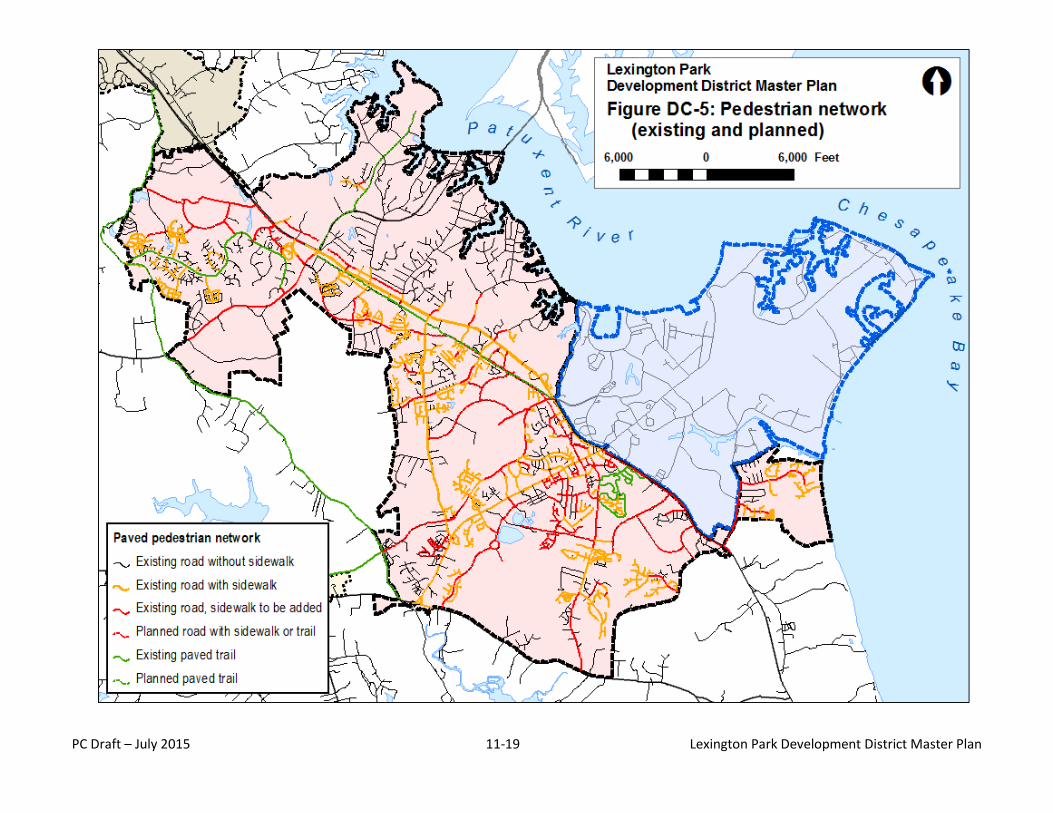
PC Draft – July 2015 11-19 Lexington Park Development District Master Plan
Figure DC- 5: Pedestrian network
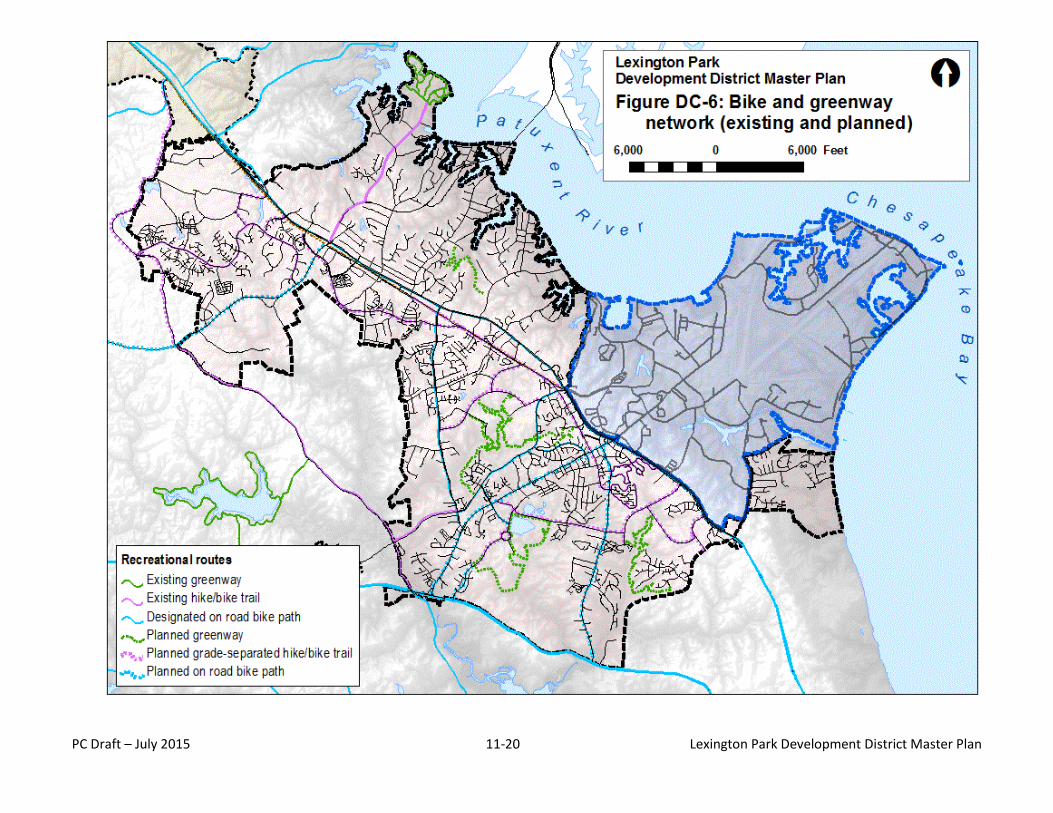
PC Draft – July 2015 11-20 Lexington Park Development District Master Plan
Figure DC- 6: Bike and greenway network
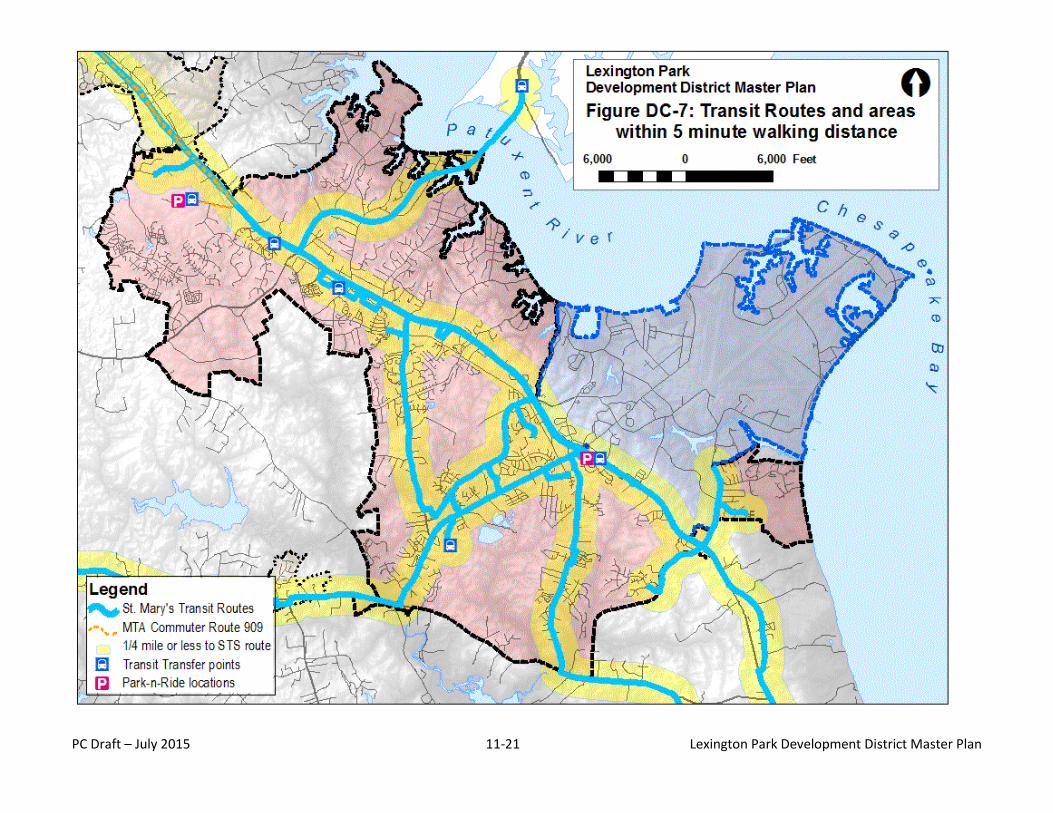
PC Draft – July 2015 11-21 Lexington Park Development District Master Plan
Figure DC- 7: Transit Routes and areas within 5 minute walking distance
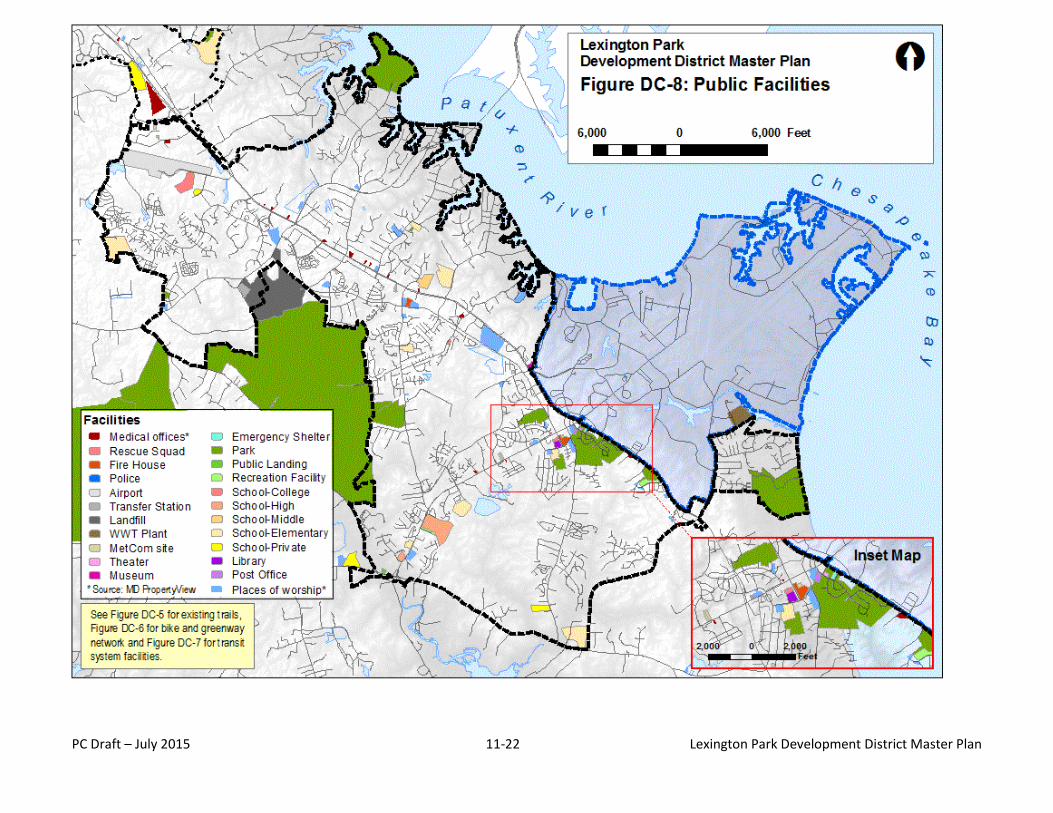
PC Draft – July 2015 11-22 Lexington Park Development District Master Plan
Figure DC- 8: Public Facilities
PC Draft – July 2015 11-23 Lexington Park Development District Master Plan
Planning Context
Figure PC- 1: Concept Land Use (as adopted April 6, 2010) ....... 11-24 Figure PC- 2: 2015 Concept Land Uses ....................................... 11-25
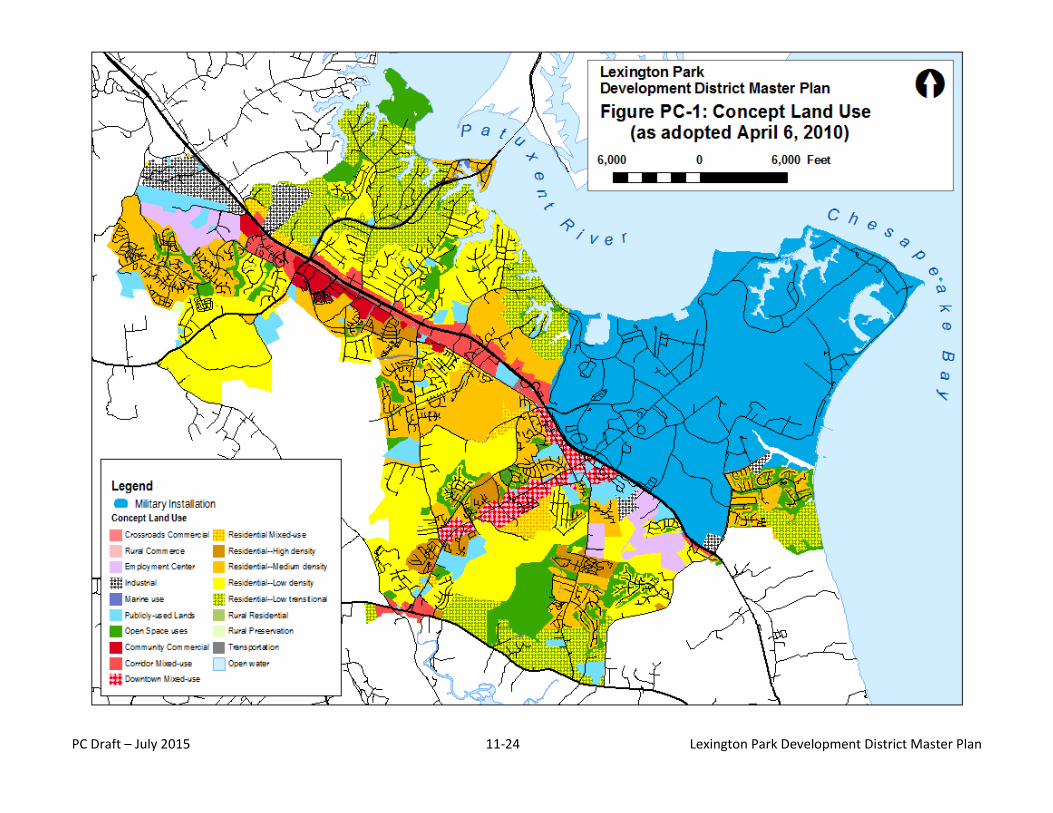
PC Draft – July 2015 11-24 Lexington Park Development District Master Plan
Figure PC- 1: Concept Land Use (as adopted April 6, 2010)
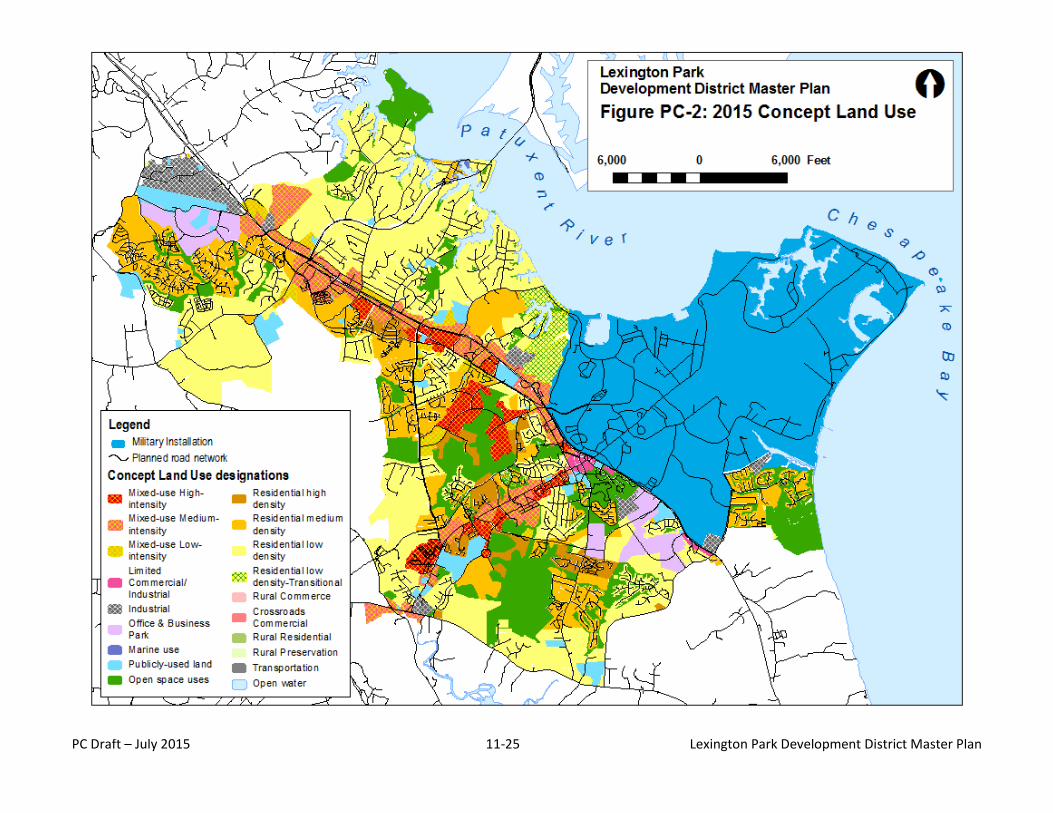
PC Draft – July 2015 11-25 Lexington Park Development District Master Plan
Figure PC- 2: 2015 Concept Land Uses
PC Draft – July 2015 11-26 Lexington Park Development District Master Plan
This page is intentionally blank.
PC Draft – July 2015 11-27 Lexington Park Development District Master Plan
Implementation maps
Figure I- 1: Existing LPDD Zoning ................................................ 11-28 Figure I- 2: Proposed LPDD Zoning ............................................. 11-28 Figure I- 3: 2014 Sewer Service Areas ........................................ 11-28 Figure I- 4: Planned Sewer Service Areas ................................... 11-28 Figure I- 5: 2014 Water Service Areas ........................................ 11-28 Figure I- 6: Planned Water Service Areas ................................... 11-28
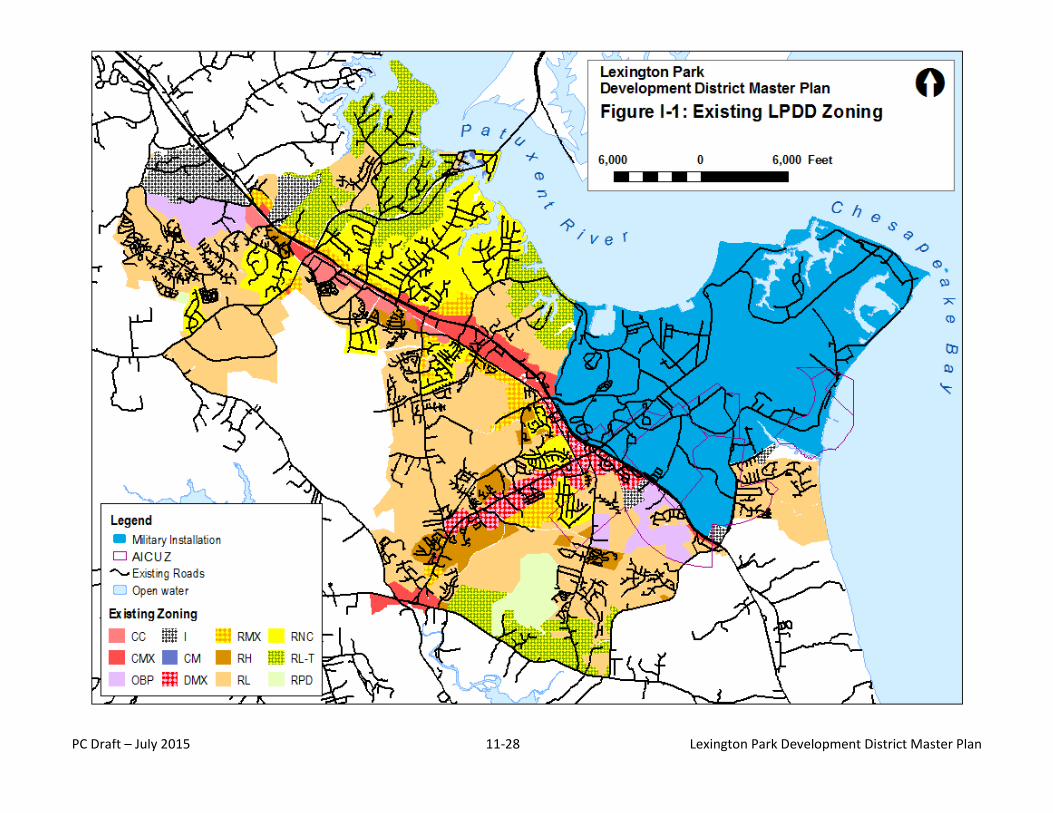
PC Draft – July 2015 11-28 Lexington Park Development District Master Plan
Figure I- 1: Existing LPDD Zoning
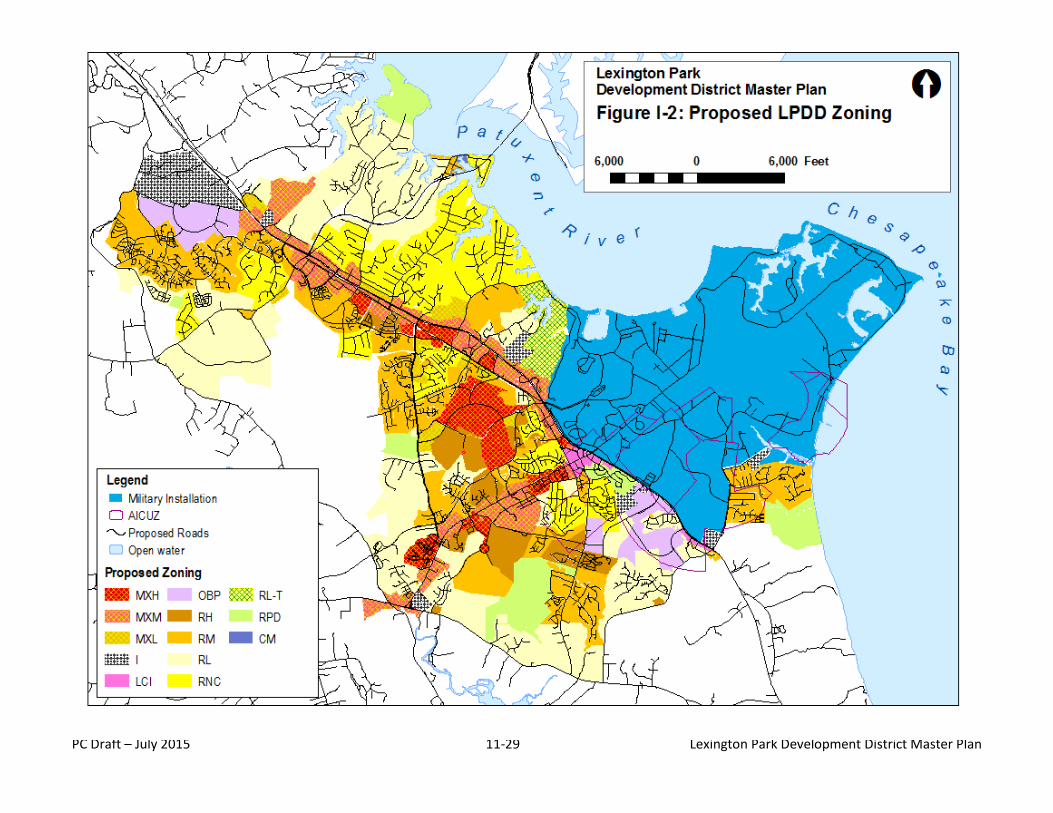
PC Draft – July 2015 11-29 Lexington Park Development District Master Plan
Figure I- 2: Proposed LPDD Zoning
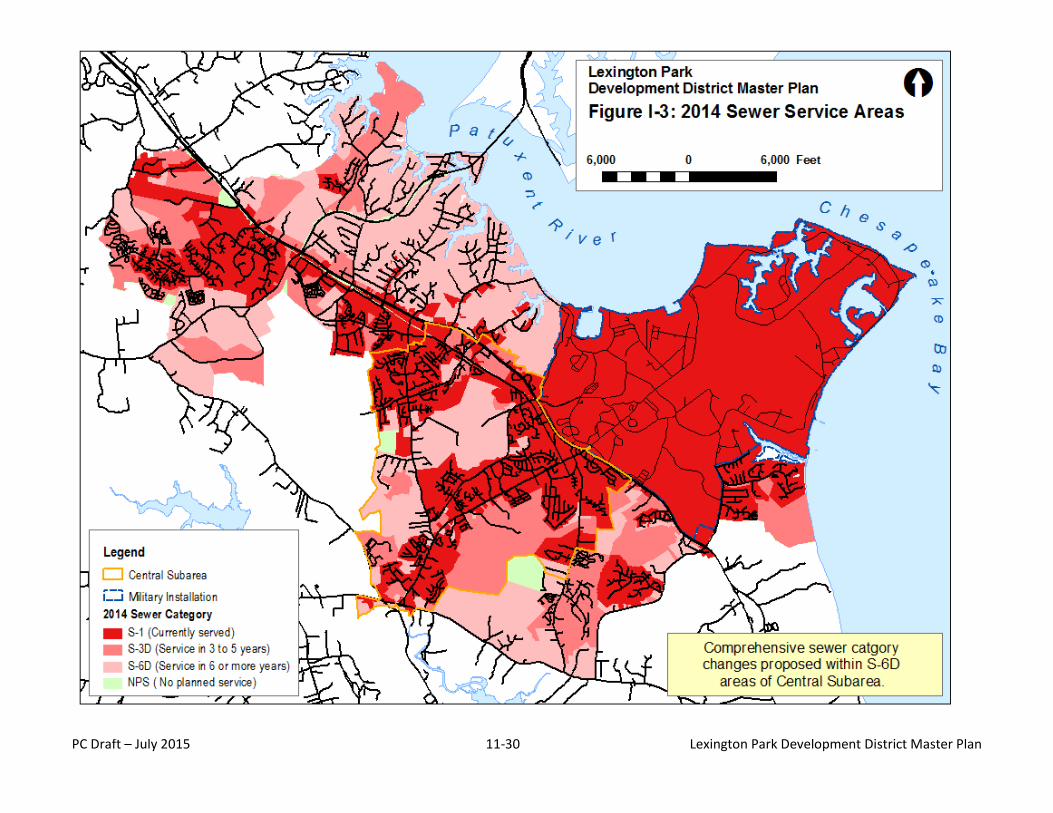
PC Draft – July 2015 11-30 Lexington Park Development District Master Plan
Figure I- 3: 2014 Sewer Service Areas
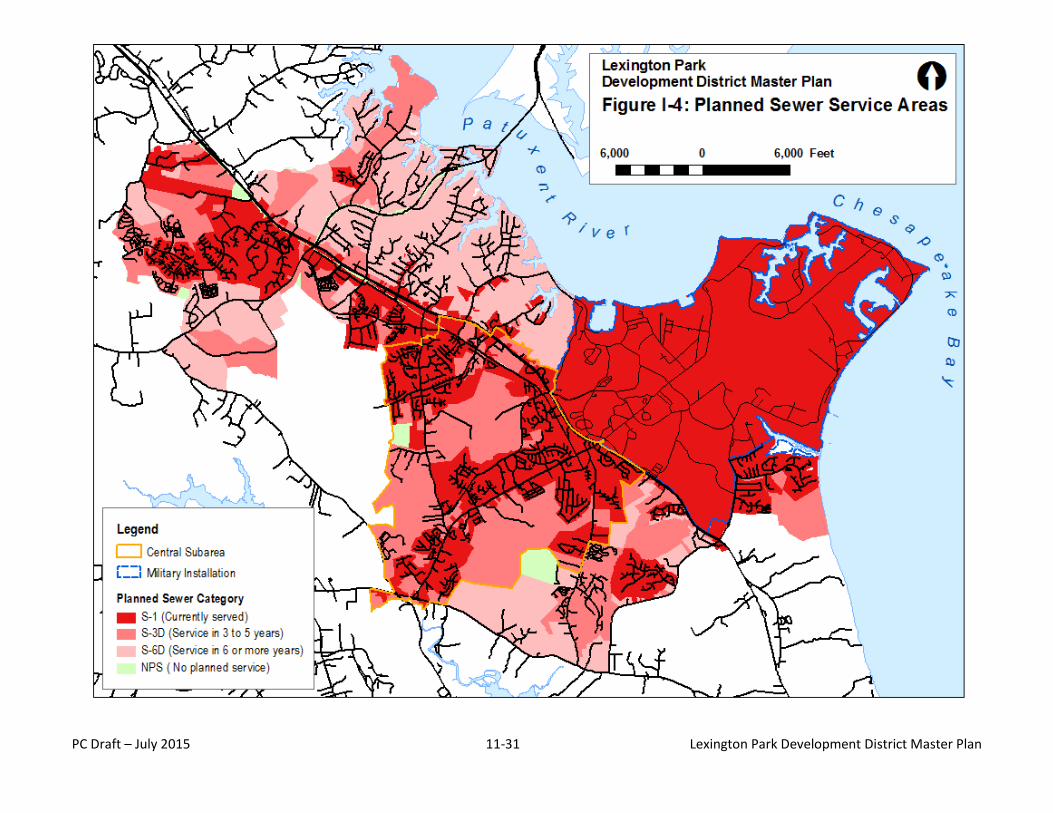
PC Draft – July 2015 11-31 Lexington Park Development District Master Plan
Figure I- 4: Planned Sewer Service Areas
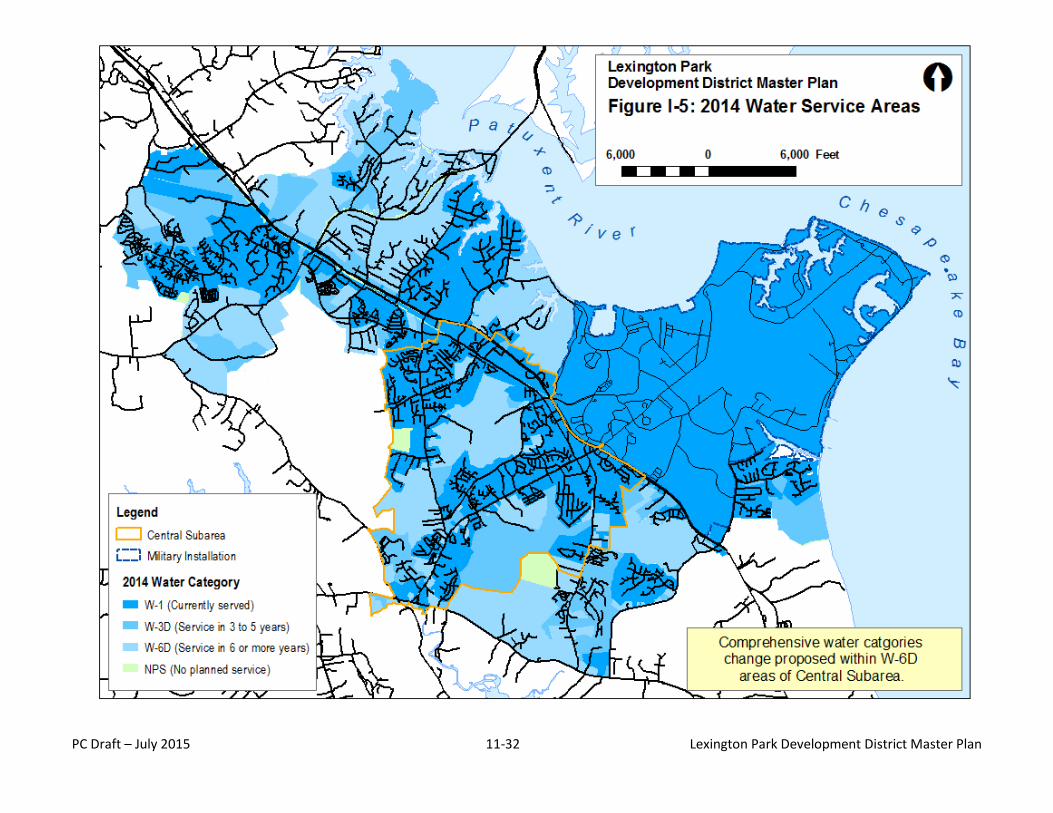
PC Draft – July 2015 11-32 Lexington Park Development District Master Plan
Figure I- 5: 2014 Water Service Areas
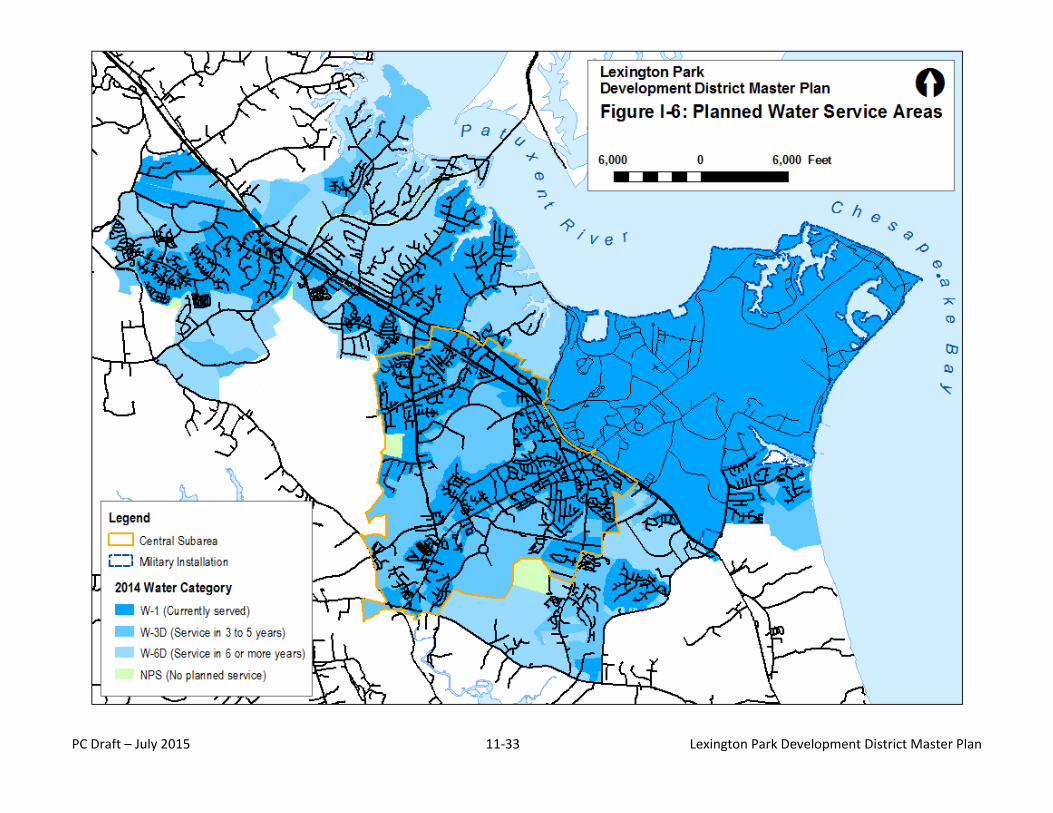
PC Draft – July 2015 11-33 Lexington Park Development District Master Plan
Figure I- 6: Planned Water Service Areas