Embed Size (px)
Citation preview

1
Leveraging EHR to Discover Effective Care Coordination Practice Patterns
Session 4, February 12, 2019
You Chen, Assistant Professor, Vanderbilt University Medical Center

2
You Chen, PhD
has no real or apparent conflicts of interest to report.
Conflict of Interest
3
• Learning objectives
• High healthcare cost in the U.S.
• Fragmented vs. coordinated care
• Team science in coordinated care
• A data revolution to team science
• Introduction of data in electronic health records
• Learn effective teams and patient medical needs from the data
• Limitations and challenges of using the data in team science
• Three case studies to illustrate the learning of effective teams
• Conclusions
Agenda

4
Participants will be able to:
1. Describe how to use network analysis along with electronic health records to show coordination patterns between providers
2. Identify how to leverage electronic health records to measure patient medical needs
3. Measure relationships of team models with health outcomes
Learning Objectives

5
U.S. has the highest healthcare cost among developed countries
79.1$9,237
Per Capita Health spending (2014)
Ave
rage L
ife E
xpecta
ncy
Source: Institute for
Health Metrics and
Evaluation, World
Bank country
classifications

6
Health cost has been increasing exponentially in the U.S.
0 500000 1000000 1500000 2000000 2500000 3000000
1960
1963
1966
1969
1972
1975
1978
1981
1984
1987
1990
1993
1996
1999
2002
2005
2008
2011
2014
Total National Health Expenditures (Millions)
Source: The National
Health Expenditure
Accounts (NHEA)

7
Why healthcare cost is so high in the U.S.?
Fragmented care

8
An example of fragmented care
He saw each doctor independently and each doctor
looked in depth at the organ, did the latest tests and
prescribed the latest drugs and devices
He bought the best of
each commodity
Cardiologist
Neurologist
Gastroenterologist

9
Fragmented care brings …
lack of appropriate medication
use and adherenceduplicative use of services
increase healthcare
expenditures
Governments, health care
systems, and individuals
spend more and more on
healthcare, for less and less
value

10
Coordinated care
Consider the whole person
rather than each of the discrete
diseases/organs
A group of providers interact
with each other rather than
each of them acts individually

11
Coordinated VS. Fragmented Care
Fragmented care Coordinated care
Source: IOM (Institute of Medicine). The Healthcare Imperative: Lowering Costs and Improving Outcomes: Workshop Series Summary. Washington, DC: The National Academies Press, 2010.
12
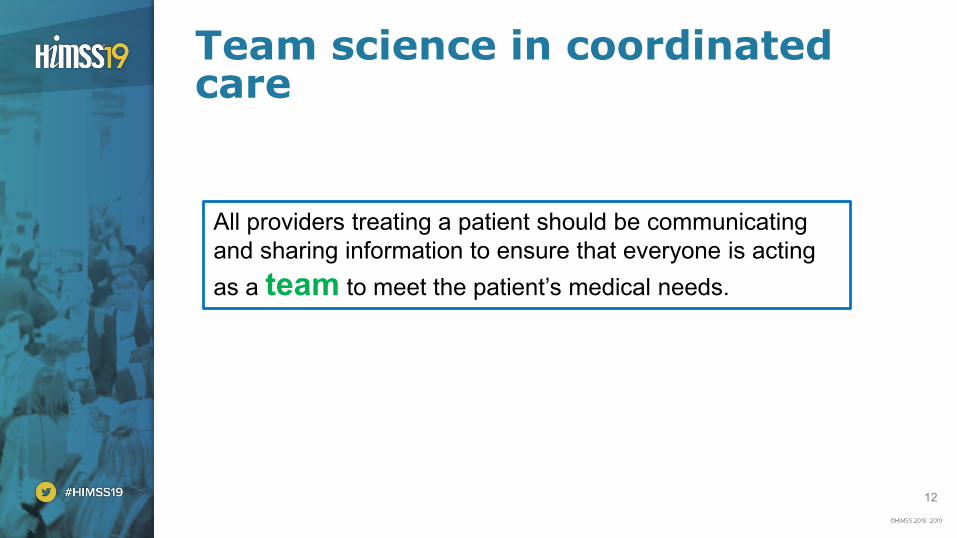
Team science in coordinated care
All providers treating a patient should be communicating
and sharing information to ensure that everyone is acting
as a team to meet the patient’s medical needs.

13
Dynamic changes of patient medical needs
• require corresponding team
adjustments
Seldom researches have been
done to investigate self-organizing
nature of care team
• how do teams respond to the
dynamic changes of patient
medical needs?
• how do such responses relate to
patient outcomes?

14
Linking provider interaction network structures to success
The Bavelas-Levitt Experiment
Star and Y: fastest problem solvers
Clear leader at the center of communications

15
Transforming data into provider interaction networks
Provider Patient

16
Data warehouse at VanderbiltThe Synthetic Derivative (SD) and the Research Derivative (RD)
Distribution of SD subject population
by age, race and gender
IBM general parallel file
system for the Netezza
warehousing appliance
17
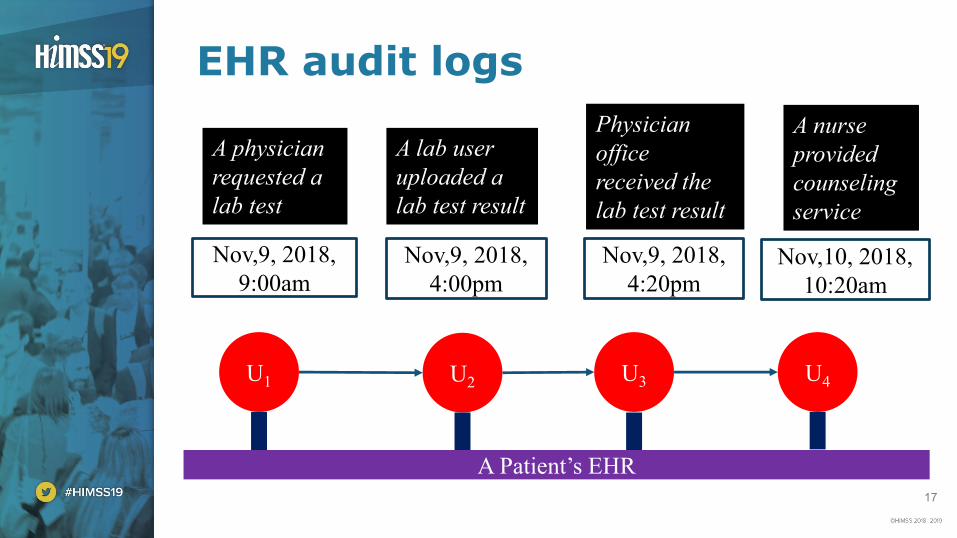
EHR audit logs
U1 U2 U3 U4
A physician
requested a
lab test
A lab user
uploaded a
lab test result
Physician
office
received the
lab test result
A nurse
provided
counseling
service
Nov,9, 2018,
9:00am
Nov,9, 2018,
4:00pm
Nov,9, 2018,
4:20pmNov,10, 2018,
10:20am
A Patient’s EHR

18
• No change to record (view)
– Form view or chart review
• Change to record (document)
– Medication or lab orders
– Notes
– Clinical actions-assessment, treatment or procedure
– Communications with providers or patients
Audit logs-overarching categories

19
An example of audit logs
Patient ID Provider ID Access action Access date time
Capture interactions of
providers to patient EHRs
Form viewing, clinical notes
writing, medication
ordering, vital sign
monitoring ….
These events are rarely
viewed outside of a health
care system

20
Diagnosis data
Patients’ clinical notes,
billing codes,
laboratories, medication
orders and discharge
summaries

21
Examples of Patient Diagnoses Represented by ICD-9 Codes
ID of a patient’s EHR
ICD-9 codes
assigned to a patientAn encounter ID
22
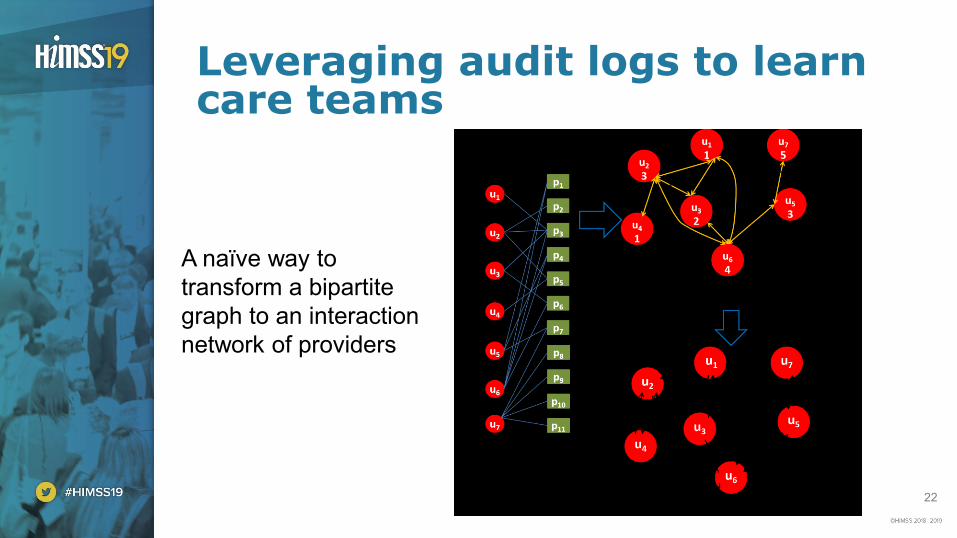
Leveraging audit logs to learn care teams
A naïve way to
transform a bipartite
graph to an interaction
network of providers

23
An example to illustrate the calculation of the interaction strength
Strength (u1-> u2) = 4/7
p2p3
p7p5
p4
p6
p1
p2p3
p7p5
u1 u2
Strength (u2-> u1) = 4/4

24
Matrix decomposition to learn provider networks from audit logs

25
Principal component analysis
2n
dP
rin
cip
al C
om
po
nen
t
Children’s Hospital
University Hospital
1st Principal Component

26
Social Network Metrics
In-degrees
Out-degrees
Betweenness Centrality
Closeness Centrality

27
Leveraging diagnosis data to weight patient medical needs
p1
p2
p3
p5
p4
p6
d1
d2
d1
d2
d3
d3
Assignments of
diagnoses to patients

28
TF-IDF weights medical needs of a patient
The weight of a
disease specific to
a patient
Patient population
having disease dNumber of times the
disease appearing in a
patient's EHRs
𝑊𝑑,𝑝𝑎𝑡𝑖𝑒𝑛𝑡 = 𝐹𝑟𝑒𝑞𝑢𝑒𝑛𝑐𝑦𝑑,𝑝𝑎𝑡𝑖𝑒𝑛𝑡 × 𝑙𝑜𝑔𝑝𝑎𝑡𝑖𝑒𝑛𝑡 𝑝𝑜𝑝𝑢𝑙𝑎𝑡𝑖𝑜𝑛
𝑝𝑎𝑡𝑖𝑒𝑛𝑡 𝑝𝑜𝑝𝑢𝑙𝑎𝑡𝑖𝑜𝑛 𝑤𝑖𝑡ℎ 𝑑

29
An example of TF-IDF
Patient 1 Patient 2 Patient 3
Problem 1 4 2 4
Problem 2 0 0 4
Problem 3 0 0 3
Problem 4 1 0 0
Patient 1 Patient 2 Patient 3
Problem 1 0.27 0.27 0.11
Problem 2 0 0 0.28
Problem 3 0 0 0.28
Problem 4 0.69 0 0
TF-IDF
Common problem
Specific problem
Different weights
on health problems

30
Latent dirichlet allocation (LDA) to learn topics weighting patient medical needs
Health problem
We
ight
to a
patient

31
How to evaluate the learned care teams and medical needs?
Unsupervised
Learning
• No labeled data
• No prior knowledge

32
• Survey
– Recruit experts with domain knowledge to assess plausibility of learned patterns: care teams/patient medical needs
• Simulation
– Simulate care teams/patient medical needs
– Test performances of models on the simulated data
Online surveys or computer simulations

33
REDCap: an online survey system
• Open a new project
• Design survey questions
• Ask experts to answer questions
• Record survey results
• Analyze survey results

34
• Statistical models: proportional-odds model, analysis of variance, logistical regression
– Patient outcome: length of stay, unplanned readmission, …
– Outcome ~ α + β1×team factors + (β2× patient demographics + β3× patient medical needs + β4× health insurance programs + β5× admission months + … )
Effectiveness of care teams
35
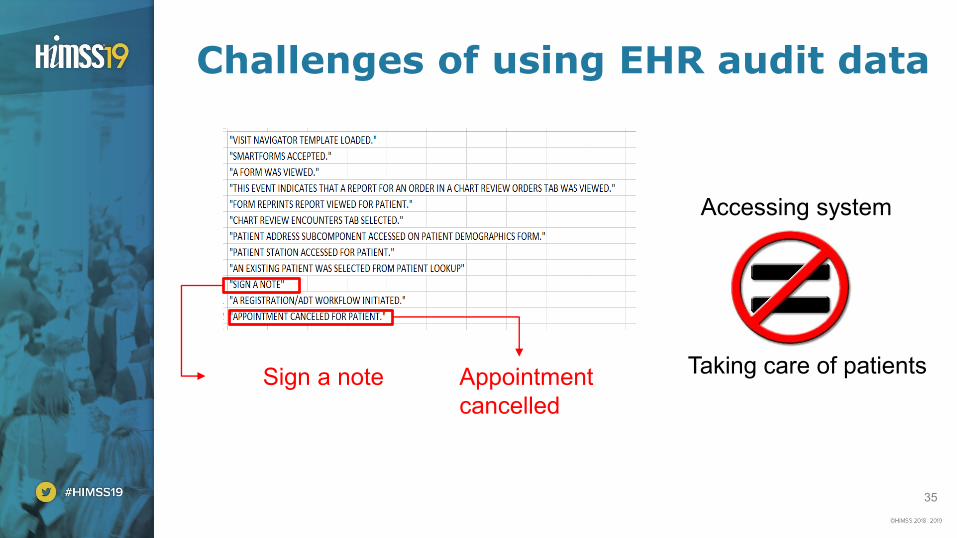
Challenges of using EHR audit data
Sign a note Appointment
cancelled
Accessing system
Taking care of patients
36
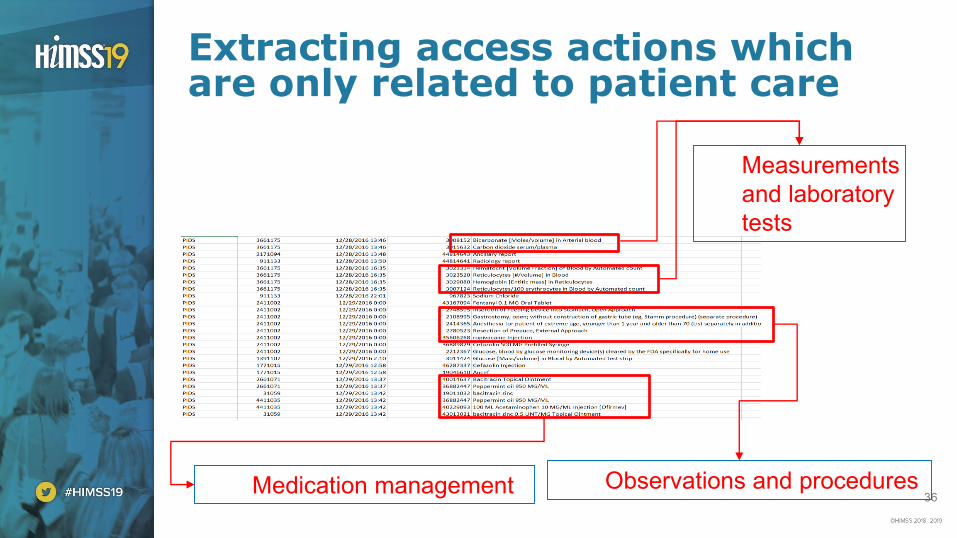
Extracting access actions which are only related to patient care
Measurements
and laboratory
tests
Observations and proceduresMedication management

37
Challenges of using EHR diagnosis data
Providers’ EHR utilization behaviors varyProvider generated data

38
Using Standard terminology to represent diagnosis data

39
• Inpatient setting
Where to start?
Three case studies

40
Case study 1
learn care teams and their responsible medical needs

41
• 10 659 VUMC employees
• 17 947 inpatients
• 5 176 unique ICD-9 billing codes
• 831 721 unique interactions the providers committed to EHRs of patients
• 74 192 assignments of diagnosis codes to patients
4 months of audit logs and diagnoses from VUMC

42
Provider interaction network structures at the level of VUMC unit

43
27 of 34 care teams were confirmed

44
Matches between care teams and patient medical needs
Phenotypes
Care
team
s

45
Oncology care team
Operational area
Dis
tance b
etw
een o
pera
tional are
as
Bone Marrow
Related
Radiation
Oncology
Related
Hematology and
Myelosuppression
Cancer
Center

46
Phenotypes associated with oncology care team

47
Case study 2
Learning provider interaction networks in the neonatal intensive care unit and measuring their relationships with length of stay

48
• 1 day before surgery until 30 days after surgery
• 70 – 2400 provider actions recorded per patient
• Discharged to home or remained at hospital at 30-day post-
surgery mark
• Age, weight, birth date, race, gender, surgery date
EHR data of 18 infants with gastrostomy surgery in NICU

49
Patient-Level Provider Networks

50
Out-degree average was significantly related to post-operative length of stay
• Out-degree is a measure of
information dispersion
• Patients treated by providers who
disseminated patient-related
information to providers within the
network had shorter LOS
High out-degree Low out-degreePo
st su
rgic
al L
OS
(d
ays)

51
Case study 3
Trauma provider interaction networks and their relationships with length of stay

52
• 5,547 employees committed EHR access actions during 5,588
patient encounters
• 158,467 unique actions
• Confounding factors including a patient’s age, historical
service utilization, diagnoses, procedures, admission season
and insurance program
EHR data of 5,588 adult inpatient episodes hospitalized survivors of trauma

53
Inpatient setting
The left interaction network has the highest degree of collaboration
between care providers and it was related to the shortest length of
stay
Graph density: 0.27 0.17 0.18
0.61 days shorter in average

54
• Health data science just starts…
• We are at the very beginning of the research on care teams and patient medical needs
• While data-driven methods can provide insight into care team and patient medical need modeling, there are still many challenges need to be solved
– EHR data quality, security and privacy
– Generalizability of models: multiple healthcare organizations
– Evaluation of the learned novel knowledge
– The gap between the learned knowledge and its application in clinical practice
– Intra-coordination vs. inter-coordination
Conclusions

55
Questions
You Chen, PhD
W: www.vumc.org/dbmi/person/you-chen-phd
W: http://ohpenlab.org/
W: www.linkedin.com/in/you-chen-4086b532/
W: https://scholar.google.com/citations?user=c-pOkPEAAAAJ&hl=en