Embed Size (px)
Citation preview
Leveraged and Inverse ETFs: Strategies for a Changing Economy
Moderated by
Tom Lydon President Global Trends Investments, Editor and Proprietor of ETFtrends.com
Featuring
Chad Norfolk CFP®, Vice President and Senior Advisor at Financial Advantage, Inc.
Joanne Hill Head of Investment Strategy for ProFunds Group
Sponsored by
Produced by

Charter Financial Publishing Network

Produced by
Chad Norfolk
Financial Advantage
Tom Lydon
ETF Trends
Joanne Hill
ProFunds Group
Sponsored by

For Financial Professional Use Only: Not For Public Distribution 4
Leveraged and Inverse ETFs:
Strategies for a Changing Economy

For Financial Professional Use Only: Not For Public Distribution 5
To get a prospectus
Carefully consider the investment objectives, risks, and charges and expenses of ProFunds and ProShares before investing. This and other information can be found in the summary and full prospectus. For a ProFunds mutual fund prospectus, call 888-PRO-5717 or visit profunds.com. For a ProShares prospectus, please visit proshares.com. Read the prospectus carefully before investing. Most ProShares ETFs and many ProFunds employ leveraged investment techniques that magnify gains and losses and result in greater volatility in value. Each Ultra and Short ProShares ETF and leveraged or inverse ProFund seeks a return that is a multiple or inverse multiple (e.g. -200%) of the return of an index or other benchmark (target) for a single day. Due to the compounding of daily returns, Ultra and Short ProShares and leveraged or inverse ProFunds’ returns over periods other than one day will likely differ in amount and possible direction from the target return for the same period. Investors should monitor their holdings consistent with their strategies, as frequently as daily. For more on correlation, leverage and other risks, please read the ProShares or ProFunds prospectus. “ProFunds Group” includes ProFunds mutual funds and ProShares ETFs. ProFunds are distributed by ProFunds Distributors, Inc. ProShares registered under the Investment Company Act of 1940 are
distributed by SEI Investments Distribution Co. (One Freedom Valley Dr., Oaks, PA 19456), which is not affiliated with ProFunds Group or its affiliates.

For Financial Professional Use Only: Not For Public Distribution 6
Agenda
• ETF growth fueled by their effectiveness for trading efficiency and fund management
• Leveraged and Inverse ETFs: Tools for tactical strategies
• Investment themes for changing markets
For Financial Professional Use Only: Not For Public Distribution 7
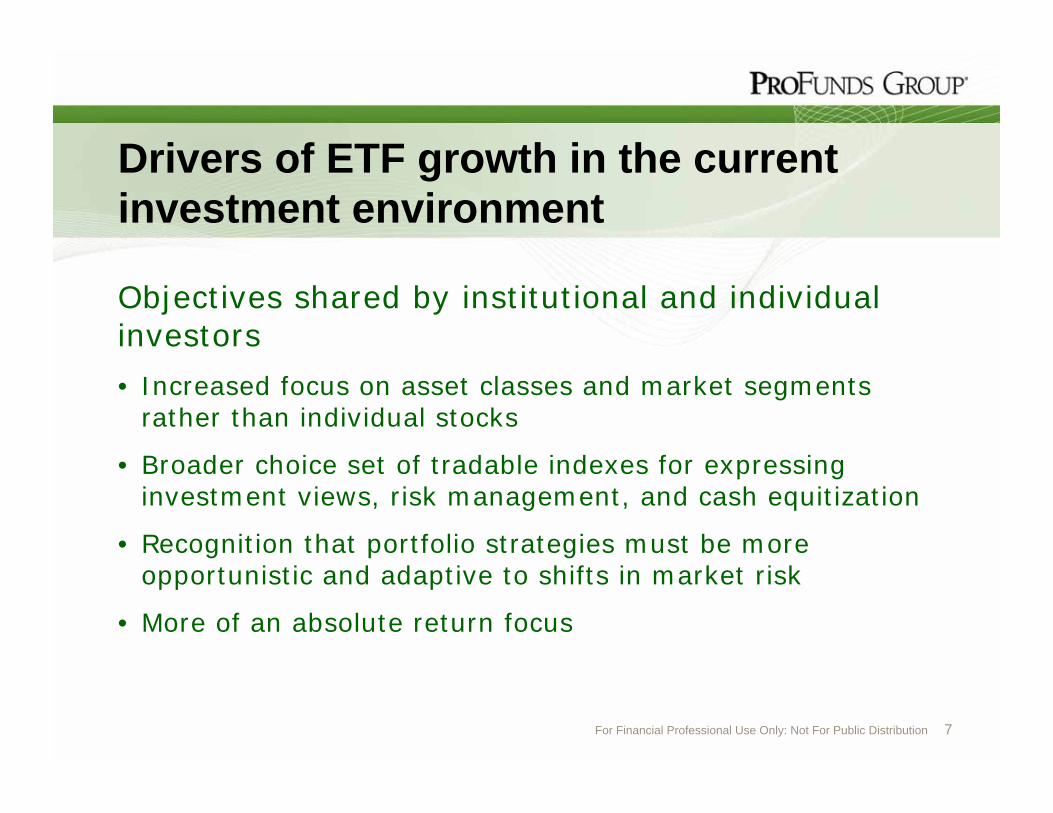
Drivers of ETF growth in the current
investment environment
Objectives shared by institutional and individual investors
• Increased focus on asset classes and market segments rather than individual stocks
• Broader choice set of tradable indexes for expressing investment views, risk management, and cash equitization
• Recognition that portfolio strategies must be more opportunistic and adaptive to shifts in market risk
• More of an absolute return focus

For Financial Professional Use Only: Not For Public Distribution 8
Liquidity features of ETFs are a key
driver of asset growth
• Short-term trading tools – Approaching 30-40% of
overall U.S. equity volumes1
• Heavy institutional use
– Estimated that 40-50% of assets held by institutions, which also account for a
much larger portion of trading activity2
Source: 1 Bloomberg, March 2010 2 2009 Strategic Insight report
Past performance does not guarantee future results.
Source: Credit Suisse: Portfolio Strategy, April 5, 2010

For Financial Professional Use Only: Not For Public Distribution 9
Largest ETFs are valued for both
investment and trading features
Largest long-only ETFs
Ticker ETF Name Assets
(m)* $Assets/
Daily Volume
SPY SPDR S&P 500 $77,824 4.0
GLD streetTRACKS Gold $40,504 24.4
EFA iShares MSCI EAFE $35,735 19.4
EEM iShares MSCI Emerging Markets
$35,099 4.9
VWO Vanguard Emerging Markets
$22,920 19.2
IVV iShares S&P 500 $22,782 56.0
QQQQ PowerShares QQQ $20,917 2.2
TIP iShares Barclays TIPS $20,128 170.0
VTI Vanguard Total Stock Market
$14,425 67.9
IWM iShares Russell 2000 $13,244 2.2 Source: Bloomberg, March 2010
Past performance does not guarantee future results.
• The list includes widely used equity indexes but also gold, TIPS, and corporate debt
• A wide range of ratios of $Assets to Daily $Volume
• The average ratio of $Asset/Volume across all ETFs has recently been approximately 10 days
For Financial Professional Use Only: Not For Public Distribution 10
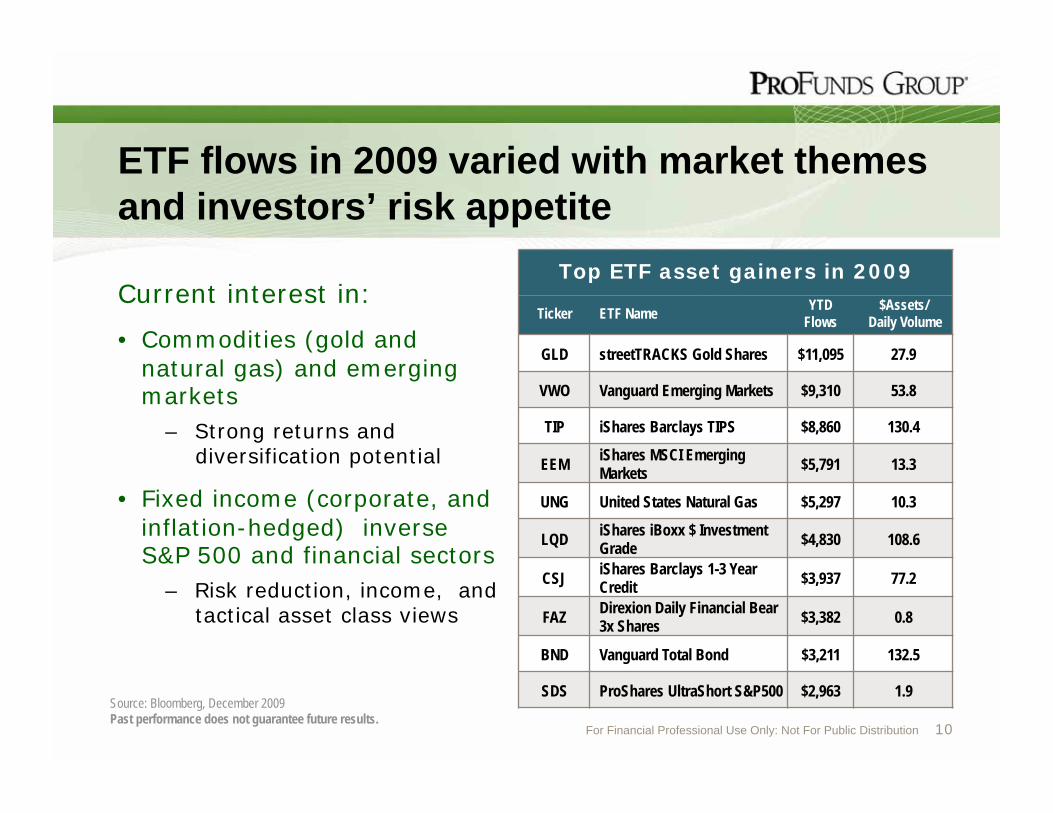
ETF flows in 2009 varied with market themes
and investors’ risk appetite
Current interest in:
• Commodities (gold and
natural gas) and emerging markets
– Strong returns and diversification potential
• Fixed income (corporate, and
inflation-hedged) inverse S&P 500 and financial sectors
– Risk reduction, income, and tactical asset class views
Top ETF asset gainers in 2009
Ticker ETF Name YTD
Flows $Assets/
Daily Volume
GLD streetTRACKS Gold Shares $11,095 27.9
VWO Vanguard Emerging Markets $9,310 53.8
TIP iShares Barclays TIPS $8,860 130.4
EEM iShares MSCI Emerging Markets
$5,791 13.3
UNG United States Natural Gas $5,297 10.3
LQD iShares iBoxx $ Investment Grade
$4,830 108.6
CSJ iShares Barclays 1-3 Year Credit
$3,937 77.2
FAZ Direxion Daily Financial Bear 3x Shares
$3,382 0.8
BND Vanguard Total Bond $3,211 132.5
SDS ProShares UltraShort S&P500 $2,963 1.9 Source: Bloomberg, December 2009
Past performance does not guarantee future results.

For Financial Professional Use Only: Not For Public Distribution 11
Q1 2010 ETF flows continue be tilted toward
emerging markets and fixed income
• Continuation of flows into
emerging market equities and fixed income funds
• New on list of top 10 flows in Q1 2010:
– High yield bond ETFs (JNK) and VIX Futures ETN (VXX)
– Equities: QQQQ, industrial
sector (XLI), and dividend-tilted indexes (VIG)
• Off the list are gold, natural
gas, corporate bond, and inverse financial sector and
S&P 500 ETFs
Ticker ETF Name YTD
Flows $Assets/
Daily Volume
VWO Vanguard Emerging Markets $2,903 19.2
SHV iShares Barclays Short Treasury Bond $1,840 67.3
TIP iShares Barclays TIPS $1,586 170.0
QQQQ PowerShares QQQ $1,346 2.2
CSJ iShares Barclays 1-3 Year Credit Bond $1,068 125.6
BND Vanguard Total Bond Market $859 107.7
VXX iPath S&P 500 VIX Short-Term Futures ETN $830 1.8
JNK SPDR Barclays Capital High Yield $815 22.5
XLI Industrial Select Sector SPDR $775 2.6
VIG Vanguard Dividend Appreciation $771 62.9
Source: Bloomberg, December 2009
Past performance does not guarantee future results.

For Financial Professional Use Only: Not For Public Distribution 12
What lies ahead for the ETF industry ?
• As investors turn to a more absolute return approach, direct and indirect use (through hedge funds) of ETFs should benefit
• Innovation with products incorporating alphas, new risk factors, and trading strategies
• A continued focus on product and strategy education
– Critical role for industry to educate ETF investors as they
cover more asset classes, use derivatives in index construction and portfolio management, and have become
more specialized
For Financial Professional Use Only: Not For Public Distribution 13
Leveraged and inverse ETFs:
Tools for tactical strategies
For Financial Professional Use Only: Not For Public Distribution 14
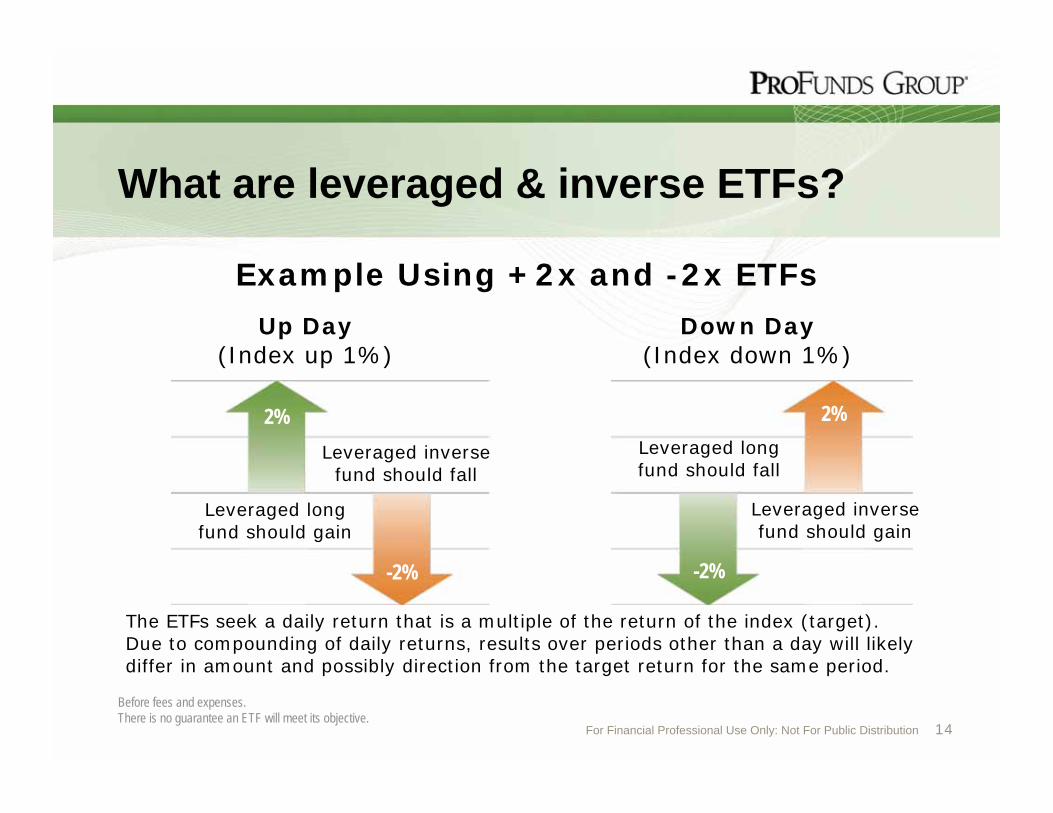
What are leveraged & inverse ETFs?
Before fees and expenses.
There is no guarantee an ETF will meet its objective.
Up Day
(Index up 1%)
Down Day
(Index down 1%)
Leveraged long fund should gain
Leveraged inverse fund should gain
Leveraged long fund should fall
Leveraged inverse fund should fall
2%
-2% -2%
2%
The ETFs seek a daily return that is a multiple of the return of the index (target). Due to compounding of daily returns, results over periods other than a day will likely differ in amount and possibly direction from the target return for the same period.
Example Using +2x and -2x ETFs

For Financial Professional Use Only: Not For Public Distribution 15
Universal effects of compounding
on investment returns
• Compounding affects all investments over time
– Upward trending periods enhances returns
– Downward trending periods reduces losses
– Volatile periods may reduce returns and increase losses
• Positive and negative effects of compounding are magnified in leveraged and inverse funds
For more information, please refer to “Understanding Returns of Leveraged and
Inverse Funds” in the September/October 2009 issue of Journal of Indexes.

For Financial Professional Use Only: Not For Public Distribution 16
Leveraged and inverse funds and ETFs:
History and profile
• Leveraged and inverse
mutual funds introduced in 1993
– Grew to over 100 funds with $10 billion in assets
– ETFs introduced in 2006 in
the U.S.
• Today more than 178 funds
– Assets are now more than
$31 billion
– Daily volume of more than $16 billion per day
Largest Leveraged &
Inverse ETFs
Ticker ETF Name Assets
(m)* $Assets/
Daily Volume
TBT ProShares UltraShort 20+ Year Treasury
$4,635 7.4
SDS ProShares UltraShort S&P500 $3,242 0.9
UYG ProShares Ultra Financials $1,844 1.1
SSO ProShares Ultra S&P500 $1,499 0.8
SH ProShares Short S&P500 $1,489 6.6
FAZ Direxion Daily Financial Bear 3x Shares
$1,232 0.2
QID ProShares UltraShort QQQ $919 0.6
FAS Direxion Daily Financial Bull 3x Shares
$889 0.3
QLD ProShares Ultra QQQ $843 1.1
SRS ProShares UltraShort Real Estate $587 0.4 Source: Bloomberg, December 2009
Past performance does not guarantee future results.

For Financial Professional Use Only: Not For Public Distribution 17
Why they’re valued How they’re used
• Efficient tool for investors with a view of the market
• Can trade and follow like a stock
• Can’t lose more than you invest
• Institutional pricing
• Transparent
• Liquid
• Tactical tools like other ETFs
• Component of overall portfolio strategy
– Target exposure with less cash
– Overweight or underweight exposure
– Help manage overall portfolio risk or seek to hedge specific
risk exposures

For Financial Professional Use Only: Not For Public Distribution 18
A reminder about risk
• Short ProShares are also subject to inverse correlation risk and short sale risk.
• UltraQQQ, ShortQQQ and UltraShort QQQ are also subject to technology risk.
• UltraDow30, ShortDow30 and UltraShort Dow30 also involve concentration risk.
• UltraMidCap400, ShortMidCap400 and UltraShort MidCap400 also involve mid-cap company investment risk.
• Shares of the ProSharesETFs may be sold throughout the day on the exchange through any brokerage account. However, shares may only be redeemed directly from a Fund by Authorized Participants, in very large creation/redemption units.
• In addition to the normal risks associated with investing, narrowly-focused investments typically exhibit higher volatility and smaller companies typically exhibit higher volatility.
• The fees and expenses associated with ProShares are higher than traditional ETFs.
• International investments may involve risk of capital loss from unfavorable fluctuation in currency values, from differences in generally accepted accounting principles or from economic or political instability in other nations.
• For descriptions of these risks, please see the prospectus at www.proshares.com.
• Emerging markets involve heightened risks related to the same factors as well as increased volatility and lower
trading volume. Securities focusing on a single country may be subject to higher volatility.
• Bonds will decrease in value as interest rates rise.
• The principal risks associated with ProShares include the
following:
• aggressive investment technique risk
• correlation risk
• counterparty risk
• credit risk
• early close/trading halt risk
• equity risk
• liquidity risk
• market price variance risk
• market risk
• non-diversification risk
• portfolio turnover risk
• repurchase agreement risk
• volatility risk

For Financial Professional Use Only: Not For Public Distribution 19
A reminder about risk
• Some ProFunds employ leveraged investment techniques that magnify gains, losses and volatility
• Small-capitalization funds typically carry additional risks since smaller companies generally have a higher risk of failure.
• Some ProFunds invest internationally, which involves increased risk and volatility.
• UltraSector ProFunds invest in a single industry. Their shares
do not represent a complete investment program. As non-diversified and single industry fund, the value of their shares
may fluctuate more than shares invested in a broader range of industries and companies.
• All ProFunds permit active investment strategies that can
decrease performance and increase expenses.
• The principal risks associated with ProFunds include the following:
– aggressive investment technique risk
– correlation risk
– counterparty risk
– credit risk
– equity risk
– leverage risk
– liquidity risk
– market price variance risk
– market risk
– non-diversification risk
– repurchase agreement risk
– volatility risk


•
•
•
•
•
•
•
•
•••
••
•
•••
•
•

Questions and Answers
Produced by
Sponsored by
Tom Lydon
(Moderator) President
Global Trends
Investments, Editor
and Proprietor of
ETFtrends.com
Chad Norfolk
(Panelist) CFP, VP and Senior
Advisor
Financial Advantage,
Inc.
Joanne Hill
(Panelist) Head of Investment
Strategy
ProFunds Group
Leveraged and Inverse ETFs: Strategies for a Changing Economy

• Log on to: www.cfp.net
• Login to your online CFP Board Account
(email address and password are needed)
• CE SPONSOR: Charter Financial Publishing Network, Inc.
• CE SPONSOR ID NUMBER: 2839
• PROGRAM NAME: Leveraged and Inverse ETFs in a Changing
Economy
• PROGRAM ID: 4272010
• HOURS GRANTED: 1.00
A recording and the slides of this presentation will be available at
www.fa-mag.com/etfsapr10
CE Credit
Produced by
CFP Board CE Credit To receive 1 General CE credit

• Log on to: www.imca.org/main/do/reportCIMACE
• Click on “Non-IMCA Continuing Educational Hours Submittal
Form”
• Complete form and follow submittal directions
A recording and the slides of this presentation will be available at
www.fa-mag.com/etfsapr10
CE Credit
Produced by
Non-IMCA CE Credit To receive 1 hour of Non-IMCA CE credit