Embed Size (px)
Citation preview

a SpringerOpen Journal
Wagesho and Chandravanshi SpringerPlus (2015) 4:107 DOI 10.1186/s40064-015-0899-5
RESEARCH Open Access
Levels of essential and non-essential metals inginger (Zingiber officinale) cultivated in EthiopiaYohannes Wagesho and Bhagwan Singh Chandravanshi*
Abstract
Background: Ginger (Zingiber officinale Roscoe) is a common condiment for various foods and beverages andwidely used worldwide as a spice. Its extracts are used extensively in the food, beverage, and confectionaryindustries in the production of products such as marmalade, pickles, chutney, ginger beer, ginger wine, liquors,biscuits, and other bakery products. In Ethiopia, it is among the important spices used in every kitchen to flavorstew, tea, bread and local alcoholic drinks. It is also chiefly used medicinally for indigestion, stomachache, malaria,fevers, common cold, and motion sickness. The literature survey revealed that there is no study conducted on thedetermination of metals in ginger cultivated in Ethiopia. Hence it is worthwhile to determine the levels of essentialand non-essential metals in ginger cultivated in Ethiopia.
Methods: The levels of essential (Ca, Mg, Fe, Zn, Cu, Co, Cr, Mn, and Ni) and non-essential (Cd and Pb) metals inginger (Zingiber officinale Roscoe) cultivated in four different regions of Ethiopia and the soil where it was grownwere determined by flame atomic absorption spectrometry. 0.5 g of oven dried ginger and soil samples weredigested using 3 mL of HNO3 and 1 mL of HClO4 at 210°C for 3 h and a mixture of 6 mL aqua-regia and 1.5 mLH2O2 at 270°C for 3 h, respectively.
Results: The mean metal concentration (μg/g dry weight basis) ranged in the ginger and soil samples, respectively,were: Ca (2000–2540, 1770–3580), Mg (2700–4090, 1460–2440), Fe (41.8–89.0, 21700–46900), Zn (38.5–55.2, 255–412),Cu (1.1–4.8, 3.80–33.9), Co (2.0–7.6, 48.5–159), Cr (6.0–10.8, 110–163), Mn (184–401, 1760–6470), Ni (5.6–8.4, 14.1–79.3)and Cd (0.38–0.97, 0.24–1.1). The toxic metal Pb was not detected in both the ginger and soil samples.
Conclusion: There was good correlation between some metals in ginger and soil samples while poor correlationbetween other metals (Fe, Ni, Cu). This study revealed that Ethiopian gingers are good source of essential metals andfree from toxic metal Pb while containing negligible amount of Cd.
Keywords: Ginger; Zingiber officinale; Essential metals; Non-essential metals; Soil; Ethiopia
IntroductionThe delightful flavour and pungency of spices make themindispensable in the food industry to flavour, improve andincrease the appeal of their products. Spices impart aroma,colour and taste to food preparations and sometimes maskundesirable odours. In addition, they are reputed to pos-sess several medicinal and pharmacological properties andhence find position in the preparation of a number ofmedicines (Parthasarathy et al. 2008).Ethiopia is among the largest consumer of spices in
Africa. The major use of spices in the country is in the
* Correspondence: [email protected] of Chemistry, College of Natural Sciences, Addis AbabaUniversity, P.O. Box 1176, Addis Ababa, Ethiopia
© 2015 Wagesho and Chandravanshi; licenseeCreative Commons Attribution License (http://cdistribution, and reproduction in any medium,
preparation of a highly spiced stew known as 'Wot'which together with 'Injera' is consumed by a large pro-portion of the population everyday as their main food.In addition, spices are also used by the numerous ethnicgroups in the country to flavor bread, meat, soups, dif-ferent vegetables, and as medicines and perfumes(Asfaw and Demissew 2009).The spice ginger obtained from the underground stems
or the rhizome of Zingiber officinale Roscoe, one of themost widely used species of the family Zingiberaceae, is acommon condiment for various foods and beverages. Bothfresh and dried ginger rhizomes are used worldwide as aspice, and ginger extracts are used extensively in the food,beverage, and confectionary industries in the production
Springer. This is an Open Access article distributed under the terms of thereativecommons.org/licenses/by/4.0), which permits unrestricted use,provided the original work is properly credited.

Wagesho and Chandravanshi SpringerPlus (2015) 4:107 Page 2 of 13
of products such as marmalade, pickles, chutney, gingerbeer, ginger wine, liquors, biscuits, and other bakery prod-ucts (Mishra 2009). Ginger is also widely used in bothtraditional and contemporary natural medicine (Zingiberofficinale 2010). In Ethiopia, it is among the importantspices used in every kitchen to flavor stew, tea, bread andlocal alcoholic drinks (Asfaw and Abegaz, 1995). It is alsochiefly used medicinally for indigestion, stomachache,malaria, fevers, common cold, and motion sickness.The major ginger growing area in Ethiopia includes wetter
regions at altitude below 2000 m in Kefa, Illubabur, GamoGofa, Sidama, Wellega, Wolaita, and Kembata-Tambaro.Currently, it has become an important cash crop for farmersin southern and south-western parts of Ethiopia. The pro-duction of this spice has been expanding in most parts ofthe country, as it can be grown under varied climatic condi-tions. It thrives well in areas with altitudes from sea level to1500 m, mean annual temperature of 20–32°C and withtotal rainfall greater than 1200 mm. Well-drained, fertileand friable soil with enough humus and neutral pH is theideal soil type for the production of ginger (Asfaw andDemissew 2009; Hailemicheal et al. 2008).The unique flavor properties of ginger arise from the
combination of pungency and aromatic essential oil. Themain pungent compounds in fresh ginger are a series ofhomologous phenolic ketones known as gingerols. Thegingerols are thermally unstable and are converted underhigh temperature to shogaol (Mishra 2009). Shogaols,which are more pungent than gingerols, are the majorpungent compounds in dried ginger (Jolad et al. 2004).The ginger rhizome also contains resin, proteins, cel-
lulose, pentosans, starch and mineral elements. Ofthese, starch is the most abundant and comprises 40–60% of the rhizome on a dry weight basis. The relativeabundance of certain constituents of ginger is deter-mined by the cultivar grown, the environmental condi-tions of growth and the stage of maturity at harvest(Parthasarathy et al. 2008).Humans require a suite of mineral elements in varying
amounts for proper growth, health maintenance and generalwell being. Minerals are essential components of our dietthat serve as cofactors in the thousands of enzyme-controlled reactions, control the action of nerves and mus-cles, help maintain the body's water balance, and buffer thepH (acidity) of the cell and extracellular fluids (Minerals-Learn 2010). Plant-derived foods have the potential to serveas dietary sources for all human-essential minerals thatmake a significant contribution to daily mineral needs at allstages of the life cycle (Grusak 2002). Generally, too low ortoo high of a concentration of trace elements in human dietcan affect the quality of human life.Mineral uptake by plants can be affected by several factors
including mineral concentrations in soils, soil pH, cationexchange capacity, organic matter content, types and
varieties of plants, and age of the plant (Jung 2008). Inideal word we would take in our daily requirement of min-erals by eating plants that grow in mineral rich soils (Har-old and Leslie 2000; Lokeshwari and Chandrappa 2006).The contamination of soil by atmospheric deposition oftoxic metals affects soil properties and further increasesplant metal levels through root uptake (Pandey and Pan-dey 2009), and eventually these metals are taken up byplants parts and transfer some into the food chain. Conse-quently, higher soil heavy metal concentration can resultin higher levels of uptake by plants (Ebong et al. 2008).Contamination and subsequent pollution of the environ-
ment by toxic heavy metals have become an issue of globalconcern due to their sources, widespread distribution andmultiple effects on the ecosystem. Heavy metals are gener-ally present in agricultural soils at low levels. Due to theircumulative behaviour and toxicity, however, they have a po-tential hazardous effect not only on crop plants but also onhuman health (Uwah et al. 2009). Therefore, a comprehen-sive study related to the assessment of levels of essential andtoxic metals of plants and soil where the plant has grown iscrucial with respect to human health and the quality of itsproducts.Some studies have been carried out on levels of
essential and non-essential metals in some spices andmedicinal plants cultivated in Ethiopia (Derbie andChandravanshi 2011; Gebre and Chandravanshi 2012;Kitata and Chandravanshi 2012; Weldegebriel et al.2012; Aregahegn et al. 2013; Mekebo and Chandravanshi2014; Endalamaw and Chandravanshi 2015; Dubale et al.2015). Some studies have also been conducted on deter-mination of essential and non-essential metal levels ofginger in Nigeria (Obiajunwa et al. 2002; Ogunwandeaand Olawore 2004; Aiwonegbe and Ikhuoria 2007), India(Devi et al. 2008), and Saudi Arabia (Al-Eed et al. 2002;Alwakeel 2008). However, the literature survey revealedthat there is no study conducted on the determination ofmetals in ginger cultivated in Ethiopia. Since ginger isused as a spice for many peoples of Ethiopia and it iscash crop, the knowledge of their mineral levels is ofparticular interest. Hence it is worthwhile to determinethe levels of essential and non-essential metals in gingercultivated in Ethiopia. Therefore, this study deals withassessment of levels of metals (essential and non-essential) in ginger cultivated in Ethiopia and it aims tofill the gap at least partially in the area and initiate othersfor further study on ginger and closely related plantswidely used throughout the country. The outcome ofthis study will ultimately help to ensure the dietarysafety of the society and improving the country's econ-omy by increasing both quality and quantity of gingercultivated in Ethiopia.The aim of this study was to determine the levels of
selected major, trace and toxic metals (Ca, Mg, Fe, Zn, Cu,

Wagesho and Chandravanshi SpringerPlus (2015) 4:107 Page 3 of 13
Co, Cr, Mn, Ni, Cd, and Pb) in ginger cultivated inEthiopia, to assess the level of minerals in soil sampleswhere the ginger was grown and to correlate the levels ofminerals in the ginger with that of soil in which it was cul-tivated. It was also aimed to compare the levels of metalsin the ginger cultivated in Ethiopia with the levels ofmetals in the ginger from other countries.
MethodsEquipments and reagentsChopping board (PTFE, China) and Teflon (PTFE) knifewere used to cut ginger rhizome in to pieces. A dryingoven (Digitheat, J.P. Selecta, Spain) was used to dry gingersample. Electronic blending device (Moulinex, France)was used for grinding and homogenizing the sample to de-termine the total metal content of the ginger. Mortar andpestle was used to grind soil sample. Analytical balance(Larko, LA114, 110 g/0.1 g) with precision of ± 0.0001 gwas used to weigh the ginger and soil sample. A 100 mLround bottomed flasks fitted with reflux condensers wereused in Kjeldahl apparatus hot plate to digest the driedand powdered ginger and soil samples. Borosilicate volu-metric flasks (25, 50 and 100 mL) were used duringdilution of sample and preparation of metal standard solu-tions. Measuring cylinders (Duran, Germany), pipettes(Pyrex, USA), and micropipettes (Dragonmed, 1–10 μL,100–1000 μL, Shangai, China) were used during measur-ing different quantities of volumes of sample solution, acidreagents and metal standard solutions. Flame atomic ab-sorption spectrophotometer, FAAS (Buck Scientific Model210VGP AAS, East Norwalk, USA) equipped with deuter-ium arc back ground correctors and hollow cathode lampswith air-acetylene flame was used for the determination ofthe metals (Ca, Mg, Cu, Zn, Mn, Ni, Fe, Co, Cr, Pb andCd) in the ginger and soil samples.All the reagents used were of analytical grade. HNO3
(69–72%) and HClO4 (70%) (Research Lab Fine ChemIndustries, Mumbai, India) were used for the digestionof ginger samples. Aqua-regia prepared from 3:1 ratio of37% HCl (Riedel-deHaën, Germany) and (69–72%)HNO3, and extra pure hydrogen peroxide 30% H2O2,(Scharlau, European Union), were used for the digestionof soil sample. Lanthanum nitrate hydrate (98%, Al-drich, USA) was used to avoid refractory interference(for releasing calcium and magnesium from their phos-phates). Stock standard solutions containing 1000 mg/L,in 2% HNO3, of the metals Ca, Mg, Cu, Zn, Mn, Ni, Fe,Co, Cr, Pb and Cd (Buck Scientific Puro-Graphic, USA)were used for preparation of calibration standards andin the spiking experiments. Deionized water (chemicallypure with conductivity 1.5 μs/cm and below) was usedfor dilution of sample and intermediate metal standardsolutions prior to analysis and rinsing glassware andsample bottles.
SamplingSamples were collected from four major ginger producingareas in Ethiopia namely Tepi, Bombae, Hadaro andIllubabur. Tepi is located in the Sheka zone, Southern Na-tions, Nationalities and Peoples' Region (SNNPR), 596 kmsouthwest of Addis Ababa with an elevation of 1097 mabove sea level and lies between 7°12’–7°89’N and 35°24’ to37°90’E. The annual mean temperature of the area rangesbetween 15.1–27.5°C and the annual mean rainfall ranges1201–1800 mm. Bombae is located in Wolayita Zone,SNNPRS, 390 km south west of Addis Ababa, lies between6°51’ and 7°35’N and 37°46’–38°1’E. Hadaro is located inKembata zone of SPNNR. It is 270 km far from the capitalcity of Ethiopia which is Addis Ababa. Illubabor is located inthe Oromia Region. It has a latitude and longitude of 8°18′N and 35°35′E and an altitude of 1605 m.Fresh ginger samples were collected from the farm-
lands of four areas in southern and south westernEthiopia particularly Illubabur (Oromia region), Tepi(Sheka, SNNPR), Hadaro (Kambata, SNNPR), and Bom-bae (Wolayita, SNNPR). These sampling sites were se-lected based on large-scale production area of ginger inthe country so that the sample partly represents thewhole ginger cultivated in Ethiopia. To collect the repre-sentative sample from each sampling sites, three sub-samples (500 g each) were taken from farmlands whichwere roughly two km away from each other. These farm-lands were randomly chosen from the three triangularcorners of the area. Half kilogram of fresh ginger sam-ples were collected from each farmland and put in cleanpolyethylene plastic bags labelled and brought to the la-boratory for further pre-treatment. The three sub-samples were mixed together after grinding in a blenderto homogenize and form bulk samples that representeach sampling areas. Finally four ginger bulk samplesone from each stated areas were prepared for analysis.12 samples with 0.5 g aliquot (three from each bulksample) were taken for final digestion.For comparative analysis of mineral levels in ginger and
the soil where the ginger was cultivated, the soil sampleswere collected from the surface horizon (15–20 cm) depthof the same four sampling areas of ginger. Sampling wasdone similar to ginger. Half-kilogram soil samples werecollected from each farmland. The three sub-samples weremixed together after grinding using a mortar and pestle tohomogenize and form bulk samples that represent eachsampling areas. Finally four soil bulk samples one fromeach stated areas were prepared for analysis. 12 sampleswith 0.5 g aliquot (three from each bulk sample) weretaken for final digestion.
Sample preparationFresh ginger collected from the sampling areas was keptin plastic bags and transported to the laboratory. The

Wagesho and Chandravanshi SpringerPlus (2015) 4:107 Page 4 of 13
rhizomes were washed with a running tap water so as to re-move adsorbed soil particulates and then rinsed with deion-ized water. The thin outer skin of ginger was removed byplastic knife and chopped in to pieces nearly uniform size tofacilitate drying uniformly. The sample was exposed to sunlight for two days to reduce the moisture content. Then, tohave constant mass, the sample was oven dried at 80°C for24 h so as to express the result in terms of dry mass basis.The dried ginger was powdered using electronic blenderand sieved to prepare fine powder of ginger for digestion.The soil sample collected from the four sampling area
were air dried to constant weight for three days andsieved through a 2-mm polyethylene sieve to removelarge debris, stones, and pebbles. Then, the samples wereground using a mortar and pestle to pass a 500-μmsieve, homogenized, and ready for digestion.
Moisture content of gingerTo determine the moisture content of fresh ginger, firstit was carefully washed with tap water to removeadsorbed soil particulates and exposed to air to vaporizewater on the surface of it. Then it was weighed withelectronic balance to record the initial weight with itsmoisture content. After oven drying at 80°C for two daysit was re-weighed and re-dried until it gave constantmass. The moisture content of four samples was be-tween 75.0–84.9%. Therefore, fresh ginger cultivated inEthiopia has comparable moisture content with thevalue reported by Govindarajan (1982), which is 80.9%for typical analysis of market sample of ginger.
Digestion of ginger and soil samplesThe basic requirements for sample preparation for ana-lysis are to get an optimum condition for digestion. Theoptimum condition is the one which required minimumreagent volume consumption, minimum reflux time,clarity of digests, and ease of simplicity (Huang et al.2004; Wilson et al. 2005; Demirel et al. 2008; Chen andMa 2001; Gaudino et al. 2007; Endalamaw and Chandra-vanshi 2015).In this study, to prepare a clear colorless sample solu-
tion that is suitable for the analysis using FAAS, differentginger digestion procedures were optimized using theHNO3 and HClO4 acid mixtures by varying parameterssuch as volume of the acid mixture, digestion time and di-gestion temperature (Huang et al. 2004; Wilson et al.2005; Demirel et al. 2008). The results are given in Table 1.From the optimization procedures, the acid mixture of3 mL of HNO3 (69–70%) and 1 mL of HClO4 (70%), di-gestion time of 3 h and digestion temperature of 210°Cwere found the optimal condition for 0.5 g ginger sample.These optimum conditions were selected based on clarity ofdigests, minimum reagent volume consumption, minimum
digestion time, simplicity and minimum temperature ap-plied for complete digestion of sample.A modified aqua-regia (HNO3 +HCl +H2O2) was se-
lected as digestion reagent for soil sample digestion in thiswork (Chen and Ma 2001; Wilson et al. 2005; Gaudinoet al. 2007). The optimum conditions (Table 2) for soilsample digestion were a reagent mixture of 6 mL aqua-regia (3:1 ratio of HCl to HNO3) and 1.5 mL H2O2, diges-tion temperature of 270°C and digestion time of 3 h for0.5 g soil sample.Applying the optimized condition, 0.5 g of dried and ho-
mogenized ginger samples were transferred into a 100 mLround bottomed flask. Then 4 mL of a mixture of HNO3
(69–72%) and HClO4 (70%) with a volume ratio of 3:1 (v/v)was added and the mixture was digested on a Kjeldahl di-gestion apparatus fitting the flask to a reflux condenser bysetting the temperature first at 120°C for 30 min and thenincreased to 210°C for the remaining 2 h and 30 min. Thedigest was allowed to cool to room temperature for 10 minwithout dismantling the condenser from the flask and for10 min after removing the condenser. To the cooled solu-tion 15 mL of deionized water was added to dissolve theprecipitate formed on cooling and to minimize dissolutionof filter paper by the digest residue while filtering withWhatman, (110 mm, diameter), filter paper into 50 mLvolumetric flask. The round bottom flask was rinsed subse-quently with 5 mL deionized water until the total volumereached around 45 mL. To this final solution, 3 mL lan-thanum nitrate solution (1% w/w) was added and the solu-tion was filled to the mark (50 mL) with deionized water.The digestion was carried out in triplicate for each bulksample. Digestion of a reagent blank was also performed inparallel with the ginger samples keeping all digestion param-eters the same. The digested samples were kept in the re-frigerator, until the levels of all the metals in the samplesolutions were determined by FAAS.Applying the optimized condition, 0.5 g of dried and ho-
mogenized soil samples were transferred into a 100 mLround bottomed flask. To this 6 mL of aqua-regia (3:1 ra-tio of 37% HCl to (69–72%) HNO3, respectively) andfollowed by 1.5 mL of 30% H2O2 were added and the mix-ture was digested on a Kjeldahl digestion apparatus fittingthe flask to a reflux condenser by setting the temperaturefirst at 180°C for the first 30 min and then raised to 240°Cfor the next 30 min and finally raised to 270°C for theremaining 2 h. The rest steps were similar for both gingerand soil sample digestion procedure.
Instrument calibrationCalibration metal standard solutions were prepared foreach of the metals from an intermediate standard solu-tion containing 10 mg/L which was prepared from theatomic absorption spectroscopy standard stock solutionsthat contained 1000 mg/L. These intermediate standards

Table 1 Different conditions tested for optimization of digestion procedure for 0.5 g ginger samples
Trial no. Reagent(s) used Reagent volume (mL) Temp. (°C) Digestion time (h) Results
Optimization for reagent volume
1 HNO3:HClO4 3:3 270 3:00 Deep yellow
2 HNO3:HClO4 4:2 270 3:00 Yellow
3 HNO3:HClO4 3:2 270 3:00 Clear yellow
4 HNO3:HClO4 4:1 270 3:00 Almost clear
5 HNO3:HClO4 2:2 270 3:00 Clear light yellow
6 HNO3:HClO4 3:1 270 3:00 Clear and colourless
Optimization for temperature
1 HNO3:HClO4 3:1 150 3:00 Deep yellow
2 HNO3:HClO4 3:1 180 3:00 Light yellow
3 HNO3:HClO4 3:1 210 3:00 Clear and colourless
4 HNO3:HClO4 3:1 240 3:00 Clear and colourless
5 HNO3:HClO4 3:1 270 3:00 Clear and colourless
6 HNO3:HClO4 3:1 300 3:00 Clear and colourless
Optimization for digestion time
1 HNO3:HClO4 3:1 210 1:45 Deep yellow
2 HNO3:HClO4 3:1 210 2:00 Light yellow
3 HNO3:HClO4 3:1 210 2:15 Light yellow
4 HNO3:HClO4 3:1 210 2:30 Clear light yellow
5 HNO3:HClO4 3:1 210 2:45 Clear and colourless
6 HNO3:HClO4 3:1 210 3:00 Clear and colourless
Rows with bold font indicate the optimal condition for the given parameter.
Wagesho and Chandravanshi SpringerPlus (2015) 4:107 Page 5 of 13
were diluted with deionized water to obtain four workingstandards for each metal of interest. Then, Ca, Mg, Cu, Zn,Mn, Ni, Fe, Co, Cr, Pb and Cd were analyzed with FAAS(Buck Scientific Model 210GP) equipped with deuteriumarc background corrector and standard air-acetylene flamesystem using external calibration curve. Three replicate de-terminations were carried out on each sample. All the
Table 2 Different conditions tested for optimization of digest
Trial no. Reagent(s) used Reagent volume (mL) Temp
Optimization for reagent volume
1 Aqua-regia:H2O2 6.5:1 300
2 Aqua-regia:H2O2 6:1.5 300
3 Aqua-regia:H2O2 5.5:2 300
Optimization for temperature
1 Aqua-regia:H2O2 6:1.5 240
2 Aqua-regia:H2O2 6:1.5 270
3 Aqua-regia:H2O2 6:1.5 300
Optimization for digestion time
1 Aqua-regia:H2O2 6:1.5 270
2 Aqua-regia:H2O2 6:1.5 270
3 Aqua-regia:H2O2 6:1.5 270
Rows with bold font indicate the optimal condition for the given parameter.
eleven metals were determined by absorption/concentra-tion mode and the instrument readout was recorded foreach solution manually. The same analytical procedure wasemployed for the determination of elements in digestedblank solutions.The instrument was calibrated using four series of work-
ing standards. The working standard solutions of each
ion procedure for 0.5 g soil samples
. (°C) Digestion time (h) Results
3:00 Deep yellow with suspension
3:00 Light yellow with no suspension
3:00 Light yellow with no suspension
3:00 Deep yellow with suspension
3:00 Light yellow with no suspension
3:00 Light yellow with no suspension
2:00 Deep Yellow with suspension
2:30 Light yellow with suspension
3:00 Light yellow with no suspension

Wagesho and Chandravanshi SpringerPlus (2015) 4:107 Page 6 of 13
metal were prepared freshly by diluting the intermediatedstandard solutions (10 mg/L). The correlation coefficientsof the calibration curves were > 0.9999 which confirmed anexcellent correlation between the absorbance and the con-centration. The method detection limits were in the range1–5 μg/g dry weight for the ginger and soil samples whichindicated that the FAAS method used are applicable to de-tect the presence of metals in the ginger and soil samples attrace levels.
Method performance and method validationThe criteria used for evaluating analytical methods are calledfigures of merit. Based on these characteristics, one can pre-dict whether a method meets the needs of intended purpose.These figures of merit are accuracy, precision, sensitivity, de-tection limits, and the quantitation limits (Mitra 2003).In this study, the precision of the results were evaluated
by the pooled standard deviation, and relative standard devi-ation of the results of nine measurements for a given bulksample (i.e. three samples (n = 3) and triplicate readings foreach sample).In the present study, method detection limit for each
metal was estimated by digesting six analytical blanks withthe optimized procedure for both ginger and soil samples.Triplicate analyses of six blank samples for all elementswere performed and the pooled standard deviation of thesix blank reagents was calculated. The detection limits wereobtained by multiplying the pooled standard deviation ofthe reagent blank (Sblank) by three (MDL= 3 x Sblank, n = 6).The method detection limit of each metal was ≤ 5 μg/gwhich indicated that the method was applicable to the de-termination of metals at trace levels in both the ginger andsoils samples.In this work, the method validation was established by
spiking experiments. The spiked samples were preparedby adding a small known quantity of metal standard so-lutions. For spiking ginger sample, 200 μL of 1000 mg/LCa, 300 μL of 1000 mg/L Mg, 12.5 μL of 1000 mg/L Zn,75 μL of 1000 mg/L Mn, 31.5 μL of 40 mg/L Ni, 10 μLof 1000 mg/L Fe, 43.5 μL of 40 mg/L Co, 25 μL of40 mg/L Cu, 62.5 μL of 40 mg/L Cr and 30 μL of10 mg/L Cd standard solutions were added to roundbottomed flask (100 mL) containing 0.5 g ginger sample.For soil sample spiking, 350 μL of 1000 mg/L Ca,250 μL of 1000 mg/L Mg, 235 μL of 1000 mg/L Fe,65 μL of 1000 mg/L Mn, 75 μL of 1000 mg/L Zn, 20 μLof 1000 mg/L Ni, 200 μL of 40 mg/L Cu, 40 μL of1000 mg/L Co, 35 μL of 1000 mg/L Cr and 32 μL of10 mg/L Cd standard solutions were added to roundbottomed flask (100 mL) containing 0.5 g soil sample.The spiked and non-spiked samples were digested andanalysed in similar condition.The results of percentage recoveries for the studied metal
nutrients in both ginger and soil samples were within the
acceptable range (93–106%) in the ginger and (93–107%) inthe soil samples. These results verified that the optimized di-gestion procedure was valid for both ginger and soil sampleanalysis.
Statistical analysisThe analysis of variance for the equality of means and cor-relation between the elements in ginger and soil sampleswere done using the SPSS 16.0.
ResultsThe concentration of eleven elements (Ca, Mg, Fe, Zn,Cu, Co, Cr, Mn, Ni, Cd, and Pb) in the digested samples ofginger and soil were determined by FAAS. Among the de-termined metals Pb was below the method detection limit(0.002 mg/g in the ginger and 0.004 mg/g in the soil) andthe concentration of the rest of metals are shown withtheir respective standard deviation in Tables 3 and 4. Themost abundant metal among the macro-elements in gin-ger was Mg followed by Ca whereas Mn content was thepredominant among the tested micronutrient heavymetals followed by Fe, Zn, Co and Cu. In soil sample themost abundant metal was Fe followed by Mn, Ca, Mg, Zn,Cr, Co, Cu, Ni, and Cd.
DiscussionDistribution pattern of the metals in ginger samplesMineral uptake in plants is a function of mineral concentra-tions in soils, soil pH, cation exchange capacity, organicmatter content, types and varieties of plants, and age of theplant (Jung 2008). As it can be seen from Table 3, there islarge difference in concentration of different metals withinginger sample and slight variation in metals of the sametype along with geographical location. The range of concen-tration (in mg/kg) pattern of elements in ginger sample col-lected from four sampling area is given in Table 3.Ginger contained higher amount of Mg (2700–4090
mg/kg), followed by Ca (2000–2540 mg/kg). The higherlevels of Mg in the ginger is probably due to the fact thatnutrient elements such as N, P, K, S, and Mg are highly mo-bile in the plant tissue and trans-located from old plant tis-sue to new plant tissue. The other probable reason forhigher concentration of Mg and Ca is if the soil which havebeen used for cultivating the plant, are highly fertilized withmanure and organic residues, K, Ca and Mg are highly avail-able for plant uptake. Hence, the plant has high amount ofthese metals.Mn (184–401 mg/kg) was the most accumulated trace
metal followed by Fe (41.8–89.0 mg/kg) and Zn (38.5–55.2 mg/kg) in ginger sample. Higher Mn levels in theginger may be attributed to the availability of this micronu-trient heavy metal in relatively acidic soils of the farmland.The chemical forms of Mn present in soil are known to de-pend on soil pH. In acidic soil, the easily absorbed form,

Table 3 Average concentration (mean ± SD, n = 3, μg/g dry weight basis) of major, trace and toxic metals in gingersamples from Tepi, Bombae, Hadaro and Illubabur
Metal Average concentration (mean ± SD, n = 3, μg/g dry weight basis)
Tepi ginger Bombae ginger Hadaro ginger Illubabur ginger
Ca 2000 ± 47 2540 ± 93 2190 ± 24 2490 ± 41
Mg 2990 ± 9 2700 ± 57 2760 ± 11 4090 ± 105
Cu 4.78 ± 0.34 1.86 ± 0.18 2.53 ± 0.19 1.10 ± 0.05
Zn 55.2 ± 3.9 39.6 ± 0.5 38.5 ± 0.5 54.0 ± 2.7
Mn 385 ± 9 285 ± 4.3 184 ± 3.6 401 ± 12
Ni 5.61 ± 0.44 5.46 ± 0.48 6.78 ± 0.53 8.40 ± 0.32
Fe 44.2 ± 3.3 55.4 ± 5.0 41.8 ± 2.8 89.0 ± 6.1
Co 7.58 ± 0.46 5.68 ± 0.40 2.04 ± 0.14 2.18 ± 0.18
Cr 9.28 ± 0.61 6.02 ± 0.14 9.17 ± 0.62 10.8 ± 0.2
Cd 0.97 ± 0.08 0.38 ± 0.02 0.38 ± 0.02 0.70 ± 0.07
Pb ND ND ND ND
ND: Concentration of the tested heavy metal was below the method detection limit.
Wagesho and Chandravanshi SpringerPlus (2015) 4:107 Page 7 of 13
Mn+2 released from soil by H+, which is produced fromNH4
+ (Zubillaga et al. 2008), can be readily taken up and ac-cumulated in the ginger.It has been reported that Fe and Zn are the main ele-
ments that plant could accumulate and pass up in thefood chain. Therefore, the high concentration of Znfrom trace metals next to Mn and Fe in ginger may bebecause of the fact that these ions are readily transferredfrom the soil to plants, and accumulated in plants.The levels of other essential trace metals detected in gin-
ger were Co (2.04–7.58 mg/kg), Ni (5.61–8.40 mg/kg), Cr(6.02–10.8 mg/kg) and non-essential heavy metals Cd(0.38–0.97 mg/kg). The level of Cd was the least amongthe metals; however due to its toxicity deserves specialconcern. The non-essential heavy metal, Pb, was found tobe below the method detection limit. In general the
Table 4 Average concentration (mean ± SD, n = 3, μg/g dry wesamples from Tepi, Bombe, Hadaro and Illubabur
Metal Average concentration (mean ± SD, n = 3, μg/g
Tepi soil Bombae soil
Ca 3580 ± 16 2060 ± 10
Mg 2430 ± 141 1460 ± 45
Cu 33.9 ± 0.5 3.76 ± 0.07
Zn 389 ± 36 344 ± 28
Mn 6470 ± 81 1760 ± 26
Ni 79.3 ± 1.2 14.1 ± 0.3
Fe 46900 ± 600 21800 ± 821
Co 159 ± 2.8 57.1 ± 2.1
Cr 139 ± 12 110 ± 7.6
Cd 1.08 ± 0.08 0.24 ± 0.02
Pb ND ND
ND: Concentration of the tested heavy metal was below the method detection limi
concentration pattern of metals in ginger was decreased asMg > Ca >Mn > Fe > Zn > Cr > Ni > Co > Cu > Cd.As it can be seen from Table 3, ginger are a good
source of major and trace metals that are essential tohuman in addition to its food flavouring purpose. Thesmall amount of Co and Cu found in ginger does notcontradict with the requirement of the metal for properfunctioning of the body, because these metals are re-quired in small amount (Co = 0.3 mg/day as a constitu-ent of vitamin B12 and Cu = 3.5 mg/day).
Daily intake of metals from gingerDaily intake of metals from ginger has been calculatedbased on the assumption that an adult person consumes5 g fresh ginger per day in different form. The moisturecontent of Ethiopian fresh ginger was found in the range
ight basis) of major, trace and toxic elements in soil
dry weight basis)
Hadaro soil Illubabur
2040 ± 43 1770 ± 39
1660 ± 8 2440 ± 8
6.77 ± 0.17 33.7 ± 0.8
255 ± 14 413 ± 39
1920 ± 28 4680 ± 32
21.4 ± 1.0 73.1 ± 4.7
21700 ± 407 46170 ± 484
48.5 ± 0.6 132 ± 1.9
114 ± 1.8 163 ± 2.5
0.73 ± 0.06 1.20 ± 0.07
ND ND
t.

Table 5 Comparison of daily intake of metals from ginger with recommended daily intake and tolerable upper limit ofdaily intake of metals (NebGuide 2015)
Metal Daily intake from ginger (mg/day) Recommended daily intake (mg/day) Allowable upper limit (mg/day)
Ca 2.36 1000 2500
Mg 2.00 400 350
Cu 0.0195 2 10
Zn 0.350 0.150 40
Mn 3.71 2 11
Ni 0.047 NA 1
Fe 34.1 18 45
Co 0.0992 NA NA
Cr 0.132 0.120 NE
Cd 0.000813 None 0.0714
Pb ND None None
NA = data not available. NE = not established. ND = not detected.
Table 6 Accumulation coefficient of metals from the soilto ginger
Metal Sampling sites
Tepi Bombae Hadaro Illubabur
Ca 0.56 1.23 1.07 1.41
Mg 1.23 1.85 1.66 1.68
Cu 0.14 0.49 0.37 0.032
Zn 0.14 0.12 0.15 0.13
Mn 0.060 0.16 0.096 0.086
Ni 0.071 0.40 0.32 0.11
Fe 0.00094 0.0025 0.0019 0.0019
Co 0.048 0.099 0.042 0.017
Cr 0.067 0.055 0.080 0.066
Cd 0.90 1.58 0.52 0.58
Wagesho and Chandravanshi SpringerPlus (2015) 4:107 Page 8 of 13
75–85% with a mean value of 80%. Thus the dry mass of5 g ginger is 1 g. The metal contents of 1 g dry ginger aregiven in Table 5. For comparison the recommended or ad-equate daily intake and the allowable upper limit of dailyintake of metals are also given in the Table 5. The data inthe table clearly show that the daily intake of Ca, Mg andCu are well below the recommended daily intake whileZn, Mn, Fe, and Cr exceed the recommended daily intakebut are well below the allowable upper limit of daily intakeof these metals. Daily intake of Ni and Co from Ethiopianginger is very small and well below the allowable daily in-take. Daily intake of toxic metal Cd from Ethiopian gingeris negligible and Pb is none (not present in Ethiopian gin-ger). Therefore, it can be concluded that Ethiopian gingeris good source of essential metals and free from toxicmetal and hence safe for human consumption.
Distribution pattern of metals in soil sampleThe soil sample collected from four sampling areas werefound to contain detectable metal content of Ca, Mg, Fe,Zn, Cu, Co, Cr, Mn, Ni, and Cd in all the four soil sam-ples and their values are given in Table 4. Among thedetermined metals, Pb was found to be below the detec-tion limit of the method used in this study. There is sig-nificant difference in concentration of different metalswithin soil sample and appreciable difference in thesame metals of different samples. The determined con-centration ranges of metals from four soil sampling areaare given in Table 4.As shown in Table 4, the concentration of Fe (21700–
46900 mg/kg) in soil exceeds much the concentration ofmacro-elements, Ca (1770–3580 mg/kg) and Mg (1460–2440 mg/kg), this is due to the presence of excess amountof hematite (Fe2O3) in the soil.Concentration of Mn (1760–6470 mg/kg) an essential
trace metal in these soils was higher when compared to
the micronutrient heavy metals Zn (255–413 mg/kg), Cu(3.76–33.9 mg/kg), Cr (110–163 mg/kg), Co (48.5–159 mg/kg) and Ni (14.1–79.3 mg/kg). On the otherhand, level of the toxic heavy metal Cd ranged from0.24–1.08 mg/kg. The level of Pb, the other tested toxicmetal, in soils of all the samples was found to be belowthe detection limit of the method used in this study. Ingeneral, the concentration pattern of metals in soil wasdecreased as Fe > >Mn > Ca >Mg > Zn > Cr > Co > Ni >Cu > Cd.
Comparisons of metal levels between ginger and soilsamplePlants absorb whatever is present in the soil mediumand therefore the metals are also absorbed and becomebio-accumulated in the roots, stems, fruits, grains andleaves of the plant, which may finally be transferred toman in the food chain. The sorption processes of metalsby plants is significantly affected by metal level in the
Wagesho and Chandravanshi SpringerPlus (2015) 4:107 Page 9 of 13
soil, soil pH, the presence of competing ligands, theionic strength of the soil solution and the simultaneouspresence of competing metals (Zubillaga et al. 2008).In this work, comparative study has been established
to correlate the metal level of ginger with the soil whereit has grown. As it can be seen from Tables 3 and 4, formost elements (Mg, Mn, Zn, Fe (except in Tepi sample),Cu (except in Illubabur sample), Cr, and Cd) the metallevels of ginger was directly proportional to the metallevels of soil where it has grown. Taking the level of Mgas an example in both ginger and soil samples, the Mglevel of ginger sample from Illubabur > Tepi > Hadaro >Bombae and the same order is true for Mg level of re-spective soil sample. This relation partly verifies that themetal content of the plant is a function of the metal levelin the soil where it has grown. For the rest three metals(Ca, Ni and Co), the metal levels in some sampling area
Table 7 Comparison of determined metals concentration (mg
Metal Concentration (mg/kg)
Ca 1700
2610
2001-2543
Mg 4210
9200
2700-4094
Mn 368
313
184-401
Fe 217
19.4
41.8-89.0
Zn 72.53
38.5-55.2
Ni 108
5.61-8.40
Co 0.32
2.04-7.58
Cu 4.47
1.10-4.78
Cr 0.47
0.5
6.02 − 10.8
Cd 0.12
0.07
0.38-0.97
Pb <0.021
ND
ND: Concentration of the tested heavy metal was below the method detection limi
of ginger were varies non-proportional to levels of metalin the corresponding soil. This non-proportional vari-ation in level of metals in ginger and soil may be re-sulted from the difference in availability of absorbableform of metals in soil due to difference in soil acidity orthe presence of competing ligands. The accumulationfactors of the metals from soil to ginger are given inTable 6.For most metals there was large difference in concentra-
tion of the same metals in different ginger sample (for ex-ample the concentration of Mg, Mn, Zn, Fe, and Cd ofIllubabur and Tepi sample were higher than the othersample sites), this may be attributed to the difference inmineral concentration, the pH and organic matter contentof the respective soil. The other probable reason is thatthe Tepi and Illubabur sample sites are near to the cityand may be such differences are observed as a result of
/kg, dry mass basis) with reported values
Country Reference
India (Devi et al. 2008)
Nigeria (Ogunwandea and Olawore 2004)
Ethiopia This study
Nigeria ( Ogunwandea and Olawore 2004)
India (Devi et al. 2008)
Ethiopia This study
Nigeria ( Ogunwandea and Olawore 2004)
India (Devi et al. 2008)
Ethiopia This study
India (Devi et al. 2008)
Saudi Arabia (Alwakeel 2008)
Ethiopia This study
India (Devi et al. 2008)
Ethiopia This study
Nigeria (Obiajunwa et al. 2002)
Ethiopia This study
Saudi Arabia (Al-Eed et al. 2002)
Ethiopia This study
India (Devi et al. 2008)
Ethiopia This study
Pakistan (Hashmi et al. 2005)
Pakistan (Hashmi et al. 2007)
Ethiopia This study
Nigeria (Aiwonegbe and Ikhuoria 2007)
Saudi Arabia (Al-Eed et al. 2002)
Ethiopia This study
Nigeria (Aiwonegbe and Ikhuoria 2007)
Ethiopia This study
t.

Wagesho and Chandravanshi SpringerPlus (2015) 4:107 Page 10 of 13
higher population and industrial activities in cities andmunicipalities which lead to higher production of assortedwaste than in the rural settlements of Bombae andHadaro.
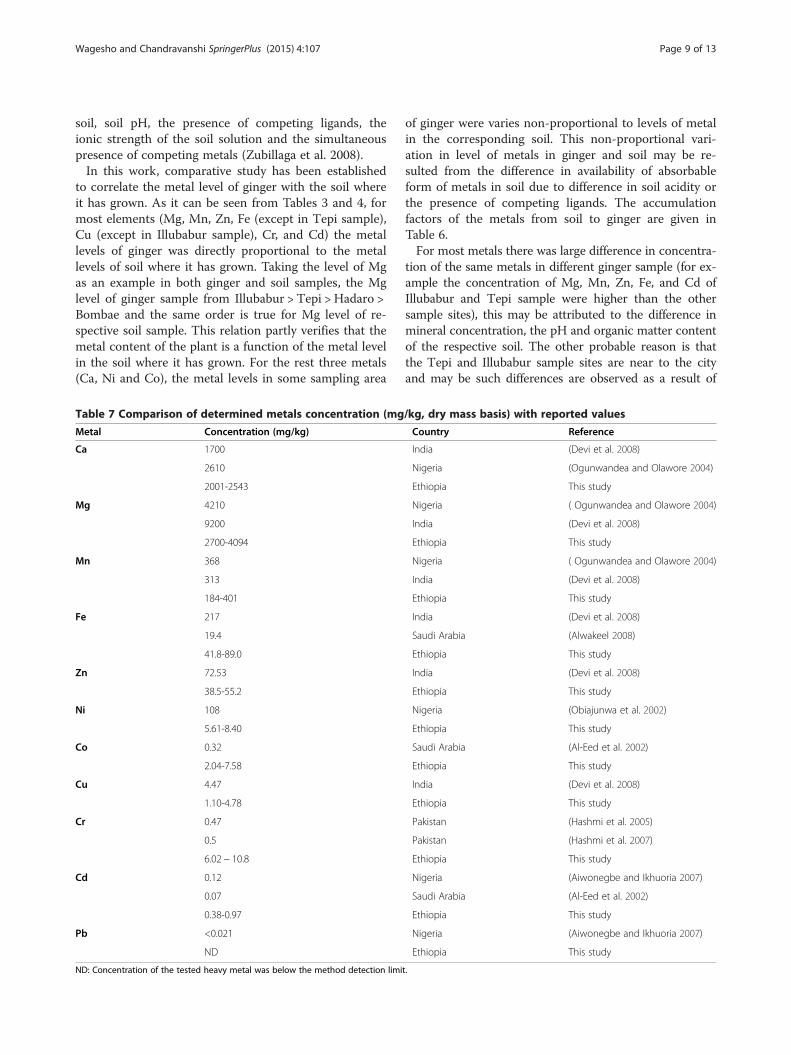
Comparison of levels of metal in ginger of this study withliterature valuesThe comparative study of the metal concentration of gin-ger determined in this study and reported values of otherresearchers are presented in Table 7. The Ca content ofEthiopian ginger is a bit higher than that of reported byDevi et al. (2008) and almost comparable to that of re-ported by Ogunwandea and Olawore (2004). The level ofMg of this study is comparable to those studied in Nigeria(Ogunwandea and Olawore 2004) but much lower thanthose in India (Devi et al. 2008).Mn concentration in Ethiopian ginger is in the range
of 184–401 mg/kg and its values reported by Devi et al.(2008) and Obiajunwa et al. (2002) lies in this range.The Fe content reported in Saudi Arabia (Alwakeel2008) is less than the Fe content in Ethiopian ginger.However, the Fe content reported by Devi et al. (2008) ishigher than the result of the present study. The meanconcentration of Zn determined in this study is a bitlower than the value determined in India (Devi et al.2008). The content of Zn in Ethiopian ginger is above
Table 8 Analysis of variance (ANOVA) between and within gin
Metal Comparision SD df Fcalculated
Ca Between samples 255 3 4.96
Within samples 51.4 8
Mg Between samples 650 3 14.2
Within samples 45.6 8
Cu Between samples 1.58 3 8.32
Within samples 0.19 8
Zn Between samples 9.96 3 5.89
Within samples 1.69 8
Mn Between samples 100 3 13.8
Within samples 7.27 8
Ni Between samples 1.38 3 3.14
Within samples 0.44 8
Fe Between samples 21.7 3 5.09
Within samples 4.28 8
Co Between samples 2.72 3 9.38
Within samples 0.29 8
Cr Between samples 2.02 3 4.93
Within samples 0.41 8
Cd Between samples 0.29 3 7.25
Within samples 0.04 8
where, SD - is standard deviation of between sample and within sample and df - is
the permissible limit set by FAO/WHO in edible plants(27.4 mg/kg). However, according to Bowen and All-away, the range of Zn in agricultural products should bebetween 15 to 200 mg/kg (Jabeen et al. 2010).The Ni concentration in Ethiopian ginger is lower than
the Ni content determined in Nigeria (Obiajunwa et al.2002). The Ni content in Ethiopian ginger is higher thanthe permissible limit set by FAO/WHO in edible plants(1.63 mg/kg). However, Ni toxicity in human is not avery common occurrence because its absorption by thebody is very low (Jabeen et al. 2010).From Table 7, one can see that the concentration of
Cu in Ethiopian ginger is almost the same as the valuereported in India (Devi et al. 2008). The Cr content ofginger reported by Hashmi et al. (2005) and Hashmiet al. (2007) are less than the present result. The concen-tration of Cr in Ethiopian ginger is higher than the per-missible limit set by FAO/WHO in edible plants(0.02 mg/kg). Chronic exposure to Cr may result in liver,kidney and lung damage (Jabeen et al. 2010).The level of Co obtained in Ethiopian ginger is 2.04–
7.58 mg/kg, which is higher than the value reported inSaudi Arabia (Al-Eed et al. 2002). The Cd content inEthiopian ginger is 0.38–0.97 mg/kg, which is higherthan the Cd content determined in Nigeria (Aiwonegbeand Ikhuoria 2007) and Saudi Arabia (Al-Eed et al.
ger samples at 95% confidence level
Fcritical Remark
4.07 Significant difference between sample means
4.07 Significant difference between sample means
4.07 Significant difference between sample means
4.07 Significant difference between sample means
4.07 Significant difference between sample means
4.07 No significant difference between sample means
4.07 Significant difference between sample means
4.07 Significant difference between sample means
4.07 Significant difference between sample means
4.07 Significant difference between sample means
degree of freedom of between sample and within sample.
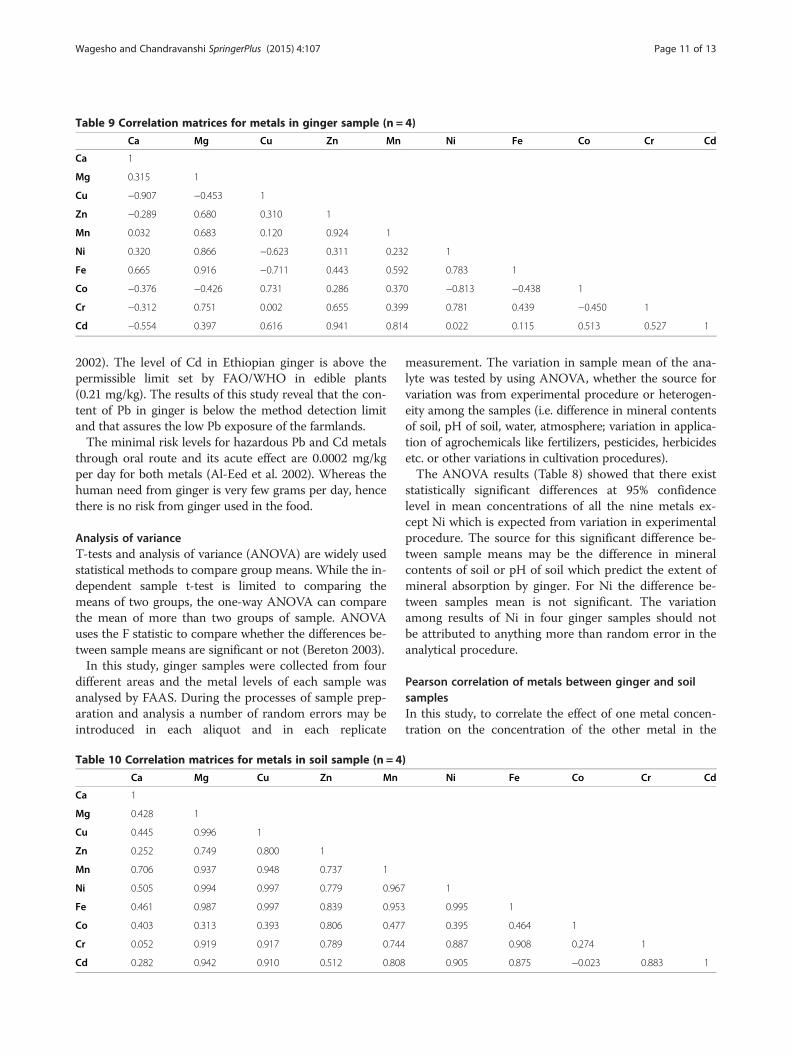
Table 9 Correlation matrices for metals in ginger sample (n = 4)
Ca Mg Cu Zn Mn Ni Fe Co Cr Cd
Ca 1
Mg 0.315 1
Cu −0.907 −0.453 1
Zn −0.289 0.680 0.310 1
Mn 0.032 0.683 0.120 0.924 1
Ni 0.320 0.866 −0.623 0.311 0.232 1
Fe 0.665 0.916 −0.711 0.443 0.592 0.783 1
Co −0.376 −0.426 0.731 0.286 0.370 −0.813 −0.438 1
Cr −0.312 0.751 0.002 0.655 0.399 0.781 0.439 −0.450 1
Cd −0.554 0.397 0.616 0.941 0.814 0.022 0.115 0.513 0.527 1
Wagesho and Chandravanshi SpringerPlus (2015) 4:107 Page 11 of 13
2002). The level of Cd in Ethiopian ginger is above thepermissible limit set by FAO/WHO in edible plants(0.21 mg/kg). The results of this study reveal that the con-tent of Pb in ginger is below the method detection limitand that assures the low Pb exposure of the farmlands.The minimal risk levels for hazardous Pb and Cd metals
through oral route and its acute effect are 0.0002 mg/kgper day for both metals (Al-Eed et al. 2002). Whereas thehuman need from ginger is very few grams per day, hencethere is no risk from ginger used in the food.
Analysis of varianceT-tests and analysis of variance (ANOVA) are widely usedstatistical methods to compare group means. While the in-dependent sample t-test is limited to comparing themeans of two groups, the one-way ANOVA can comparethe mean of more than two groups of sample. ANOVAuses the F statistic to compare whether the differences be-tween sample means are significant or not (Bereton 2003).In this study, ginger samples were collected from four
different areas and the metal levels of each sample wasanalysed by FAAS. During the processes of sample prep-aration and analysis a number of random errors may beintroduced in each aliquot and in each replicate
Table 10 Correlation matrices for metals in soil sample (n = 4
Ca Mg Cu Zn Mn
Ca 1
Mg 0.428 1
Cu 0.445 0.996 1
Zn 0.252 0.749 0.800 1
Mn 0.706 0.937 0.948 0.737 1
Ni 0.505 0.994 0.997 0.779 0.967
Fe 0.461 0.987 0.997 0.839 0.953
Co 0.403 0.313 0.393 0.806 0.477
Cr 0.052 0.919 0.917 0.789 0.744
Cd 0.282 0.942 0.910 0.512 0.808
measurement. The variation in sample mean of the ana-lyte was tested by using ANOVA, whether the source forvariation was from experimental procedure or heterogen-eity among the samples (i.e. difference in mineral contentsof soil, pH of soil, water, atmosphere; variation in applica-tion of agrochemicals like fertilizers, pesticides, herbicidesetc. or other variations in cultivation procedures).The ANOVA results (Table 8) showed that there exist
statistically significant differences at 95% confidencelevel in mean concentrations of all the nine metals ex-cept Ni which is expected from variation in experimentalprocedure. The source for this significant difference be-tween sample means may be the difference in mineralcontents of soil or pH of soil which predict the extent ofmineral absorption by ginger. For Ni the difference be-tween samples mean is not significant. The variationamong results of Ni in four ginger samples should notbe attributed to anything more than random error in theanalytical procedure.
Pearson correlation of metals between ginger and soilsamplesIn this study, to correlate the effect of one metal concen-tration on the concentration of the other metal in the
)
Ni Fe Co Cr Cd
1
0.995 1
0.395 0.464 1
0.887 0.908 0.274 1
0.905 0.875 −0.023 0.883 1

Table 11 Pearson correlation coefficient for metals in ginger with soil sample (n = 4)
Metal Ca Mg Cu Zn Mn Ni Fe Co Cr Cd
r −0.812 0.723 0.288 0.857 0.829 0.345 0.459 0.744 0.814 0.766
where, r is the Pearson correlation coefficient between metal level in ginger and metal level in soil.
Wagesho and Chandravanshi SpringerPlus (2015) 4:107 Page 12 of 13
same sample and to correlate the effect of the same metalconcentration of soil to that of ginger, the Pearson correl-ation matrices using correlation coefficient (r) for the sam-ples were used. The results are given in Tables 9 and 10.There is high positive correlation for Mg with (Ni, Zn,Mn, Fe and Cr), Cu with (Co and Cd), Zn with (Mn, Crand Cd), Mn with Cd, Ni with Cr and moderate correl-ation for Cr with Cd; which may be arise from commonanthropogenic or natural sources as well as from similarityin chemical properties. The high negative correlation be-tween Ca and Cu indicate the large absorption of Ca mayaffect the absorption of Cu in ginger plant. The othermetals have weak negative or positive correlation indicat-ing that the presence or absence of one metal affect inlesser extent to the other. In soil samples, there is highpositive correlation for all metals except Ca with (allmetals except Mn), Co with (all metals except Zn). Thelow negative or positive correlation of Ca and Co with theother metals in the soil samples may be associated withchemical properties like insoluble carbonates.As shown in Table 11, one can see that the more levels
of metals like Mg, Zn, Mn, Co, Cr and Cd in the soil,the more accumulation of corresponding metals in theginger. This verifies that the dependence of metal con-centration in the plant on metal concentration of re-spective soil.
ConclusionAn efficient digestion procedure for ginger and soil samplewas developed and validated through standard addition(spiking) method and a good percentage recovery wasobtained (100 ± 10%) for all minerals identified in ginger.The levels of metals in ginger determined in this
study could be put in the following order Mg (2700–4090 mg/kg) > Ca (2000–2540 mg/kg) >Mn (184–401 mg/kg) > Fe (41.8–89.0 mg/kg) > Zn (38.5–55.2 mg/kg)> Cr (6.02–10.8 mg/kg) >Ni (5.61–8.40 mg/kg) > Co (2.04–7.58 mg/kg) > Cd (0.38–0.97 mg/kg). The non-essentialtoxic heavy metal, Pb, was found to be below the methoddetection limit. The results of this work confess that gin-ger accumulates relatively higher amounts of Mg andMn among the determined macro- and micronutrients,respectively.The ANOVA results at 95% confidence level suggest
that there were significant difference in the mean con-centration of all metals except Ni between the four sam-pling areas which could be attributed to the difference inmineral contents of soil or pH of soil which predict theextent of mineral absorption by ginger. The soils of the
study farmland were found to contain high levels of Fefollowed by Mn, Ca, Mg, Zn, Cr, Co, Ni, Cu, Cd. Thelevel of Pb in soils of all sampling sites was found to bebelow detection limit of the method used in this study.In general, the levels of most of the metals in the stud-
ied soils were found to correlate positively with thelevels found in the ginger.
Competing interestsThe authors declare that they have no competing interests.
Authors’ contributionsYW contributed to the sampling and analysis. BSC contributed to the designof the study. YW and BSC contributed to the interpretation of data anddrafting the manuscript. BSC contributed to critical revision of the paper. Allauthors have read the manuscript and gave their final approval for thisversion of the manuscript to be published.
AcknowledgementsThe authors express their gratitude to the Department of Chemistry, AddisAbaba University, Addis Ababa, Ethiopia for providing laboratory facilities.YW is thankful to Department of Chemistry, Arbaminch College of TeachersEducation, Arbaminch, Ethiopia for sponsoring his study.
FundingThis work was funded by Research and Graduate Programs of Addis AbabaUniversity, Ethiopia. Research and Graduate Programs of Addis AbabaUniversity, Ethiopia had no role in the design, data collection, analysis orpublication of the manuscript.
Received: 5 January 2015 Accepted: 23 February 2015
ReferencesAiwonegbe AE, Ikhuoria EU (2007) Levels of selected heavy metals in some
Nigerian vegetables. Trends Appl Sci Res 2:76–79Al-Eed MA, Assubaie FN, El-Garawany MM, El-Hamshary H, Eltayeb ZM (2002)
Determination of heavy metal levels in common spices. J Appl Sci 17:87–98Alwakeel SS (2008) Microbial and heavy metals accumulation of herbal
medicines. Res J Microbiol 3:683–691Aregahegn A, Chandravanshi BS, Atlabachew M (2013) Mineral contents of fruits
of cactus pear (Opuntia ficus indica) grown in Ethiopia. Acta Hort (ISHS)979:117–126
Asfaw N, Abegaz B (1995) Chemical constituents of the essential oils of Zingiberofficinale Roscoe cultivated in Ethiopia. SINET Ethiop J Sci 18:133–135
Asfaw N, Demissew S (2009) Aromatic plants in Ethiopia. Shoma books,Addis Ababa, pp 27–185
Bereton RG (2003) Chemometrics: Data analysis for the laboratory and chemicalplant. John Wiley and Sons, London, pp 197–206
Chen M, Ma LQ (2001) Comparison of three aqua-regia digestion methods fortwenty florida soils. Soil Sci Soc Am J 65:491–499
Demirel S, Tuzen M, Saracoglu S, Soylak M (2008) Evaluation of various digestionprocedures for trace element contents of some food materials. J HazardMater 152:1020–1026
Derbie A, Chandravanshi BS (2011) Concentration levels of selected metals in theleaves of different species of thyme (T. schimperi and T. vulgaris) grown inEthiopia. Biol Trace Elem Res 141:317–328
Devi KN, Sarma HN, Kumar S (2008) Estimation of essential and trace elements insome medicinal plants by PIXE and PIGE techniques. Nucl Instr MethodsPhys Res B 266:1605–1610
Dubale AA, Chandravanshi BS, Gebremariam KF (2015) Levels of major and tracemetals in the leaves and infusions of Croton Macrostachyus. Bull Chem SocEthiop 29:11–26

Wagesho and Chandravanshi SpringerPlus (2015) 4:107 Page 13 of 13
Ebong GA, Akpan MM, Mkpenie VN (2008) Heavy metal contents of municipaland rural dumpsite soils and rate of accumulation by Carica papaya andTalinum triangulare in Uyo, Nigeria. E-J Chem 5:281–290
Endalamaw FD, Chandravanshi BS (2015) Levels of major and trace elements infennel (Foeniculum vulgari Mill) fruits cultivated in Ethiopia. Springer Plus 4:5,doi:10.1186/2193-1801-4-5
Gaudino S, Galas C, Belli M, Barbizzi S, Zorzi P, Jacimovic R, Jeran Z, Pati A,Sansone U (2007) The role of different soil sample digestion methods ontrace elements analysis: a comparison of ICP-MS and INAA measurementresults. J Qual Comp Reli Chem Measur 12:84–93
Gebre A, Chandravanshi BS (2012) Levels of essential and non-essential metals inRhamnus prinoides (Gesho) cultivated in Ethiopia. Bull Chem Soc Ethiop 26:329–342
Govindarajan VS (1982) Ginger − Chemistry, technology and quality evaluation:Part I. CRC Crit Rev 17:1–96
Grusak MA (2002) Enhancing mineral content in plant food products. J AmCollege Nutr 21:178–183
Hailemicheal G, Tilahun D, Etissa E (2008) Spices Research Achivements, Revisededn. Ethiopian Institute of Agricultural Research, Addis Ababa, pp 12–23
Harold HS, Leslie MK (2000) History of nutrition symposium: trace elementnutrition and human health. J. Nutr Sci 130:4835–4845
Hashmi DR, Khan FA, Shaikh GH, Usmani TH (2005) Determination of trace metalsin the vegetables procured from local markets of Karachi city by Atomicabsorption spectrophotometery. J Chem Soc Pak 27:353–357
Hashmi DR, Ismail S, Shaikh GH (2007) Assessment of the level of trace metals incommonly edible vegetables locally available in the markets of Karachi city.Pak J Bot 39:747–751
Huang L, Bell RW, Dell B, Woodward J (2004) Rapid nitric acid digestion of plant materialwith an open-vessel microwave system. Commun Soil Sci Plant Anal 35:427–440
Jabeen S, Shah MT, Khan S, Hayat MQ (2010) Determination of major and traceelements in ten important folk therapeutic plants of Haripur basin, Pakistan.J Med Plants Res 4:559–566
Jolad SD, Lantz RC, Solyom AM, Chen GJ, Bates RB, Timmermann BN (2004) Freshorganically grown ginger (Zingiber officinale): composition and effects onLPS-induced PGE2 production. Phytochemistry 65:1937–1954
Jung MC (2008) Heavy metal concentrations in soils and factors affecting metaluptake by plants in the vicinity of a Korean Cu-W mine. Sensors 8:2413–2423
Kitata RB, Chandravanshi BS (2012) Concentration levels of major and tracemetals in onion (Allium cepa L.) and irrigation water around Meki Town andLake Ziway, Ethiopia. Bull Chem Soc Ethiop 26:27–42
Lokeshwari H, Chandrappa GT (2006) Impact of heavy metal contamination ofbellandur lake on soil and cultivated vegetation. Curr Sci 91:622–627
Mekebo D, Chandravanshi BS (2014) Levels of essential and non-essential metalsin linseed (Linum usitatissimum) cultivated in Ethiopia. Bull Chem Soc Ethiop28:349–362
Minerals-Learn (2010) The role of minerals in maintaining a healthy body.Available at: http://www.expert-nutrition.com/minerals.html, accessed onMay 22, 2010.
Mishra P (2009) Isolation, spectroscopic characterization and molecular modelingstudies of mixture of curcuma longa, ginger and seeds of fenugreek. Int JPharmTech Res 1:79–95
Mitra S (2003) Sample Preparation Techniques in Analytical Chemistry. John Wileyand sons, Inc., Hoboken, pp 227–244
NebGuide (2015) Upper safe levels of intake for adults: vitamins and minerals.Available at: http://www.ianrpubs.unl.edu/pages/publicationD.jsp?publicationId=295, accessed on February 13, 2015
Obiajunwa EI, Adebajo AC, Omobuwajo OR (2002) Essential and trace element contentsof some Nigerian medicinal plants. J Radioanal Nucl Chem 252:473–476
Ogunwandea IA, Olawore NO (2004) Heavy trace metals and macronutrientsstatus in herbal plants of Nigeria. Food Chem 85:67–71
Pandey J, Pandey U (2009) Accumulation of heavy metals in dietary vegetables andcultivated soil horizon in organic farming system in relation to atmosphericdeposition in a seasonally dry tropical region of India. Environ Monit Assess148:61–74
Parthasarathy VA, Chempakam B, Zachariah TJ (2008) Chemistry of Spices. CABInternational, Wallingford, UK, pp 70–93
Uwah EI, Ndahi NP, Ogugbuaja VO (2009) Study of the levels of some agriculturalpollutants in soils, and water leaf (Talinum triangulare) obtained in Maiduguri,Nigeria. J Appl Sci Environ Sanit 4:71–78
Weldegebriel Y, Chandravanshi BS, Wondimu T (2012) Concentration levels ofmetals in vegetables grown in soils irrigated with river water in Addis Ababa,Ethiopia. Ecotoxicol Environ Saf 77:57–63
Wilson B, Braithwaite A, Pyatt FB (2005) An evaluation of procedures for thedigestion of soils and vegetation from areas with metalliferous pollution.Toxicol Environ Chem 87:335–344
Zingiber officinale (2010) Available at: http://www.allianceingredients.com/pdfdocs/ZINGIBER_OFFICINALE.PDF, accessed on February 25, 2010
Zubillaga MS, Bressan E, Lavad RS (2008) Heavy metal mobility in polluted soils:effect of different treatments. Am J Environ Sci 4:620–624
Submit your manuscript to a journal and benefi t from:
7 Convenient online submission
7 Rigorous peer review
7 Immediate publication on acceptance
7 Open access: articles freely available online
7 High visibility within the fi eld
7 Retaining the copyright to your article
Submit your next manuscript at 7 springeropen.com