Embed Size (px)
Citation preview

ORIGINAL RESEARCH https://doi.org/10.4209/aaqr.210026
Aerosol and Air Quality Research | https://aaqr.org 1 of 12 Volume 21 | Issue 6 | 210026
Aerosol and Air Quality Research
OPEN ACCESS Received: February 3, 2021 Revised: April 3, 2021 Accepted: April 7, 2021 * Corresponding Authors: Zhiyong Li [email protected] Xin Wang [email protected] Publisher: Taiwan Association for Aerosol Research ISSN: 1680-8584 print ISSN: 2071-1409 online
Copyright: The Author(s). This is an open access article distributed under the terms of the Creative Commons Attribution License (CC BY 4.0), which permits unrestricted use, distribution, and reproduction in any medium, provided the original author and source are cited.
Levels, Chemical Compositions, and Sources of PM2.5 of Rural and Urban Area under the Impact of Wheat Harvest Zhiyong Li1,2*, Ziyuan Yue1, Dingyuan Yang1, Lei Wang3, Xin Wang3*, Zhenxin Li1, Yutong Wang1, Lan Chen1,2, Songtao Guo1, Jinsong Yao1, Xiao Lou1, Xiaolin Xu1, Jinye Wei1 1 A Hebei Key Lab of Power Plant Flue Gas Multi-Pollutants Control, Department of Environmental Science and Engineering, North China Electric Power University, Baoding 071003, China 2 MOE Key Laboratory of Resources and Environmental Systems Optimization, Ministry of Education, Beijing 102206, China 3 Hebei Research Center for Geoanalysis, Baoding 071003, China
ABSTRACT
Wheat harvesting significantly alters the characteristics of PM2.5 in both rural regions and the
adjacent urban areas. We conducted a systematic PM2.5 sampling campaign at two sites, one rural (ARS) and the other urban (UA), in the center of the Beijing-Tianjin-Hebei megalopolis during and after the wheat harvest (WH). The PM2.5 concentrations at ARS and UA decreased from 156 to 75.5 µg m–3 and from 137 to 53.1 µg m–3, respectively, between the periods during (DWH) and after (AWH) the wheat harvest. The hysteresis of the PM2.5 peaks at UA confirmed the rural-to-urban migration of pollution. Additionally, we found high geo-accumulation index (Igeo) values for crustal elements at both sampling sites, indicating that the dust emissions originated from the WH. Between DWH and AWH, the share of soil dust in the PM2.5 decreased from 21.3% to 7.98% and from 9.40% to 6.75% at ARS and UA, respectively. Furthermore, the concentrations of the biomass burning markers Cl– and K+ increased from 5050 to 9370 µg g–1 and from 5480 to 8090 µg g–1 at ARS, respectively, and from 3360 to 6650 µg g–1 and from 3630 to 7500 µg g–1 at UA. Positive Matrix Factorization (PMF) identified six PM2.5 sources, viz., coal combustion (CC), vehicle exhaust (VE), industrial sources (ISs), biomass burning (BB), secondary inorganic aerosol (SIA), and fugitive dust (FD). FD dominated ARS during DWH and exhibited an increase at UA during AWH, and the contribution of BB at both sites rose between DWH and AWH, which can be ascribed to the burning of biomass for maize planting. Surprisingly, owing to the operation of harvesters and cultivators, the proportion of VE emissions was larger at ARS than UA. However, UA displayed a far greater percentage of industry-derived PM2.5, suggesting that local ISs should be controlled more strictly. Finally, the sizable share attributed to CC at both ARS and UA demonstrates the continued use of this fuel source, despite the governmental decree limiting it. Keywords: Wheat harvest, PM2.5, Elements and ions, PMF, Beijing-Tianjin-Hebei
1 INTRODUCTION
North China Plain (NCP), one of two largest agricultural bases in eastern China, where the behaviors include winter wheat harvest in June and subsequent open burning of agricultural residues in field for maize planting are common. Open burning of wheat straw prevails in NCP due to low cost, convenience and insecticidal effect despite the straw burning prohibition in recent China (Wang et al., 2015; Li et al., 2020a, 2020b; Zhang et al., 2020). Large amounts of fugitive dust release from the disturbance of dust absorbed in wheat straw and surface soil by harvesters,

ORIGINAL RESEARCH https://doi.org/10.4209/aaqr.210026
Aerosol and Air Quality Research | https://aaqr.org 2 of 12 Volume 21 | Issue 6 | 210026
wind, and cultivators (Li et al., 2020a, 2020b). Qiu and Pattey (2008) reported that the emission rate and factor for PM10 during WH period were up to 0.58 ± 0.12 g m–2 and 0.74 ± 0.12 kg ha–1, respectively. Exposure to high level of agricultural dust can result in adverse health effects including acute and chronic bronchitis, mucous membrane irritation, allergic asthma and hypersensitivity, etc. (Ou et al., 2020; Rao et al., 2020). Also the subsequent straw burning for maize planting can result in the releasing of drastic amounts of pollutants such as CO2, CO, NH3, non-methane hydrocarbon, elemental carbon, organic carbon, and particulate matter, which influence air quality, air visibility, human health, and the climate (Chen et al., 2018; Zhang et al., 2020). The carbonaceous aerosols related to biomass burning contribute approximately 42% and 74% of black carbon (BC) and organic carbon (OC) globally, in which open burning of biomass accounts for 95% and 88%, respectively (Yao et al., 2017). More than 50% emissions of PM2.5, OC, EC, K, K+, and Cl– in eastern China was associated with wheat straw burning (Li et al., 2014).
As a large agricultural country, China contributed more than 24% of global carbonaceous aerosols, especially from field burning of biomass. The particulate matter (PM) emissions related to agricultural operations has constituted an emerging issue about air quality, especially in the areas between rural and urban environments (Qiu and Pattey, 2008; Wang et al., 2015). Biomass burning has a significantly adverse effect on regional air quality, global climate change through complex feedbacks with radiation and clouds, and public health ascribed to exposure to the derived gaseous and aerosol particles (Wang et al., 2015; Li et al., 2020a, 2020b; Liu et al., 2020).
Winter wheat mainly planted in North China Plain especially in Beijing-Tianjin-Hebei (BTH) region. The straw burning for maize plants in June after wheat harvest was common behavior because of its low cost, convenience, and insecticidal effect (Wang et al., 2015; Li et al., 2020b). Li et al. (2020a, 2020b) reported the transport mode of air pollutants as “rural to urban” for particulate matters during wheat harvest and organic pollutants after wheat harvest due to the open burning of wheat straw.
To our knowledge, the current studies mainly focused on the emission factors of PM during wheat harvest or the impact of subsequent biomass burning on local and urban areas (Qiu and Pattey, 2008; Yao et al., 2017; Chen et al., 2018).
2 METHODOLOGY 2.1 Description of PM2.5 Sampling Sites and Campaign
The sampling locations had been shown in Li et al. (2021). Two collected sampling sites locate within Baoding Prefecture, which are an urban area (UA; 115°31ʹE, 38°53ʹN) in Baoding city and an adjacent rural site (ARS; 115°8ʹE, 38°40ʹN) in Wangdu County. Both UA and ARS locate in the central area of Beijing-Tianjin-Shijiazhuang triangle area. ARS within Wangdu County locates 58 km south of Baoding city. Wangdu County (115°01ʹ–115°18ʹE, 38°30ʹ–38°48ʹN), covers an area of 374 km2 and has a permanent population of 275,000 (including 229,000 agricultural population), which is a big agricultural county with the wheat planting area of 18,095 hectares.
Two medium-volume air samplers (TH-150C) setting at 100 L min–1 were used to consecutively collect PM2.5 samples from June 18 to July 7 for both UA and ARS, and each sampling process lasted for 23 h. The quartz filter (QF) with 90 mm diameter was used to the analysis of 9 inorganic ions including Ca2+, K+, Mg2+, Na+, NO3
–, SO42–, Cl–, F–, and NH4
+. Teflon filter (TEF) was adopted to calculate the PM2.5 mass by subtracting its pre-weight from post-weight and analyze 39 inorganic elements (IEs): Li, Be, Na, P, K, Sc, V, Cr, Mn, Co, Ni, Cu, Zn, As, Rb, Y, Mo, Cd, Sn, Sb, Cs, La, Ce, Sm, W, Tl, Pb, Bi, Th, Si, Al, Ca, Mg, Fe, Ti, Ba, Sr, and Zr. A series of field blank experiments were conducted to correct subsequent analysis deviation and ensure its accuracy. Both QFs and TEFs were purified prior to PM2.5 sampling. The heating temperature was set as 450°C and 60°C for QFs and TEFs before PM2.5 collections. A room with constant temperature of 20°C and relative humidity of 50% was used to store filters before and after sampling aiming to the obtainment of PM2.5 mass.
2.2 Analysis of PM2.5-associating Inorganic Elements
The detailed detection procedure documented in Li et al. (2019) was adopted in this study. An inductively coupled plasma mass spectrometry (ICP-MS) system (7500A Series; Agilent, USA) was

ORIGINAL RESEARCH https://doi.org/10.4209/aaqr.210026
Aerosol and Air Quality Research | https://aaqr.org 3 of 12 Volume 21 | Issue 6 | 210026
used to detect 30 IEs including Li, Be, Na, P, K, Sc, V, Cr, Mn, Co, Ni, Cu, Zn, As, Rb, Y, Mo, Cd, Sn, Sb, Cs, La, Ce, Sm, W, Tl, Pb, Bi, Ti and Th. The rest 7 IEs involving Si, Al, Ca, Mg, Fe, Ba, and Sr were analyzed by an inductively coupled plasma atomic emission spectroscopy (ICP-OES) system (5100 Series; Agilent, USA). For ICP-MS system, the half TEF filter was heated using the both aqua regia and hydrofluoric acid at 120°C and lasted for 2 h, and then ramped to 130°C for dryness. Then it was heated again with HCl acid and stored in a plastic comparison tube for analysis. For ICP-OES, the other half TEF filter was heated at 300°C and then raised to 550°C for completely ashing. Then it was heated together with added absolute ethanol and NaOH, and boiled with water later. Finally, 2 mL HCl was added and diluted to 10 mL for analysis. This study used the standard soil materials named as GBW07446–07457 purchased from Chinese Center for National Standard Material to ensure the accuracy of ICP-MS and ICP-OES. The method detection limits fluctuated from 0.10 ng of Be to 1800 ng of Fe. The relative standard deviation (RSD) values were in the range of 2.12–6.15%.
2.3 Analysis of PM2.5-associating Water-soluble Ions
In regard to water-soluble ions (WSIs), half QF filter was firstly put into the centrifuge tube and underwent 20 min ultrasonic extraction with 10 mL ultra-pure deionized water for three times, and then filtered by a TEF membrane with pore size as 0.22 µm (Whatman; Middlesex, UK). Finally, the extract was transferred into a plastic bottle and stored at 4°C before analysis.
ICS-1000 system (Thermo Scientific, USA) was used to detect SO42–, NO3
–, Cl–, and F–, and their MDLs were in the range of 0.005–0.012 µg mL–1. K+, Na+, Ca2+, and Mg2+ were analyzed using ICP-OES (725 Series; Agilent, USA) with the MDLs fluctuating from 0.002 to 0.025 µg mL–1. NH4
+ was measured using the ultraviolet-visible (UV–Vis) spectrophotometer (T6; Beijing General Instruments Co., Ltd) and its MDL was 0.01 µg mL–1. Standard solutions corresponding to these 9 ions were obtained from the Research Center of China National Standard Reference Materials.
2.4 Source Apportionment of PM2.5 by Positive Matrix Factorization
Positive Matrix Factorization (PMF) is a convenient multivariate factor analysis method based on non-negative constraints to get more practical factors (Yao et al., 2016). PMF version 5.0 available at the U.S. EPA website (https://www.epa.gov/air-research/positive-matrix-factorization-model-environmental-data-analyses) was applied to evaluate PM2.5 potential source contributions. The input data profiles include concentration and uncertainty values for 39 inorganic elements and 9 water-soluble ions. The abnormal concentration values were excluded to prevent error and uncertainty was calculated as Eqs. (1) and (2):
For ci ≤ MDL, unc = 5/6 × MDL (1) For ci ≥ MDL, unc = [(ci/5)2 + MDL2]0.5 (2)
The half of MDL was utilized to represent the corresponding mass content below MDL for chemicals. The geometric mean of the observed values was used as substitutes for missing values and four times the geometric mean represented their uncertainties (Zhang et al., 2015; Yao et al., 2016; Zong et al., 2016). A total of 20 runs were conducted for each chemical component. The lowest Qrobust value was 3088.20, and the ratio of Qrobust/Qtrue was 0.91.
A total of six emission sources including biomass burning (BB), coal combustion (CC), industrial sources (ISs), vehicle exhaust (VE), fugitive dust (FD), and secondary inorganic aerosol (SIA) were discriminated by PMF.
The BB was characterized by high loadings of Cl–, K, and K+. He et al. (2017) and Feng et al. (2018) reported that K+ and NH4
+ were commonly used markers for BB, and Cl– was also used to identify the activities of wood burning and agricultural residues. The factor with high contributions of Cu, Zn, and Pb was recognized as VE. Cu, Zn, and Pb were widely used as markers for VE (Xue et al., 2019). The motor brake wears were often associated with Cu and Pb, while Zn was related to tire wears (Liu et al., 2015). Pb could no longer be act as a single VE marker because of its sharply decreased concentrations owning to the prohibition of Pb containing gasoline (Li et al., 2020b). Coal combustion profile is expressed by high loadings of As, Sb, and Cd, and medium

ORIGINAL RESEARCH https://doi.org/10.4209/aaqr.210026
Aerosol and Air Quality Research | https://aaqr.org 4 of 12 Volume 21 | Issue 6 | 210026
concentrations of Pb and Tl (Li et al., 2016). As acting as a unique tracer of CC is frequently documented (Tao et al., 2014; Li et al., 2016; Yao et al., 2016). Pb, Sb, and Tl often released from coal combustion despite they are typical crustal elements (Zhang et al., 2014; Zong et al., 2016). The factor possessing high levels of water-soluble ions including NH4
+, NO3–, and SO4
2– is always associated with SIA (Yao et al., 2016). Suspended dust was common in cities and rural areas due to the dust from unpaved roads, construction sites, and bare soil around urban area heaped by wind. Fugitive dust in this study features by high contents of Al, Mg, Si, Ca, Ti, Fe, and Ba. Previous studies had used Al, Mg, Si, Ca, Fe, and Ti as markers for road dust and crustal soil (Harrision et al., 2012; Vossler et al., 2016). In UA, the ISs are marked by high contributions of a host metal elements including K, Cr, Mn, Cu, Zn, Rb, Mo, Cd, Co, Tl, Sn, Pb, and W. The elements Mn and Cr can be considered as the steel-associating metals (Tao et al., 2014; Li et al., 2016), while Zn and K are often related to iron and steel processing (Li et al., 2021). Cd and Co are also associated with steel processing or other metallic industrial processes (Mooibroek et al., 2011). Tl, Sn, Co and Cu were frequently used in electroplating industry, and Al and Cr were mainly used in small electroplating workshops (Lestari and Mauliadi, 2009). Fe, Mn, Zn, Cd, and Ni were also used as indicators of alloy industry. Li and Pb were often associated with battery manufacturing (Yu et al., 2011). A large number of electroplating and battery enterprises in Baoding further proved this inference. However, the ISs in rural area of Wangdu County differed from those of UA, which possessed lower contributions of Li and Pb due to the lack of local battery factories.
2.5 Geo-accumulation Indexes of Inorganic Elements (IEs)
A parameter, the geo-accumulation index (Igeo), was widely used to evaluate the pollution degrees of IEs (Li et al., 2017, 2019), which could be obtained by Eq. (3), where Cn are the contents of elements in PM2.5 and Bn are their soil background standard values in Hebei Province:
Igeo = Log2(Cn/Bn) (3)
The pollution levels of individual elements including uncontaminated, uncontaminated to
moderately contaminated, moderately contaminated, moderately to heavily contaminated, heavily contaminated, heavily to extremely contaminated, and extremely contaminated were identified according to the Igeo values of ≤ 0, 0–1, 1–2, 2–3, 3–4, 4–5, and > 5, respectively.
3 RESULT AND DISCUSSION 3.1 Levels of PM2.5, Water-soluble Ions, and Elements of UA and ARS
Fig. 1 showed the mass and volume concentrations for inorganic elements and water-soluble ions during DWH and AWH for ARS and UA. PM2.5 concentrations of UA fluctuated from 23.4 µg m–3 of June 22 to 200 µg m–3 of June 18 with a mean value as 87.7 µg m–3, and which ranged from 23.3 µg m–3 of July 1 to 155 µg m–3 of June 19 averaging at 66.3 µg m–3. It should be noted that higher PM2.5 levels appeared in ARS instead of UA indicating that the strong impact of wheat harvest activities on PM2.5 level (Qiu and Pattey, 2008; Zhang et al., 2020; Li et al., 2021). Generally, PM2.5 peaks appeared earlier in ARS than corresponding peaks of UA combining with air mass origin analysis of UA indicated that pollutant migration from rural to urban. Both UA and ARS possessed much higher PM2.5 concentrations in DWH compared with AWH, which implied that the influence of running of wheat harvesters and wheat transportation (Li et al., 2020a, 2020b, 2021). The average PM2.5 concentrations in DWH for ARS and UA were 156 and 137 µg m–3, which were well above the threshold value of 75 µg m–3 in the Chinese National Ambient Air Quality Standard Grade II (GB3095-2012). The PM2.5 levels (reported in µg m–3) in ARS and UA were much higher than 116 of Handan in 2014 (Meng et al., 2016), 108 of Hangzhou during 2014 to 2015 (Liu et al., 2015), 108 and 86.8 of Beijing in 2000–2009 and 2010–2016 (Xu et al., 2017; Zhu et al., 2018), 121 of Lanzhou in 2012 (Tan et al., 2017), 91.7 of Shijiazhuang in 2016 (Lang et al., 2018), 100.6 of Xinxiang in 2015 (Feng et al., 2018), 38.9 of Ningbo in 2014–2015 (Zhang et al., 2018), and 62.5 of a background site of North China Plain in 2011 (Yao et al., 2016). High PM2.5 concentrations caused by wheat harvest behaviors should be paid more attentions under the background of present downward trend of PM2.5 levels on a national scale (Li et al., 2020a, 2020b).

ORIGINAL RESEARCH https://doi.org/10.4209/aaqr.210026
Aerosol and Air Quality Research | https://aaqr.org 5 of 12 Volume 21 | Issue 6 | 210026
Fig. 1. (a) Time series of PM2.5 mass concentrations and (b) average PM2.5 levels during DWH and AWH for ARS and UA.
3.2 Time Series of Dust Levels and Trace Element Oxides Concerning the mass contents, the sum of 39 elements and 9 ions ranged from 134 mg g–1 of
June 30 to 963 mg g–1 of July 3 and averaged at 444 mg g–1 for ARS. They varied from 224 mg g–1 of July 5 to 951 mg g–1 of June 23 with a mean value of 450 mg g–1 for UA.
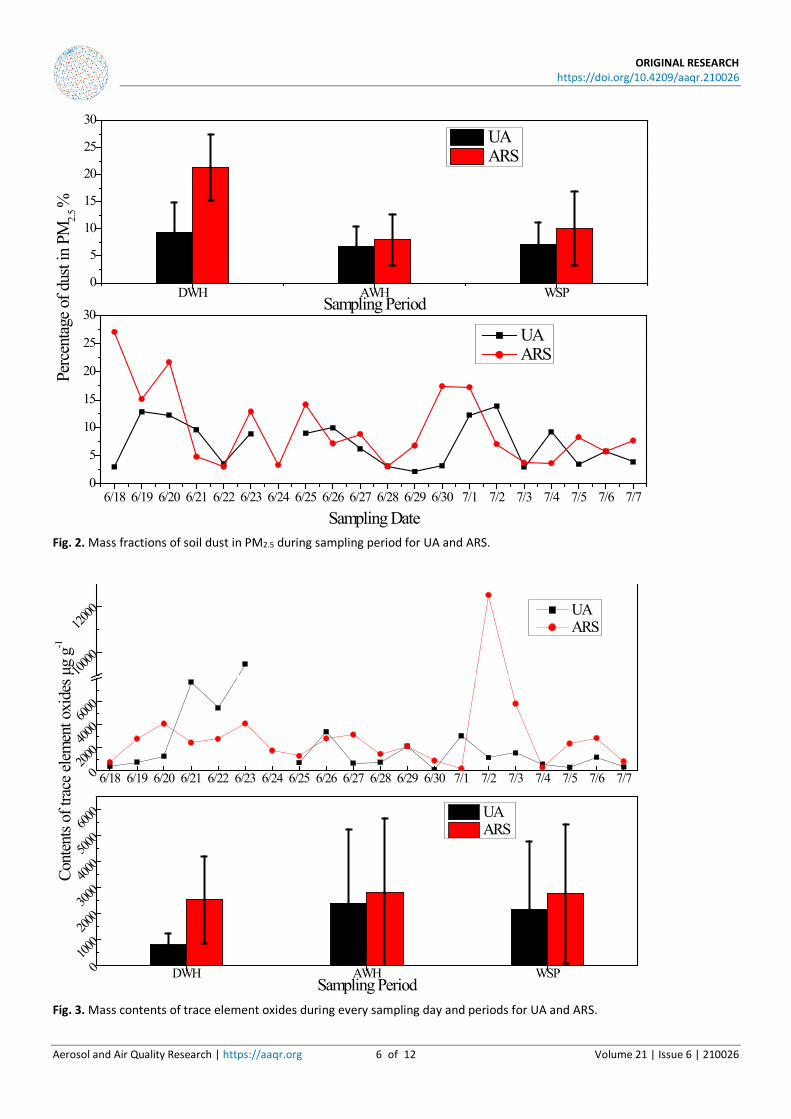
Si, Ca, Al, Fe, and Ti were major crustal elements and could be used to calculate the soil dust (SD) mass with the expression as [SD] = 1.89 × [Al] + 2.14 × [Si] +1.4 × [Ca]+1.43 × [Fe] + 1.66 × [Mg] + 1.67 × [Ti] (Su et al., 2017). Among crustal elements, the elements other than Si, Al, Fe, K, Ca, Mg, Na, and Ti were defined as trace elements. Trace element oxides (TEOs) were evaluated by TEO = 1.3 × [0.5 × (Sr + Ba + Mn + Co + Rb + Ni + V) + 1.0 × (Cu + Zn + Mo + Cd + Sn + Sb + Tl + Pb + As + Se + Ge + Cs + Ga)] (Zhang et al., 2013). Due to the lack of Se, Ge, Cs, and Ga, the TEO was underestimated slightly.
Figs. 2 and 3 showed the time series of soil dust mass shares and TEO contents in PM2.5, and the corresponding values during DWH, AWH, and WSP. Dust shares declined significantly from 9.40% to 6.75%, and from 21.3% to 7.98% for UA and ARS with the transition from DWH to AWH. It clearly evidenced that the wheat harvest behaviors caused the re-suspending of the dust absorption in wheat straws.
The dust mass contributions ranged from 3.06% of June 18 to 12.9% of June 19 and averaging at 7.17% during whole sampling period (WSP) for UA, while higher corresponding values varied from 3.07% of June 22 to 27.1% of June 18 with a mean value as 9.99% for ARS. Higher dust mass shares attributing to ARS reflected the emissions of large amounts of dust associating with wheat harvest. UA possessed much higher dust fractions of 9.40% than the 4.6% of a background site in NCP (Yao et al., 2016) and 6.4% of Chengdu in summer (Tao et al., 2014), which indicated the impact of wheat harvest activities of the adjacent rural areas on air PM2.5 compositions in urban areas. The average dust fraction 21.3% of ARS during DWH was also significantly higher than 13.2% of spring with frequent high concentrations of fugitive dust in a background site of NCP (Yao et al., 2016), which further proved the strong influence of wheat harvest behavior.
However, TEO contents exhibited the reverse variation trends: Higher values occurred during AWH instead of DWH. The TEO contents increased from 0.079% to 0.240% for UA, and from
6-18 6-19 6-20 6-21 6-22 6-23 6-24 6-25 6-26 6-27 6-28 6-29 6-30 7-1 7-2 7-3 7-4 7-5 7-6 7-7
0
50
100
150
200
250
300
PM2.
5 conc
entra
tion µg
m-3
ARS UA
Samping date
(a)
DWH AWH0
20406080
100120140160180200
Sampling period
UA ARS(b)
ORIGINAL RESEARCH https://doi.org/10.4209/aaqr.210026
Aerosol and Air Quality Research | https://aaqr.org 6 of 12 Volume 21 | Issue 6 | 210026
Fig. 2. Mass fractions of soil dust in PM2.5 during sampling period for UA and ARS.
Fig. 3. Mass contents of trace element oxides during every sampling day and periods for UA and ARS.
6/18 6/19 6/20 6/21 6/22 6/23 6/24 6/25 6/26 6/27 6/28 6/29 6/30 7/1 7/2 7/3 7/4 7/5 7/6 7/70
5
10
15
20
25
30DWH AWH WSP
0
5
10
15
20
25
30
Perc
entag
e of d
ust i
n PM
2.5 %
Sampling Period
UA ARS
Sampling Date
UA ARS
6/18 6/19 6/20 6/21 6/22 6/23 6/24 6/25 6/26 6/27 6/28 6/29 6/30 7/1 7/2 7/3 7/4 7/5 7/6 7/70200
0400
0600
0
10000
12000
UA ARS
Cont
ents
of tr
ace e
lemen
t oxi
des μ
g g-1
DWH AWH WSP0100
0200
0300
0400
0500
0600
0
Sampling Period
UA ARS
ORIGINAL RESEARCH https://doi.org/10.4209/aaqr.210026
Aerosol and Air Quality Research | https://aaqr.org 7 of 12 Volume 21 | Issue 6 | 210026
0.254% to 0.280% along with the transition from DWH to AWH. Large amounts of trace elements emitted from wheat straw burning resulted in high TEO contents during AWH. Tao et al. (2014) and Zong et al. (2016) indicated that the biomass burning was an important source of trace elements. The TEO contents in UA and ARS were much lower than 7.2% of the adjacent Shijiazhuang in 2016, indicated the effectiveness of coal limitation and control of industrial emissions (Lang et al., 2016). At the same time, higher TEO levels belonged to ARS instead of UA further verified the validity of the reduction measures adopted in industrial sources. Li et al. (2020a, 2020b, 2021) implied large industrial emissions of TEO from industries. 3.3 Igeo Values for the Inorganic Elements
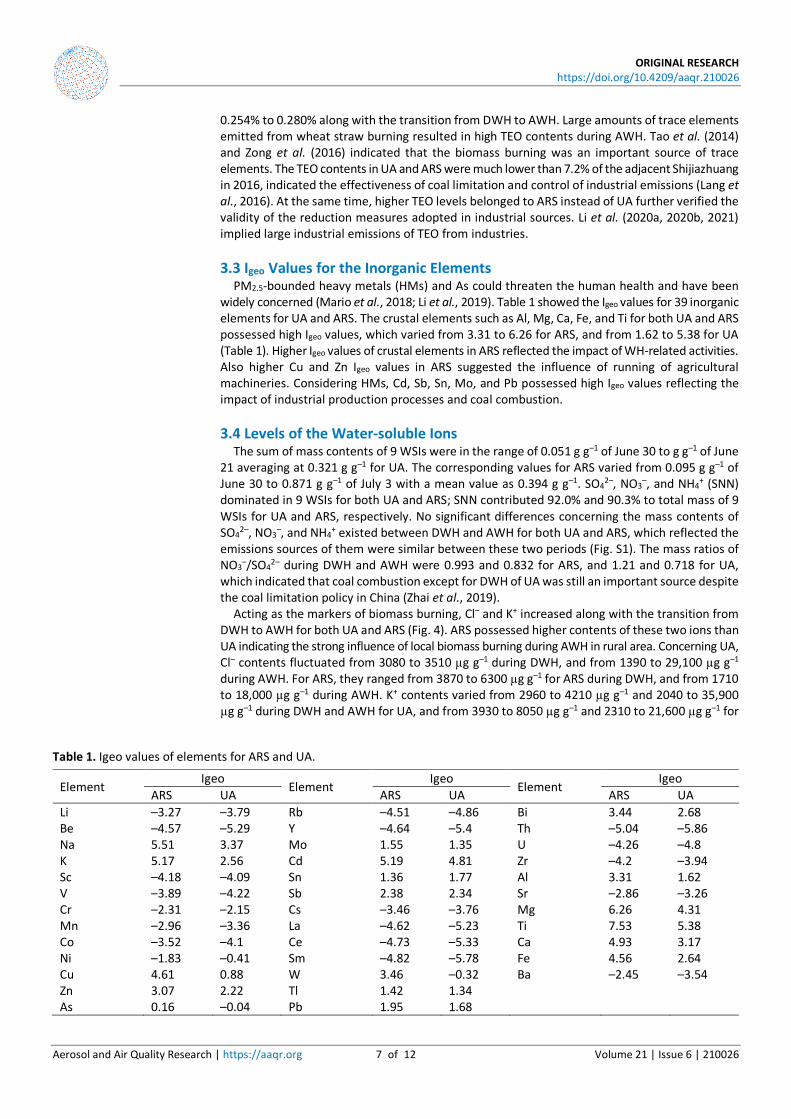
PM2.5-bounded heavy metals (HMs) and As could threaten the human health and have been widely concerned (Mario et al., 2018; Li et al., 2019). Table 1 showed the Igeo values for 39 inorganic elements for UA and ARS. The crustal elements such as Al, Mg, Ca, Fe, and Ti for both UA and ARS possessed high Igeo values, which varied from 3.31 to 6.26 for ARS, and from 1.62 to 5.38 for UA (Table 1). Higher Igeo values of crustal elements in ARS reflected the impact of WH-related activities. Also higher Cu and Zn Igeo values in ARS suggested the influence of running of agricultural machineries. Considering HMs, Cd, Sb, Sn, Mo, and Pb possessed high Igeo values reflecting the impact of industrial production processes and coal combustion.
3.4 Levels of the Water-soluble Ions
The sum of mass contents of 9 WSIs were in the range of 0.051 g g–1 of June 30 to g g–1 of June 21 averaging at 0.321 g g–1 for UA. The corresponding values for ARS varied from 0.095 g g–1 of June 30 to 0.871 g g–1 of July 3 with a mean value as 0.394 g g–1. SO4
2–, NO3–, and NH4
+ (SNN) dominated in 9 WSIs for both UA and ARS; SNN contributed 92.0% and 90.3% to total mass of 9 WSIs for UA and ARS, respectively. No significant differences concerning the mass contents of SO4
2–, NO3–, and NH4
+ existed between DWH and AWH for both UA and ARS, which reflected the emissions sources of them were similar between these two periods (Fig. S1). The mass ratios of NO3
–/SO42– during DWH and AWH were 0.993 and 0.832 for ARS, and 1.21 and 0.718 for UA,
which indicated that coal combustion except for DWH of UA was still an important source despite the coal limitation policy in China (Zhai et al., 2019).
Acting as the markers of biomass burning, Cl– and K+ increased along with the transition from DWH to AWH for both UA and ARS (Fig. 4). ARS possessed higher contents of these two ions than UA indicating the strong influence of local biomass burning during AWH in rural area. Concerning UA, Cl– contents fluctuated from 3080 to 3510 µg g–1 during DWH, and from 1390 to 29,100 µg g–1 during AWH. For ARS, they ranged from 3870 to 6300 µg g–1 for ARS during DWH, and from 1710 to 18,000 µg g–1 during AWH. K+ contents varied from 2960 to 4210 µg g–1 and 2040 to 35,900 µg g–1 during DWH and AWH for UA, and from 3930 to 8050 µg g–1 and 2310 to 21,600 µg g–1 for
Table 1. Igeo values of elements for ARS and UA.
Element Igeo
Element Igeo
Element Igeo
ARS UA ARS UA ARS UA Li –3.27 –3.79 Rb –4.51 –4.86 Bi 3.44 2.68 Be –4.57 –5.29 Y –4.64 –5.4 Th –5.04 –5.86 Na 5.51 3.37 Mo 1.55 1.35 U –4.26 –4.8 K 5.17 2.56 Cd 5.19 4.81 Zr –4.2 –3.94 Sc –4.18 –4.09 Sn 1.36 1.77 Al 3.31 1.62 V –3.89 –4.22 Sb 2.38 2.34 Sr –2.86 –3.26 Cr –2.31 –2.15 Cs –3.46 –3.76 Mg 6.26 4.31 Mn –2.96 –3.36 La –4.62 –5.23 Ti 7.53 5.38 Co –3.52 –4.1 Ce –4.73 –5.33 Ca 4.93 3.17 Ni –1.83 –0.41 Sm –4.82 –5.78 Fe 4.56 2.64 Cu 4.61 0.88 W 3.46 –0.32 Ba –2.45 –3.54 Zn 3.07 2.22 Tl 1.42 1.34 As 0.16 –0.04 Pb 1.95 1.68

ORIGINAL RESEARCH https://doi.org/10.4209/aaqr.210026
Aerosol and Air Quality Research | https://aaqr.org 8 of 12 Volume 21 | Issue 6 | 210026
Fig. 4. Contents of Cl– and K+ during each sampling day and period for UA and ARS.
ARS. However, the mass concentrations (reported in µg m–3) of Cl– and K+ showed the reverse trends: Higher values occurred during DWH for both UA and ARS attributing to high PM2.5 mass concentrations during DWH. Cl– and K+ mass concentrations for UA during DWH were 0.466 and 0.490 µg m–3, which were almost two times 0.241 and 0.274 µg m–3 for AWH. Higher corresponding values of Cl– and K+ appeared in ARS, which were 0.755/0.800 and 0.629/0.493 µg m–3 during DWH and AWH, respectively. The mass concentrations of Cl– and K+ (reported in µg m–3) for both UA and ARS were much lower than 3.69 and 1.18 for Shijiazhuang in autumn of 2016 (Lang et al., 2018), and 2.0 and 2.3 for Beijing in summer of 2012 (Zhang et al., 2016). Lower Cl– and K+ contents than some cities implied the effectiveness of emission control of related sources such as biomass burning and coal combustion (Li et al., 2020a, 2020b, 2021; Zhai et al., 2019).
SNN mass concentrations also exhibited the same trends with Cl– and K+: DWH possessed higher values due to its higher PM2.5 levels compared than AWH. DWH possessed higher SO4
2–, NO3
–, and NH4+ mass concentrations (reported in µg m–3) 21.7, 21.6, and 14.6 for ARS, and 15.0,
18.2 and 11.8 for UA. Lower corresponding values during AWH 9.11, 7.58, and 6.51, and 6.19, 4.44, and 4.32 appeared in ARS and UA, respectively. The SNN concentrations in UA and ARS were lower than 28.4, 34.6, and 13.1 of Beijing in summer of 2012 (Zhang et al., 2016).
3.5 Source Apportionment by PMF for UA and ARS
Fig. 5 showed the source fractions during DWH, AWH, and WSP. It should be noted that BB shares in ARS increased from 5.27% to 25.5% along with the DWH to AWH, and the corresponding shares enhanced from 1.68% to 14.4% for UA. The similar increasing trends between UA and ARS, and higher BB shares in ARS proved the impact of open biomass burning for maize planting after wheat harvest in rural areas (Li et al., 2020a, 2020b, 2021). Higher contribution of FD was attributed to ARS, which was 22.81% during whole sampling period. Under the wheat harvest activities, the
05000
1000015000200002500030000
6/18 6/19 6/20 6/21 6/22 6/23 6/24 6/25 6/26 6/27 6/28 6/29 6/30 7/1 7/2 7/3 7/4 7/5 7/6 7/70
500010000150002000025000300003500040000
UA ARSCl-
Mas
s con
tents,
µg
g-1
K+
DWH AWH0
2000
4000
6000
8000
10000Sampling Date
Cl- UA ARS
Sampling PeriodDWH AWH
0
2000
4000
6000
8000
10000
K+ UA ARS

ORIGINAL RESEARCH https://doi.org/10.4209/aaqr.210026
Aerosol and Air Quality Research | https://aaqr.org 9 of 12 Volume 21 | Issue 6 | 210026
Fig. 5. The contributions of six sources to the PM2.5 for ARS and UA.
adjacent UA also possessed considerable FD contribution of 22.0% during WSP. Higher FD share 26.8% occurred during DWH for ARS, while it was 24.5% during AWH for UA. More direct influence in rural area from WH-related activities such as running of wheat harvesters and wheat transportation was the explanation of higher FD shares during DWH for ARS. The surprised higher FD during AWH share 24.5% occurred in UA instead of ARS (22.1%) suggesting that urban areas possessed some unique FD sources such as extensive construction of buildings and road dust. At the same time, due to the highly intensive operation of large amounts of wheat harvesters and wheat transportation tractors, ARS possessed higher VE contributions than UA during DWH. However, VE shares during AWH in UA were higher than ARS, which might be associated with the decrease of operation intensity of harvesters. It was important to note that VE still occupying a high share during AWH for ARS, which might be related to the running of rotary cultivators for maize planting and vehicles for fertilizer transportation. Much higher IS contribution 30.9% occurred in UA during DWH and subsequently decreased to 19.9% due to the increasing shares of BB and FD. High IS shares should be concerned by local government, and strict emission standards and appropriate control measures were urgent to developed. The secondary inorganic aerosol was a key contributor for UA and ARS during both DWH and AWH. CC contributed 12.0% and 9.66% to the total PM2.5 mass for UA and ARS indicating coal was still an important fuel used in events including urban industrial production and rural cooking (Li et al., 2020a, 2020b, 2021).
The contributions of FD and BB in UA and ARS associating with wheat harvest were much higher than Shijiazhuang, background site of North China Plain, Chengdu, Nanjing, and Lanzhou (Table S1). The VE possessed higher shares in UA and ARS than abovementioned cities due to the operation of wheat harvesters and rotary cultivators.
4 CONCLUSIONS
To evaluate the effects of wheat harvesting in rural regions on the air quality in adjacent urban areas, we conducted a systematic PM2.5 sampling campaign at both a rural and an urban site (ARS

ORIGINAL RESEARCH https://doi.org/10.4209/aaqr.210026
Aerosol and Air Quality Research | https://aaqr.org 10 of 12 Volume 21 | Issue 6 | 210026
and UA, respectively) in the center of the Beijing-Tianjin-Hebei megalopolis during and after the harvest. We then analyzed the samples to evaluate 1) the PM2.5 concentrations; 2) the chemical components, specifically, 39 IEs and 9 WSIs; and 3) the differences between the two sites in terms of source contributions. 1) We observed higher PM2.5 concentrations at ARS than UA, but both sites showed elevated
levels during DWH (156 and 137 µg m–3 at ARS and UA, respectively) compared to AWH (75.6 and 53.1 µg m–3, respectively). In addition, the PM2.5 peaks appeared later at UA than ARS, demonstrating the rural-to-urban migration of pollution. Both locations also displayed higher Igeo values for the crustal elements than the other elements, confirming that the dust emissions originated from the wheat harvest.
2) Based on the IE content, dust composed 21.3% and 9.40% of the PM2.5 mass at ARS and UA during DWH, respectively, but only 7.98% and 6.75% during AWH, further confirming the migration effect. By contrast, the mass ratios of the TEOs to the PM2.5 increased from 0.254% to 0.280% and from 0.079% to 0.240% at ARS and UA, respectively, between DWH and AWH, because of straw burning emissions following the harvest.
3) The levels of the biomass markers Cl– and K+ rose significantly from DWH to AWH at both sites, which is attributable to the open burning of straw for maize planting. Specifically, the Cl– concentration varied 3870–6300 µg g–1 at ARS and 3080–3510 µg g–1 at UA during DWH but 1710–18,000 µg g–1 and 1390–29,100 µg g–1 during AWH, and the K+ concentration varied 3930–8050 µg g–1 at ARS and 2960–4210 µg g–1 at UA during DWH but 2310–21,600 µg g–1 and 2040–35,900 µg g–1 during AWH.
4) PMF revealed that the contribution of BB grew from 5.27% to 25.5% and from 1.68% to 14.4% at ARS and UA, respectively, between DWH and AWH. Furthermore, the share from FD peaked during DWH at ARS (26.81%) but during AWH at UA, mainly owing to the rural-to-urban transport time. Unexpectedly, the operation of agricultural machinery led to a higher proportion of VE emissions at ARS than UA. Lastly, CC accounted for 9.66% and 12.0% of the total PM2.5 mass at ARS and UA over the entire sampling period, respectively, proving that coal remains a common fuel for rural household cooking and urban industrial production.
ACKNOWLEDGEMENTS This study was supported by the Beijing Natural Science Foundation (8212034), the Natural
Science Foundation of Hebei Province (B2020502007), and the Fundamental Research Funds for the Central Universities (2020MS125).
SUPPLEMENTARY MATERIAL
Supplementary data associated with this article can be found in the online version at https://doi.org/10.4209/aaqr.210026
REFERENCES Chen, H.Y., Yin, S.S., Li, X., Wang, J., Zhang, R.Q. (2018). Analyses of biomass burning contribution
to aerosol in Zhengzhou during wheat harvest season in 2015. Atmos. Res. 207, 62–73. https://doi.org/10.1016/j.atmosres.2018.02.025
Feng, J.L., Yu, H., Mi, K., Su, X.F., Li, Y., Li, Q.L., Sun, J.H. (2018). One year study of PM2.5 in Xinxiang city, North China: Seasonal characteristics, climate impact and source. Ecotoxicol. Environ. Saf. 154, 75–83. https://doi.org/10.1016/j.ecoenv.2018.01.048
Harrison, R.M., Jones, A.M., Gietl, J., Yin, J.X., Green, D.C. (2012). Estimation of the contributions of brake dust, tire wear, and resuspension to nonexhaust traffic particles derived from atmospheric measurements. Environ. Sci. Technol. 46, 6523–6529. https://doi.org/10.1021/es300894r
He, Q.S., Yan, Y.L., Guo, L.L., Zhang, Y.L., Zhang, G.X., Wang, X.M. (2017). Characterization and source analysis of water-soluble inorganic ionic species in PM2.5 in Taiyuan city, China. Atmos. Res. 184, 48–55. https://doi.org/10.1016/j.atmosres.2016.10.008

ORIGINAL RESEARCH https://doi.org/10.4209/aaqr.210026
Aerosol and Air Quality Research | https://aaqr.org 11 of 12 Volume 21 | Issue 6 | 210026
Lang, J.L., Li, S.Y., Cheng, S.Y., Zhou, Y., Chen, D.S., Zhang, Y.Y., Zhang, H.Y., Wang, H.Y. (2018). Chemical characteristics and sources of submicron particles in a city with heavy pollution in China. Atmosphere 9, 388–407. https://doi.org/10.3390/atmos9100388
Lestari, P., Mauliadi, Y.D. (2009). Source apportionment of particulate matter at urban mixed site in Indonesia using PMF. Atmos. Environ. 43, 1760–1770. https://doi.org/10.1016/j.atmosenv. 2008.12.044
Li, H.Y., Guo, L.L., Cao, R.F., Gao, B., Yan, Y.L., He, Q.S. (2016). A wintertime study of PM2.5-bound polycyclic aromatic hydrocarbons in Taiyuan during 2009–2013: Assessment of pollution control strategy in a typical basin region. Atmos. Environ. 140, 404–414. https://doi.org/10.10 16/j.atmosenv.2016.06.013
Li, J.F., Song, Y., Mao, Y., Mao, Z.C., Wu, Y.S., Li, M.M., Huang, X., He, Q.C., Hu, M. (2014). Chemical characteristics and source apportionment of PM2.5 during the harvest season in eastern China's agricultural regions. Atmos. Environ. 92, 442–448. https://doi.org/10.1016/j.atmosenv.2014.0 4.058
Li, Z.Y., Wang, Y.T., Guo, S.T., Li, Z.X., Xing, Y.R., Liu, G.Q., Fang, R., Hu, Y., Zhu, H.T., Yan, Y.L. (2019). PM2.5 associated PAHs and inorganic elements from combustions of biomass, cable wrapping, domestic waste, and garbage for power generation. Aerosol Air Qual. Res. 19, 2502–2517. https://doi.org/10.4209/aaqr.2019.10.0495
Li, Z.Y., Guo, S.T., Li, Z.X., Wang, Y.T., Hu, Y., Xing, Y.R., Liu, G.Q., Fang, R., Zhu, H.T. (2020a). PM2.5 associated phenols, phthalates, and water soluble ions from five stationary combustion sources. Aerosol Air Qual. Res. 20, 61–71. https://doi.org/10.4209/aaqr.2019.11.0602
Li, Z.Y., Wang, Y.T., Li, Z.X., Guo, S.T., Hu, Y. (2020b). Levels and Sources of PM2.5-associated PAHs during and after the Wheat Harvest in a Central Rural Area of the Beijing–Tianjin–Hebei (BTH) Region. Aerosol Air Qual. Res. 20, 1070–1082. https://doi.org/10.4209/aaqr.2020.03.0083
Li, Z.Y., Li, Z.X., Yue, Z.Y., Yang, D.Y., Wang, Y.T., Chen, L., Guo, S.T., Yao, J.S., Wang, L., Lou, X., Xu, X.L., Wei, J.Y., Deng, B.L., Wu, H. (2021). Impact of wheat harvest on levels and sources of PM2.5-associated PAHs in an urban area located at the center of Beijing-Tianjin-Hebei region. Aerosol Air Qual. Res. 21, 200625. https://doi.org/10.4209/aaqr.200625
Liu, G., Li, J.H., Wu, D., Xu, H. (2015). Chemical composition and source apportionment of ambient PM2.5 in Hangzhou, China. Particuology 18, 135–143. https://doi.org/10.1016/j.partic.2014.03. 011
Liu, L.X., Cheng, Y.F., Wang, S.W., Wei, C., Pöhlker, M.L., Pöhlker, C., Artaxo, P., Shrivastava, M., Andreae, M.O., Pöschl, U., Su, H. (2020). Impact of biomass burning aerosols on radiation, clouds, and precipitation over the Amazon: Relative importance of aerosol-cloud and aerosol-radiation interactions. Atmos. Chem. Phys. 20, 13283–13301. https://doi.org/10.5194/acp-20-13283-2020
Mario, A., Mihaela, M., Massimo, D.I., Maurizio, G. (2018). Impact of emissions, meteorology and grid resolution on changes in HMs and PAHs concentrations between 2005 and 2010 in Italy. Aerosol Air Qual. Res. 18, 3165–3176. https://doi.org/10.4209/aaqr.2017.08.0262
Meng, C.C., Wang, L.T., Zhang, F.F., Wei, Z., Ma, S.M., Ma, X., Yang, J. (2016). Characteristics of concentrations and water-soluble inorganic ions in PM2.5 in Handan City, Hebei province, China. Atmos. Res. 171, 133–146. https://doi.org/10.1016/j.atmosres.2015.12.013
Mooibroek, D., Schaap, M., Weijers, E.P., Hoogerbrugge, R. (2011). Source apportionment and spatial variability of PM2.5 using measurements at five sites in the Netherlands. Atmos. Environ. 45, 4180–4191. https://doi.org/10.1016/j.atmosenv.2011.05.017
Ou, C.Y., Hang, J., Deng, Q.H. (2020). Particle deposition in human lung airways: Effects of airflow, particle size, and mechanisms. Aerosol Air Qual. Res. 20, 2846–2858. https://doi.org/10.4209/ aaqr.2020.02.0067
Qiu, G.W., Pattey, E. (2008). Estimating PM10 emissions from spring wheat harvest using an atmospheric trace technique. Atmos. Environ. 42, 8315–8321. https://doi.org/10.1016/j.atmo senv.2008.07.022
Rao, Y., Li, H.Y., Chen, M.X., Fu, Q.Y., Zhuang, G.S., Huang, K. (2020). Characterization of airborne microbial aerosols during a long-range transported dust event in Eastern China: Bacterial community, influencing factors, and potential health effects. Aerosol Air Qual. Res. 20, 2834–2845. https://doi.org/10.4209/aaqr.2020.01.0030
Su, X.L., Wang, Q., Li, Z.Q., Calvello, M., Esposito, F., Pavese, G., Lin, M.J., Cao, J.J., Zhou, C.Y., Li, D.H., Xu, H. (2017). Regional transport of anthropogenic pollution and dust aerosols in spring

ORIGINAL RESEARCH https://doi.org/10.4209/aaqr.210026
Aerosol and Air Quality Research | https://aaqr.org 12 of 12 Volume 21 | Issue 6 | 210026
to Tianjin – A coastal megacity in China. Sci. Total Environ. 584–585, 381–392. https://doi.org/ 10.1016/j.scitotenv.2017.01.016
Tan, J.H., Zhang, L.M., Zhou, X.M., Duan, J.C., Li, Y., Hu, J.N., He, K.B. (2017). Chemical characteristics and source apportionment of PM2.5 in Lanzhou, China. Sci. Total Environ. 601–602, 1743–1752. https://doi.org/10.1016/j.scitotenv.2017.06.050
Tao, J., Gao, J., Zhang, L., Zhang, R., Che, H., Zhang, Z., Lin, Z., Jing, L., Cao, J., Hsu, S.C. (2014). PM2.5 pollution in a megacity of southwest China: Source apportionment and implication. Atmos. Chem. Phys. 14, 8679–8699. https://doi.org/10.5194/acp-14-8679-2014
Vossler, T., Černikovský, L., Novák, J., Williams, R. (2016). Source apportionment with uncertainty estimates of fine particulate matter in Ostrava, Czech Republic using Positive Matrix Factorization. Atmos. Pollut. Res. 7, 503–512. https://doi.org/10.1016/j.apr.2015.12.004
Wang, L.L., Xin, J.Y., Li, X.R., Wang, Y.S. (2015). The variability of biomass burning and its influence on regional aerosol properties during the wheat harvest season in North China. Atmos. Res. 157, 153–163. https://doi.org/10.1016/j.atmosres.2015.01.009
Xu, L.L., Duan, F.K., He, K.B., Ma, Y.L., Zhu, L.D., Zheng, Y.X., Huang, T., Kimoto, T., Ma, T., Li, H., Ye, S.Q., Yang, S., Sun, Z.L., Xu, B.Y. (2017). Characteristics of the secondary water-soluble ions in a typical autumn haze in Beijing. Environ. Pollut. 227, 296–305. https://doi.org/10.1016/j.e nvpol.2017.04.076
Xue, H.Q., Liu, G.J., Zhang, H., Hu, R.Y., Wang, X. (2019). Similarities and differences in PM10 and PM2.5 concentrations, chemical compositions and sources in Hefei City, China. Chemosphere 220, 760–765. https://doi.org/10.1016/j.chemosphere.2018.12.123
Yao, H., Song, Y., Liu, M.X., Archer-Nicholls, S., Lowe, D., McFiggans, G., Xu, T.T., Du, P., Li, J.F., Wu, Y.S., Hu, M., Zhao, C., Zhu, T. (2017). Direct radiative effect of carbonaceous aerosols from crop residue burning during the summer harvest season in East China. Atmos. Chem. Phys. 17, 5205–5219. https://doi.org/10.5194/acp-17-5205-2017
Yao, L., Yang, L.X., Yuan, Q., Yan, C., Dong, C., Meng, C.P., Sui, X., Yang, F., Lu, Y.L., Wang, W.X. (2016). Sources apportionment of PM2.5 in a background site in the North China Plain. Sci. Total Environ. 541, 590–598. https://doi.org/10.1016/j.scitotenv.2015.09.123
Yu, Y., Schleicher, N., Norra, S.,Fricker, M., Dietze, V., Kaminski, U., Cen, K., Stuben, D. (2011). Dynamics and origin of PM2.5 during a three-year sampling period in Beijing, China. J. Environ. Monit. 13, 334–346. https://doi.org/10.1039/c0em00467g
Zhai, S.X., Jacob, D.J., Wang, X., Shen, L., Li, K., Zhang, Y.Z., Gui, K., Zhao, T.L., Liao, H. (2019). Fine particulate matter (PM2.5) trends in China, 2013-2018: Separating contributions from anthropogenic emissions and meteorology. Atmos. Chem. Phys. 19, 11031–11041. https://doi.org/10.5194/acp-19-11031-2019
Zhang, F.W., Xu, L.L., Chen, J.S., Chen, X.Q., Niu, Z.C., Lei, T., Li, C.M., Zhao, J.P. (2013). Chemical characteristics of PM2.5 during haze episodes in the urban of Fuzhou, China. Particuology 11, 264–272. https://doi.org/10.1016/j.partic.2012.07.001
Zhang, T.R., Jong, M.C.D., Wooster, M.J., Xu, W.D., Wang, L.L. (2020). Trends in eastern China agricultural fire emissions derived from a combustion of geostationary (Himawari) and polar (VIIRS) orbiter fire radiative power products. Atmos. Chem. Phys. 20, 10687–10705. https://doi.org/10.5194/acp-20-10687-2020
Zhang, Y., Huang, W., Cai, T.Q., Fang, D.Q., Wang, Y.Q., Song, J., Hu, M., Zhang, Y.X. (2016). Concentrations and chemical compositions of fine particles (PM2.5) during haze and non-haze days in Beijing. Atmos. Res. 174–175, 62–69. https://doi.org/10.1016/j.atmosres.2016.02.003
Zhang, Y.Y., Lang, J.L., Cheng, S.Y., Li, S.Y., Zhou, Y., Chen, D.S., Zhang, H.Y., Wang, H.Y. (2018). Chemical composition and sources of PM1 and PM2.5 in Beijing in autumn. Sci. Total Environ. 630, 72–82. https://doi.org/10.1016/j.scitotenv.2018.02.151
Zhu, Y., Huang, L., Li, J., Ying, Q., Zhang, H., Liu, X., Liao, H., Li, N., Liu, Z., Mao, Y., Fang, H., Hu, J. (2018). Sources of particulate matter in China: Insights from source apportionment studies published in 1987–2017. Environ. Int. 115, 343–357. https://doi.org/10.1016/j.envint.2018.03.037
Zong, Z., Wang, X.P., Tian, C.G., Chen, Y.J., Qu, L., Ji, L., Zhi, G.R., Li, J., Zhang, G. (2016). Source apportionment of PM2.5 at a regional background site in North China using PMF linked with radiocarbon analysis: Insight into the contribution of biomass burning. Atmos. Chem. Phys. 16, 11249–11265. https://doi.org/10.5194/acp-16-11249-2016