Embed Size (px)
Citation preview

LEVELING UP YOUR MOBILE GAME:
USING AUDIENCE MEASUREMENT DATA TO BOOST USER ACQUISITION AND ENGAGEMENT

LEVELING UP YOUR MOBILE GAME: USING AUDIENCE MEASUREMENT DATA TO BOOST USER ACQUISITION AND ENGAGEMENT Verto Analytics2
Introduction:
Section 1:
Section 2:
Section 3:
Section 4:
Section 5:
TABLE OF CONTENTS
Challenges and Opportunities for Mobile Game Developers
Sizing up the Mobile Gaming Market
The Explosive Growth of Mobile Games
Mobile versus Console Gaming?
Navigating the App Ecosystem
The Mechanics of Game Development and the Need for Marketing
The App Ecosystem Challenge
The Mobile Gamer: Demographics and Usage
Light Gamers and Heavy Gamers: Traits and Behaviors
Usage Patterns: The Average Mobile Game Day
Use Cases and Best Practices for Mobile Game Developers and Marketers
Use Case I: Refining Discovery and Download Tactics
Use Case II: Improving Mobile Game Adoption Performance
Use Case III: Segmenting Gamer Types
Conclusion and Key Takeaways
3
4
5
6
9
9
10
13
14
15
17
17
20
22
24

LEVELING UP YOUR MOBILE GAME: USING AUDIENCE MEASUREMENT DATA TO BOOST USER ACQUISITION AND ENGAGEMENT Verto Analytics3
INTRODUCTION:
Challenges and Opportunities for Mobile Game DevelopersWhether you’re a big-time game publisher or indie, new entrant or long-time player,
the challenges facing every mobile game developer today are similar: Get the right users
to discover and download your game, and then keep the attention of your audience as
long as possible.
However, these are not the only hurdles mobile game developers face. At Verto Analytics,
our single-source audience measurement solution allows us to track the same segment of
users and their usage patterns across every device, app, and platform they use throughout
the day. Because of this approach, we can clearly see some of the most persistent chal-
lenges for game developers in their quest to achieve market share. Specifically, almost all
game developers struggle to answer these questions:
• Do certain mobile games possess superior adoption characteristics?
• Which audience traits elicit passion and repeated use?
• Why do some games retain loyal users while others fade into obscurity?
Our audience measurement data, which focuses on mobile users, is especially relevant
now that the market has largely left console games behind. Consumers are downloading
and playing games on their mobile devices in staggering numbers, and the old stereotypes
about gamers (their age, gender, and the times they’re likely to be engaged with games, for
example) no longer apply. In a highly competitive market, we hope game developers and
marketers will leverage the statistical insights, audience measurement data, and analytical
strategies in this report to maximize user performance and monetary potential.

LEVELING UP YOUR MOBILE GAME: USING AUDIENCE MEASUREMENT DATA TO BOOST USER ACQUISITION AND ENGAGEMENT Verto Analytics4
SIZING UP THE MOBILE GAMING MARKET
Section 1:
How big is the mobile gaming market? Verto Analytics data reveals that 105.6 million U.S.
consumers now play mobile games via smartphones and tablets every month. This group
represents approximately 43 percent of the total U.S. population (ages 18 and older).
In the world of apps, mobile games are not the largest category, especially when compared
to social or shopping (Figure 1). However, the category possesses one extremely unique
characteristic—users spend an enormous amount of time engaged with mobile games
each month (Figure 2). Mobile gamers comprise 57 percent of all mobile app users.
Top Mobile Categories, Ranked by Audience Reach
Source: Verto Analytics, April 2016, Mobile Devices Only
Figure 1
Source: Verto Analytics, April 2016, Mobile Devices Only
Figure 2
Top Mobile Categories, Ranked by Monthly Time Spent
Verto Analytics defines a
mobile game in this report
as any app-based game
played on an internet-
enabled mobile device such
as a smartphone or tablet.
Social Networking
Utilities
Productivity
Lifestyle and Shopping
Photo and Video
Travel and Navigation
Entertainment
Games
Music and Audio
Finance
50% Reach 100% Reach
179,399,491
177,133,980
150,407,273
147,003,032
127,208,767
122,647,672
109,199,332
105,649,843
102,841,817
96,263,820
Social Networking
Games
Photo and Video
Utilities
Entertainment
Lifestyle and Shopping
Productivity
Travel and Navigation
Music and Audio
Finance
4.91 BN
1.15 BN
704 MM
660 MM
357 MM
304 MM
199 MM
173 MM
163 MM
54 MM
179,399,491
105,649,843
127,208,767
177,133,980
109,199,332
147,003,032
150,407,273
122,647,672
102,841,817
96,263,820
Aggregate Time Spent(Hours per month)

LEVELING UP YOUR MOBILE GAME: USING AUDIENCE MEASUREMENT DATA TO BOOST USER ACQUISITION AND ENGAGEMENT Verto Analytics5
The Explosive Growth of Mobile Games
Consider the following facts about the growth of mobile games:
• Mobile gaming revenue hit $30 billion worldwide in 2015, surpassing
console gaming at $26.4 billion. (Source: Newzoo)
• Active iOS consumers in the U.S. spent an average of $35 on apps in 2015,
70 percent ($25) of which was for games and in-app purchases within
games. (Source: IDC)
Verto Analytics data indicates that, while games rank eighth in overall reach, loyal
and passionate players help the category dominate in time spent (second overall) among
all app users (Figure 2). In the aggregate, U.S. app users spend an incredible 1.15 billion
hours each month playing games on smartphones and tablets. That’s approximately
12 percent of all monthly app time.
However, despite the enormity of the user base (105.6 million) and the amount of time that
users spend playing mobile games, today’s mobile game developer faces two immediate
challenges: fragmentation and new competitors.
Currently, only two individual games—Candy Crush Saga and Words with Friends—reach
5 percent of mobile app users each month (Figure 3). While leading mobile game devel-
opers such as Supercell, King, and Zynga are common fixtures among the ranks of top
performing games, few of their individual games (four at present) reach more than 3 percent
of all mobile app users.
U.S. app users spend an
incredible 1.15 billion hours each
month playing games
on smartphones and tablets
Top Mobile Games
Figure 3
1
2
3
4
5
6
7
8
9
10
Candy Crush Saga
Words With Friends
Candy Crush Soda Saga
Solitaire
Clash of Clans
Cookie Jam
Trivia Crack
Candy Crush Jelly Saga
Yahtzee With Buddies
Despicable Me
King
Zynga
King
MobilityWare
Supercell
SGN
Etermax
King
Scopely
Gameloft
12,598,973
12,549,077
8,114,555
7,881,945
6,113,596
6,024,079
5,763,985
4,581,438
3,933,836
3,295,849
5.09
5.07
3.28
3.18
2.47
2.43
2.33
1.85
1.59
1.33
RANK TITLE DEVELOPER USERS (#) REACH (%)
Source: Verto Analytics, April 2016, Ranked by Monthly Reach, Mobile Devices Only

LEVELING UP YOUR MOBILE GAME: USING AUDIENCE MEASUREMENT DATA TO BOOST USER ACQUISITION AND ENGAGEMENT Verto Analytics6
Gamer.biz confirms that the mobile gaming marketplace is crowded. As of April 2016, more
than half a million mobile games were available for download in the iOS App Store alone,
with approximately 300 new submissions arriving each day.
Even with such fierce competition for gamer attention, 77 mobile games currently deliver
an audience of one million or more monthly users. Of these, five games reach more than
five million players while another two games deliver audiences of more than 10 million
(Figure 4).
With such explosive user growth, mobile represents a rich and fertile ground for
attracting legions of new gamers and passionate fans.
For console game heavyweights, mobile represents a natural extension of their existing
game brands and franchises; and it’s no wonder they’re moving into mobile platforms
with full force. Microsoft, Sony, Ubisoft, Capcom, EA, and Nintendo have all adjusted their
development plans with the mobile gamer in mind. However, Nintendo and the rest will no
doubt experience similar challenges of getting users to discover and download their mobile
games—just like incumbent developers (including Supercell, King, and Zynga).
As more games and even more gamers emerge, expect more
mobile game titles (currently 77) to surpass the one million mark
in audience reach.
Figure 4
# OF MOBILE GAMESMOBILE GAMES USER DISTRIBUTION
10+ MM users
5-10 MM users
2-5 MM users
1+ MM users
2
5
16
54
Reach of Top Mobile Games, Mobile Devices Only
Source: Verto Analytics, April 2016. Reach of Top Mobile Games, Mobile Devices Only
Mobile versus Console Gaming?
Miitomo represents Nintendo’s first
foray into mobile gaming. It follows
Sony, Microsoft, EA, Ubisoft, and
other console game developers now
focusing on mobile.

LEVELING UP YOUR MOBILE GAME: USING AUDIENCE MEASUREMENT DATA TO BOOST USER ACQUISITION AND ENGAGEMENT Verto Analytics7
What’s the appeal of mobile gaming over traditional console gaming? We know that console
games typically offer higher-resolution graphics, faster action, and more immersive game-
play versus their mobile equivalents. However, at least three factors may be contributing
to the growing dominance of mobile:
Ease of access:
Console games are typically tethered to home-centric devices. By contrast,
mobile users can easily download games from an online app marketplace
practically anytime, anywhere, and start playing instantly. Words with Friends,
Candy Crush, Bejeweled, Angry Birds, etc., now help people fill the time
while commuting, waiting in line, taking long trips, or during any moment
inviting distraction.
Lower “initial” game costs:
While newly-released console titles may cost $60 or more, most mobile
games operate using dramatically different business models. Mobile games
tend to be either free (free to play) or low cost (paid). For example, Minecraft:
Pocket Edition is $6.99, while slither.io is free. Both offer in-app purchases. If
players wish to specialize or “speed up” gameplay, in-app purchase options
offer extra gems, coins, tokens, new levels, new characters, etc. In other
words, user impatience is rewarded.
2.
3.
Low cost of entry
Consoles and handhelds (PlayStation 4, Nintendo 3DS, etc.) require an upfront
technology investment. For mobile gaming, no extra device is required. Nearly
70 percent of U.S. consumers already own a smartphone, and 45 percent own a
tablet (Figure 5). If these multi-purpose devices are internet enabled, consumers
are already equipped to play most mobile games.
1.
Figure 5
% of U.S. adults who own the following devices
Device Ownership Trends—U.S. Adults 18+
100%
80
60
40
20
0’04 ’11 ’15 ’04 ’10 ’15
35
71
Cellphone
Smartphone
Desktop or laptop
Tablet computer
45
3
’04 ’10 ’15
73
92
65%
68
Source: Pew Internet, October 2015
Verto Analytics defines the
app marketplace in this paper
as the digital location where
mobile device users can
purchase/download apps: this
includes the Apple iOS App
Store and Google Play on the
Android platform.

LEVELING UP YOUR MOBILE GAME: USING AUDIENCE MEASUREMENT DATA TO BOOST USER ACQUISITION AND ENGAGEMENT Verto Analytics8
Words With Friends
Candy Crush Saga
Solitaire by MobilityWare
Daily Celebrity Crossword™
Candy Crush Soda Saga
Spider Solitaire Free by MobilityWare
Yahtzee With Buddies
2048
Trivia Crack
1010! Puzzle
Candy Crush Saga
Candy Crush Soda Saga
Words With Friends
Candy Crush Jelly Saga
Clash of Clans
Cookie Jam
Solitaire by MobilityWare
Trivia Crack
Farm Heroes Saga
Minecraft - Pocket Edition
APPLE APP STORERANK GOOGLE PLAY
1
2
3
4
5
6
7
8
9
10
Figure 6
Top ten game rankings of “paid” and “free to play” offerings in Apple
App Store and/or Google Play.
Despite mobile gaming’s rapid rise in recent years, their use has not displaced console
play; rather, it has extended the reach of established game brands, enhanced gameplay,
and helped expand the overall game-revenue pie.
Source: Verto Analytics, April 2016. Top Paid and Free To Play games for iOS and Android.

LEVELING UP YOUR MOBILE GAME: USING AUDIENCE MEASUREMENT DATA TO BOOST USER ACQUISITION AND ENGAGEMENT Verto Analytics9
NAVIGATING THE APP ECOSYSTEM
Section 2:
The Mechanics of Game Development and the Need for Marketing
As every game developer knows, not every mobile game will succeed in the market.
Competition is fierce (Figure 4) and, despite the enormity of the mobile gamer user base
(105.6 million), only two games—Candy Crush Saga and Words with Friends—manage to
reach 5 percent of mobile app users each month.
There is simply no guarantee that a game painstakingly developed and launched on one or
all of the current mobile app marketplaces will succeed. For every breakaway hit like Angry
Birds, Clash of Clans, or Candy Crush, thousands of well-designed mobile games still seek
the unique spark and sustained momentum that will drive adoption and loyalty.
In fact, according to a late-2015 survey conducted by InMobi (Figure 7), marketing is one
of the most challenging aspects of app development. When queried on the specific
marketing issues of importance, “discovery or awareness” and “finding the right users”
both rank at the top.
Most challenging aspect of app development Most challenging aspect of app marketing
Marketing
Design
Development
Distribution
Testing/QA
43%
21%
17%
11%
7%
Discoverability/Awareness
Acquiring the right users
Revenue model
App funding
Lack of transparency by app stores
43%
21%
17%
11%
7%
Source: InMobi Mobile Developer Survey, late 2015
Figure 7

LEVELING UP YOUR MOBILE GAME: USING AUDIENCE MEASUREMENT DATA TO BOOST USER ACQUISITION AND ENGAGEMENT Verto Analytics10
The App Ecosystem Challenge
HOW DO CONSUMERS DISCOVER MOBILE GAMES?
Three distinct stages connect users to the mobile games they play every month—discovery,
download, and adoption. It’s relatively easy for consumers to access and buy mobile games
(and all apps, for that matter). They simply go to the Apple App Store or Google Play via their
mobile device and make a purchase. We call this “nearly friction-free” access.
However, for app and game developers, the way consumers navigate the ecosystem poses
complications. True, nearly friction-free access means indie games like 2048, Flappy Bird, and
Crossy Road can achieve “hit status” and successfully compete among developer heavy-
weights such as Supercell, Zynga, Rovio, and King. On the other hand, how can a single mobile
game stand out among literally hundreds of thousands of available selections?
The reality is, all games are available on the same virtual store shelf. While this is great for
consumers, it’s considered by far the greatest challenge facing developers and their market-
ing partners (Figure 8). It’s very difficult to grab consumers’ attention, entice them to install a
game, and encourage them to use the game repeatedly.
According to our app marketplace attribution analysis, the largest portion of mobile game
discovery (67 percent) takes place directly within the app marketplace itself.
The ever-changing game rankings within can be influenced by any of the following:
• recent download trends,
• professional and peer reviews,
• search activity,
• category showcase activities, and more.
The remainder of mobile game discovery (37 percent) comes from external influences such as:
• general user search,
• advertising,
• social media channels,
• outside peer reviews,
• external links, and
• related non-app store referrals.
Source: Verto App WatchTM data, 18+ U.S. internet users, 2016
63%App storediscovery
37%Non-app store
discovery
Download AdoptionApp Discovery Usage Retention Monetization
Benchmarkinge�orts
Figure 8
The App Ecosystem Challenge

LEVELING UP YOUR MOBILE GAME: USING AUDIENCE MEASUREMENT DATA TO BOOST USER ACQUISITION AND ENGAGEMENT Verto Analytics11
GAME DOWNLOADS AND ADOPTION DATA
The challenges of mobile game adoption are real. Verto Analytics attribution analysis
reveals rapid declines in usage within the first 24 hours. Depending on the mobile game,
40 percent to 60 percent of users drop off within the first full day post download.
Moving beyond the first few days to 30 days post download, average retention figures drop
to between 10 percent and 20 percent of users who have successfully installed the game.
In other words, fewer than two out of every 10 successful game downloads retain users
after 30 days.
Tracking further out, the number of remaining users who participate in in-app pay features
within games apps is smaller still—typically representing less than 3 percent of all active
players. According to game research firm Game Analytics, in-app spending figures can be
as low as 0.2 percent of all users. This means that as few as two out of every 100 active
players make in-app purchases during the lifetime of their mobile game experiences.
Fewer than 20 percent of mobile gamers stick around after 30 days; even fewer make
in-app purchases. These two insights alone should sound the alarm to both game devel-
opers and marketers and underscore the necessity of tracking user behavior along every
stage of the app ecosystem.
Depending on the mobile game,
40 percent to 60 percent of users
drop off within the first full day
post download.
Less than 3 percent of active
players make in-app purchases.
Fewer than 20 percent of mobile
gamers stick around after 30
days; even fewer make
in-app purchases.
User Discovery and Adoption Rates
• 67 percent of mobile game discovery takes place directly within the app
marketplace itself.
• Fewer than two out of every 10 successful game downloads retain users
after 30 days.
• As few as two out of every 100 active players make in-app purchases
during the life time of their mobile game experiences.

LEVELING UP YOUR MOBILE GAME: USING AUDIENCE MEASUREMENT DATA TO BOOST USER ACQUISITION AND ENGAGEMENT Verto Analytics12
ADDRESSING THE APP ECOSYSTEM CHALLENGE
The app ecosystem is a mixed blessing for game developers. While nearly friction-free
app distribution offers quick access to consumers, it’s proving difficult to consistently
capture and retain them. Overcoming this challenge requires a better understanding of the
consumer journey at all stages of the app ecosystem—discovery, download, and adoption.
These elements are absolutely critical to meet the ultimate goals of sustained usage and
monetization. We will study this ecosystem in greater detail in Section 3.
Download: Tracking Cost per Install (CPI)
Moving users from discovery to
download is just the first step in a long
and continuing process of meeting
expected performance goals. To
improve download rates, many mobile
game developers typically set aside
marketing budgets to target prospec-
tive players via search, display ads,
social, etc.
Tracking the ROI of such budget spend
means using performance metrics
such as CPI (cost per install). CPI is
simply the average cost required to
obtain a single installation of a specific
app. This metric does not reflect actual
usage of the app; rather, it reflects the
average cost of obtaining a new app
install on a user’s device.
For example, according to mobile marketing firm Fiksu, as of February 2016, the CPI on
iOS platforms was $1.78, a year-over-year increase of 39 percent from 2015 (see Figure 9).
On Android, CPI was slightly higher versus iOS at $2.51, a 66 percent increase from this
same time last year.
Figure 9
Monthly “Cost per Install” Trends
Source: Fiksu CPI Index Trend, February 2016
$4.00
$3.50
$3.00
$2.50
$2.00
$1.50
$1.00
$0.50
$0.00
Feb2015
Mar2015
Apr2015
May2015
Jun2015
Jul2015
Aug2015
Sep2015
Oct2015
Nov2015
Dec2015
Jan2016
Feb2016
iOS Android
Fiksu CPI Index
LEVELING UP YOUR MOBILE GAME: USING AUDIENCE MEASUREMENT DATA TO BOOST USER ACQUISITION AND ENGAGEMENT Verto Analytics13
THE MOBILE GAMER: DEMOGRAPHICS AND USAGE
Section 3:
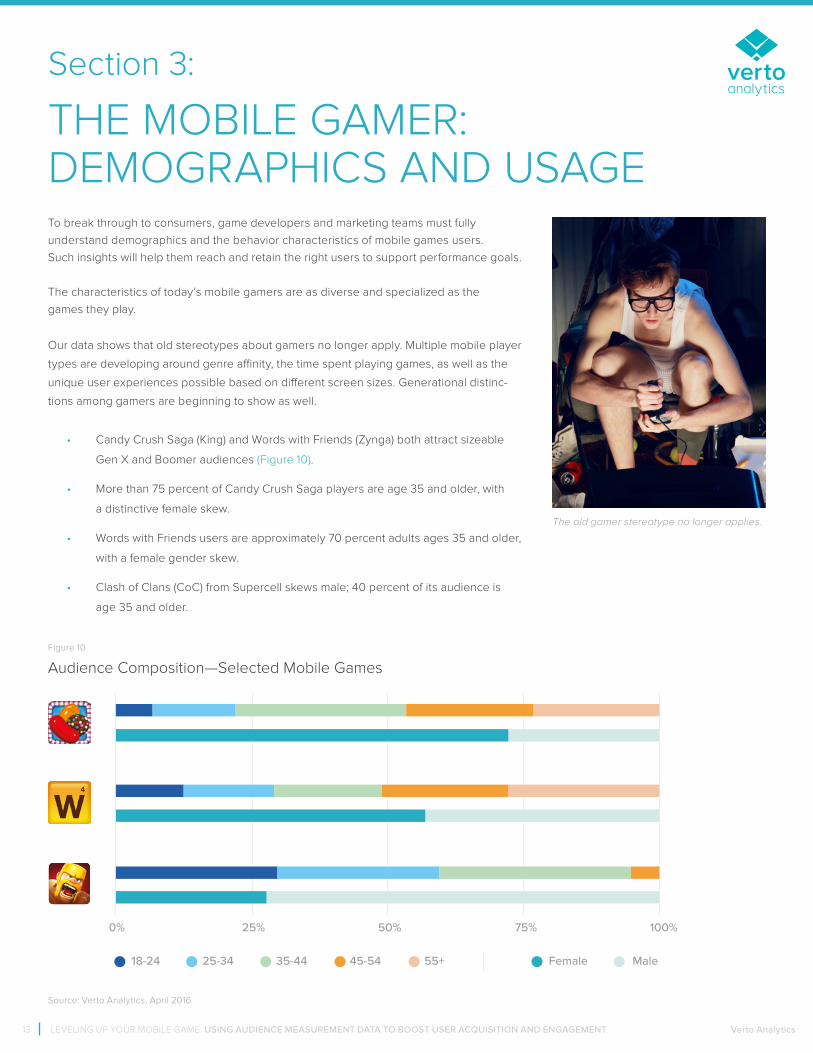
To break through to consumers, game developers and marketing teams must fully
understand demographics and the behavior characteristics of mobile games users.
Such insights will help them reach and retain the right users to support performance goals.
The characteristics of today’s mobile gamers are as diverse and specialized as the
games they play.
Our data shows that old stereotypes about gamers no longer apply. Multiple mobile player
types are developing around genre affinity, the time spent playing games, as well as the
unique user experiences possible based on different screen sizes. Generational distinc-
tions among gamers are beginning to show as well.
• Candy Crush Saga (King) and Words with Friends (Zynga) both attract sizeable
Gen X and Boomer audiences (Figure 10).
• More than 75 percent of Candy Crush Saga players are age 35 and older, with
a distinctive female skew.
• Words with Friends users are approximately 70 percent adults ages 35 and older,
with a female gender skew.
• Clash of Clans (CoC) from Supercell skews male; 40 percent of its audience is
age 35 and older.
Source: Verto Analytics, April 2016
Audience Composition—Selected Mobile Games
Figure 10
18-24 25-34 35-44 Female Male45-54 55+
0% 25% 50% 75% 100%
The old gamer stereotype no longer applies.

LEVELING UP YOUR MOBILE GAME: USING AUDIENCE MEASUREMENT DATA TO BOOST USER ACQUISITION AND ENGAGEMENT Verto Analytics14
Light Gamers and Heavy Gamers: Traits and BehaviorsClearly, mobile games have attracted a new audience. This means mobile poses new and
unique design and distribution concerns compared to console-based games. For example,
while plunking down $50 or $60 is commonplace to play console or PC games (even for
poorly designed games), there is minimal monetary risk for consumers when mobile games
cost $0.99, $2.99, or even $5.99. “Free-to-play” games remove risk entirely for the user,
and developers typically seek revenue post install via in-game ads or in-app purchases.
While low-cost or “free-to-play” mobile games may expose more potential players to
mobile games, they also generate a huge influx of samplers. The challenge for mobile
game marketers is to effectively parse which users typically sample and rapidly move on
(Light Gamers) and which users get hooked, at least for a time, on the mobile games they
download and play (Heavy Gamers). When the Heavy Gamers are identified, it’s then
possible to identify the most passionate of these players, identified as Core Gamers.
A segmentation analysis of the amount of time users spend with mobile games paints a
picture of two groups with very dissimilar traits (Figure 11). The top 40 percent of all gamers
(defined as Heavy Gamers), consume 88 percent of all monthly time spent with mobile
games. Drilling deeper, the top 20 percent of gamers (defined as Core Gamers) make up
nearly two-thirds of all game play.
Conversely, the bottom 40 percent of gamers (defined as Light Gamers), are the ultimate
samplers. Light Gamers make up a scant 3 percent of time spent gaming. While Light
Gamers may download and eventually try any number of games, they quickly move on to
their next mobile experience.
The top 40 percent of all gamers
consume 88 percent of all monthly
time spent with mobile games
Source: Verto Analytics, April 2016, Mobile Gamer Segmentation Analysis of Time Spent
Figure 11
Mobile Gamer Segmentation Analysis of Time Spent
115.6M
Mobile GamersMonthly Time Spent
Playing Games
1.12B Hours
88%
3%
62%
CORE GAMERS
HEAVYGAMERS
LIGHTGAMERS
Light Gamers: The bottom 40 percent of all gamers. Light Gamers
account for just 3 percent of all time spent gaming. Light Gamers are the
ultimate samplers; they download many games quickly and move on.
Heavy Gamers: The top 40 percent of all gamers. Heavy Gamers
consume 88 percent of all monthly time spent engaged with
mobile games.
Core Gamers: The top 20 percent of all gamers. Core Gamers make
up nearly two-thirds of all game play.
Gamer Profile Types
Segmentation Analysis:
Divides gamers into distinct groups of
users based on specific characteris-
tics. In this case, we’ve grouped users
based on the amount of time spent
playing mobile games. For example,
a quintile segmentation means placing
mobile gamers into one of five groups,
each group representing 20 percent
of the whole—from lowest to highest
amount of time spent playing games.

LEVELING UP YOUR MOBILE GAME: USING AUDIENCE MEASUREMENT DATA TO BOOST USER ACQUISITION AND ENGAGEMENT Verto Analytics15
Usage Patterns: The Average Mobile Game Day Filling time during a commute, standing in a checkout line, or waiting in the doctor’s office
—on any given day, the average gamer spends approximately 24 minutes playing games
on mobile devices. According to Pew Internet, the activity has become a common practice
among nearly half of all U.S. consumers (Figure 12).
Average Time Spent Playing Games per Day (hours/minutes):
Figure 13
All Gamers:
Heavy Gamers:
Core Gamers:
Light Gamers:
24min
1h, 2min
1h, 40min
2min
+258%
+416%
-92%
Source: Verto Analytics, April 2016
On any given day, the average
gamer spends approximately
24 minutes playing games on
mobile devices.
However, usage is far from uniform from mobile gamer to mobile gamer. Wide disparities in
behavior exist between Heavy and Light Gamers. While average gamers spend 24 minutes
each day playing games, Heavy Gamers (representing the top 40 percent of gamers)
spend more than 2.5 times that amount. Among Core Gamers (top 20 percent of gamers),
the average time spent with mobile games each day is four times greater.
% of all adults who ever play video games on a computer, TV, game console
or portable device like a cellphone
Figure 12
Source: Survey conducted June 10 – July 12, 2015.
Note: Figures do not add to 100 percent due to rounding
Pew Research Center
Half of American adults play video games;
10 percent consider themselves “gamers”
Identify as “gamers”
Play games, but don’t identify as “gamers”
Don’t Play Video Games
10% 38% 51%
Play Video Games
49%
GAMER TYPE TIME SPENT PER DAY TIME SPENT COMPARED TO AVERAGE USER (%)

LEVELING UP YOUR MOBILE GAME: USING AUDIENCE MEASUREMENT DATA TO BOOST USER ACQUISITION AND ENGAGEMENT Verto Analytics16
Considering the limited number of games all users play each month, it is critical that
marketers focus squarely on the behavior of their primary user groups: Heavy Gamers and
Core Gamers. These user segments express their ongoing passion for mobile games by
playing more than five games, on average, each month (Figure 14).
Session activity aligns very closely to the number of games played both daily and monthly
(Figure 15); Heavy Gamers play games at a rate 2.5 times greater than average players.
Average session times follow the same pattern as well.
If mobile game developers and marketers seek to a) increase loyalty among their most
passionate players, b) attempt to attract users from rival games, or c) turn light or non-
players into active gamers, understanding usage characteristics among Heavy Gamers
and Core Gamers will be absolutely essential.
PER MONTH AVERAGE SESSION TIMEPER DAY
Average Number of Game Sessions Played:
Figure 15
All Gamers:
Heavy Gamers:
Core Gamers:
Light Gamers:
4.31
10.6 (2.5x)
16.6 (3.9x)
0.6
133.6
328.4 (2.5x)
514.4 (3.9x)
17.1
5 min, 35 sec
5 min, 53 sec
6 min, 3 sec
3 min, 32 sec
Source: Verto Analytics, April 2016
Light use is even more extreme. Reflecting the nearly friction-free nature of accessing
mobile games—easy to discover, download, and then sample lots of choices—Light Gamers
(the bottom 40 percent of all users) spend a staggering 92 percent less time each day
playing games compared to the average user.
While daily time spent with games varies widely among users, the number of games
played on any given day is actually quite limited. The average mobile gamer accesses
slightly more than one game (1.3) daily (Figure 14). The figure rises to just 3.6 games on
average over the course of a month, despite the perceptually limitless choice of games
available within mobile app marketplaces and the relative ease of access for sampling.
Source: Verto Analytics, April 2016
The average mobile gamer only
accesses about one game a day.
Average Number of Games Played:
Figure 14
All Gamers:
Heavy Gamers:
Core Gamers:
Light Gamers:
1.3
1.7 (+31%)
2.3 (+77%)
1.0 (-23%)
3.6
5.2 (+44%)
6.5 (+81%)
2.2 (-39%)
PER MONTHPER DAYGAMER TYPE
GAMER TYPE

LEVELING UP YOUR MOBILE GAME: USING AUDIENCE MEASUREMENT DATA TO BOOST USER ACQUISITION AND ENGAGEMENT Verto Analytics17
USE CASES AND BEST PRACTICES FOR MOBILE GAME DEVELOPERS AND MARKETERS
Section 4:
Use Case I: REFINING DISCOVERY AND DOWNLOAD TACTICSThanks to nearly-ubiquitous mobile access, mobile game downloads happen almost any-
where and at any time. However, different days and different parts of the day provide unique
opportunities to engage with potential mobile gamers.
An analysis of weekly download data from Verto Analytics provides some valuable clues
to the best days and times to engage with gamers. In April 2016, average download rates
peaked on Tuesdays and Sundays (Figure 16). While the end of the week (Friday through
Sunday) is a generally favorable period overall, game downloads tend to peak on Sundays.
Tuesdays also prove to be solid days for promoting downloads. Still considered a primary
launch day for digital movies and console games, Tuesdays are likely benefiting from a
halo effect from related consumer shopping activities (such as Blu-ray and on-demand
movie releases)
Source: Verto Analytics, April 2016, Mobile Devices Only
Figure 16
Daily Average Downloads—Games Category
Please Note:
Downloads data in this study
reflects the rate of successful
installations of mobile games.
In other words, a download equals
a full install.
In April 2016, average
download rates peaked on
Tuesdays and Sundays
9,000,000
8,000,000
7,000,000
6,000,000
5,000,000
4,000,000
3,000,000
2,000,000
1,000,000
-
Monday Tuesday Wednesday Thursday Friday Saturday Sunday
Nu
mb
er
of
Do
wn
loa
ds
Week Day

LEVELING UP YOUR MOBILE GAME: USING AUDIENCE MEASUREMENT DATA TO BOOST USER ACQUISITION AND ENGAGEMENT Verto Analytics18
A drill-down of daily data reveals further insight on the download ebbs and flows during
the two biggest download days (Figure 17). On both days, we observe a general increase
in overall activity as the day progresses—a common observation seen on most days
of the week.
Tuesdays reveal a broader increase in downloads during the morning and evening
commutes, as well as a spike during lunch. We also see a broader increase during the
Sunday afternoon hours as well as an expected surge on both days during primetime
—ground zero for cross-screen activity in the home.
Source: Verto Analytics, April 2016, Tuesday and Sunday, Mobile Devices Only
Figure 17
Hourly Aggregate Downloads—Games Category
1,400,000
1,200,000
1,000,000
800,000
600,000
400,000
200,000
0
1 2 3 4 5 6 7 8 9 10 11 12 13 14 15 16 17 18 19 20 21 22 23 24
Tuesday Sunday
Nu
mb
er
of
Do
wn
loa
ds
Time of the Day
Specific timeframes on
Tuesdays and Sundays
are the most popular days
for downloading.

LEVELING UP YOUR MOBILE GAME: USING AUDIENCE MEASUREMENT DATA TO BOOST USER ACQUISITION AND ENGAGEMENT Verto Analytics19
Figure 18
Weekly Active Gaming versus Weekly Average Game Downloads per Day
Source: Verto Analytics, April 2016, Mobile Devices Only
The social act of gaming (both solo and with others online) takes priority Wednesday
through Friday, especially the evening hours. They stand out as the most active days for
game play. Conversely, consider Tuesday, Saturday, and Sunday as “shopping days.” These
are the quieter “down times” when consumers consider new mobile game experiences.
The user dynamics here suggest varied messaging opportunities exist by both day and
time (e.g., targeting shoppers and active players on different days) which could potentially
achieve some cost savings (lower CPIs) as well.
58,500,000
58,000,000
57,500,000
57,000,000
56,500,000
56,000,000
55,500,000
55,000,000
54,500,000
9,000,000
8,000,000
7,000,000
6,000,000
5,000,000
4,000,000
3,000,000
2,000,000
1,000,000
Active Gamers Average Downloads
Act
ive
Ga
me
rs
Ave
rag
e D
ow
nlo
ad
s
Monday Tuesday Wednesday Thursday Friday Saturday Sunday
Key Insight:
Mobile game marketers should consider testing commute times and middays as they may
offer lower-cost CPI options for attracting installs for specific games. Comparing weekly
gaming activity to weekly average installs reinforces this suggestion (Figure 18). Concentrated
download activity on specific days runs counter to the most active gaming days.

LEVELING UP YOUR MOBILE GAME: USING AUDIENCE MEASUREMENT DATA TO BOOST USER ACQUISITION AND ENGAGEMENT Verto Analytics20
Use Case II: IMPROVING MOBILE GAME ADOPTION PERFORMANCE
The first few days after a game is downloaded see the speedy departure of most mobile
game users. In fact, mobile game companies will see two specific types of downloaders:
samplers and players. Samplers are the downloaders who try a game and move on. Players
are those who stick around to play the game consistently.
Moving beyond the first few days of downloading, retention does not get much better. As
detailed in Figure 19, all app categories—even social and shopping—must contend with the
stark realities of the sampler segment. By day seven, apps in some categories may see user
retention rates drop to a mere 20 percent or even lower as the weeks progress.
Samplers: Similar to shoppers who try on many pairs of shoes without buying them, samplers typically
download multiple new apps in a flurry. Samplers try a few of them before quickly moving on to their
next mobile experience. As detailed in Figure 19, 40-60 percent of downloaders forgo use of a given
game within the first 24 hours of downloading it.
Players: The other downloader type, players, tends to take shape after a few days; these are the ones
who do not leave. Borne out of the vast noise of samplers, these are the users developers and marketers
should watch very closely. From this group come the Heavy and Core Gamers, as well as highly-
coveted spenders—the 3 percent of all mobile gamers who make in-app purchases (Figure 11).
Source: Verto Analytics, April 2016, Mobile Devices Only
Figure 19
Daily Average Retention by Category—First 60 Days
100%
80%
60%
40%
20%
0%
D0 D7 D14 D21 D28 D35 D42 D49 D56
Photo and Video Lifestyle and Shopping Entertainment Music and Audio
Social Networking Travel and Navigation Games
Retention of popular app categories
• The first week is the most critical, especially the first few days
• Retention drops well below 50% in most app categories
• App sampling is the norm; a byproduct of so little ecosystem friction

LEVELING UP YOUR MOBILE GAME: USING AUDIENCE MEASUREMENT DATA TO BOOST USER ACQUISITION AND ENGAGEMENT Verto Analytics21
Despite the rabid sampling by most app users, the games category has a slightly more pos-
itive adoption story to tell. Boasting some of the most passionate users (Figure 2, second in
monthly time spent), mobile gamers tend to be somewhat more selective with their down-
load choices. Retention rates for mobile games consistently outperform all other categories
over their first two months of use (Figure 19).
Individual mobile games also offer unique adoption details on both samplers and players.
A comparison of four popular mobile games shows that each has a slightly different reten-
tion makeup (Figure 20). For example, strategy game Clash of Clans (CoC) boasts some of
the most loyal users, with retention rates flirting around 60 percent for several days during
the first week of usage.
Conversely, a mobile game like Solitaire by MobilityWare is hugely popular, even though
card games have multiple variations available from multiple developers. While MobilityWare’s
Solitaire is a top-five game, it is consistently challenged by lower-than-average retention rates
(20 percent by day one). Though samplers may try the card game, many quickly move on and
seek a different experience.
Key Insight:
Each mobile game in the top 10 likely offers a slightly different adoption story—something
marketers should keep in mind when considering their messaging strategies, especially if the
goal is to create more Heavy Gamers and improve overall adoption. For example, Clash of
Clans, which already boasts higher overall loyalty, could message new gamers with added
inducements to boost session frequency or extend gameplay (average session time).
Source: Verto Analytics, April 2016, Install Rates on Mobile Devices Only
D0 D1 D2 D3 D4 D5 D6 D7 D8 D9 D10 D11 D12 D13 D14
Candy Crush SagaWords with Friends Solitare by MobilityWareClash of Clans
100%
80%
60%
40%
20%
0%
Figure 20
Daily Average Retention–Select Mobile Games

LEVELING UP YOUR MOBILE GAME: USING AUDIENCE MEASUREMENT DATA TO BOOST USER ACQUISITION AND ENGAGEMENT Verto Analytics22
Use Case III: SEGMENTING GAMER TYPES
Moving beyond the first week post download, most mobile games experience a gradual de-
cline in retention over time (Figure 20). However, users who remain beyond those first few
days represent potential new additions to a mobile game’s Heavy Gamer group. Consider
them the flip side of samplers; Heavy Gamers represent the most passionate and dedicated
player base.
Segmentation analysis of individual games reveals an extremely high concentration of play-
ing time among the Heavy Gamer subset of users (Figure 21). In each case among these top
games, the Heavy Gamer group (representing the top 40 percent of users) represents more
than 90 percent of all time spent with the individual game.
Source: Verto Analytics, April 2016, Segmentation Analysis of Select Game Apps
Figure 21
CORE GAMERS
HEAVYGAMERS
LIGHTGAMERS
94.4%
92.9%
92.0%
For example, 40 percent of Candy Crush Saga (CCS) players make up 94.4 percent of
all time spent with the game. Conversely, the remaining 60 percent of CCS players take
up only 5.6 percent of game time. Words with Friends, Clash of Clans, and many other
top games offer similar stories of Time Spent per Month concentration among their
Heavy Gamers.
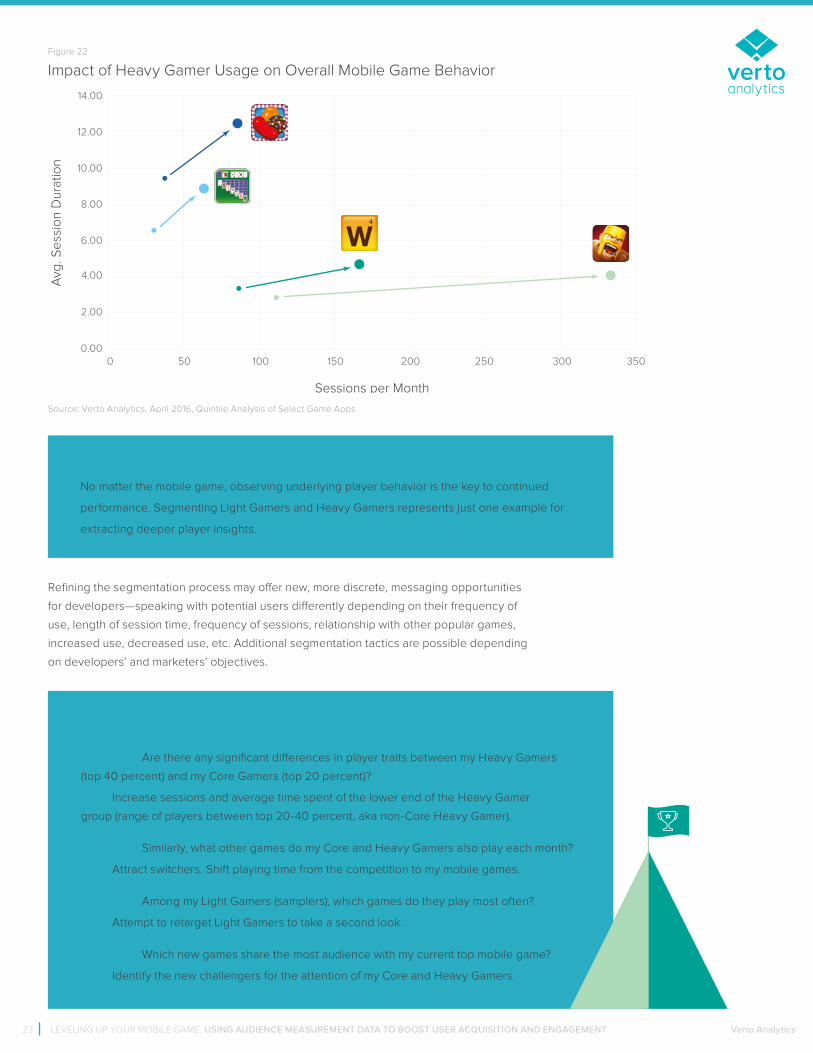
Segmenting Heavy Gamers from the rest of a game’s app user group may offer further
insights into understanding and developing stronger user retention and monetization
strategies. For example, per Figure 22, there are typically very distinct differences
between a game app’s average user versus a Heavy Gamer (top 40 percent of users).
In the case of Clash of Clans, Heavy Gamers average a staggering 332 sessions per
month compared to the average player, at 110 sessions. Similarly, Heavy Gamers who
play Words with Friends represent double the number of game sessions each month
versus average users.
Heavy Gamer Segment: Monthly Time Spent
LEVELING UP YOUR MOBILE GAME: USING AUDIENCE MEASUREMENT DATA TO BOOST USER ACQUISITION AND ENGAGEMENT Verto Analytics23
Refining the segmentation process may offer new, more discrete, messaging opportunities
for developers—speaking with potential users differently depending on their frequency of
use, length of session time, frequency of sessions, relationship with other popular games,
increased use, decreased use, etc. Additional segmentation tactics are possible depending
on developers’ and marketers’ objectives.
Key Insight:
No matter the mobile game, observing underlying player behavior is the key to continued
performance. Segmenting Light Gamers and Heavy Gamers represents just one example for
extracting deeper player insights.
Challenge: Are there any significant differences in player traits between my Heavy Gamers
(top 40 percent) and my Core Gamers (top 20 percent)?
Goal: Increase sessions and average time spent of the lower end of the Heavy Gamer
group (range of players between top 20-40 percent, aka non-Core Heavy Gamer).
Challenge: Similarly, what other games do my Core and Heavy Gamers also play each month?
Goal: Attract switchers. Shift playing time from the competition to my mobile games.
Challenge: Among my Light Gamers (samplers), which games do they play most often?
Goal: Attempt to retarget Light Gamers to take a second look.
Challenge: Which new games share the most audience with my current top mobile game?
Goal: Identify the new challengers for the attention of my Core and Heavy Gamers.
14.00
12.00
10.00
8.00
6.00
4.00
2.00
0.00
Avg
. Se
ssio
n D
ura
tion
Sessions per Month
0 50 100 150 200 250 300 350
Impact of Heavy Gamer Usage on Overall Mobile Game Behavior
Source: Verto Analytics, April 2016, Quintile Analysis of Select Game Apps
Figure 22
Challenges and Goals for Developers and Marketers

LEVELING UP YOUR MOBILE GAME: USING AUDIENCE MEASUREMENT DATA TO BOOST USER ACQUISITION AND ENGAGEMENT Verto Analytics24
CONCLUSION AND KEY TAKEAWAYS
Section 5:
In the simplest terms, success in mobile gaming means attracting the right users and keep-
ing them engaged well past download. However, achieving such success today while facing
new competitors, more mobile games, and ever-fickle audiences—all encompassed within a
nearly friction-free distribution environment—has never been more challenging.
Attaining success in mobile gaming today means going much further. It means observing
your potential users along every stage of the app ecosystem—from discovery and down-
load to eventual adoption. It means tracking mobile game downloads, retention rates, and
average session times—and creating player segmentation profiles such as the Heavy Gamer.
It means tracking all related competitive moves through the same exact lens.
The insights generated here will help inform your distribution and monetization strategies
for the next round of mobile gaming innovation.
Attaining success in mobile
gaming today means observing
your potential users along every
stage of the app ecosystem.
More Developer Competition on the Way
—An already competitive developer space just got even more crowded. Recent moves by
Nintendo, Sony, Capcom, EA, and other console gaming giants suggest that mobile is now
a central component of their development strategies.
Forget the Console Gamer Stereotype
—There are new demographic and segmentation rules to learn for each genre and individual
mobile game. Take the demo profiles of both Words with Friends and Candy Crush Saga
as excellent examples. Both mobile games heavily skew female with an age footprint that’s
mostly over age 35.
While Size Matters, Engagement Is Essential
—While the mobile games category is sizeable, ranking eighth in overall reach among
app users (105.6 million), time spent is the real story. Games represent the second largest
category in overall time spent using apps in the U.S., second only to social. U.S. mobile app
users spend more than 1.15 billion hours each month playing games.
A Nearly “Friction-Free” Ecosystem Is a Mixed Blessing to Game Developers
—While near-ubiquitous access to apps is a clear benefit to consumers, it’s less so for
mobile game developers. When hundreds of thousands of mobile games sit side by side
on virtual shelves, it’s hard to consistently stand out. Discovery ranks as the #1 challenge
of game developers in 2016.
The Games Category Requires a Unique Marketing Approach
—Ubiquitous consumer access means mobile game marketers must be smarter and more
aggressive in hopes of standing out among so many competitors. Use mobile-centric consumer
data and insights to track consumers through the entire app ecosystem—from discovery to
download to eventual adoption.
KEY TAKEAWAYS
1.15 Billion
hours each month
playing games.

LEVELING UP YOUR MOBILE GAME: USING AUDIENCE MEASUREMENT DATA TO BOOST USER ACQUISITION AND ENGAGEMENT Verto Analytics25
Mixed Exposure Strategy Needed Between App Marketplace and Outside Platforms
—Apps are typically discovered in two ways—either directly through an app marketplace
(63 percent) or through outside platforms (37 percent) such as search, advertising, social,
peer, and personal reviews.
Recognize the Unique Download Behaviors for Individual Mobile Games
—Specific days of the week provide excellent opportunities for developers to have their
games discovered and downloaded. While Wednesday through Friday represent the days
of highest gameplay, Tuesday and Sunday stand out as unique opportunities for users to
discover new mobile games.
Extreme Sampling Should Always Be Considered the Norm
—The by-product of near-ubiquitous access to apps (mobile games or otherwise) is a high
sampling rate among users. But the sampling reality is that, within 24 hours, 40-60 percent
of new users may have already moved on to other mobile experiences.
The First 2-3 Days Post Install Are the Most Critical
—While huge disparities in retention performance are possible, depending on the category,
retention rates can drop to as low as 20 percent or more for some apps within the first few
days. It is critical to pay close attention to these shifts in initial game usage as there may be
very high costs associated in acquiring new users.
Every Mobile Game Has a Primary User Constituency
—It’s the marketer’s job to find players who remain after the first few days and are potential
candidates for a game’s primary user set—better known as their Heavy Gamers. Represent-
ing the top 40 percent of all mobile gamers, Heavy Gamers make up over 88 percent of all
time spent playing games.
Develop a Heavy Gamer Segmentation Strategy
—While you should build multiple player segments over time to better track underlying user
behavior, Heavy Gamers represent an excellent first step for understanding and enhancing
retention and monetization strategies. Focus on them.
63%App storediscovery
37%Non-app store
discovery
CORE GAMERS
HEAVYGAMERS
LIGHTGAMERS

LEVELING UP YOUR MOBILE GAME: USING AUDIENCE MEASUREMENT DATA TO BOOST USER ACQUISITION AND ENGAGEMENT Verto Analytics26
ABOUT VERTO ANALYTICSFrom market insights to the demographics of mobile ownership, Verto Analytics
publishes a regular series of industry reports that applies our single-source audience
measurement data to specific use cases and challenges across several industry sectors and
segments. To learn more about our research, visit vertoanalytics.com/data-insights/
The Verto Analytics single-source measurement methodology is based on behavioral
data gathered from a panel of consumers that own and use multiple devices. We measure
from the point of consumer interaction across all platforms, media, content, and devices.
Our panelists, who are compensated for their participation depending on their demo-
graphics, opt in to install a measurement app on their digital devices. Simply put, we
quantify the consumer journey from one device to another.
Verto Analytics provides a single-source audience measurement solution for monitoring
the complex behavior of today’s consumer on every device, app, and platform they use
throughout the day. We provide data and insights that inform marketing, competitive
intelligence, media buying, and product strategy and development.
Backed by EQT Ventures, Conor Venture Partners and Open Ocean Capital, Verto is a
privately held global company with offices in New York City, San Francisco, London, and
Espoo, Finland. Read our blog, follow us on Twitter, or learn more at vertoanalytics.com.
twitter.com/vertoanalytics
facebook.com/vertoanalytics/
linkedin.com/company/verto-analytics