Embed Size (px)
Citation preview
-4
LEVEL II SCOUR ANALYSIS FORBRIDGE 34 (RANDTH00660034) onTOWN HIGHWAY 66, crossing theSECOND BRANCH WHITE RIVER,RANDOLPH, VERMONT
U.S. Geological SurveyOpen-File Report 96-236
Prepared in cooperation with
VERMONT AGENCY OF TRANSPORTATION
and
FEDERAL HIGHWAY ADMINISTRATION

-3
LEVEL II SCOUR ANALYSIS FORBRIDGE 34 (RANDTH00660034) onTOWN HIGHWAY 66, crossing theSECOND BRANCH WHITE RIVER,
RANDOLPH, VERMONT
By SCOTT A. OLSON and JOSEPH D. AYOTTE
U.S. Geological SurveyOpen-File Report 96-236
Prepared in cooperation with
VERMONT AGENCY OF TRANSPORTATION
and
FEDERAL HIGHWAY ADMINISTRATION
Pembroke, New Hampshire
1996

U.S. DEPARTMENT OF THE INTERIOR
BRUCE BABBITT, Secretary
U.S. GEOLOGICAL SURVEYGordon P. Eaton, Director
For additional information Copies of this report may bewrite to: purchased from:
District Chief U.S. Geological SurveyU.S. Geological Survey Earth Science Information Center361 Commerce Way Open-File Reports SectionPembroke, NH 03275 Box 25286, MS 517
Federal CenterDenver, CO 80225

-1
CONTENTSIntroduction........................................................................................................................................................ 1
Level II summary ............................................................................................................................................... 7Description of Bridge ................................................................................................................................... 7Description of the Geomorphic Setting........................................................................................................ 8Description of the Channel........................................................................................................................... 8Hydrology..................................................................................................................................................... 9 Calculated Discharges .......................................................................................................................... 9Description of the Water-Surface Profile Model (WSPRO) Analysis ......................................................... 10 Cross-Sections Used in WSPRO Analysis............................................................................................ 10 Data and Assumptions Used in WSPRO Model ................................................................................... 11Bridge Hydraulics Summary........................................................................................................................ 12Scour Analysis Summary ............................................................................................................................. 13 Special Conditions or Assumptions Made in Scour Analysis............................................................... 13 Scour Results......................................................................................................................................... 14Rock Riprap Sizing ...................................................................................................................................... 14
References .......................................................................................................................................................... 18
Appendixes:
A. WSPRO input file.................................................................................................................................... 19
B. WSPRO output file .................................................................................................................................. 21
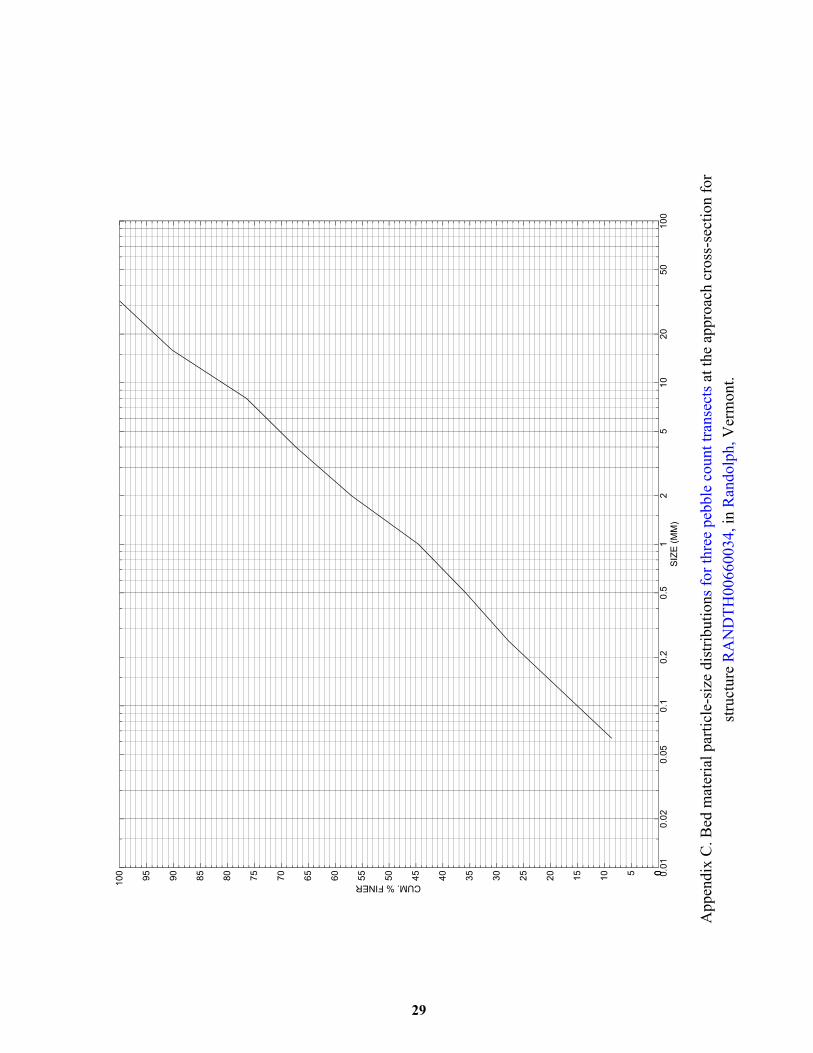
C. Bed-material particle-size distribution .................................................................................................... 28
D. Historical data form................................................................................................................................. 30
E. Level I data form...................................................................................................................................... 36
F. Scour computations.................................................................................................................................. 46
FIGURES
1. Map showing location of study area on USGS 1:24,000 scale map ............................................................. 3 2. Map showing location of study area on Vermont Agency of Transportation town
highway map ................................................................................................................................... 4 3. Structure RANDTH00660034 viewed from upstream (August 11, 1994) ................................................... 5 4. Downstream channel viewed from structure RANDTH00660034 (August 11, 1994)................................. 5 5. Upstream channel viewed from structure RANDTH00660034 (August 11, 1994). .................................... 6 6. Structure RANDTH00660034 viewed from downstream (August 11, 1994). ............................................ 6 7. Water-surface profiles for the 100- and 500-year discharges at structure
RANDTH00660034 on Town Highway 66, crossing the Second Branch White River, Randolph, Vermont. ........................................................................................................................ 15
8. Scour elevations for the 100- and 500-year discharges at structure RANDTH00660034 on Town Highway 66, crossing the Second Branch White River, Randolph, Vermont. ........................................................................................................................ 16
TABLES
1. Remaining footing/pile depth at abutments for the 100-year discharge at structureRANDTH00660034 on Town Highway 66, crossing the Second Branch White River,Randolph, Vermont ............................................................................................................................. 17
2. Remaining footing/pile depth at abutments for the 500-year discharge at structure RANDTH00660034 on Town Highway 66, crossing the Second Branch White River, Randolph, Vermont ............................................................................................................................ 17
iii
0iv
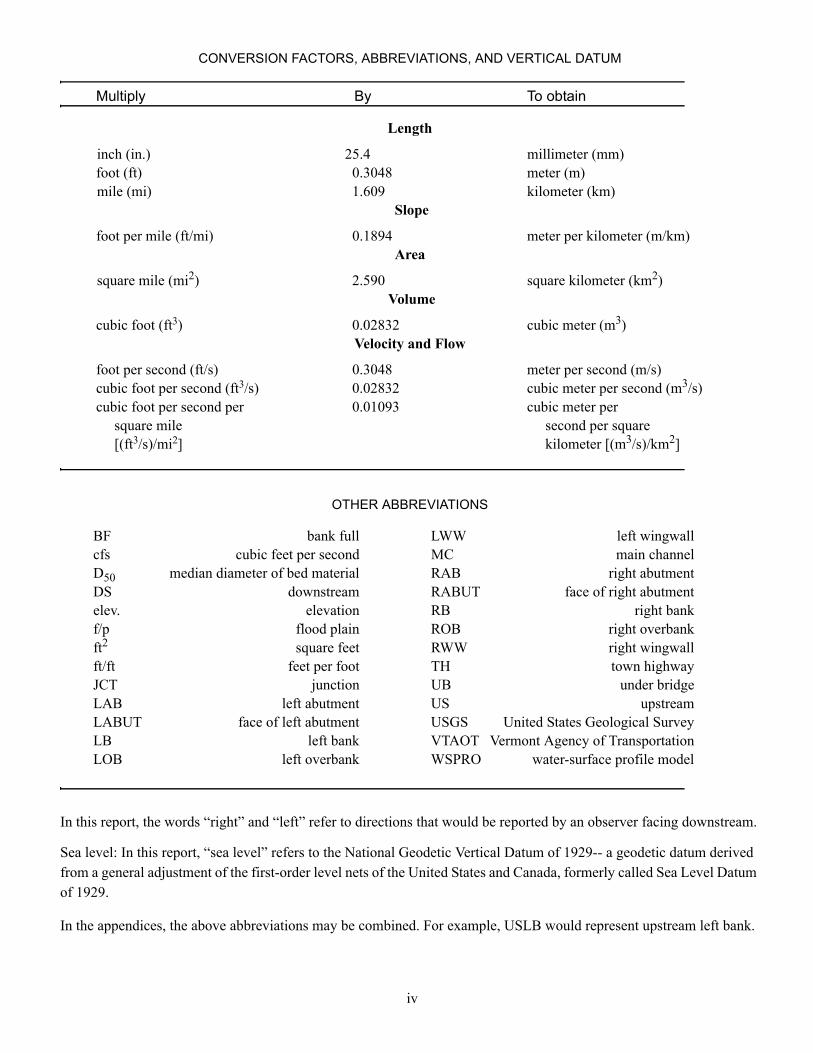
CONVERSION FACTORS, ABBREVIATIONS, AND VERTICAL DATUM
Multiply By To obtain
Length
inch (in.) 25.4 millimeter (mm) foot (ft) 0.3048 meter (m) mile (mi) 1.609 kilometer (km)
Slope
foot per mile (ft/mi) 0.1894 meter per kilometer (m/km)Area
square mile (mi2) 2.590 square kilometer (km2) Volume
cubic foot (ft3) 0.02832 cubic meter (m3)Velocity and Flow
foot per second (ft/s) 0.3048 meter per second (m/s)cubic foot per second (ft3/s) 0.02832 cubic meter per second (m3/s)cubic foot per second per 0.01093 cubic meter per square mile second per square [(ft3/s)/mi2] kilometer [(m3/s)/km2]
OTHER ABBREVIATIONS
BF bank full LWW left wingwallcfs cubic feet per second MC main channelD50 median diameter of bed material RAB right abutmentDS downstream RABUT face of right abutmentelev. elevation RB right bankf/p flood plain ROB right overbankft2 square feet RWW right wingwallft/ft feet per foot TH town highwayJCT junction UB under bridgeLAB left abutment US upstreamLABUT face of left abutment USGS United States Geological SurveyLB left bank VTAOT Vermont Agency of TransportationLOB left overbank WSPRO water-surface profile model
In this report, the words “right” and “left” refer to directions that would be reported by an observer facing downstream.
Sea level: In this report, “sea level” refers to the National Geodetic Vertical Datum of 1929-- a geodetic datum derived from a general adjustment of the first-order level nets of the United States and Canada, formerly called Sea Level Datum of 1929.
In the appendices, the above abbreviations may be combined. For example, USLB would represent upstream left bank.

LEVEL II SCOUR ANALYSIS FOR BRIDGE 34 (RANDTH00660034) ON TOWN HIGHWAY 66, CROSSING THE SECOND BRANCH WHITE
RIVER, RANDOLPH, VERMONTBy Scott A. Olson and Joseph D. Ayotte
INTRODUCTION
This report provides the results of a detailed Level II analysis of scour potential at structure RANDTH00660034 on town highway 66 crossing the Second Branch White River, Randolph, Vermont (figures 1–8). A Level II study is a basic engineering analysis of the site, including a quantitative analysis of stream stability and scour (U.S. Department of Transportation, 1993). A Level I study is included in Appendix E of this report. A Level I study provides a qualitative geomorphic characterization of the study site. Information on the bridge available from VTAOT files was compiled prior to conducting Level I and Level II analyses and can be found in Appendix D.
The site is in the Green Mountain physiographic division of central Vermont in the town of Randolph. The 51.3-mi2 drainage area is in a predominantly rural basin. In the vicinity of the study site, the left and right banks are covered by fields with some brush on the upstream left and downstream right banks and with row crops on the downstream left overbank.
In the study area, the Second Branch White River has a sinuous channel with a slope of approximately 0.002 ft/ft, an average channel top width of 60 ft and an average channel depth of 7 ft. The predominant channel bed material is sand (D50 is 1.34 mm or 0.0044 ft). The geomorphic assessment at the time of the Level I and Level II site visit on August 11, 1994, indicated that the reach was laterally unstable. Channel scour is evident along the left half of the channel from about 30 feet upstream to about 20 feet downstream of the bridge. There is a cut bank with block failures along the left bank upstream of the bridge further indicating instability of the stream reach.
The town highway 66 crossing of the Second Branch White River is a 57-ft-long, one-lane covered bridge consisting of one 45-foot span (Vermont Agency of Transportation, written communication, July 29, 1994). The bridge is supported by vertical, concrete abutments with one wingwall on the upstream left side. The base of the left abutment was protected by type-1 stone fill (less than 12 inches diameter). The channel is skewed approximately 40 degrees to the opening while the opening-skew-to-roadway is 45 degrees. Additional details describing conditions at the site are included in the Level II Summary and Appendices D and E.
1

Scour depths and rock rip-rap sizes were computed using the general guidelines described in Hydraulic Engineering Circular 18 (Richardson and others, 1993).Total scour at a highway crossing is comprised of three components: 1) long-term aggradation or degradation; 2) contraction scour (due to reduction in flow area caused by a bridge) and; 3) local scour (caused by accelerated flow around piers and abutments). Total scour is the sum of the three components. Equations are available to compute scour depths for contraction and local scour and a summary of the results follows.
Contraction scour for all modelled flows ranged from 6.3 ft to 7.8 ft and the worst-case contraction scour occurred at the 100-year discharge. Abutment scour ranged from 7.9 ft to 20.3 ft and the worst-case abutment scour occurred at the 500-year discharge. Scour depths and depths to armoring are summarized on p. 14 in the section titled “Scour Results”. Scour elevations, based on the calculated depths are presented in tables 1 and 2; a graph of the scour elevations is presented in figure 8 Scour depths were calculated assuming an infinite depth of erosive material and a homogeneous particle-size distribution.
For all scour presented in this report, “the scour depths adopted [by VTAOT] may differ from the equation values based on engineering judgement” (Richardson and others, 1993, p. 21, 27). It is generally accepted that the Froehlich equation (abutment scour) gives “excessively conservative estimates of scour depths” (Richardson and others, 1993, p. 48). Many factors, including historical performance during flood events, the geomorphic assessment, and the results of the hydraulic analyses, must be considered to properly assess the validity of abutment scour results.
2

3
Figure 1. Location of study area on USGS 1:24,000 scale map.
Randolph Center, VT. Quadrangle, 1:24,000, 1981
Photoinspected 1983
NORTH

4
Figure 2. Location of study area on Vermont Agency of Transportation town highway map.

Figure 3. Structure RANDTH00660034 viewed from upstream (August 11, 1994).
Figure 4. Downstream channel viewed from structure RANDTH00660034 (August 11, 1994).
5

Figure 5. Upstream channel viewed from structure RANDTH00660034 (August 11, 1994).
Figure 6. Structure RANDTH00660034 viewed from downstream (August 11, 1994).
6
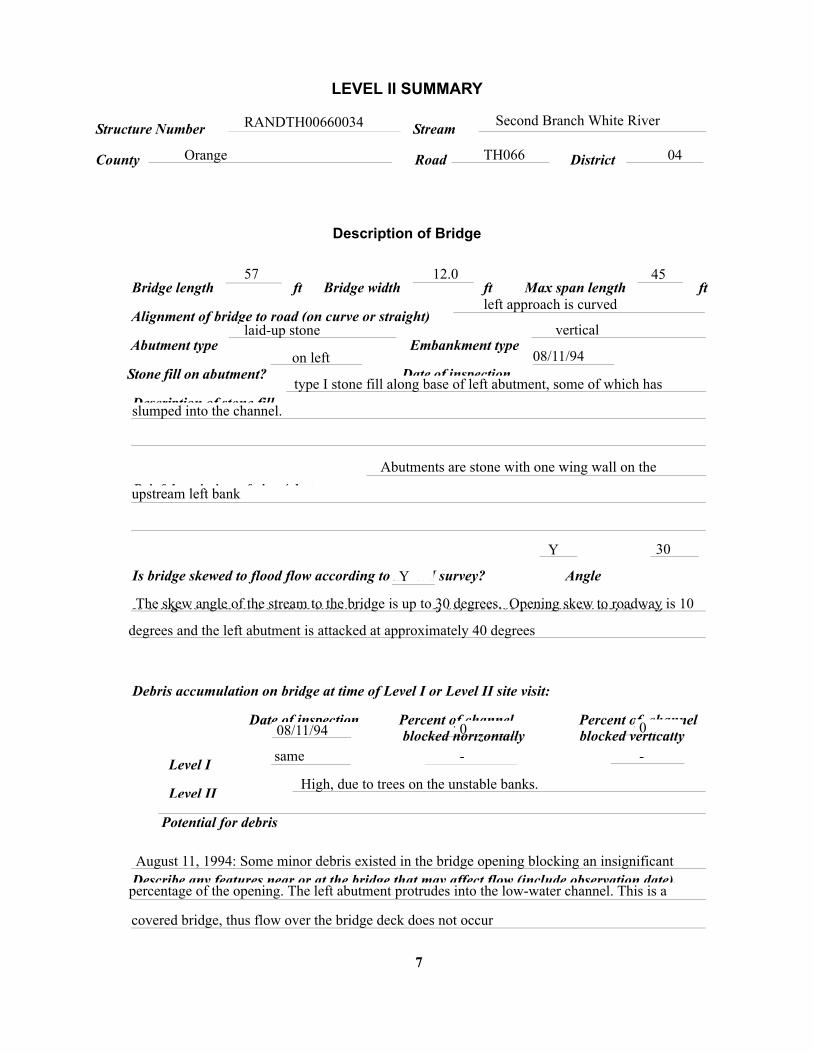
LEVEL II SUMMARY
Structure Number Stream
County
Bridge length
Alignment of bri
Abutment type
Stone fill on abut
Is bridge skewed
Debris accumul
Level I
Potential fo
RANDTH00660034
7
Road
Description of Bridge
ft Bridge width
ght)
Embankme
ment?
to flood flow according t rvey?
ation on bridge at time of Level I or Level
D Percent blocked
r debris
Second Branch White River
District
Orange TH066nt type
Angle
II site visit:
Percent blocked
04
57
12.0 45 ft Max span length ftleft approach is curved
dge to road (on curve or strailaid-up stone
vertical
on left
08/11/94
Date of inspectiontype I stone fill along base of left abutment, some of which has
Description of stone fillslumped into the channel.Abutments are stone with one wing wall on the
Brief description of piers/abutments upstream left bank
Y
30o Level I suY
Is bridge located on a bend in channel? If so, describe (mild, moderate, severe) The skew angle of the stream to the bridge is up to 30 degrees. Opening skew to roadway is 10
degrees and the left abutment is attacked at approximately 40 degrees
ate of inspection 08/11/94
of channel horizontally 0
of channel vertically
0
same
- -High, due to trees on the unstable banks.
Level IIAugust 11, 1994: Some minor debris existed in the bridge opening blocking an insignificant
Describe any features near or at the bridge that may affect flow (include observation date).percentage of the opening. The left abutment protrudes into the low-water channel. This is a
covered bridge, thus flow over the bridge deck does not occur

Description of the Geomorphic Setting
General topography
Geomorphic conditio
Date of insp
DS left:
DS right:
US left:
US right:
Average top width
Predominant bed ma
Vegetative c
DS left:
DS right:
US left:
US right:
The bridge is in an approximately 200-300 ft-wide, flat valley over a very
sinuous stream.
wnstream (DS), upstream (US)
ns at bridge site: do08/11/94
ectionmoderate flood plain to steep valley wall
moderately steep valley wall
moderate flood plain to steep valley wall
flood plain to moderately steep valley wall
Description of the Channel
teri
60
Average depthal Bank materi
8
6.5
ftsand and gravel
ftsand
al sinuous, with
Stream type (straight, meandering, braided, swampy, channelized) moderately wide flood plains. It is alluvial and laterally unstable
08/11/94
over on channel banks near bridge: Date of inspection row crops with some brush on immediate banks
scattered brush in an otherwise open field
brush on immediate banks changing to forest at the valley wall
pasture
N
? If not, describe location and type of instability and 08/11/94--Moderate fluvial erosion has occurred on the upstream left
Do banks appear stabledate of observation. bank due to flow impact. Light fluvial erosion was observed on the downstream right bank.
On 08/11/94, there was a minor amount of debris near the downstream end of the left abutment.
The left abutment
Describe any obstructions in channel and date of observation. protrudes into the low-water channel.
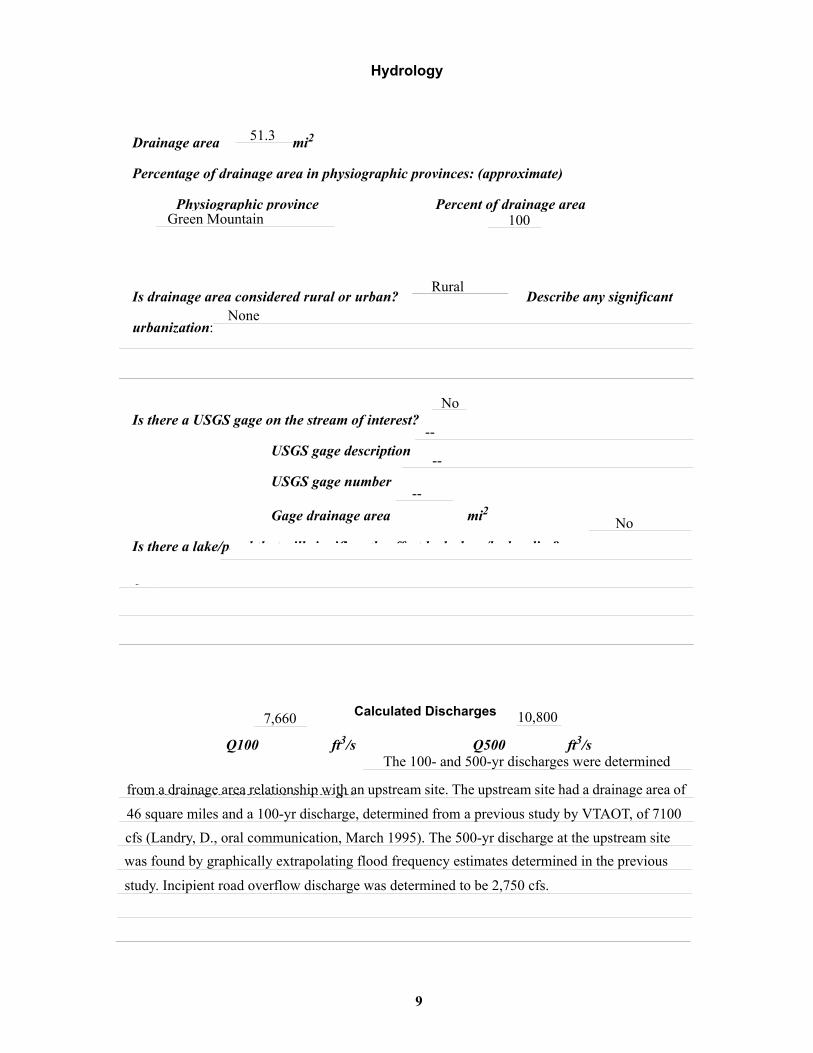
Hydrology
Drainage area i2
Percentage of dra
Is drainage a
Is there a USGS
Is there a lake/
Q
m51.3
inage area in physiographic provinces: (approximate)
Percent o rea
Physiographic province Green Mountaingage on the stream of interest
USGS gage description
USGS gage number
Gage drainage area mi2
Calculated Discharges
100 ft3/s
9
f drainage a100
Rural
rea considered rural or urban? Describe any significantNone
urbanization:
No
?--
--
--No
pond that will significantly affect hydrology/hydraulics?
If so, describe
7,660
10,800Q500 ft3/sThe 100- and 500-yr discharges were determined
Method used to determine discharges from a drainage area relationship with an upstream site. The upstream site had a drainage area of
46 square miles and a 100-yr discharge, determined from a previous study by VTAOT, of 7100
cfs (Landry, D., oral communication, March 1995). The 500-yr discharge at the upstream site
was found by graphically extrapolating flood frequency estimates determined in the previous
study. Incipient road overflow discharge was determined to be 2,750 cfs.

Description of the Water-Surface Profile Model (WSPRO) Analysis
Datum for WSPRO analysis (USGS survey, sea level, VTAOT plans)
Datum tie between USGS survey and VTAOT plans
Cross-Sections Used in WSPRO Analysis
1 For location of cross-sections see plan-view sketch included with Level I field form, Appendix For more detail on how cross-sections were developed see WSPRO input file.
10
1Cross-section
Section Reference Distance
(SRD) in feet
2Cross-section development
EXITX 0 1 Ex
FULLV 57 2DoseEX
BRIDG 57 1 Br
RDWAY 65 1 Ro
APPRO 124 2Apve
USGS survey
N/A
RM1 is a chiseled
Description of reference marks used to determine USGS datum.square in the top of the uppermost stone of the left abutment on the downstream side of the
bridge; the arbitrary elevation is 499.52 feet, arbitrary datum.
E.
Comments
it section
wnstream Full-valley ction (Templated from ITX)
idge section
ad Grade section
proach section (as sur-yed at SRD=83)

Data and Assumptions Used in WSPRO Model
11
Hydraulic analyses of the reach were done by use of the Federal Highway
Administration’s WSPRO step-backwater computer program (Shearman and others, 1986, and
Shearman, 1990). The analysis reported herein reflects conditions existing at the site at the
time of the study. Furthermore, in the development of the model it was necessary to assume no
accumulation of debris or ice at the site. Results of the hydraulic model are presented in the
Bridge Hydraulic Summary, Appendix B, and figure 7.
Channel roughness factors (Manning’s “n”) used in the hydraulic model were
estimated using field inspections at each cross section following the general guidelines
described by Arcement, Jr. and Schneider (1989). Final adjustments to the values were made
during the modelling of the reach. Channel “n” values for the reach ranged from 0.030 to
0.038, and overbank “n” values were 0.036.
Normal depth at the exit section (EXITX) was assumed as the starting water surface.
This depth was computed by use of the slope-conveyance method outlined in the User’s
manual for WSPRO (Shearman, 1990). The slope used was 0.0038 ft/ft which was measured
from water surface profiles for the Second Branch White River in the Flood Insurance Study
for the Town of Randolph (Federal Emergency Management Agency, 1991).
The surveyed approach section was moved to establish the modelled approach section
(APPRO), one bridge length upstream of the upstream face as recommended by Shearman and
others (1986). This approach also provides a consistent method for determining scour
variables.
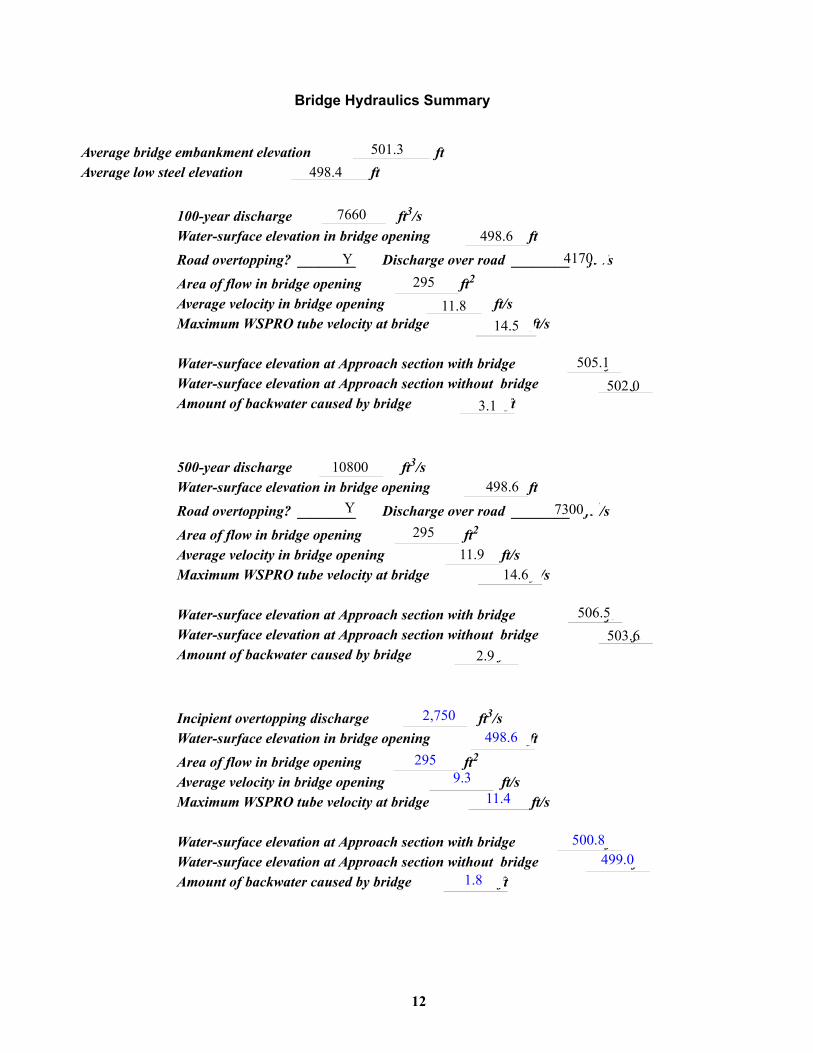
Bridge Hydraulics Summary
Average bridge embankment eleva ftAverage low steel elevation
100-year discharge Water-surface elevati
Road overtopping? _
Area of flow in bridge openAverage velocity in bridge oMaximum WSPRO tube vel Water-surface elevation at AWater-surface elevation at AAmount of backwater cause
500-year discharge Water-surface elevatio
Road overtopping? __
Area of flow in bridge openAverage velocity in bridge oMaximum WSPRO tube vel Water-surface elevation at AWater-surface elevation at AAmount of backwater cause
Incipient overtopping dischWater-surface elevation in b
Area of flow in bridge openAverage velocity in bridge oMaximum WSPRO tube vel Water-surface elevation at AWater-surface elevation at AAmount of backwater cause
501.3
ft
tion498.4
ft3/s
766012
ening
ing pening ocity at bridge
pproach section wipproach section wd by bridge
ft3/s ening
ing pening ocity at bridge pproach section wipproach section
d by bridge
arge ridge opening
ing pening ocity at bridge pproach section wipproach sectio
d by bridge
ft498.6
r road ____
on in bridge op
_______ DY
2th bridge ge
r road __2
th bridge e
3
th bridge dge
____ ft3/s4170
ischarge oveft295
11.8
ft/s ft/s14.5/s
ft505.1
ft502.0
ithout brid ft3.110800
ft498.6 n in bridge op______ DY
______ ft3/s7300 ischarge ovef295
t ft11.9 /sft/s14.6
ft506.5
ft503.6
without bridg ft2.9f2,750
t /s ft498.6f295
t2f9.3
t/s ft11.4ft500.8
ft499.0
n without bri ft1.8
Scour Analysis Summary
Special Conditions or Assumptions Made in Scour Analysis
13
Scour depths were computed using the general guidelines described in Hydraulic
Engineering Circular 18 (Richardson and others, 1993). Scour depths were calculated
assuming an infinite depth of erosive material and a homogeneous particle-size distribution.
The results of the scour analysis are presented in tables 1 and 2 and a graph of the scour
depths is presented in figure 8.
Contraction scour was computed by use of the live-bed contraction scour equation
(Richardson and others, 1993, p. 33, equation 16) for the 100-year, 500-year, and incipient
road-overflow discharges. For contraction scour computations, the average depth in the
contracted section (AREA/TOPWIDTH) is subtracted from the depth of flow computed by
the scour equation (Y2) to determine the actual amount of scour. The 100-year, 500-year
and incipient road-overflow discharges resulted in submerged orifice flow. The results of
Chang’s contraction scour (Richardson and others, 1995, p. 145-146) for all the modeled
events were also computed and can be found in appendix F. Because the Chang equation
for pressure-flow scour was derived solely with data for clear-water scour, it is not currently
understood how well it would predict in live-bed conditions. Therefore, although pressure
flow conditions exist for all of the modelled flows, the reported scour depths were computed
using Laursen’s live-bed contraction scour equation.
Abutment scour was computed by use of the HIRE equation (Richardson and others,
1993, p. 50, equation 25) because the HIRE equation is recommended when the length to
depth ratio of the embankment blocking flow exceeds 25. Variables for the HIRE equation
include the Froude number of the flow approaching the embankments, the length of the
embankment blocking flow, and the depth of flow approaching the embankment less any
roadway overtopping.
It should be noted that the worst-case contraction scour and total scour resulted from
the 100-yr event.

Scour Results
Incipient overtopping
Contraction scour: 100-yr discharge 500-yr discharge discharge
(Scour depths in feet)
Main channel
Live-bed scour
Clear-water scour
Depth to armoring
Left overbank
Right overbank
Local scour:
Abutment scour
Left abutment
Right abutment
Pier scour
Pier 1
Pier 2
Pier 3
Abutments:
Left abutment
Right abutment
Piers:
Pier 1
Pier 2
______7.8
14
______
______
______
Rock Riprap Sizin
100-yr discharge
_
______
______6.3
______
______
______
g
500-yr discharg
et)
______
______
______6.9
______ --
______ --
______--
--
-- -- ______--
______--
______--
______--
______--
______--
______10.1
11.0o
e
7.9
______ 18.7
______ 20.3 ______11.4______
--
-- --______--
______-- ______--______--
______-- ______--______
Incipient vertopping
discharge
2.9
(D50 in fe2.9
1.3______ 2.9
2.9______1.3
______ --
______ --
______--
--
-- -- _____--
______--
______--
______
15
-5 1300 10 20 30 40 50 60 70 80 90 100 110 120486
508
486
488
490
492
494
496
498
500
502
504
506
Figure 7. Water-surface profiles for the 100- and 500-yr discharges at structure RANDTH00660034 on town highway 66, crossing the Second Branch White River, Randolph, Vermont.
BRIDGE DECK
500-YR WATER SURFACE PROFILE
100-YR WATER SURFACE PROFILE
ELE
VA
TIO
N A
BO
VE
AR
BIT
RA
RY
DA
TU
M, I
N F
EE
T
CHANNEL DISTANCE FROM DOWNSTREAM TO UPSTREAM, IN FEET
EXIT SECTION (EXITX)
BRIDGE SECTION (BRIDG)
APPROACH SECTION (APPRO)
MINIMUM BED ELEVATION

16
Figure 8. Scour elevations for the 100-yr and 500-yr discharges at structure RANDTH00660034 on town highway 66, crossing the Second Branch White River, Randolph, Vermont.
465
510
466
468
470
472
474
476
478
480
482
484
486
488
490
492
494
496
498
500
502
504
506
508
5 515 10 15 20 25 30 35 40 45 50
ANGLE OF R
EPOSE EXAGGERATED
ELE
VA
TIO
N A
BO
VE
AR
BIT
RA
RY
DA
TU
M, I
N F
EE
T
STATIONING FROM LEFT TO RIGHT ALONG BRIDGE SECTION, IN FEET
100-YR SCOUR DEPTHS
500-YR SCOUR DEPTHS
UNKNOWNFOUNDATION
UNKNOWNFOUNDATION
BRIDGE DECK (COVERED BRIDGE)
LOW STEEL
100-YR WATER SURFACE
500-YR WATER SURFACE

17
Table 1. Remaining footing/pile depth at abutments for the 100-year discharge at structure RANDTH00660034 on Town Highway 66, crossing the Second Branch White River, Randolph, Vermont.[VTAOT, Vermont Agency of Transportation; --,no data]
Description Station1
1. Measured along the face of the most constricting side of the bridge.
VTAOT minimum low-chord elevation
(feet)
Surveyed minimum low-chord elevation2
(feet)
2. Arbitrary datum for this study.
Bottom of footing
elevation2
(feet)
Channel elevation at abutment/
pier2
(feet)
Contraction scour depth
(feet)
Abutment scour depth (feet)
Pier scour depth (feet)
Depth of total scour
(feet)
Elevation of scour2
(feet)
Remaining footing/pile
depth(feet)
100-yr. discharge is 7,660 cubic-feet per second
Left abutment 5 -- 498.1 -- 491.5 7.8 10.1 -- 17.9 473.6 --
Right abutment 51 -- 498.6 -- 494.2 7.8 18.7 -- 26.5 467.7 --
Table 2. Remaining footing/pile depth at abutments for the 500-year discharge at structure RANDTH00660034 on Town Highway 66, crossing the Second Branch White River, Randolph, Vermont.[VTAOT, Vermont Agency of Transportation; --, no data]
Description Station1
1. Measured along the face of the most constricting side of the bridge.
VTAOT minimum low-chord elevation
(feet)
Surveyed minimum low-chord elevation2
(feet)
2. Arbitrary datum for this study.
Bottom of footing
elevation2
(feet)
Channel elevation at abutment/
pier2
(feet)
Contraction scour depth
(feet)
Abutment scour depth (feet)
Pier scour depth (feet)
Depth of total scour
(feet)
Elevation of scour2
(feet)
Remaining footing/pile
depth(feet)
500-yr. discharge is 10,800 cubic-feet per second
Left abutment 5 -- 498.1 -- 491.5 6.3 11.0 -- 17.3 474.2 --
Right abutment 51 -- 498.6 -- 494.2 6.3 20.3 -- 26.6 467.6 --
18
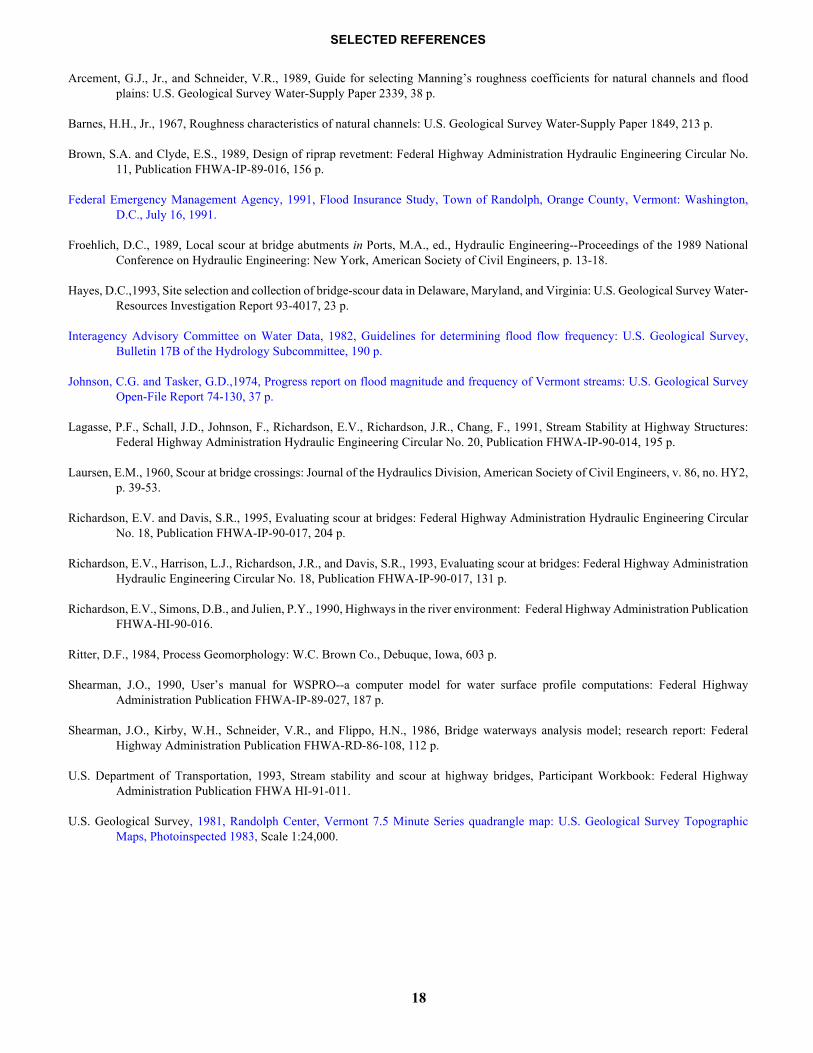
SELECTED REFERENCES
Arcement, G.J., Jr., and Schneider, V.R., 1989, Guide for selecting Manning’s roughness coefficients for natural channels and flood plains: U.S. Geological Survey Water-Supply Paper 2339, 38 p.
Barnes, H.H., Jr., 1967, Roughness characteristics of natural channels: U.S. Geological Survey Water-Supply Paper 1849, 213 p.
Brown, S.A. and Clyde, E.S., 1989, Design of riprap revetment: Federal Highway Administration Hydraulic Engineering Circular No. 11, Publication FHWA-IP-89-016, 156 p.
Federal Emergency Management Agency, 1991, Flood Insurance Study, Town of Randolph, Orange County, Vermont: Washington, D.C., July 16, 1991.
Froehlich, D.C., 1989, Local scour at bridge abutments in Ports, M.A., ed., Hydraulic Engineering--Proceedings of the 1989 National Conference on Hydraulic Engineering: New York, American Society of Civil Engineers, p. 13-18.
Hayes, D.C.,1993, Site selection and collection of bridge-scour data in Delaware, Maryland, and Virginia: U.S. Geological Survey Water-Resources Investigation Report 93-4017, 23 p.
Interagency Advisory Committee on Water Data, 1982, Guidelines for determining flood flow frequency: U.S. Geological Survey, Bulletin 17B of the Hydrology Subcommittee, 190 p.
Johnson, C.G. and Tasker, G.D.,1974, Progress report on flood magnitude and frequency of Vermont streams: U.S. Geological Survey Open-File Report 74-130, 37 p.
Lagasse, P.F., Schall, J.D., Johnson, F., Richardson, E.V., Richardson, J.R., Chang, F., 1991, Stream Stability at Highway Structures: Federal Highway Administration Hydraulic Engineering Circular No. 20, Publication FHWA-IP-90-014, 195 p.
Laursen, E.M., 1960, Scour at bridge crossings: Journal of the Hydraulics Division, American Society of Civil Engineers, v. 86, no. HY2, p. 39-53.
Richardson, E.V. and Davis, S.R., 1995, Evaluating scour at bridges: Federal Highway Administration Hydraulic Engineering Circular No. 18, Publication FHWA-IP-90-017, 204 p.
Richardson, E.V., Harrison, L.J., Richardson, J.R., and Davis, S.R., 1993, Evaluating scour at bridges: Federal Highway Administration Hydraulic Engineering Circular No. 18, Publication FHWA-IP-90-017, 131 p.
Richardson, E.V., Simons, D.B., and Julien, P.Y., 1990, Highways in the river environment: Federal Highway Administration Publication FHWA-HI-90-016.
Ritter, D.F., 1984, Process Geomorphology: W.C. Brown Co., Debuque, Iowa, 603 p.
Shearman, J.O., 1990, User’s manual for WSPRO--a computer model for water surface profile computations: Federal Highway Administration Publication FHWA-IP-89-027, 187 p.
Shearman, J.O., Kirby, W.H., Schneider, V.R., and Flippo, H.N., 1986, Bridge waterways analysis model; research report: Federal Highway Administration Publication FHWA-RD-86-108, 112 p.
U.S. Department of Transportation, 1993, Stream stability and scour at highway bridges, Participant Workbook: Federal Highway Administration Publication FHWA HI-91-011.
U.S. Geological Survey, 1981, Randolph Center, Vermont 7.5 Minute Series quadrangle map: U.S. Geological Survey Topographic Maps, Photoinspected 1983, Scale 1:24,000.

19
APPENDIX A:
WSPRO INPUT FILE

20
T1 U.S. GEOLOGICAL SURVEY WSPRO INPUT FILE rand034.wspT2 CREATED ON 28-MAR-95 FOR BRIDGE RANDTH0066034T3 SECOND BRANCH WHITE RIVER, TH 66, Town of RANDOLPH*J3 6 29 30 552 553 551 5 16 17 13 3 * 15 14 23 21 11 12 4 7 3J1 * * 0.001*Q 7660 10800 2749SK 0.0038 0.0038 0.0038*XS EXITX 0GR -150., 504.58 -119., 502.11 -113., 498.45 -93., 498.31GR -64., 497.69 -22., 496.77 -13., 498.01 -4., 495.71GR 0., 491.77 25., 491.81 33., 491.24 43., 491.94GR 52., 496.77 68., 500.82 88., 506.91N 0.036 0.038SA -13.*XS FULLV 57*BR BRIDG 57 498.4 30GR 5., 498.09 7., 491.54 21., 488.39 44., 492.42GR 50., 494.24 51., 498.65 5., 498.09CD 1 20.8 * * 10 6N 0.030*XR RDWAY 65 12.7 2 * 20GR -116., 506.39 -100., 501.73 -74., 501.08 -49., 500.88GR -14., 500.78 5., 501.13 5., 512. 60., 512.GR 60., 501.55 139., 503.31 183., 504.51 199., 506.90GR 214., 512.29BP 5** station 286 was based on slope between stations 182 and 236*AS APPRO 124GR -115., 507.86 -103., 503.28 -85., 499.57 -53., 498.48GR -31., 498.80 -10., 497.87 0., 490.92 8., 489.60GR 15., 489.13 24., 490.03 32., 492.21 40., 492.23GR 45., 496.45 78., 497.85 152., 500.02 182., 502.54GR 236., 504.84 286., 506.97N 0.036 0.033 0.036SA -10. 45.BP -10*HP 1 APPRO 505.12 1 505.12HP 2 APPRO 505.12 * * 7660HP 2 RDWAY 504.60 * * 4168HP 1 BRIDG 498.65 1 498.65HP 2 BRIDG 498.65 * * 3491*HP 1 APPRO 506.54 1 506.54HP 2 APPRO 506.54 * * 10800HP 2 RDWAY 505.84 * * 7305HP 1 BRIDG 498.65 1 498.65HP 2 BRIDG 498.65 * * 3503*
WSPRO INPUT FILE

21
APPENDIX B:
WSPRO OUTPUT FILE

WSPRO OUTPUT FILE
U.S. GEOLOGICAL SURVEY WSPRO INPUT FILE rand034.wsp CREATED ON 28-MAR-95 FOR BRIDGE RANDTH0066034 SECOND BRANCH WHITE RIVER, TH 66, Town of RANDOLPH *** RUN DATE & TIME: 07-06-95 10:09 CROSS-SECTION PROPERTIES: ISEQ = 5; SECID = APPRO; SRD = 124. WSEL SA# AREA K TOPW WETP ALPH LEW REW QCR 1 551. 71832. 98. 99. 7421. 2 745. 182183. 55. 59. 15571. 3 914. 104958. 198. 198. 11156. 505.12 2210. 358972. 350. 356. 1.42 -108. 243. 26394.
VELOCITY DISTRIBUTION: ISEQ = 5; SECID = APPRO; SRD = 124. WSEL LEW REW AREA K Q VEL 505.12 -107.8 242.6 2210.4 358972. 7660. 3.47 X STA. -107.8 -68.5 -48.2 -28.1 -10.0 -0.8 A(I) 167.1 130.7 129.1 124.0 96.8 V(I) 2.29 2.93 2.97 3.09 3.96
X STA. -0.8 4.3 8.8 12.9 16.9 21.2 A(I) 73.1 68.5 65.5 63.5 66.2 V(I) 5.24 5.59 5.85 6.04 5.79
X STA. 21.2 25.6 30.6 36.3 43.2 56.9 A(I) 67.0 70.2 73.5 84.4 116.8 V(I) 5.72 5.46 5.21 4.54 3.28
X STA. 56.9 72.5 91.1 113.4 142.3 242.6 A(I) 122.5 133.1 146.5 167.6 244.4 V(I) 3.13 2.88 2.61 2.29 1.57
VELOCITY DISTRIBUTION: ISEQ = 4; SECID = RDWAY; SRD = 65. WSEL LEW REW AREA K Q VEL 504.60 -109.9 183.6 555.1 42582. 4168. 7.51 X STA. -109.9 -93.1 -84.5 -76.9 -69.8 -63.2 A(I) 32.5 25.5 24.0 23.2 22.5 V(I) 6.42 8.17 8.69 8.97 9.27
X STA. -63.2 -56.5 -50.2 -44.0 -37.9 -31.8 A(I) 22.6 22.1 21.6 21.4 21.5 V(I) 9.24 9.45 9.66 9.73 9.68
X STA. -31.8 -25.8 -19.8 -13.9 -6.9 1.1 A(I) 21.4 21.5 21.1 24.7 27.1 V(I) 9.75 9.70 9.89 8.42 7.69
X STA. 1.1 68.5 81.3 96.9 118.0 183.6 A(I) 36.5 32.7 35.2 39.5 58.7 V(I) 5.71 6.37 5.92 5.28 3.55
CROSS-SECTION PROPERTIES: ISEQ = 3; SECID = BRIDG; SRD = 57. WSEL SA# AREA K TOPW WETP ALPH LEW REW QCR 1 295. 32380. 0. 89. 0. 498.65 295. 32380. 0. 89. 1.00 5. 51. 0.
VELOCITY DISTRIBUTION: ISEQ = 3; SECID = BRIDG; SRD = 57. WSEL LEW REW AREA K Q VEL 498.65 5.0 51.0 294.6 32380. 3491. 11.85 X STA. 5.0 10.0 12.4 14.5 16.3 18.0 A(I) 23.4 15.8 14.7 13.7 13.0 V(I) 7.46 11.01 11.89 12.77 13.39
X STA. 18.0 19.5 21.0 22.4 23.9 25.4 A(I) 12.5 12.4 12.0 12.3 12.3 V(I) 13.95 14.03 14.51 14.24 14.17
X STA. 25.4 27.1 28.7 30.5 32.4 34.5 A(I) 12.7 12.7 13.1 13.5 13.9 V(I) 13.77 13.76 13.31 12.89 12.53
X STA. 34.5 36.7 39.1 41.9 45.0 51.0 A(I) 14.3 15.2 16.1 16.9 24.1 V(I) 12.23 11.49 10.87 10.35 7.26
22
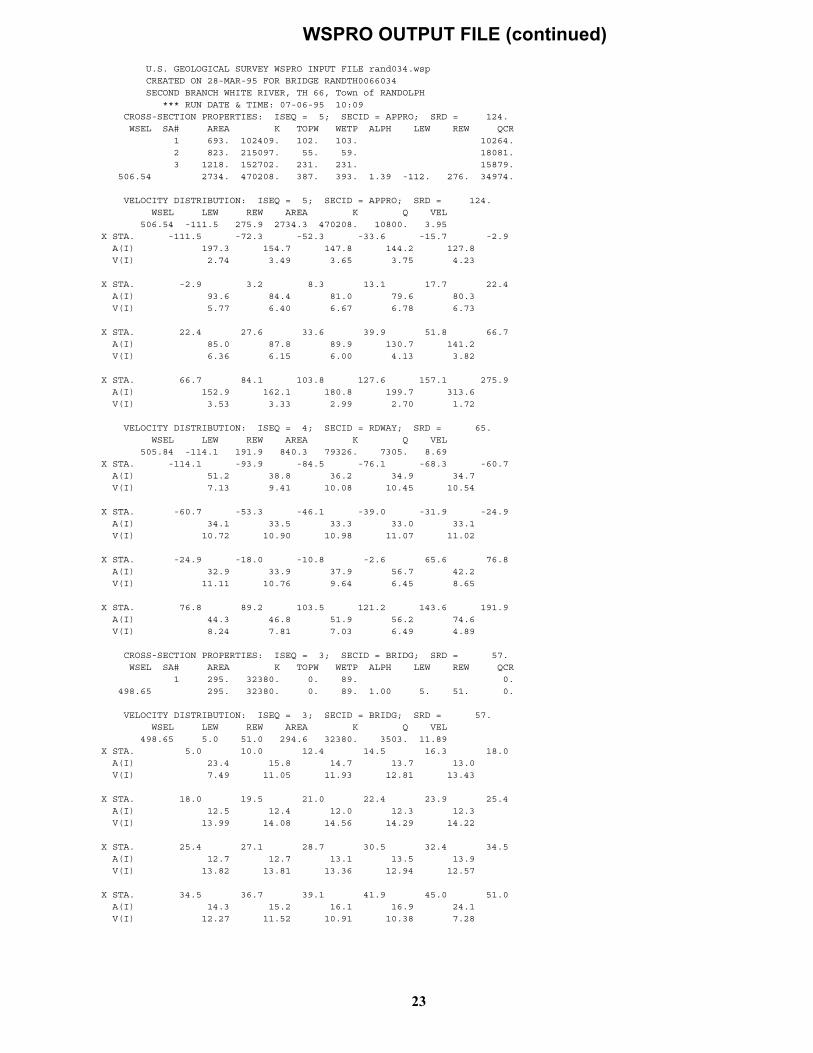
WSPRO OUTPUT FILE (continued)
U.S. GEOLOGICAL SURVEY WSPRO INPUT FILE rand034.wsp CREATED ON 28-MAR-95 FOR BRIDGE RANDTH0066034 SECOND BRANCH WHITE RIVER, TH 66, Town of RANDOLPH *** RUN DATE & TIME: 07-06-95 10:09 CROSS-SECTION PROPERTIES: ISEQ = 5; SECID = APPRO; SRD = 124. WSEL SA# AREA K TOPW WETP ALPH LEW REW QCR 1 693. 102409. 102. 103. 10264. 2 823. 215097. 55. 59. 18081. 3 1218. 152702. 231. 231. 15879. 506.54 2734. 470208. 387. 393. 1.39 -112. 276. 34974.
VELOCITY DISTRIBUTION: ISEQ = 5; SECID = APPRO; SRD = 124. WSEL LEW REW AREA K Q VEL 506.54 -111.5 275.9 2734.3 470208. 10800. 3.95 X STA. -111.5 -72.3 -52.3 -33.6 -15.7 -2.9 A(I) 197.3 154.7 147.8 144.2 127.8 V(I) 2.74 3.49 3.65 3.75 4.23
X STA. -2.9 3.2 8.3 13.1 17.7 22.4 A(I) 93.6 84.4 81.0 79.6 80.3 V(I) 5.77 6.40 6.67 6.78 6.73
X STA. 22.4 27.6 33.6 39.9 51.8 66.7 A(I) 85.0 87.8 89.9 130.7 141.2 V(I) 6.36 6.15 6.00 4.13 3.82
X STA. 66.7 84.1 103.8 127.6 157.1 275.9 A(I) 152.9 162.1 180.8 199.7 313.6 V(I) 3.53 3.33 2.99 2.70 1.72
VELOCITY DISTRIBUTION: ISEQ = 4; SECID = RDWAY; SRD = 65. WSEL LEW REW AREA K Q VEL 505.84 -114.1 191.9 840.3 79326. 7305. 8.69 X STA. -114.1 -93.9 -84.5 -76.1 -68.3 -60.7 A(I) 51.2 38.8 36.2 34.9 34.7 V(I) 7.13 9.41 10.08 10.45 10.54
X STA. -60.7 -53.3 -46.1 -39.0 -31.9 -24.9 A(I) 34.1 33.5 33.3 33.0 33.1 V(I) 10.72 10.90 10.98 11.07 11.02
X STA. -24.9 -18.0 -10.8 -2.6 65.6 76.8 A(I) 32.9 33.9 37.9 56.7 42.2 V(I) 11.11 10.76 9.64 6.45 8.65
X STA. 76.8 89.2 103.5 121.2 143.6 191.9 A(I) 44.3 46.8 51.9 56.2 74.6 V(I) 8.24 7.81 7.03 6.49 4.89
CROSS-SECTION PROPERTIES: ISEQ = 3; SECID = BRIDG; SRD = 57. WSEL SA# AREA K TOPW WETP ALPH LEW REW QCR 1 295. 32380. 0. 89. 0. 498.65 295. 32380. 0. 89. 1.00 5. 51. 0.
VELOCITY DISTRIBUTION: ISEQ = 3; SECID = BRIDG; SRD = 57. WSEL LEW REW AREA K Q VEL 498.65 5.0 51.0 294.6 32380. 3503. 11.89 X STA. 5.0 10.0 12.4 14.5 16.3 18.0 A(I) 23.4 15.8 14.7 13.7 13.0 V(I) 7.49 11.05 11.93 12.81 13.43
X STA. 18.0 19.5 21.0 22.4 23.9 25.4 A(I) 12.5 12.4 12.0 12.3 12.3 V(I) 13.99 14.08 14.56 14.29 14.22
X STA. 25.4 27.1 28.7 30.5 32.4 34.5 A(I) 12.7 12.7 13.1 13.5 13.9 V(I) 13.82 13.81 13.36 12.94 12.57
X STA. 34.5 36.7 39.1 41.9 45.0 51.0 A(I) 14.3 15.2 16.1 16.9 24.1 V(I) 12.27 11.52 10.91 10.38 7.28
23

WSPRO OUTPUT FILE (continued)
U.S. GEOLOGICAL SURVEY WSPRO INPUT FILE rand034.wsp CREATED ON 28-MAR-95 FOR BRIDGE RANDTH0066034 SECOND BRANCH WHITE RIVER, TH 66, Town of RANDOLPH *** RUN DATE & TIME: 07-06-95 10:09 CROSS-SECTION PROPERTIES: ISEQ = 5; SECID = APPRO; SRD = 124. WSEL SA# AREA K TOPW WETP ALPH LEW REW QCR 1 162. 10639. 81. 81. 1301. 2 509. 96608. 55. 59. 8798. 3 266. 19013. 117. 117. 2274. 500.83 937. 126260. 253. 257. 1.58 -91. 162. 8150.
VELOCITY DISTRIBUTION: ISEQ = 5; SECID = APPRO; SRD = 124. WSEL LEW REW AREA K Q VEL 500.83 -91.1 161.6 937.2 126260. 2749. 2.93 X STA. -91.1 -34.4 -5.5 -0.2 3.2 6.1 A(I) 102.8 79.8 42.3 34.0 31.4 V(I) 1.34 1.72 3.25 4.05 4.38
X STA. 6.1 8.9 11.4 13.9 16.3 18.9 A(I) 30.5 29.3 28.8 28.3 28.6 V(I) 4.51 4.69 4.78 4.87 4.80
X STA. 18.9 21.4 24.1 27.1 30.6 34.5 A(I) 28.7 29.8 30.7 33.0 34.0 V(I) 4.79 4.61 4.47 4.16 4.04
X STA. 34.5 38.5 45.2 62.1 88.0 161.6 A(I) 34.4 46.2 67.8 81.2 115.8 V(I) 4.00 2.98 2.03 1.69 1.19
CROSS-SECTION PROPERTIES: ISEQ = 3; SECID = BRIDG; SRD = 57. WSEL SA# AREA K TOPW WETP ALPH LEW REW QCR 1 295. 32380. 0. 89. 0. 498.65 295. 32380. 0. 89. 1.00 5. 51. 0.
VELOCITY DISTRIBUTION: ISEQ = 3; SECID = BRIDG; SRD = 57. WSEL LEW REW AREA K Q VEL 498.65 5.0 51.0 294.6 32380. 2749. 9.33 X STA. 5.0 10.0 12.4 14.5 16.3 18.0 A(I) 23.4 15.8 14.7 13.7 13.0 V(I) 5.88 8.67 9.37 10.05 10.54
X STA. 18.0 19.5 21.0 22.4 23.9 25.4 A(I) 12.5 12.4 12.0 12.3 12.3 V(I) 10.98 11.05 11.43 11.21 11.16
X STA. 25.4 27.1 28.7 30.5 32.4 34.5 A(I) 12.7 12.7 13.1 13.5 13.9 V(I) 10.85 10.83 10.48 10.15 9.87
X STA. 34.5 36.7 39.1 41.9 45.0 51.0 A(I) 14.3 15.2 16.1 16.9 24.1 V(I) 9.63 9.04 8.56 8.15 5.71
24
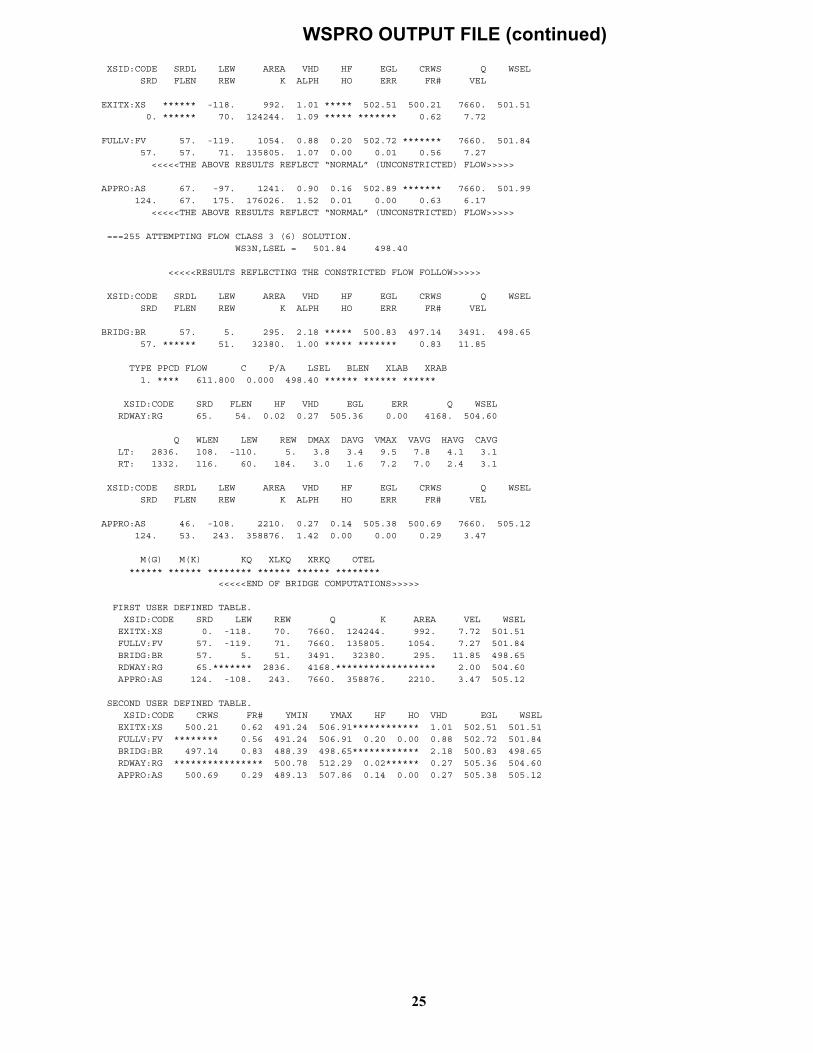
WSPRO OUTPUT FILE (continued)
XSID:CODE SRDL LEW AREA VHD HF EGL CRWS Q WSEL SRD FLEN REW K ALPH HO ERR FR# VEL
EXITX:XS ****** -118. 992. 1.01 ***** 502.51 500.21 7660. 501.51 0. ****** 70. 124244. 1.09 ***** ******* 0.62 7.72
FULLV:FV 57. -119. 1054. 0.88 0.20 502.72 ******* 7660. 501.84 57. 57. 71. 135805. 1.07 0.00 0.01 0.56 7.27 <<<<<THE ABOVE RESULTS REFLECT “NORMAL” (UNCONSTRICTED) FLOW>>>>>
APPRO:AS 67. -97. 1241. 0.90 0.16 502.89 ******* 7660. 501.99 124. 67. 175. 176026. 1.52 0.01 0.00 0.63 6.17 <<<<<THE ABOVE RESULTS REFLECT “NORMAL” (UNCONSTRICTED) FLOW>>>>>
===255 ATTEMPTING FLOW CLASS 3 (6) SOLUTION. WS3N,LSEL = 501.84 498.40
<<<<<RESULTS REFLECTING THE CONSTRICTED FLOW FOLLOW>>>>>
XSID:CODE SRDL LEW AREA VHD HF EGL CRWS Q WSEL SRD FLEN REW K ALPH HO ERR FR# VEL
BRIDG:BR 57. 5. 295. 2.18 ***** 500.83 497.14 3491. 498.65 57. ****** 51. 32380. 1.00 ***** ******* 0.83 11.85
TYPE PPCD FLOW C P/A LSEL BLEN XLAB XRAB 1. **** 611.800 0.000 498.40 ****** ****** ******
XSID:CODE SRD FLEN HF VHD EGL ERR Q WSEL RDWAY:RG 65. 54. 0.02 0.27 505.36 0.00 4168. 504.60
Q WLEN LEW REW DMAX DAVG VMAX VAVG HAVG CAVG LT: 2836. 108. -110. 5. 3.8 3.4 9.5 7.8 4.1 3.1 RT: 1332. 116. 60. 184. 3.0 1.6 7.2 7.0 2.4 3.1
XSID:CODE SRDL LEW AREA VHD HF EGL CRWS Q WSEL SRD FLEN REW K ALPH HO ERR FR# VEL
APPRO:AS 46. -108. 2210. 0.27 0.14 505.38 500.69 7660. 505.12 124. 53. 243. 358876. 1.42 0.00 0.00 0.29 3.47
M(G) M(K) KQ XLKQ XRKQ OTEL ****** ****** ******** ****** ****** ******** <<<<<END OF BRIDGE COMPUTATIONS>>>>>
FIRST USER DEFINED TABLE. XSID:CODE SRD LEW REW Q K AREA VEL WSEL EXITX:XS 0. -118. 70. 7660. 124244. 992. 7.72 501.51 FULLV:FV 57. -119. 71. 7660. 135805. 1054. 7.27 501.84 BRIDG:BR 57. 5. 51. 3491. 32380. 295. 11.85 498.65 RDWAY:RG 65.******* 2836. 4168.****************** 2.00 504.60 APPRO:AS 124. -108. 243. 7660. 358876. 2210. 3.47 505.12
SECOND USER DEFINED TABLE. XSID:CODE CRWS FR# YMIN YMAX HF HO VHD EGL WSEL EXITX:XS 500.21 0.62 491.24 506.91************ 1.01 502.51 501.51 FULLV:FV ******** 0.56 491.24 506.91 0.20 0.00 0.88 502.72 501.84 BRIDG:BR 497.14 0.83 488.39 498.65************ 2.18 500.83 498.65 RDWAY:RG **************** 500.78 512.29 0.02****** 0.27 505.36 504.60 APPRO:AS 500.69 0.29 489.13 507.86 0.14 0.00 0.27 505.38 505.12
25

WSPRO OUTPUT FILE (continued)
XSID:CODE SRDL LEW AREA VHD HF EGL CRWS Q WSEL SRD FLEN REW K ALPH HO ERR FR# VEL
EXITX:XS ****** -129. 1269. 1.20 ***** 504.13 501.22 10800. 502.93 0. ****** 75. 175193. 1.06 ***** ******* 0.62 8.51
FULLV:FV 57. -133. 1337. 1.08 0.20 504.34 ******* 10800. 503.26 57. 57. 76. 187985. 1.06 0.00 0.01 0.58 8.08 <<<<<THE ABOVE RESULTS REFLECT “NORMAL” (UNCONSTRICTED) FLOW>>>>>
APPRO:AS 67. -104. 1704. 0.92 0.16 504.50 ******* 10800. 503.59 124. 67. 207. 259277. 1.47 0.00 0.00 0.58 6.34 <<<<<THE ABOVE RESULTS REFLECT “NORMAL” (UNCONSTRICTED) FLOW>>>>>
===255 ATTEMPTING FLOW CLASS 3 (6) SOLUTION. WS3N,LSEL = 503.26 498.40
<<<<<RESULTS REFLECTING THE CONSTRICTED FLOW FOLLOW>>>>>
XSID:CODE SRDL LEW AREA VHD HF EGL CRWS Q WSEL SRD FLEN REW K ALPH HO ERR FR# VEL
BRIDG:BR 57. 5. 295. 2.20 ***** 500.85 497.16 3503. 498.65 57. ****** 51. 32380. 1.00 ***** ******* 0.83 11.89
TYPE PPCD FLOW C P/A LSEL BLEN XLAB XRAB 1. **** 6. 0.800 0.000 498.40 ****** ****** ******
XSID:CODE SRD FLEN HF VHD EGL ERR Q WSEL RDWAY:RG 65. 54. 0.03 0.34 506.85 0.00 7305. 505.84
Q WLEN LEW REW DMAX DAVG VMAX VAVG HAVG CAVG LT: 4495. 112. -114. 5. 5.1 4.5 11.0 9.0 5.5 3.1 RT: 2810. 124. 60. 192. 4.3 2.7 9.1 8.3 3.7 3.1
XSID:CODE SRDL LEW AREA VHD HF EGL CRWS Q WSEL SRD FLEN REW K ALPH HO ERR FR# VEL
APPRO:AS 46. -112. 2734. 0.34 0.18 506.88 501.75 10800. 506.54 124. 55. 276. 470221. 1.39 0.00 0.00 0.31 3.95
M(G) M(K) KQ XLKQ XRKQ OTEL ****** ****** ******** ****** ****** ********
<<<<<END OF BRIDGE COMPUTATIONS>>>>> FIRST USER DEFINED TABLE. XSID:CODE SRD LEW REW Q K AREA VEL WSEL EXITX:XS 0. -129. 75. 10800. 175193. 1269. 8.51 502.93 FULLV:FV 57. -133. 76. 10800. 187985. 1337. 8.08 503.26 BRIDG:BR 57. 5. 51. 3503. 32380. 295. 11.89 498.65 RDWAY:RG 65.******* 4495. 7305.****************** 2.00 505.84 APPRO:AS 124. -112. 276. 10800. 470221. 2734. 3.95 506.54
SECOND USER DEFINED TABLE. XSID:CODE CRWS FR# YMIN YMAX HF HO VHD EGL WSEL EXITX:XS 501.22 0.62 491.24 506.91************ 1.20 504.13 502.93 FULLV:FV ******** 0.58 491.24 506.91 0.20 0.00 1.08 504.34 503.26 BRIDG:BR 497.16 0.83 488.39 498.65************ 2.20 500.85 498.65 RDWAY:RG **************** 500.78 512.29 0.03****** 0.34 506.85 505.84 APPRO:AS 501.75 0.31 489.13 507.86 0.18 0.00 0.34 506.88 506.54
26
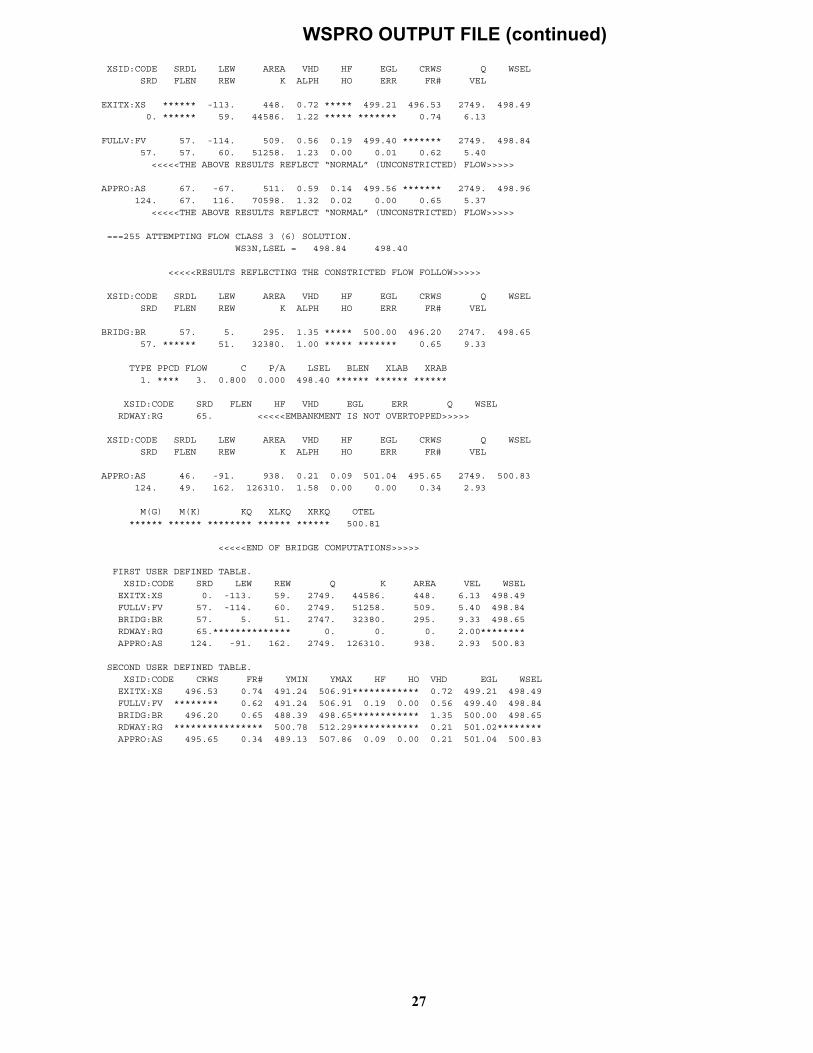
WSPRO OUTPUT FILE (continued)
XSID:CODE SRDL LEW AREA VHD HF EGL CRWS Q WSEL SRD FLEN REW K ALPH HO ERR FR# VEL
EXITX:XS ****** -113. 448. 0.72 ***** 499.21 496.53 2749. 498.49 0. ****** 59. 44586. 1.22 ***** ******* 0.74 6.13
FULLV:FV 57. -114. 509. 0.56 0.19 499.40 ******* 2749. 498.84 57. 57. 60. 51258. 1.23 0.00 0.01 0.62 5.40 <<<<<THE ABOVE RESULTS REFLECT “NORMAL” (UNCONSTRICTED) FLOW>>>>>
APPRO:AS 67. -67. 511. 0.59 0.14 499.56 ******* 2749. 498.96 124. 67. 116. 70598. 1.32 0.02 0.00 0.65 5.37 <<<<<THE ABOVE RESULTS REFLECT “NORMAL” (UNCONSTRICTED) FLOW>>>>>
===255 ATTEMPTING FLOW CLASS 3 (6) SOLUTION. WS3N,LSEL = 498.84 498.40
<<<<<RESULTS REFLECTING THE CONSTRICTED FLOW FOLLOW>>>>>
XSID:CODE SRDL LEW AREA VHD HF EGL CRWS Q WSEL SRD FLEN REW K ALPH HO ERR FR# VEL
BRIDG:BR 57. 5. 295. 1.35 ***** 500.00 496.20 2747. 498.65 57. ****** 51. 32380. 1.00 ***** ******* 0.65 9.33
TYPE PPCD FLOW C P/A LSEL BLEN XLAB XRAB 1. **** 3. 0.800 0.000 498.40 ****** ****** ******
XSID:CODE SRD FLEN HF VHD EGL ERR Q WSEL RDWAY:RG 65. <<<<<EMBANKMENT IS NOT OVERTOPPED>>>>>
XSID:CODE SRDL LEW AREA VHD HF EGL CRWS Q WSEL SRD FLEN REW K ALPH HO ERR FR# VEL
APPRO:AS 46. -91. 938. 0.21 0.09 501.04 495.65 2749. 500.83 124. 49. 162. 126310. 1.58 0.00 0.00 0.34 2.93
M(G) M(K) KQ XLKQ XRKQ OTEL ****** ****** ******** ****** ****** 500.81
<<<<<END OF BRIDGE COMPUTATIONS>>>>>
FIRST USER DEFINED TABLE. XSID:CODE SRD LEW REW Q K AREA VEL WSEL EXITX:XS 0. -113. 59. 2749. 44586. 448. 6.13 498.49 FULLV:FV 57. -114. 60. 2749. 51258. 509. 5.40 498.84 BRIDG:BR 57. 5. 51. 2747. 32380. 295. 9.33 498.65 RDWAY:RG 65.************** 0. 0. 0. 2.00******** APPRO:AS 124. -91. 162. 2749. 126310. 938. 2.93 500.83
SECOND USER DEFINED TABLE. XSID:CODE CRWS FR# YMIN YMAX HF HO VHD EGL WSEL EXITX:XS 496.53 0.74 491.24 506.91************ 0.72 499.21 498.49 FULLV:FV ******** 0.62 491.24 506.91 0.19 0.00 0.56 499.40 498.84 BRIDG:BR 496.20 0.65 488.39 498.65************ 1.35 500.00 498.65 RDWAY:RG **************** 500.78 512.29************ 0.21 501.02******** APPRO:AS 495.65 0.34 489.13 507.86 0.09 0.00 0.21 501.04 500.83
27

28
APPENDIX C:
BED-MATERIAL PARTICAL-SIZE DISTRIBUTION
29
App
endi
x C
. Bed
mat
eria
l par
ticl
e-si
ze d
istr
ibut
ions
for
thre
e pe
bble
cou
nt tr
anse
cts
at th
e ap
proa
ch c
ross
-sec
tion
for
stru
ctur
e R
AN
DT
H00
6600
34, i
n R
ando
lph,
Ver
mon
t.
SIZ
E (
MM
)
0
10
0 05
10
15
20
25
30
35
40
45
50
55
60
65
70
75
80
85
90
95
CUM. % FINER
0.0
11
00
0.0
20
.05
0.1
0.2
0.5
12
51
02
05
0S
IZE
(M
M)
30
APPENDIX D:
HISTORICAL DATA FORM