Embed Size (px)
Citation preview
Report No. FAA-RD--9 LEVEL. PILOTED FLIGHT SIMULATION STUDY
OF LOW-LEVEL WIND SHEAR, PHASE 3
ALL-WEATHER LANDING SYSTEMS, ENGINEERING SERVICES>SUPPORT PROJECT, TASK 2
W. B. Gartner, D. M. Condra, W. H. Foy,* W. 0. Nice, C. E. Wischmeyer
SRI INTERNATIONAL, MENLO PARK; CALIFORNIA 94025
4 .
0a0
March 1978
Interim Report
Document is available to the U.S. public throughC" the National Technical Informathan Service,C-") Springfield, Vlginia 22161.
Pmpwd for
U.S. DEPARTMENT OF TRANSPORTATIONFEDERAL AVIATION ADMINIRATION
Systms Rsech & Development SrviceWahk i D.C. 20

DISCLAIMER NOTICE
THIS DOCUMENT IS BEST QUALITYPRACTICABLE. THE COPY FURNISHEDTO DTIC CONTAINED A SIGNIFICANTNUMBER OF PAGES WHICH DO NOTREPRODUCE LEGIBLY.
NOTICE
This document is disseminated under the sponsorshipof the Department of Transportation in the interestof information exchange. The United States Govern-mint assumes no liability for its contents or usethereof.
k

r7 Technical Report Docum*ntatiwi Page
,IWTED JLIGT JIMULAT0NJTUDY C)( ] AQfLAztonCdOFJOW-LEVEL~yJ W AR- SE 3., *~o~nCd
7. W B./Gartner, D. 4. /Condra, W. H./Foyi
S. Dneprtnatof rnpottoalJ Ar - eFdalAviation Admminitration
Systems Research and Developmlent Service .*-*nSeing Agency Code-
Washington, D.C. 20590 FA/ARD- 7431S. Supplementary Notes
>* Thstsi4ocrndwt developlment and test by piloted flight simulationof airborne techniques designed to aid the pilot to detect and cope with low-levelwind shear. This report documents the Phase 3 tests on a DC-10 aircraft simulator,involving a met of wind profiles significantly expanded over those used previously and,an especially large group (26) of subject pilots in the major test.
The operational situation simulated was a landing under Category I visibility to a7000-ft runway with ILS guidance.* Thorp were 10 different wii~ profiles, with windshear ranging from low to high severity ~'i is ee~e~a itial ?fial (*n- -
-hId various aiding concepts were compared in individual, experlmaents. This involved4 versions of groundspeed displays, 2 versions of modified (acceleration-aumted)flight director steering and speed cainmnds, and 2 go-around decision aids-, a compu-tation of longitudinal acceleration margin and an energy-rate meter. The mdore promis-ing were comined in 3 systnemauhde-ve~etested in &AIll Z~ial.
Performaence wes mrginal, but would ha*e been adequate if all the go-around advis-ories had been honored. False-alarm and missed-alarm rates ofi the advisories were toohigh. Additional work was recomended on go-around decision aids, the important ofeffective go-around decision aids being emphasised. it uas noted that the go-aroundwarning requires improved consistency in backup information; an on-off display is not
Thiuaswork us accalehed by the AWLS tm (SRI, Bunker Ram.o Corp., Collins Avio-nics Group) with Douglas Aircraft Co. as simulation subcontractor.
17. Key Words It. Distribution Statementwind shear DC-10 flight simulation Documnt is available to the U.S. publicgroundspeed go-around aid through the National Technical Informationflight director Service, Springfield, Virginia, 22161.airborne instrumeintation.
to. 5etru.ity Clessil. (of this "WOpM. segurity Clesif. (of this poe) 21. He. of Poees 2L. Price
UNCIMSIYIZ MI ASFR 122
Feru DOT F 1700.7 (8-721 ROMN1e ofi,. O Pleg. eutw"Fied

to3
E E -E- -"I
w I'= 7- I" 1, 13 Ic
ilit
I&I6 ot 0I'

PREFACE
The purpose of Task 2 of the All-Weather Landing Systems (AWLS) pro-
ject is to develop and implement a manned flight simulation program to
(1) investigate terminal flight operations, emphasizing wind shear effects,
and (2) determine the operational and technical role of head-up displays.
This interim report describes the results obtained by the AWLS teem--SRI,
Bunker Ramo Corporation, and Collins Avionics Group of Rockwell International
--on an advanced test with a DC-10-10 aircraft simulator of the capabili-
ties of certain aiding concepts to assist the pilot in coping with low-
level wind shear, particularly on approach and landing. The aids were
based on airborne instrumentation and the information was displayed on
the instrument panel. Tests were made of go-around decision aids as well
as approach management techniques. The sponsoring organizations are FAA
Wind Shear Program Office and ARD-740; the Technical Monitor is W. J.
Cox.
COX.
1! G!;AA&DVDC TAB
jx.ati ji j.t ion
Distr
tii
i
4T27. de

TABLE OF CONTENTS
I INTRODUCTION ........................ 1A. Program, Objectives and Approach ........... IB. Organization of Report ................ 5
11 1METHOD .. . . ... a .. .. .. . .. .. .
A. Simulator Configuration ................ 7B. Wind Profiles for Simulation Tests . . . . ...... 11C. Evaluation Plan n. .................. 12
III INITIAL TRIALS .. .. .. .. .. .. .. .. .. .. . .. 17
A. Groundspeed Concepts ................. 17B. Modified Flight Director Concepts . . . .. . . . . . . 27C. Go-Around Advisory Concepts .............. 36
IV FULL TRIAL . . . . 47
A. Systems Tested . . . . . . . * . ... . . . ... . . 47B. Evaluation Plan . . . . . . . .. . a .. . .. . .. 48C. Approach and Landing Outcomes * . . . * 9. ** 53
V CONCLUSIONS AND RECOCENDATIONS ............... 91
A. Conclusions Based on Initial Trial . . . . 0 . ... . 91B. Conclusions Based on Full Trial ...... . . . .. 93C. Recinendations . . . . ............... 94
APPENDICES
A. Description of Wind Shear Profiles .......... 97
B. On-Site Data Recording ....... ...... . 108
REFERENCES ........................... 115
ILLUSTRATIONS
1. Douglas Moving Base Development Flight Sinulator . . . . .
2. Simulated DC-10 Cockpit 9 . . ............... 93. Simple St ry Data Printout ............... 16
4. Airspeed/Groundapeed Display with Past/Slow . . .... 18
v

5. Computational Algorithm for Deriving the Modified Fast/SlowSpeed Command . . . . . . . . . . . .. . .. . 20
6. Digital Readout of Groundspeed . . . . . . . . .. . . . . 21
7. Simplified Control Law for Modified Flight Director . . . . 28-29
8. Baseline DC-10 Flight Director . . . . . .. . . . . . .. 30-31
9. Modified Speed Axis Control Law MFDT-1 (Without GroundspeedInformation) . . . . . . . a * .. . . . . . . . . . 32
10. Modified Speed Axis Control Law MFDT-2 with DiminishingHeadwind Shear Compensation . ....... . ...... 33
11. Douglas Energy Rate Instrument . • * * . a .. . ... .. 39
12. Performance of Go-Around Decision Aids . . . . . . . . 43
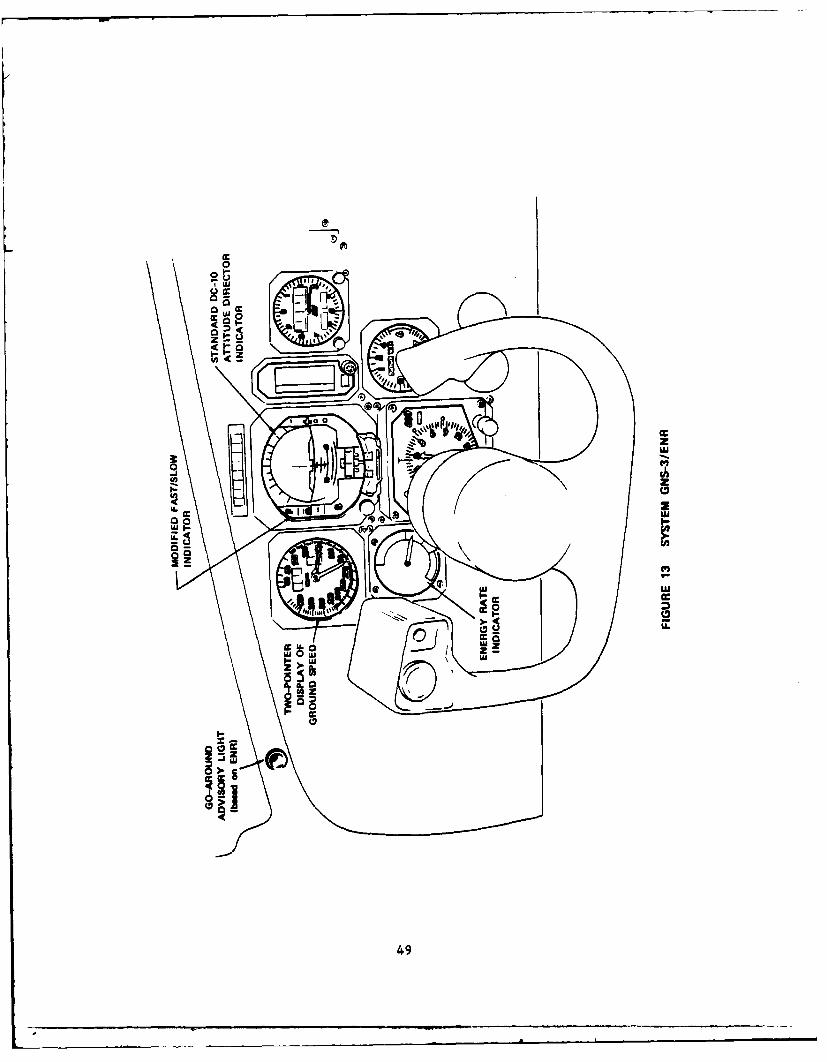
13. System GNqS-3/ENR .. . . . . . . ... . . . .... 49
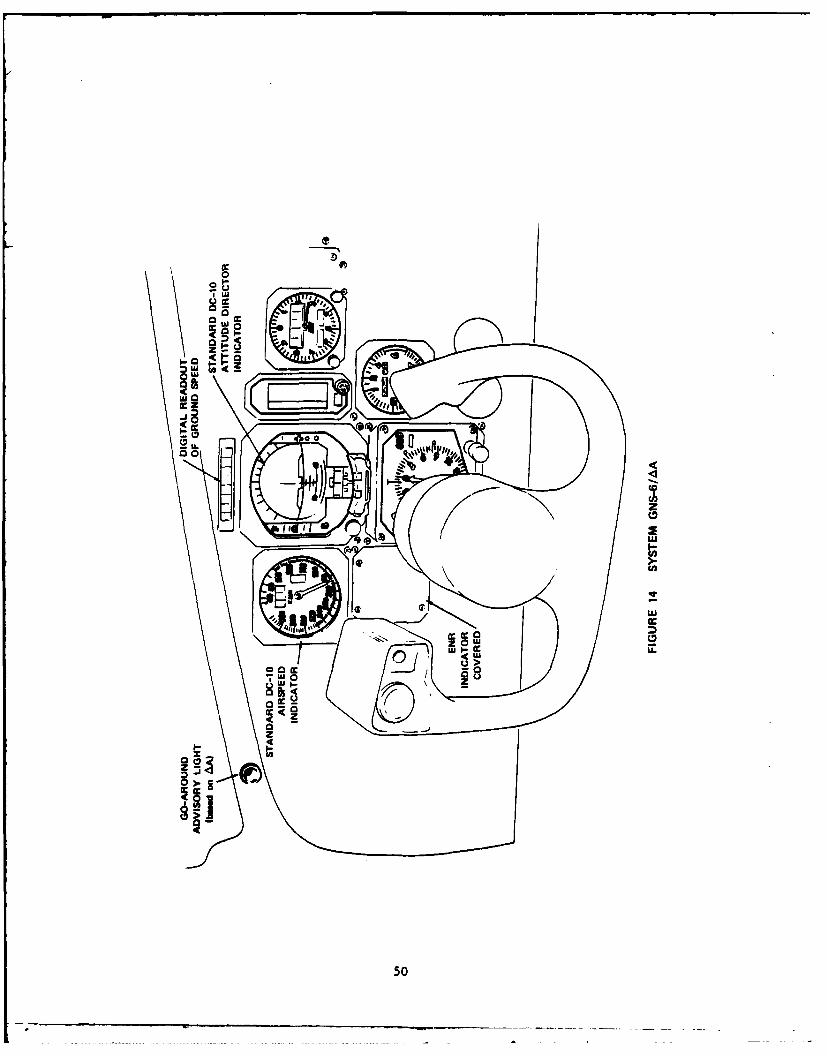
14. System GNS-6/AA . . . . . . . . . . . . . . . . . . . . . . 50
15. System MFDT-2/ENR . . . * ... .. ... . ... ... . . 51
16. Lending Outcomes .......... . .......... 56-57
17. Position Dispersions at Inner Marker with GQS-3/ENR . . . . 60
18. Position Dispersions at Inner Marker with GNS-6/M . . . . 61
19. Position Dispersions at Inner Marker with MFDT-2/ENR . . . 62
20. Position Dispersions at Touchdown with GNS-3/ER .. . . . 63
21. Position Dispersions at Touchdow with GQS-6/AA . . . . . . 64
22. Position Dispersions at Touchdwon with MFDT-2/ENR . . . . . 65
23. Airspeed Management During the Low-level Shear EncountersUsing Each Aid . . . . . . .. . ... . ... . . ... 68
24. Maximum Drop in Groundspeed Over the 500 to 100-FootApproach Segment 0 . . ..... . ... ..... 70
25. Effects of Airspeed Management Techniques on TouchdownPosition and Groundspeed . .. . . . . * . ... ... . 71
26. Glide Slope Tracking Accuracy During Low-level ShearEncounters . . . .. . . . . . . .. 73
27. Localizer Tracking Accuracy During Low-level ShearEncounters . . ..................... 74
28. Accuracy of Flight Director Comand Following During Low-level Shear ncounters ....... .......... 75
29. Control Activity During Low-level Shear Encounters .... 77
30. Typical Aircraft Response to Low-level Wind Shear onTakeoff and Climbout . . . . . . . . . . . . ..... 85-89
A-1. Wind Profile 1, Approach on 30 Glide Path . . . . ..... 100
A-2. Wind Profile 5, Approach on 30 Glide Path ......... 100
vi

A-3. Wind Profile 7, Approach on 30 Glide Path ......... 101
A-4. Wind Profile 8, Approach on 30 Glide Path . . . . . . . 101
A-5. Wind Profile 2, Approach on 30 Glide Path . . * . ... 102
A-6. Wind Profile 9, Approach on 30 Glide Path . . . . . . . . . 102
A-7. Wind Profile 6, Approach on 30 Glide Path . . . . . .. . . 103
A-8. Wind Profile 10, Approach on 30 Glide Path .. * . . .. 103
A-9. Wind Profile 4, Approach on 30 Glide Path . . . ... . . . 104
A-10. Wind Profile 3, Approach on 30 Glide Path . . . . . . . .. 104
A-11. Wind Profile 11, Takeoff with 60 Clinbout .. . . . . . . . 105
A-12. Wind Profile 12, Takeoff with 60 Climbout . . . . . . . .. 105
A-13. Wind Profile 13, Takeoff with 60 Climbout . . . # * .. .. 106
A-14. Wind Profile 14, Takeoff with 60 Climbout . . . . * . . . . 106
A-15. Wind Profile 15, Takeoff with 60 Climbout . ... . . .. 107
TABLES
1. Subject Pilots . . . . . 6
2. Simulator Motion Limits .................. 10
3. Experimental Design for the Groundspeed Experiment .... 23
4. Order of Pilot Assignment to Alternative GroundspeedConcepts . . . . .. . . . . . . . . . . . . . . . . . 23
5. Summary of Approach and Landing Outcomes in the InitialTesting of Groundspeed Display Concepts .......... 25
6. Inner-Marker Limits ........... ........ 26
7. Landing-Outcome Limits ........ e ......... 26
8. Order of Pilot Exposure to Alternative MFD Concepts . ... 34
9. Summary of Approach and Landing Outcomes in the InitialTesting of Alternative MFD Thrust Commands . . . .... 35
10. Plan for the Go-Around Advisory Experiment . . . . . . .. 41
ll. Order of Pilot Exposure to Alternative Go-Around AdvisoryConcepts . . . . * . . . . . . . .. . . . . . . . . . . . 41
12. Summary of Approach and Landing Outcomes in the InitialTesting of Go-Around Advisories .......... .... 44
13. Comparative Performance of Alternative Techniques forProviding Go-Around Advisories .............. 45
14. Test Plan for Full-Scale Testing of Selected Systems . . . 52
vii,

15. Wind Shear Profiles Selected for Full-Scale Testing .... 54
16. S-mmary Data on Approach and Landing Outcomes for theFull-Scale Testing of Selected Aids . .. . . * . . .. . . 59
17. Validity of Go-Around Advisory Announcements for EachAiding Concept by Level of Shear Severity . . . . . . . . . 67
18. Pilot Workload Ratings . . . a . .. . .. . ... . . . . 78
19. Pilot Acceptance Ratings . . . . . .. ... . . . .. 79
20. Su-ary Data on Aircraft Response to Wind Shear Encountersfor Seven Attempted Takeoffs . . . . .. .. ... . * 90
A-i. Summary of Wind Profiles Used in Piloted Simulations . . . 99
B-1. Flight Situation Parameters Recorded on Magnetic Tape . . . 109
B-2. Flight Situation Parameters Recorded on Strip Charts . . . 111
B-3. Data Entries of the Summary Printout . . . . . . . . . . 112
viii

I INTRODUCTION
A. Program, Objectives and Approach
The flight simulation test reported here is an element of the major
FAA program that has the objectives of examining the hazards associated
with wind shear in the terminal area, developing solutions to the wind
shear problem, implementing such solutions and integrating them into the
National Airspace System. One segment of the program is designed to in-
vestigate potential solutions in the category of airborne equipment. In
this approach a series of manned flight simulation exercises have been
conducted for the FAA.
1*The first exercise was conducted in April and May of 1976 by the
AWLS team: SRI and Bunker Ramo Corporation (BR). The simulation support
subcontractor was Douglas Aircraft Company, McDonnell-Douglas Corporation,
Long Beach, California, and a DC-1O training simulator was used. This was
an exploratory exercise that examined the hazard presented by wind shear
in various approach and landing situations, and made a screening evalua-
tion of a variety of possible techniques for aiding the pilot; 8 subject
pilots "flew" against 4 wind profiles, 3 with significant shear. In July,
1976, the FAA Simulation Branch, ARD-540, conducted a similar exploratory
exercise with a B-737 model in the Flight Simulator for Advanced Aircraft
(FSAA) at the National Aeronautics and Space Administration, Ames Research
Center. There were 11 subject pilots and 3 wind shear profiles. These
two tests indicated a number of aiding techniques that held promise for
further trial. A Phase 2 study2 was conducted by SRI and BR in the peri-
od November 1976, through January 1977. The simulation subcontractor was
Douglas again; a DC-10-10 aircraft was modeled in the Douglas Moving Base
Development Flight Simulator (MBDFS). Using 4 wind profiles, 3 with shear,
and a total of 16 subject pilots, we ran three distinct experiments to test
RReferences are listed at the end of this report.

potential aiding concepts ag&#nst conventional current approach manage-
ment: aids based on groundspeed, aids based on flight path angle, and
a design for modified (acceleration-augmented) flight director steering
commands developed by Collins Avionics Group, Rockwell International, of
the AWLS team. The best performance was shown by a two-needle display
of airspeed and groundspeed, and by the Collins modified flight director;
both techniques were significantly better than the conventional (i.e.,
baseline).
These studies, with supporting work by the AWLS team and with inde-
pendent wind shear investigations by others, form the background for the
Phase 3 tests. The purpose of these tests was to evaluate the capabili-
ties of improved groundspeed displays and acceleration-augmented flight
directors to provide solutions to wind sheer encounters for comnmercial
wide-body turbojet aircraft. In addition, candidate aids for making
the go-around decision were evaluated. The tests were designed to
include an expanded collection of wind profiles. The exercise was con-
ducted in two parts: an Initial Trial in which various forms of the
techniques were compared, and a Full Trial in which the most promising
techniques and displays were combined to form candidate systems and were
tested in combination.
Development work for the exercise began in April 1977. Collins
initiated a study of acceleration-augmented flight director thrust com-
mands for coping with wind shear and their integration with the steering
commands of the modified flight director. SRI and BR undertook improve-
ment of the groundspeed algorithms and study of go-around decision aids.
On 25 April a letter was sent to Douglas requesting a proposal for simu-
lation support. Sole-source procurement was justified because of the
availability at Douglas of their MBDFS in DC-1O configuration, the exis-
tence in the Douglas simulator of necessary software, and our good experi-
ence with Douglas in earlier work. They responded on 27 May wiLh their
proposal 77D-177T. It was evaluated, it was found to be responsive and
the subcontract was negotiated. A test plan in stmnary form was submit-
ted to the FAA on 15 July. On 22 July a project meeting with Douglas
2
and the AWLS team was held at Long Beach, and Douglas was authorLzed to
start work. Collins delivered the modified flight director thrust and
steering comands on 8 August. Software checkout on the MBDFS started
on 15 August, and moving-base checks began on 22 August. A detailed
L test plan with specifications for the aiding concepts to be tested was
submitted to the FAA on 23 August. BR completed the briefing and debrief-
ing materials for the subject pilots, and BR project pilots made checkout
simulator runs on 6 September. The Initial Trials started on the 7th.
During 7-9 September, 4 subject pilots ran two experiments, one comparing
4 versions of ground speed displays and one comparing 2 different designs
of acceleration-augmented flight directors. A pilot "flew" 8 wind pro-
files with shear, 4 training and 4 for technique performance evaluation,
with each aiding concept. In the week 12-15 September, 4 more subject
pilots tested go-around decision aids in an experiment with the same 8
wind profiles, 4 for training and 4 for test. The aiding concepts were
compared with baseline; 3 techniques, one procedural and 2 incorporating
special displays, were tested individually and the 2 special displays
were each tested in combination with an approach management aid. This
completed the Initial Trial which provided 384 runs, 192 training and
192 for data. About 49 simulator hours were required.
After review of the results, 3 combinations of aids were selected
as systems to be tested in the Full Trial:
(1) Groundspeed displayed on the V needle of the airspeedindicator; groundspeed error incorporated in the flightdirector thrust coumand; display of rate-of-change ofenergy as go-around decision aid.
(2) Digital readout of groundspeed; groundspeed errorincorporated in the flight director thrust command;go-around warning light indicating a negative mar-gin of available acceleration compared to accelera-tion demanded by the wind shear.
(3) Modified (acceleration-augmented) flight directorwith steering and thrust comuanes integrated byCollins; digital readout of groundspeed; display ofrate-of-change of energy as go-around decision aid.
3
In addition to the tests of these systems, some runs were made on take-
offs in wind shear for hazard investigatitn and a short trial was made
of a wind shear instrument supplied by Captain Jack H. Bliss of Flying
Tiger Line. The Full Trial was started on 4 October, was interrupted on
the 13th for movie filming, and was completed on 21 October. A total of
24 subject pilots "flew" each of the aiding systems on approach and land-
ing against 8 wind profiles, at least 4 for training (more training runs
were provided if the subject pilot requested them) and 4 for system evalu-
ation; 2 more subject pilots "flew" systems (2) and (3) in a similar ser-
ies. This provided 304 data runs for system evaluation, 308 training runs,
46 takeoff runs, and 53 runs on the Bliss instrument. The total was 711
simulator runs in about 91 hours, not including runs for .:ovies and for
informal demonstrations and checkout.
On 15-17 November, presentations of the preliminary results of both
trials and demonstration runs (about 24 hours) on the MBDFS were made at
Long Beach for visitors from the FAA, U.S. Air Force, NASA, National
Transportation Safety Board, Allegheny Airlines, American Airlines, Con-
tinental Air Lines, Eastern Air Lines, National Airlines, Ozark Air Lines,
Trans World Airlines, United Air Lines, British Airways, Air Transport
Association, Air Line Pilots Association, Allied Pilots Association,
Boeing Company, Lockheed Corporation, Douglas, AE1MA Corporation, General
Electric Company, Bliss Aviation, BR and Collins. The simulation exer-
cise was completed on 18 November 1977 with additional runs for technical
movie films.
The AWLS project is under tbe supervision of Mr. Dean F. Babcock
(SRI). The Leader for this Task 2 simulation and developmental effort
was Dr. Wade H. Foy (SRI). At SRI, M:. Walter B. Gartner designed the
experiments and contributed to the evaluatiCn of the results; Messrs. David
W. Ellis, Michael G. Keenan and Robert D. Daniel did the data reduction and
analysis. Dr. A. C. McTee led the BR effort and was test director for the
experiments; Captain William 0. Nice and Colonel Don M. Condra of BR were
observers for the tests and acted as first officers for the runs. All
4

three contributed to the evaluation of the experimental results. At Col-
lins, work on the modified flight director algorithnms was under the super-
vision of Mr. Jim L. Foster; Mr. E. Dave Skelley was Collins project lea-
der and Mr. C. P. Shih was project engineer. The Douglas simulation sup-port was managed by Mr. John D. McDonnell and Mr. Charles H. Anderson; Mr.
Ernest Admiral was responsible for simulator test integration, and Mr.
Paul L. Jernigan was responsible for simulator software. Succesfull com-
pletion of the test schedule was due primarily to the enthusiasm and co-
operation of the BR and Douglas teams.
The list of pilots who acted as subjects for the tests runs is given
in Table 1. The FAA was responsible for pilot recruiting; assistance was
provided by the Air Line Pilots Association, the Air Transport Association
and the AWLS team. The list shows a wide range of participation by the
aviation comunity: FAA Western Region, U.S. Air Force, airlines, and
airframe manufacturers. The subject pilots served without remuneration
from the project, and the test exercise owes a great measure to their
professional competence and dedicated efforts.
B. Organization of Report
This report follows the organizational structure of the test exer-
cise. The section on "methods," which follows, describes the experimen-
tal procedures and conditions: simulator characteristics, wind models,
data acquisition and recording. The Initial Trial is discussed in Sec-
tion III, including descriptions of the aiding concepts tested, the de-
sign of the three experiments and a review of the results. Section IV
gives a description of the three systems tested in the Full Trial, pre-
sents the plan for the test and gives the detailed test results. The
conclusions drawn from the experimental results and recomendations to
the FAA are presented in Section V. Various technical details and sup-
porting documents are in the appendices.
5
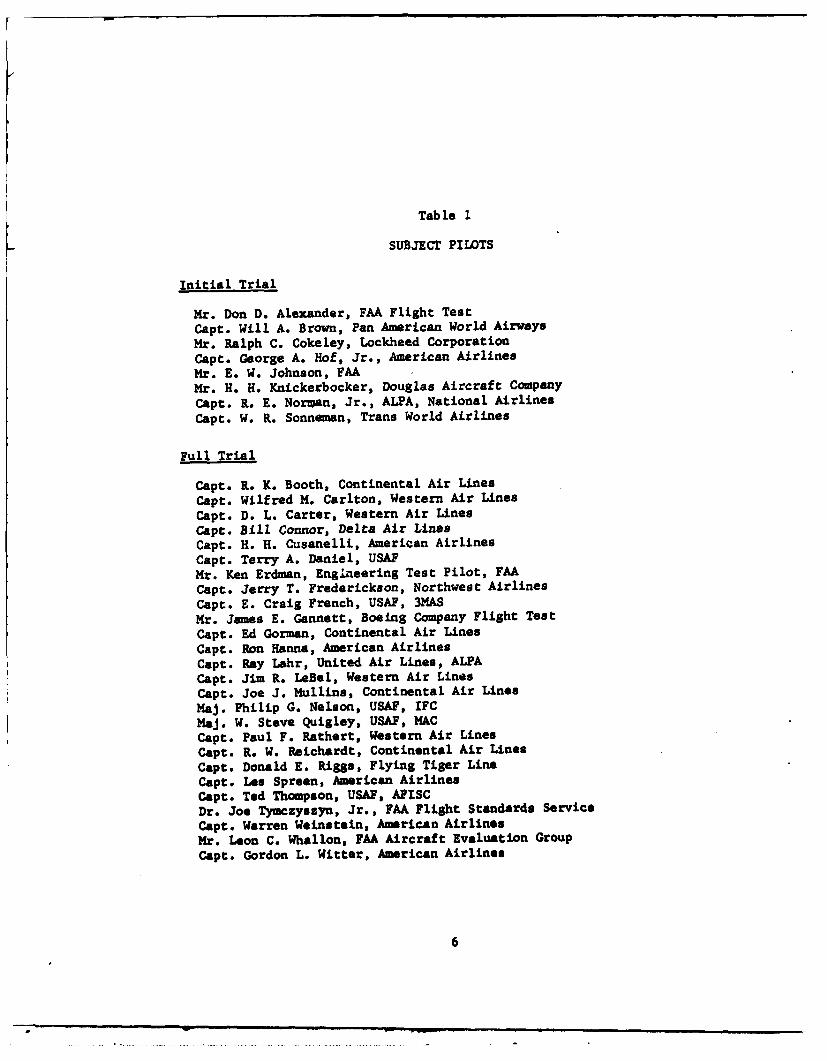
Table 1
SUBJECT PILOTS
Initial Trial
Mr. Don D. Alexander, FAA Flight TestCapt. Will A. Brown, Pan American World AirwaysMr. Ralph C. Cokeley, Lockheed CorporationCapt. George A. Hof, Jr., American AirlinesMr. E. W. Johnson, FAAMr. H. H. Knickerbocker, Douglas Aircraft CompanyCapt. R. E. Norman, Jr., ALPA, National AirlinesCapt. W. R. Sonneman, Trans World Airlines
Full Trial
Capt. R. K. Booth, Continental Air LinesCapt. Wilfred M. Carlton, Western Air Lines
Capt. D. L. Carter, Western Air Lines
Capt. Bill Connor, Delta Air LinesCapt. H. H. Cusanelli, American AirlinesCapt. Terry A. Daniel, USAFMr. Ken Erdman, Engineering Test Pilot, FAACapt. Jerry T. Frederickson, Northwest AirlinesCapt. E. Craig French, USAF, 3MASMr. James E. Gannett, Boeing Company Flight TestCapt. Ed Gorman, Continental Air LinesCapt. Ron Hanna, American AirlinesCapt. Ray Lahr, United Air Lines, ALPACapt. Jim R. LeBel, Western Air LinesCapt. Joe J. Mullins, Continental Air LinesMaj. Philip G. Nelson, USAF, IFCMaj. W. Steve Quigley, USAF, MACCapt. Paul F. Rathert, Western Air LinesCapt. R. W. Reichardt, Continental Air LinesCapt. Donald E. Riggs, Flying Tiger LineCapt. Los Spreen, American AirlinesCapt. Ted Thompson, USAF, AFISCDr. Joe Tymczyszyn, Jr., FAA Flight Standards ServiceCapt. Warren Weinstein, American AirlinesMr. Leon C. Whallon, FAA Aircraft Evaluation GroupCapt. Gordon L. Witter, American Airlines
6

II METHOD
This section describes the manner in which the DC-10 simulation was
configured for the advanced tests and provides an overview of the evalu-
ation plan adopted for testing the experimental aiding concepts. More
detailed descriptions of the aiding concepts tested and the experimental
designs adopted for each phase of testing are presented in subsequent
sections.
A. Simulator Confiauration
1. Simulator Cab/and Motion Base
The Douglas MBDFS shown in Figure 1 consists of a modified
DC-10 cockpit mounted on a six-deSree-of-freedom motion base. A Redi-
fan visual system is used to represent the external visual scene. Pro-
grams for data acquisition and DC-lO equations of motion were mechanized
on a Sigma-5 hybrid computer. The simulation was modified to include
specified windshe4r and turbulence models. Cockpit instrument panels
were reconfigured to include the experimental displays.
The modified DC-10 cockpit contained Captain, First Officer,
and Instructor stations. The Instructor station, located aft of the
Captain's station, was equipped for selection of test conditions, and
control of mission start, reset, and position freeze. Subject pilots
flew simulated approach sequences from the Captain's station with the
basic configuration shown in Figure 2. All flight controls, flight
instruments, guidance systems, and aircraft subsystems necessary for
the performance of this study were provided at the Captain and First
Officer stations. Except for experimental displays, installed cockpit
equipment conformed with standard DC-10 aircraft equipment.
The Siama-5 computer provided program control of data collec-
tion and of simulated aerodynamic response, winds, and turbulence, with
appropriate parameter values obtained from lookup tables. Wind profiles
7

VICUR O
........... 8
uj
LU

and turbulence conditions represented in the simulation were recorded
during each simulator run, and at the end of each run a "quick look"
summary was provided.
The external visual scene was generated by a Redifon rigid
model system with a scale factor of 750 to I. The visual scene is re-
presented by a 620-line color television image, and is displayed by
high-resolution monitors viewed through a special Douglas Aircraft aym-
metric lens. The Captain and First Officer stations are each equipped
with a separate monitor and lens. The visual system has a maximum
approach distance of 2.25 miles and an eye altitude range of 725 feet
to 15 feet. Approach and strobe lighting were realistically simulated
under variable ceiling and runway visual range (RVR) conditions.
The simulator has six degrees of freedom, provided by a six-
Jack (Franklin Institute) motion base. Motion is controlled from a
ground control station located adjacent to the cockpit/platform. Mo-
tion capability is summarized in Table 2.
Table 2
SIMULATOR MOTION LIMITS
VELOCITY ACCELERATION
PAYLOAD PAYLOAD PAYLOAD PAYLOAD
AXIS EXCURSION 20,000 lb 3600 lb 20,000 lb 3600 lb
Heave ±42 in. ±39 in./s t40.5 in./s ±1.65 g ±1.65 gSway ±67.5 in. ±67 in./s ±72.3 in./s ±1.43 g ±2.25 gSurge ±65 in. ±71 in./s ±71.6 in./s ±1.50 g t2.6 gRoll ±30.70 ±35.60/s ±36.20/s t7.8 rad/s2 ±7.8 rad/ 2
Pitch t33.3 ±33.60/s ±32.00/s ±7.8 rad/s2 ±7.8 red/s2
Yaw ±38.70 I±36.30/s ±40.3 0/s 17.9 rad/s 2 ±7.8 rd/s2
2. Aircraft and Runway Simulation
Equations of motion for the DC-10 series aircraft provided con-
tinuous flight simulation over the low-speed flight envelope. A landing
gross weight of 350,000 lb was used in the calculations. Normal flap
10
extension on the approach was 50 degrees. Table lookup functions were
used for nonlinear aerodynamic data such as lift and pitching moments.
Ground effects on aerodynamic coefficients were simulated over the en-
tire flap range. Nonlinear lateral control spoilers were included.
Control surfaces were simulated as either first- or second-order systems,
with dead zones and position limits included for all surfaces.
Simulated approach and landing scenarios were designed to re-
present a manually flown ILS flight-director approach under Category I
weather conditions, with a transition to external visual reference for
the landing maneuver. Cloud cover was simulated down to a breakout al-
titude of 150 feet above runway elevation, with visual conditions after
breakout representative of 3000 feet RVR. The simulated runway was 150
feet wide and 7000 feet long, at sea level, with guidance corresponding
to a Category II ILS with a 3 degree glide slope. The ILS simulation
included beam bends from a table lookup and beam noise.
B. Wind Profiles for Simulation Tests
Wind profiles selected for use in the simulator tests represent
three broad classes of meteorological conditions comonly recognized as
significant producers of low-level wind shear:
(1) Atmospheric boundary conditions
(2) Frontal systems
(3) Thunderstorms
To select specific wind profiles we performed a computer model analy-
sis of aircraft responses to various wind shear conditions. Wind data
from tower measuremonts, accident reconstructions, and meteorological
math models were converted to a three-dimensional wind field programmed
as a function of altitude and longitudinal position. A number of diffe-
rent wind profiles were produced from each wind field by varying the
runway position relative to each wind field and, where applicable, the
wind model parameterisation. Potentially hazardous wind profiles were
identified and sorted into three levels of severity by observing the
responses of a fast-time computer model of the DC-10 piloted by an ideal-
11
4

ised controller algorithm. Twelve wind profiles (four from each severity
level) were selected for the piloted simulator tests.
Plots of the wind profiles used in the simulator tests, a detailed
description of their implementation, and a description of the turbulence
model are given in Appendix A.
C. Evaluation Plan
I. Test Obiectives and Approach
Advanced testing of improved ground speed (GNS) and modified
flight director (HFD) aiding concepts was carried out in two stages.
The first stage, referred to as the Initial Trial, consisted of a series
of test exercises designed to evaluate alternative display concepts and
computational algorithms for implementing the GNS and MFD techniques, and
to determine the need for augmenting these techniques with go-around gui-
dance. The objective of the first stage of testing was to select recom-
mended versions of each technique for evaluation in a second stage of
testing, the Full Trial. The objective of the second stage of testing
was to determine the level of operational performance and pilot accept-
ance that may be attributed to the use of the selected techniques in a
representative set of wind shear environments.
As a secondary test objective, the need for pilot aiding in
coping with low-level wind shear during takeoff and climbout was exami-
ned. Several wind shear profiles were designed specifically for evalu-
ating the hasard represented by an encounter during takeoff operations
under baseline conditions.
Initial testing consisted of comparative evaluations of four
versions of the GNiS concept, two versions of the fD concept, and two
proposed instruments for supporting the pilot's decision to continue
the approach or go-around. Three separate test exercises were conducted
to evaluate the effectiveness and pilot acceptance of these aiding con-
cept alternatives.
Alternative implementations for the (GNS concept represent im-
portant differences in requirmnts for cockpit display and airborne
12
ps

computation. The simplest version tested is simply a digital readout of
ground speed. The second version provided guidance on the existing Fast/
Slow indicator on the attitude-director indicator (ADI) for maintaining
pro-planned ground speed, but did not include a separate display of ground
speed. A third version was the two-pointer airspeed/ground speed display
(evaluated in earlier simulation tests), augmented by adding the Fast/Slow
feature just described. Finally a combination of the digital ground speed
display with the modified Fast/Slow indicator was tested.
Alternative test versions of the MFD concept are distinguished
by two different ways of adding thrust commands to the modified pitch and
roll steering commands tested in earlier studies. The thrust commands
were presented on the standard Fast/Slow indicator on the ADI. One ver-
sion (CFDT-l) provided for speed control based only on acceleration aug-
mentation. The other version (HFDT-2) incorporated ground speed infor-
mation to compensate for diminishing headwind shears.
The need for go-around guidance was examined by comparing the
pilot's ability to detect and respond to unsafe conditions using base-
line instruments with his performance on the same task using two new
aiding concepts. The first concept was a cockpit display of energy rate
developed by Douglas. The second, developed by the FAA, was a cockpit
display of aircraft acceleration margin. These instrumentation concepts
are discussed in greater detail in Section III.
Initial testing was limited to eight days of simulator utiliza-
tion time and was carried out using selected evaluation pilots rather than
subject pilots. Evaluation pilots were supplied by the FAA, with SRI as-
sistance, and included pilots who had participated as subjects in earlier
simulation tests.
After a two-week period for assessing the results of initial
testing and for making final adjustments to computational algorithms, se-
lected versions of the GNS, MFD, and go-around guidance techniques were
combined into three instrumentation configurations and tested using a lar-
ger number of subject pilots. Twenty-six pilots were recruited for this
full-scale testing and their performance was considered to be representative
13
of currently active line pilots operating wide-body aircraft. The basic
intent of this test exercise was to develop reliable estimates of the
level of operational performance and pilot acceptance that could be ex-
pected when the selected aiding concepts are used in the kinds of wind
shear environments represented by the test shear profiles.
The basic plan for this Full Trial was to provide the subject
pilots with a training session on the use of each aiding concept and
then to take test data on their response to four selected wind shear
profiles. The four test profiles included severe thunderstorm and fron-
tal shear conditions that were expected to result in missed approaches,
and two less severe shears that were considered demanding but negotiable
by most pilots. Training runs were designed to assure that pilots were
thoroughly familiar with the simulation and the assigned aiding concepts.
The wind shear profiles used during training runs were similar to the
test profiles.
2. General Test Procedures
Test procedures followed the same general pattern as that es-
tablished for earlier simulation studies. Pilots were scheduled in pairs
and alternated sessions in the simulator. A master run schedule listing
the sessions to be completed by each pilot for each scheduled day of
simulator utilization was prepared for each test exercise. A standard-
ized project orientation briefing, covering study objectives and the
pilot's role in the tests, was presented on the first day. Immediately
prior to each scheduled session, pilots were briefed on the assigned aid-
ing concepts and the procedure to be followed in the simulator. Debrief-
ing sessions were conducted immediately following each simulator session
to record pilot assessments of the test concepts.
In general, pilots were briefed to conduct each approach as
they would in actual line operations and to make approach continuation/
go-around decisions on the basis of their usual assessments of the on-
going flight situation. In the QNS and MFD experiments during initial
testing, pilots were briefed to initiate a go-around at their discretion,
using the same approach acceptance criteria and judgments as they would
14
in actual flight situations. Note that this is a departure from our
earlier wind shear simulation exercises that called for the approach to
be continued to 100 feet, with an announcement of go-around decisions
above that altitude. In the initial go-around guidance experiment and
in the full-scale tests, pilots were briefed to consider the different
forms of go-around guidance as advisory information and to initiate a
go-around when called for unless they were confident that the approach
could be completed within limits and therefore elected to continue.
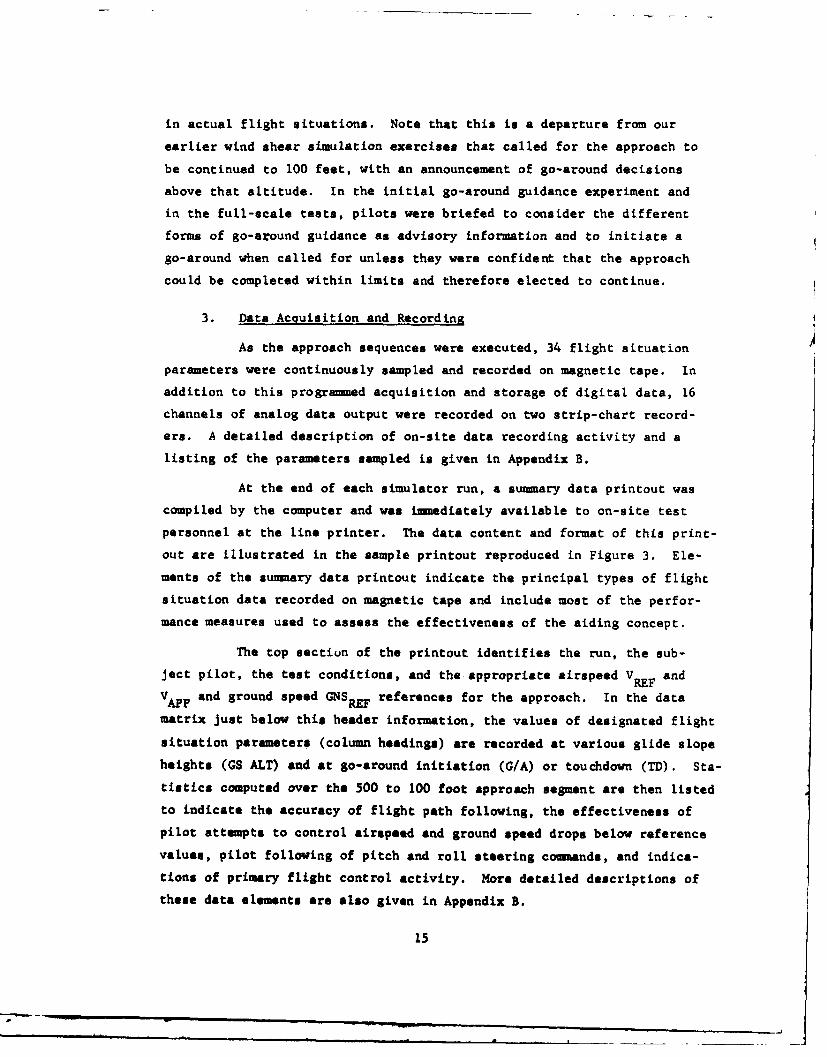
3. Data Acquisition and Recordina
As the approach sequences were executed, 34 flight situation
parameters were continuously sampled and recorded on magnetic tape. In
addition to this programmed acquisition and storage of digital data, 16
channels of analog data output were recorded on two strip-chart record-
ers. A detailed description of on-site data recording activity and a
listing of the parameters sampled is given in Appendix B.
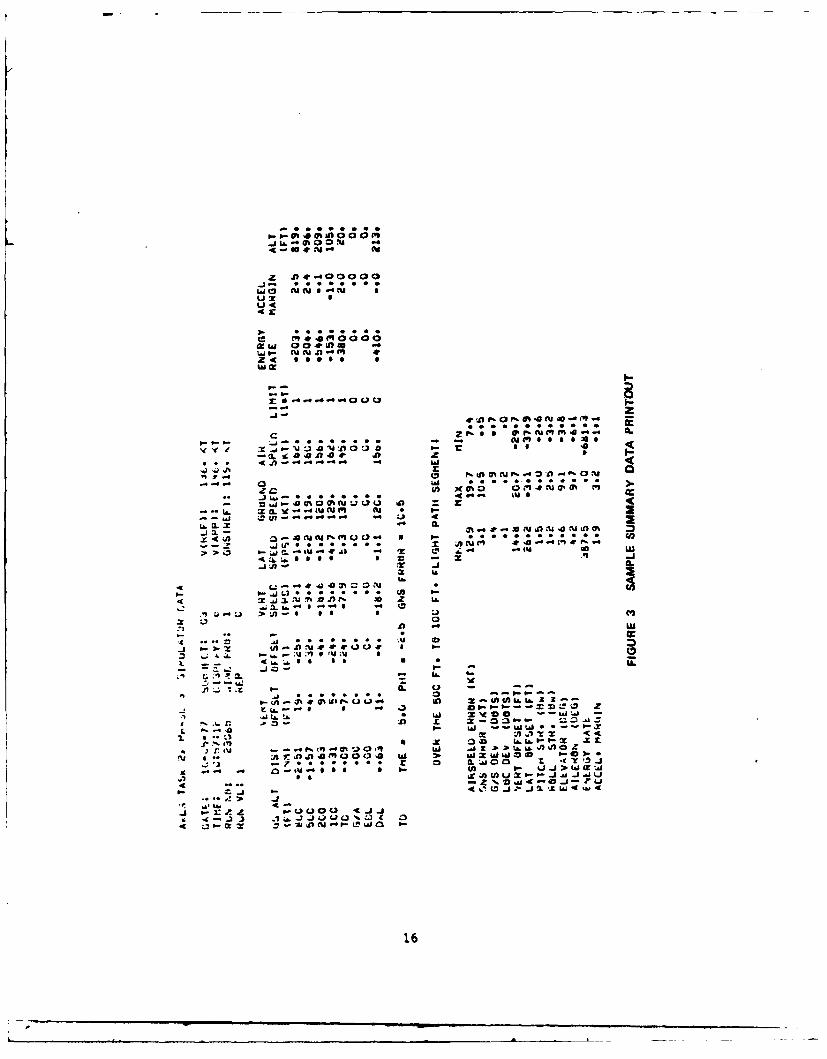
At the end of each simulator run, a summary data printout was
compiled by the computer and was iumediately available to on-site test
personnel at the line printer. The data content and format of this print-
out are illustrated in the sample printout reproduced in Figure 3. Ele-
ments of the summary data printout indicate the principal types of flight
situation data recorded on magnetic tape and include most of the perfor-
mance measures used to assess the effectiveness of the aiding concept.
The top sectiun of the printout identifies the run, the sub-
ject pilot, the test conditions, and the appropriate airspeed VREF and
VAPP and ground speed GNSREF references for the approach. In the data
matrix just below this header information, the values of designated flight
situation parameters (column headings) are recorded at various glide slope
heights (GS ALT) and at go-around initiation (G/A) or touchdown (TD). Sta-
tistics computed over the 500 to 100 foot approach segment are then listed
to indicate the accuracy of flight path following, the effectiveness of
pilot attempts to control airspeed and ground speed drops below reference
values, pilot following of pitch and roll steering commands, and indica-
tions of primary flight control activity. More detailed descriptions of
these data elements are also given in Appendix B.
15
a('
0.4
(VA a F%0040
CP P-AM "C
*flY.0f4 s#,,.CL g 40 -0 A -0 4' a
C z S *%AaqM.4. W
'2 A. C; ;t Z; 0 u aU
=~~ ~ ~ tIWII.l ut" O
**0 2 0 .. .W.l. . . a Ox A- 2C6-J r -t$4 2rA 0 zL
~~ 0 . Z ± £
4_ L.0 S **LL
z (4
wwo--
Lt.,
4'.z 6 . .S * 1
.J b.2 fA~.***(C)* 16

III INITIAL TRIALS
This section describes the pilot aiding concepts tested in the ini-
tial series of simulation exercises and presents the test results. The
organization of this discussion follows the breakdown of initial testing
into three separate experiments. Four alternative implementations of the
groundspeed (GNS) concept were evaluated in the first experiment, two ver-
sions of the modified flight director (MFD) were tested in the second
experiment, and the third experiment examined the relative effectiveness
of three ways of augmenting the GNS and MFD techniques with go-around
guidance.
A. Groundspeed Concepts
1. Alternative Implementations
The four versions of the ground speed concept selected for
testing represent alternative cockpit display arrangements for support-
ing the "minimum pre-planned groundspeed" technique evaluated in earlier
simulation studies. This technique calls for the pilot to manage his air-
speed during the approach so that groundspeed does not drop below a pre-
selected reference value. The reference groundspeed is a pilot-selected
target speed for touchdown and is derived by converting the nominal ap-
proach speed for a no-wind condition (VREF) to true airspeed and then
subtracting the reported surface headwind component. The four alterna-
tive display arrangements were defined as follows:
a. Integrated Airspeed/Groundspeed Display plus Modified
Fast/Slow Speed Comiand (GNS-3)
This display arrangement is illustrated in Figure 4. A
second pointer is added to the conventional airspeed indicator to pro-
vide groundspeed information and an additional reminder bug is provided
for the pilot to manually set the groundspeed reference. The display of
groundspeed information is thus the same as in the two-pointer concept
17

L E so COMPUTEDGR~OUND SPEED F
REFERENCE INDICATOR30- o GROUND SPEED
25 A REFERENCE,240
KT I oAIRSPEED(F
MACHIAS INDICATOR
ATTITUDE/ODIRECTOR INDICATOR
FIGURE 4 AIRSPEED/GROUNDSPEED DISPLAY WITH FAST/SLOW
18

tested in Phase 2 (GNS-2) and the computational algorithm for the ground-
speed element is the same. However, in this test display, the striped
pointer normally used to indicate maximum allowable airspeed (V MO) is
used for groundspeed and the groundspeed reminder bug is shape coded for
better distinguishability.
In the display arrangement shown (designated as GNS-3),
the drive signal for the Fast/Slow indicator on the ADI has been modi-
fied to incorporate groundspeed "error" as well as the conventional air-
speed deviations from pilot-selected approach speeds (VAPP). The modi-
fied computational algorithm for the speed conmnand is given in Figure 5.
Computed airspeed (IAS) and groundspeed (GNS) are filtered, as shown,
and sumned with their respective reference values. The speed command
displayed is the "minimum" value of the two speed deviations, limited to
* 20 kt on the indicator.
The effect of this speed comnand algorithm, when the pi-
lot maintains the null indication, is to keep both airspeed and ground-
speed at or above selected references. Airspeeds higher than VA PP may
be required to maintain GNS RE with a headwind on approach; with a tail-
wind, airspeed will not be allowed to drop below VAPP and groundspeeds
well above GNSRE may be indicated. In any case, pilot cross-check of
the IAS/GNS indicator would show, at a glance, which speed deviation was
driving the Fast/Slow indicator.
b. Modified Speed Command only (GNS-4)
For this version of the GNS concept, only the modified
Fast/Slow speed comnand is available to the pilot and groundspeed is not
displayed. The computational algorithm for the speed comnand is as shown
in Figure 5.
c. Digital Groundspeed Readout (GNS-5)
This display concept is simply a digital readout of com-
puted groundspeed located above the ADI, as shown in Figure 6. When this
display condition was selected, the Fast/Slow speed command operated in
the conventional manner to indicate deviations from pilot-selected (or
19

L.
V Opp
IAS --- 4m
I + 1.0S
TURBULENCE FILTER
MINIMUM : +0 TO faslowindicator on
VALUE -20 the ADI
20 kt LIMITER
GNS -- 1 + 5 ) S
SIMULATION OF LAGASSOCIATED WITH
GROUND SPEED
ACQUISITIONGNSref
FIGURE 5 COMPUTATIONAL ALGORITHM FOR DERIVING THE MODIFIED FAST/SLOWSPEED COMMAND
20
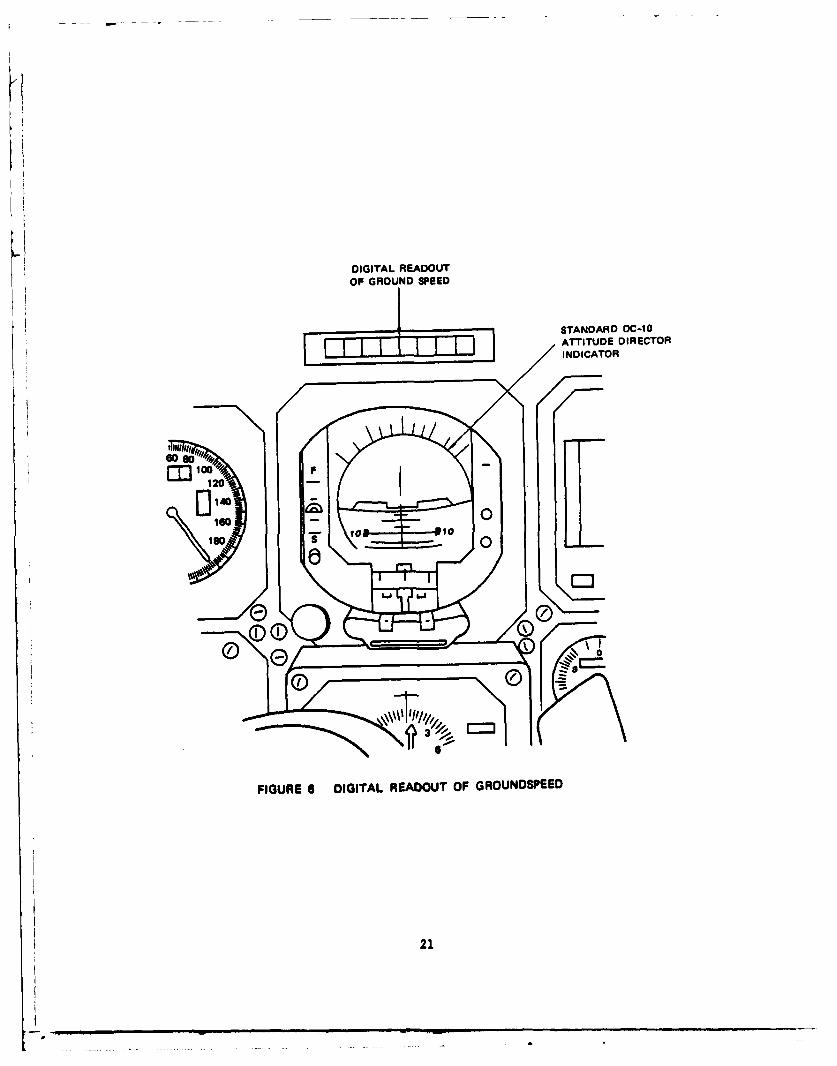
DIGITAL READOUTOF GROUND SPEED
STANDARD DC-10ATTITUDE DIRECTORINDICATOR
1221

computed) target approach speeds. Pilots were briefed to follow the
same technique of using GQSREF as an additional minimum approach speed
and a conventional airspeed reminder bug (not shape coded or painted to
match the GNS pointer) could be set to indicate GSREF .
d. Digital Groundspeed Readout with Modified Speed Command
(GNS-6)
This display is the same as GQS-3 except that the digital
readout just described, rather than the second pointer on the airspeed
indicator is used to provide groundspeed information.
2. Test Plan
The design adopted for the first experiment is shown in Table
3 and calls for each of the four evaluation pilots to fly six data runs
using each of the alternative GNS concepts. The order of pilot exposure
to the different concepts was partially counter-balanced to preclude any
systematic bias in the data due to carry-over effects. Data runs were
flown against six wind profiles selected from the set described in Sec-
tion II to include 3 high severity and 3 moderate severity shear condi-
tions. The same six profiles were applied to each alternative GNS con-
-ept using a varying pattern of exposure.
The experimental design provided data on a total of 96 approach
sequences (runs), allowing contrasts among the alternative GNS concepts
to be based on 24 runs. A single session in the simulator consisted of
12 data runs, covering two versions of the aiding concept plus additional
runs for training. The full run schedule was thus completed in 8 sessions,
with 2 sessions required for each pilot. Table 4 shows the order in which
each pilot was assigned to the alternative GNS concepts to control for
carry-over effects. The order in which pilots were exposed to the six
wind profiles within a scheduled simulator session was scrambled so that
pilots could not learn the sequence and thus anticipate the character
of the shear encounter.
22
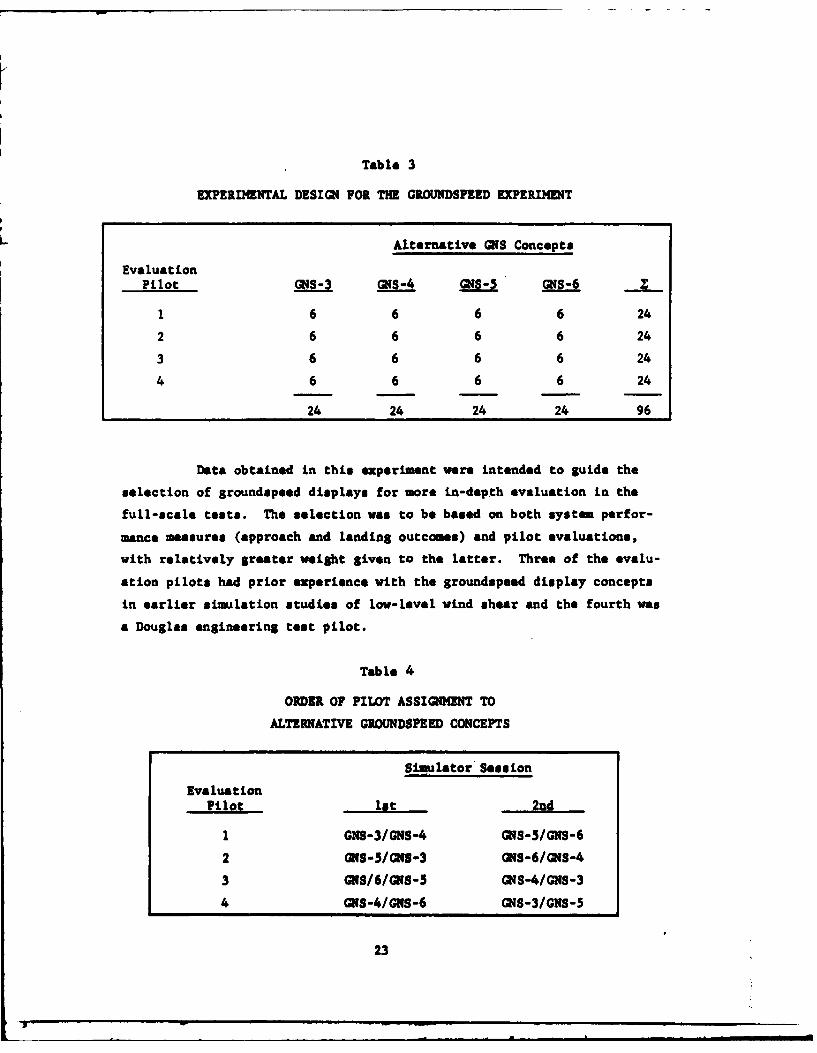
Table 3
EXPERIMENTAL DESIGN FOR THE GROUNDSPEED EXPERIMENT
Alternative GNS Concepts
EvaluationPilot GNS-3 QIS-5 GNS-6
1 6 6 6 6 24
2 6 6 6 6 24
3 6 6 6 6 24
4 6 6 6 6 24
24 24 24 24 96
Data obtained in this experiment were intended to guide the
selection of groundspeed displays for more in-depth evaluation in the
full-scale tests. The selection was to be based on both system perfor-
mance measures (approach and landing outcomes) and pilot evaluations,
with relatively greater weight given to the latter. Three of the evalu-
ation pilots had prior experience with the groundspeed display concepts
in earlier simulation studies of low-level wind shear and the fourth was
a Douglas engineering test pilot.
Table 4
ORDER OF PILOT ASSIGNMENT TO
ALTERNATIVE GROUNDSPEED CONCEPTS
Simulator Session
EvaluationPilot lot 2nd
1 GNS-3/GNS-4 GQS-5/GNS-6
2 ONS-5/ S-3 GqS-6/GNS-4
3 GS/6/GS-5 GNS-4/GNS-3
4 GNS-4/GNS-6 GQS-3/GNS-5
23
3. Test Results
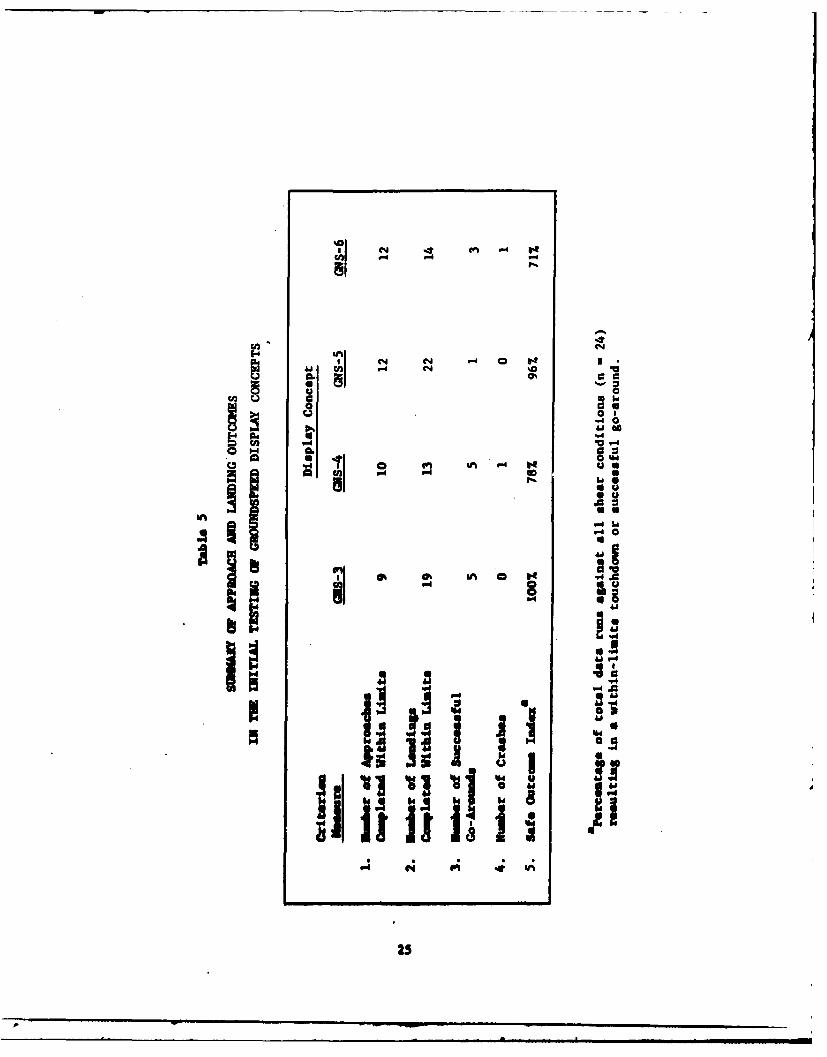
The relative effectiveness of the alternative groundspeed dis-
play concepts in the simulated shear encounter is summarized in Table 5.
Recorded flight situation data were used to determine whether the air-
craft was within operationally acceptable limits at the Inner Marker and
at touchdown and these counts are given in the table as criterion mea-
sures I and 2. Limiting values for this assessment are listed in Table
6 for the Inner Marker and in Table 7 for touchdown. The number of go-
arounds and crashes (touchdown off the runway) is also given for each
display concept.
On both touchdown performance and the "Safe Outcome Index,"
which gives credit for a safe execution of a missed approach, the best
approach and landing performance was obtained using the GNS-3 and GNS-5
display concepts. Differences between the alternative display arrange-
ments were slight at the Inner Marker. However, more out-of-limit ap-
proaches were converted to within-limit landings when the GNS-3 and
GNS-5 displays were used. It is interesting to note that approach and
landing outcomes were better using the digital display of groundspeed
alone (GNS-5) than with display concepts incorporating the modified
Fast/Slow speed coimmand.
In the debriefing sessions following their exposure to the
aiding concepts in the simulator, the evaluation pilots were asked to
critique the alternative display arrangements and to indicate the one
they felt would be most acceptable for line operations. Pilot prefer-
ences were clearly in favor of the two-pointer display of groundspeed
with the modified Fast/Slow indicator (GNS-3). Only one pilot (with no
prior experience with the display) felt that the use of the second speed
minimum (GNSREF) might produce some confusion in cross-checking between
the Fast/Slow and airspeed indications. The general reaction, as in
earlier studies, was that the two-pointer display provided the beat in-
formation on the winds affecting the aircraft and for estimating the
potential wind shear.
24
C4i
1 10
I N N -4 0 I
"40
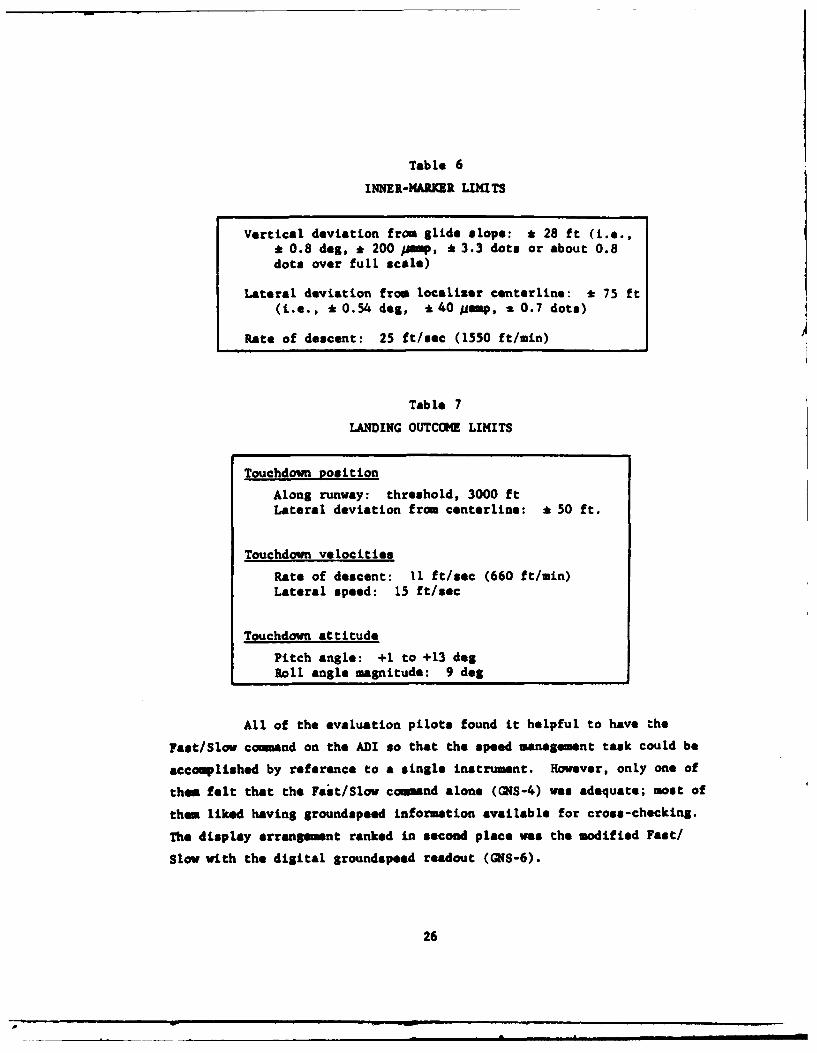
Table 6
INNER-MARKER LIMITS
Vertical deviation from Slide slope: * 28 ft (i.e.,* 0.8 dog, * 200 pjsmp, * 3.3 dots or about 0.8dos over full scale)
Lateral deviation from localiser centerline: * 75 ft(i.e., *0.54 deg, *40ump, a0.7 dots)
Rate of descent: 25 ft/sec (1550 ft/min)
Table 7
LANDING OUTCOME LIMITS
Touchdown Position
Along runway: threshold, 3000 ftLateral deviation from centerline: a 50 ft.
Touchdown velocities
Rate of descent: 11 ft/sec (660 ft/in)Lateral speed: 15 ft/sec
Touchdown attitude
Pitch angle: +1 to +13 degRoll angle magnitude: 9 dog
All of the evaluation pilots found it helpful to have the
Fast/Slow command on the ADI so that the speed management task could be
accomplished by reference to a single instrument. However, only one of
them felt that the Fait/Slow command alone (CHS-4) was adequate; most of
them liked having groundspeed information available for cross-checking.
The display arrangement ranked in second place was the modified Fast/
Slow with the digital groundspeed readout (GNS-6).
26
Immp m Ia u m m edm mmm m emm m mmmmm
There was some tendency for pilots to prefer the digital
groundspeed display alone (GNS-5) over the GNS-4 concept, even though
most of them felt the mental workload was excessive using the digital
display. They were also aware of the conflict between the Fast/Slow
indicator, operating in its normal "airspeed error" mode, and the air-
speed reuired to maintain the reference groundspeed. As indicated ear-
lier in this discussion, however, pilot performance of the speed manage-
ment task was not degraded when the GNS-5 display was used.
B. Hodified Flight Director Concepts
1. Alternative Implementations
Computational algorithms for deriving pitch and roll steering
commands in the modified flight director (MFD) were the same for both of
the versions tested in this study. These acceleration-augmented steer-
ing conmands were based on the control laws developed by Collins for the
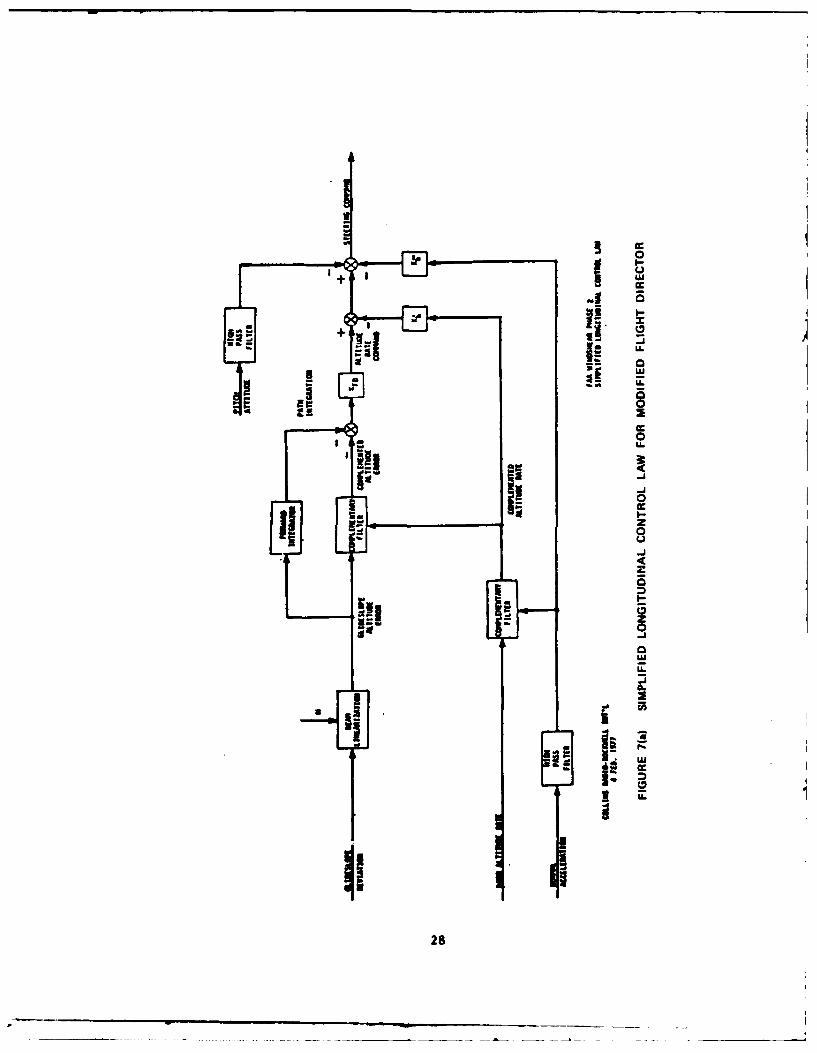
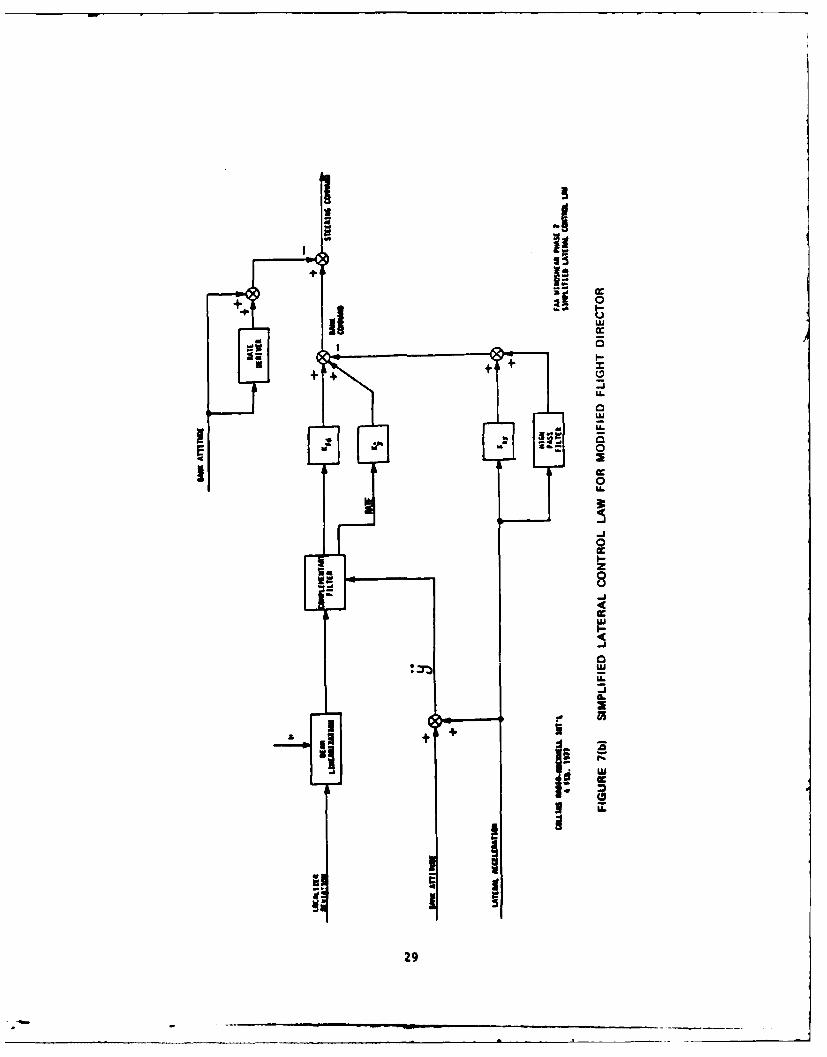
wok2DC-10 in earlier work. For the reader's convenience, the modified lon-
gitudinal and lateral control law* are reproduced in Figure 7. For com-
parison, simplified block diagrams of the conventional unmodified flight
director control laws for the DC-1O are presented in Figure 8.
The distinguishing features of the two verions of the MFD
tested in the present study was the addition of a thrust comand dis-
played using the Fast/Slow indicator. In the first version (MFDT-1),
this thrust cotmand was derived by adding longitudinal acceleration and
using glide slope deviation as a pseudo-prediction of wind shear. The
control law for this version of the MFD thrust comand is diagrsmid in
Figure 9.
The second version of the MFD (MFDT-2) used the same control
laws for pitch and roll steering and provided a thrust coimand based on
the availability of groundspeed information. A block diagram of this
version of the thrust coumnd is given in Figure 10. Computed ground-
speed and the headwind component in the touchdown zone (TDZ) are used
as shown to bias the speed comnand to compensate for a diminishing head-
wind shear.
27
19 0
0c
0
IL
-AA-J C
280
! lvi
cc
-,.. .
-
0
LU
2
I 0
29

K4
-dd
c -C
C)_j
z0j
ca
zC
U.
300

Id-
LLIN
Fs
LU
La
313

V
W
cc occI
0U Z
Luu
CLIcc 0
cc + -U U
~I IA+ 0
z0
CL-
+ 40 0L
+ +0
U-
0
cc a-i R
z Lz
Lu< U5u
a -a.
Lu R z32

OrLU.i
cc
- c cPo. w
UI. IL
+ L -0
U. +
00
.C
w4 0 ac
3 33
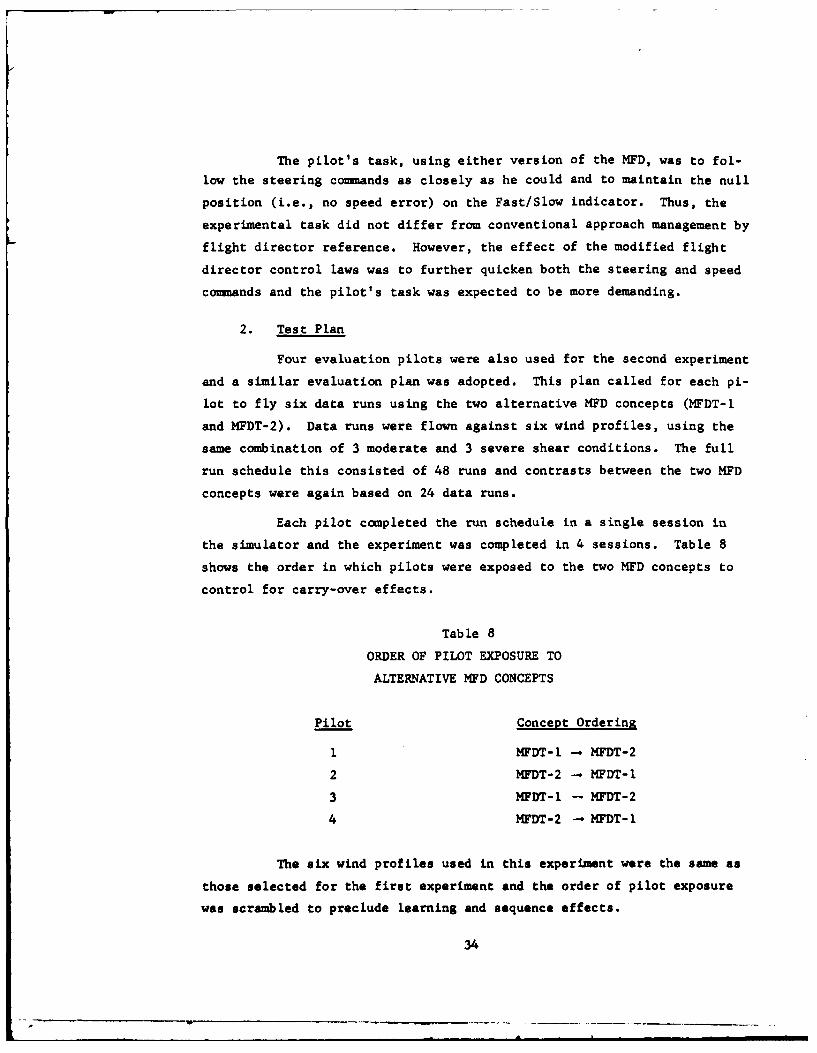
The pilot's task, using either version of the MFD, was to fol-
low the steering commands as closely as he could and to maintain the null
position (i.e., no speed error) on the Fast/Slow indicator. Thus, the
experimental task did not differ from conventional approach management by
flight director reference. However, the effect of the modified flight
director control laws was to further quicken both the steering and speed
commands and the pilot's task was expected to be more demanding.
2. Test Plan
Four evaluation pilots were also used for the second experiment
and a similar evaluation plan was adopted. This plan called for each pi-
lot to fly six data runs using the two alternative MFD concepts (MFDT-l
and MFDT-2). Data runs were flown against six wind profiles, using the
same combination of 3 moderate and 3 severe shear conditions. The full
run schedule this consisted of 48 runs and contrasts between the two MFD
concepts were again based on 24 data runs.
Each pilot completed the run schedule in a single session in
the simulator and the experiment was completed in 4 sessions. Table 8
shows the order in which pilots were exposed to the two MFD concepts to
control for carry-over effects.
Table 8
ORDER OF PILOT EXPOSURE TO
ALTERNATIVE MFD CONCEPTS
Pilot Concept Orderina
1 MFDT-l MFDT-2
2 MFDT-2 - MFDT-l
3 MFDT-l -- MFDT-2
4 MFDT-2- MFDT-l
The six wind profiles used in this experiment were the same as
those selected for the first experiment and the order of pilot exposure
was scrambled to preclude learning and sequence effects.
34

3. Test Results
Sumnary data on approach and landing outcomes using the two
versions of the MFD are presented in Table 9. Criterion measures listed
in the first column are the same as those described earlier for the test-
ing of groundspeed display concepts. The numbers presented in Table 8
are based on 24 data runs for each version of the MFD and represent pi-
lot performance on all six of the wind shear conditions.
The data show that the number of within-limit approach and
landing outcomes was substantially higher when NFDT-2 was used. This
version of the MFD used groundspeed information in the thrust command
algorithm to compensate for diminishing headwind shears, but was other-
wise the same as MFDT-1. The Safe Outcome Index is also higher for the
MFDT-2 version and we may conclude that approach management performance
is enhanced by this treatment of the thrust management display.
Table 9
SUMMARY OF APPROACH AND LANDING OUTCOMES
IN THE INITIAL TESTING OF ALTERNATIVE MFD THRUST COMMANDS
CriterionMeasure IFDT-l MFDT-2
1. Number of Within-LimitApproaches (Inner Marker) 6 13
2. Number of Within-LimitLandings (Touchdown) 11 16
3. Number of Successful
* Go-Arounds 8 5
4. Number of Crashes 5 3
5. Safe Outcome Index 79% 88%
Pilot evaluations were evenly divided with two pilots prefer-
ring each version of the MFD. Differences in the amount of throttle
activity required with the two thrust commands were apparent to the pi-
lots, but they didn't agree on the relative merits of the two. All of
35
. . . . .. . .. ... , ... .. .. . . . . . . . . . .. . .. . ..
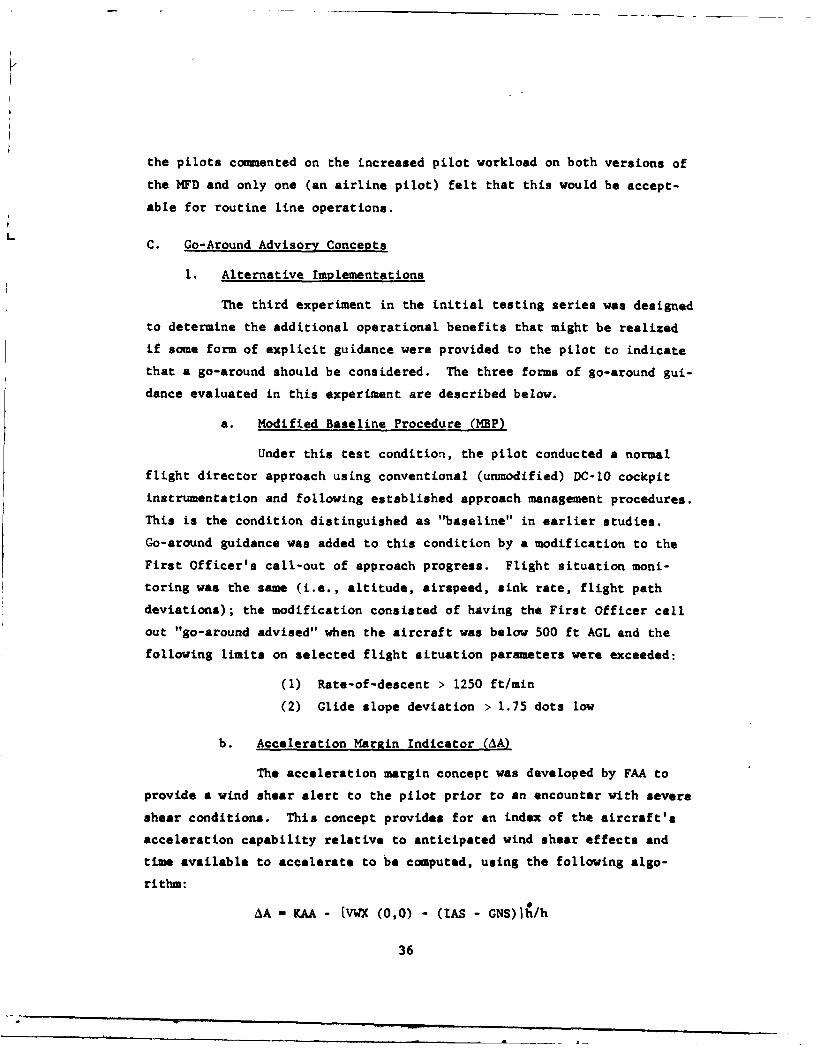
the pilots comnented on the increased pilot workload on both versions of
the MFD and only one (an airline pilot) felt that this would be accept-
able for routine line operations.
L C. Go-Around Advisory Concepts
i. Alternative Implementations
The third experiment in the initial testing series was designed
to determine the additional operational benefits that might be realized
if some form of explicit guidance were provided to the pilot to indicate
that a go-around should be considered. The three forms of go-around gui-
dance evaluated in this experiment are described below.
a. Modified Baseline Procedure (MBP)
Under this test condition, the pilot conducted a normal
flight director approach using conventional (unmodified) DC-10 cockpit
instrumentation and following established approach management procedures.
This is the condition distinguished as "baseline" in earlier studies.
Go-around guidance was added to this condition by a modification to the
First Officer's call-out of approach progress. Flight situation moni-
toring was the same (i.e., altitude, airspeed, sink rate, flight path
deviations); the modification consisted of having the First Officer call
out "go-around advised" when the aircraft was below 500 ft AGL and the
following limits on selected flight situation parameters were exceeded:
(1) Rate-of-descent > 1250 ft/mmn
(2) Glide slope deviation > 1.75 dots low
b. Acceleration Margin Indicator (AA)
The acceleration margin concept was developed by FAA to
provide a wind shear alert to the pilot prior to an encounter with severe
shear conditions. This concept provides for an index of the aircraft's
acceleration capability relative to anticipated wind shear effects and
time available to accelerate to be computed, using the following algo-
rithm:
AA - KAA - [VWX (0,0) - (IAS - GNS)Ih/h
36

where AA - acceleration margin
KAA - a constant representing the longitudinal accelerationcapability of the aircraft in level flight. (For theDC-1O with maximum thrust, 350,000 lbs GW, 500 flaps,and gear down, KAA - 1.67 kt/sec.)
VWX(0,0) - longitudinal surface wind component at 20 ft above the
glide-path-intercept point on the runway.
IAS - indicated airspeed
GNS - groundspeed
- altitude rate
h - aircraft altitude AGL
The aircraft's "acceleration margin" (AA) may thus be
interpreted as the difference between its acceleration capability (KAA)
and the acceleration required to successfully negotiate an anticipated
shear in the altitude remaining. The expression bounded by the square
brackets provides a continuous measure of the anticipated shear by com-
paring winds aloft (IAS - GNS) with reported surface winds [VWX(O,0)].
The term /h reduces to the time it would take the aircraft to descend
from its present altitude to the ground. When the value of AA goes
negative, it indicates that the acceleration required to negotiate the
shear exceeds the aircraft's acceleration capability.
A digital display of scaled (x2) values of AA was provided
on an alphanumeric readout located above the ADI at the evaluation pilot's
station (left seat). A repeater display was available to the First Offi-
cer, located imediately below the airspeed indicator. The procedure
adopted was to have the First Officer monitor the AA readout and to ad-
vise the pilot to go around when a stable negative reading was observed
below 500 feet.
C. Enerty Rate Indicator
This concept was developed by the Douglas Aircraft Com-
pany and is based on the notion that the effects of wind shear and/or
vertical drafts can be usefully expressed as changes in the aircraft's
"total energy," kinetic with respect to the air mass plus potential. A
computational algorithm was developed to compare actual energy rates
37

with "normal" energy rates during an approach without shear conditions
and a cockpit display was provided to alert the pilot to an unsafe,
energy deficient condition.
The Douglas algorithm for energy rate per unit mass (ENR)
is:
ENR - () VV + gm
where TE - total energy ( mV2 + mgh)
m - aircraft mass
V - airspeed
- aircraft acceleration with respect to air mass
- altitude rate
g - 32.2 ft/sec2
The display of a wind shear alert to the pilot was based
on a comparison of actual energy rate, derived using the algorithm just
described, with a nominal energy rate based on the nominal approach speed
and aircraft landing configuration. The indicator used is illustrated
in Figure 11. At computed values of ENR : 664 ft2/sec3 the pointer would
remain in the green segment to indicate "normal" energy rates for the
approach. ENR values above this level would move the pointer into the
yellow segment to alert the pilot and at ENR values ? 1028 ft2/sec3 the
pointer would move into the red zone to indicate a potentially hazardous
rate of energy loss.
ENR indicators were installed on both sides of the instru-
ment panel, below the airspeed indicator. The procedure adopted was to
have the First Officer monitor the indicator and announce a go-around
advisory whenever the pointer remained in the red zone for at least one
second. At computed ENR values of 750 ft2/sec 3 , a flashing yellow light
illuminated to attract the pilot's attention to the ENR indicator.
2. Test Plan
The go-around advisory systems just described were tested both
alone and in various combinations with the groundspeed and modified flight
38

HAZARDOUI
PILOT/ ALERT
FIGURE 11 DOUGLAS ENERGY RATE INSTRUMENT
39
director concepts. A baseline (BL) test condition, in which pilots used
only conventional instrumentation and their usual approach assessment
techniques for deciding whether to continue or go-around, was included
for comparison with the experimental concepts. The six test configur-
ations are identified in the column headings of Table 10, which also pre-
sents the plan adopted for the experiment.
The AA advisory was tested alone and in combination with the
best of the groundspeed techniques (GNS-3); the ENR concept was tested
alone and in combination with the best modified flight director technique
(MFDT-2). It was hypothesized that fewer go-around advisories might be
indicated by the AA and the ENR displays when they were paired with the
experimental approach management techniques rather than the baseline
technique.
The evaluation plan shown in Table 10 called for each of the
four evaluation pilots to fly six data runs using each alternative aid-
ing configuration. The wind shear profiles used on these data runs were
the same as those used in the first two initial tests, but different
evaluation pilots were assigned to this experiment. The experimental
design provided data on a total of 144 runs and allowed contrasts be-
tween alternative aiding configurations to be based on 24 runs. A
single session in the simulator consisted of 12 data runs, covering two
of the six alternative concepts, plus additional runs for training. The
full run schedule was completed in 12 sessions, with each pilot flying
3 sessions. Table 11 shows the order in which pilots were exposed to
the six alternative concepts.
3. Test Results
A comprehensive assessment of the relative effectiveness of
the go-around advisory concepts was used in this experiment by computing
a "Performance Score." A scoring scheme was adopted that considered the
severity of the shear encounters. Points were added together for within-
limit touchdowns and successful go-arounds, but no points were given for
a go-around when the wind shear severity level was moderate. For out-of-
limit approaches and crashes, points were subtracted. The Performance
40

Table 10
PLAN FOR THE GO-AROUND ADVISORY EXPERIMENT
Alternative Aiding Configuration
EvaluationPilot BL MP ENR M/GNS-3 ENR/MFDT-2 .
I Six data runs using each 36
2 aiding configuration, flown 363 against 3 moderate and 3
severe wind shear profiles. 364 36
24 24 24 24 24 24 144
Table 11
ORDER OF PILOT EXPOSURE TO ALTERNATIVE
GO-AROUND ADVISORY CONCEPTS
Simulator Session
Pilot 1st 2nd 3rd
I BL, ENR AA, AA/GNS-3 ENR/MFDT-2,MBP
2 AA, ENR, BL MBP,AA/GNS-3 ENR/MFDT-2
3 MBP, m ENR/MFDT-2, AA/GNS-3,AA BL
4 ENR/MFDT-2, AA/GNS-3, AA, ENRBL MBP
41

Score was a ratio of points earned by each aiding configuration to the
number of approaches attempted (n - 24). The results are plotted in
Figure 12 using separate data points for approach (Inner Marker) and
landing (touchdown) outcomes. The A and ENR concepts show substantial
improvement over baseline and the modified baseline procedure (MBP) is
only slightly better than baseline. Using this composite outcome index,
the level of performance is about the same across all of the aiding con-
figurations in which AA or ENR was included.
Table 12 presents summary data on approach and landing outcomes
for the alternative go-around advisory concepts. The data in Table 12
indicate that overall performance is somewhat better when the go-around
advisories are combined with the GNS or MFD techniques rather than the
baseline.
The pattern of within-limit approach and landing outcomes under
baseline conditions, or with baseline instrumentation augmented by any of
the three go-around advisories, is remarkably consistent. Only 5 of the
24 approaches (21%) were within limits at the Inner Marker and only 6 or
7 were completed with an in-limit touchdown (257). However, the number
of go-arounds was substantially higher than baseline when the advisories
were available to the pilot.
When a go-around advisory was paired with either the GNS or
MFD technique, the number of within-limit approach outcomes increased
to the levels recorded for earlier testing of these techniques. The
number of within-limit landings, however, was substantially lower than
in the earlier tests and the number of go-arounds increased. Apparently,
the emphasis on go-around advisories in this experiment influenced the
pilots to execute a missed approach in some instances where the approach
might have been successfully completed.
The data obtained in this experiment were also examined to
determine the general validity of the go-around advisories in relation
to the severity of the shear encounters, the pilot's response to the
advisory, and the subsequent approach outcomes. To make this assessment,
the performance of the alternative go-around advisory techniques was
42

x 0 0-- -- 0 APPROACH OUTCOMES
z - LANDING OUTCOMES
0 -
0.4
A 0.2
-0.2
IL MaP A ENR &AA/GNS-3 ENR/MFDT-2ALTERNATIVE GO-AROUND ADVISORY CONCEPTS
FIGURE 12 PERFORMANCE OF GO-AROUND DECISION AIDS
43

Table 12
SUMMARY OF APPROACH AND LANDING OUTCOMES
IN THE INITIAL TESTING OF GO-AROUND ADVISORIES
Criterion Alternative Go-Around Advisory Concept
Measure BL MBP AA ENR AA/GNS-3 ENR/MFDT-2
i. Number of Within-LimitApproaches (Inner Marker) 5 5 5 5 12 9
2. Number of Within-LimitLandings (Touchdown) 7 4 7 6 9 12
3. Number of SuccessfulGo-Arounds 8 13 14 14 9 9
4. Number of Crashes 2 3 1 1 1 1
classified as either "Correct," "Suspect," or "False," based on the run
conditions associated with the occurrence or non-occurrence of an advi-
sory. A count was then made of the number in each category for each of
the experimental advisory techniques.
The results of this count are presented in Table 13. In gene-
ral, advisories were counted as "Correct" when the severity of the shear
encounter was severe and the pilot either executed a go-around or ignored
the alert and landed out of limits. A "Correct" advisory was also coun-
ted when no announcement was made and shear severity was moderate or for
either level of shear severity when the pilot managed to keep &pproach
outcomes within limits. Advisories were counted as "Suspect" wr.en they
occurred on runs that resulted in within-limit touchdowns or when they
occurred on a moderate shear encounter and the pilot executed a go-arclund
that may have been unnecessary. "False" advisories were counted when no
advisory was announced and the landing was out of limits, when no advi-
sory was issued on a severe shear encounter and the pilot went around,
and when an advisory was issued too late for the pilot to avoid an out-
of-limLts touchdown or crash.
44
L ____

Table 13
COMPARATIVE PERFORMANCE OF ALTERNATIVE
TECHNIQUES FOR PROVIDING GO-AROUND ADVISORIIS
Number of Advisory Announcements
Advisory in Each Validity CategoryaTschnique Correct SHs8ect ELUes
I. MBP 9 2 7
2. AA 11 5 2
3. ENR 12 2 4
4. AA/GNS-3 9 6 3
5. ENR/MFDT-2 15 3 0
aBased on our analysis of 18 runs for each system. Runs
for one pilot are not included because advisory announce-ments were not recorded.
The data in Table 13 indicate that the best go-around advisory
performance was recorded when the energy rate indicator was combined with
the MFD technique. "Suspect" or "False" alerts occurred on more than
one-third of the runs when the AiA concept was used, either alone or in
combination with the groundspeed technique. The highest "'False" alert
rate was recorded for the modified baseline procedure (MBP).
Pilot evaluations of the go-around advisory aids were somewhat
confounded with their assessments of the GNS-3 and MFD techniques. No
clear preferences or endorsements of the AA or ENR concepts were expressed,
perhaps because of the limited time available to the evaluation pilots
to become fully aware of what these new advisories were telling them or
to see the devices as believable. The project pilots observing from
the right seat felt that the evaluators began to appreciate the utility
of the advisories after some experience with them, but were often con-
fused or tended to experiment with them as additional information for
control rather than as warning devices. Thus, whenever the AA or ENR
45

indicators moved toward the energy-deficient range, the pilots would add
thrust until the indication moved back to the "safe" region. Go-arounds
were often delayed until these control actions failed to correct the
situation.
The AA concept was generally recognized as having more predic-
tive power and might be able to keep the aircraft out of trouble if the
advisories were heeded. However, the pilots felt that the A indicator
too often indicated a go-around when it did not seem to be appropriate
to the situation. The ENR concept seemed to be easier for the pilots to
accept, but some felt it would be more useful as the basis for a thrust
comand than as a go-around advisory.
46
IV FULL TRIAL
A. Systems Tested
On the basis of initial test results and consultation with the pro-
ject Technical Monitor at FAA, three aiding concept configurations were
selected for a final series of simulation tests. These test exercises
were designed to test the various groundspeed, modified flight director,
and go-around advisory concepts with a larger group of pilots and to
determine the level of operational performance and pilot acceptance that
might be expected when these aids were available for coping with the
shear encounter. Twenty-six pilots participated in these simulation
exercises and included representatives from FAA, airlines, aircraft
manufacturers and the Air Force.
The three aiding configurations selected for testing are distin-
guished by the manner in which groundspeed was displayed, the type of
go-around advisory provided, and the availability of the modified
flight director and thrust commands. For convenience, the three test
configurations will be referred to as:
1. The GNS-3/ENR configuration
2. The GNS-6/AA configuration
3. The MFDT-2/ENR configuration
The designators used to identify the major components of each confi-
guration (i.e., GNS-3) are the same as those used in Section III; the
reader is referred to the descriptions given in that Section for each
component. The designated cockpit displays were the same as those used
in initial testing except that the digital readout of computed values
of AA was not used. Instead, a yellow light was installed on the glare
shield, above the airspeed indicator, and was used to indicate the occur-
rence of a negative AA by illuminating and flashing. This light was also
used to indicate that computed ENR had exceeded the threshold value for
the red zone on the ENR indicator.
47

The three display arrangements associated with each test condition
are shown in Figures 13, 14 and 15. The pilot's basic task was essen-
tially the same using all three configurations, i.e., to fly the approachpath by reference to pitch and roll steering commands and to manage air-speed by reference to the Fast/Slow speed command. Inclusion of the
ground speed displays and the go-around advisory light in the scan was
at the pilot's discretion. Go-around advisories were announced by the
First Officer, based on his monitoring of the ENR indicator and advisory
light, and pilot response to the advisories was also at his discretion.
B. Evaluation Plan
The effectiveness and acceptance of the aiding configurations just
described, relative to a baseline condition defined by conventional DC-10
cockpit instrumentation and approach management technique, has been evalu-
ated in several prior simulation test exercises. The primary concern of
the present study was to expose the more promising versions of these aid-
ing concepts to a larger group of pilots and to record their attempts
to cope with the low-level shear encounter. For this reason, the tests
were not designed to contrast the test concepts with baseline capabilities
and emphasis was placed on an individual assessment of the potential bene-
fits of using each of the three selected aids.
Most of the 26 pilots recruited for this stage of testing had no
prior experience with the experimental aiding concepts or with the wind
shear profiles developed ior the tests. All of them were senior pilots
with extensive experience in command of large transport aircraft. Aver-
age pilot-in-comnand time was more than 9,000 hours and the average time
in the DC-10 was 580 hours. Six of the pilots reported DC-10 time in
excess of 1,000 hours and ten were not DC-10 qualified but were high-
time pilots in heavy transport aircraft.
It was assumed that the experience of these senior pilots, in
attempting to cope with the simulated wind shear encounters on a manually
flown ILS approach, would provide a sound basis for estimating the opera-
tional potential of the experimental aiding concepts. The primary basis
for making these estimates was the data recorded on approach outcomes
48
0z
00
-IU
zCC 1IfI00 qV
UAw
SU
49c
UA0
000
Z 0 L
0 50

w
J 8
000
LU
I-
U
LLwIL
51.

(i.e., a successful approach terminating with a within-limit landing on
the runway, a successfully executed go-around, a touchdown on the runway
but exceeding position or velocity limits, or a crash). Objective approach
outcome data were supplemented by pilot critiques of the aiding concepts
and by their overall assessments of the practicality of the experimental
techniques for use in regular airline operations.
The data collection plan adopted for this test exercise is shown in
Table 14. Each subject pilot was assigned to fly three sessions in the
simulator and was shown a different aiding concept configuration in each
session. A single session consisted of 4 training runs on the designated
aid followed by 4 data runs and required approximately 40 minutes to com-
plete. Two pilots were scheduled for each day of testing, alternating
sessions in the simulator, and the full test schedule for the 26 pilots
was completed in 13 days.
Table 14
TEST PLAN FOR FULL-SCALE TESTING
OF SELECTED SYSTEMS
Test ConfigurationSubjectPilot GNS-3/ENR GNS-6/AA MFDT-2/ENR
1 Each pilot flies 4 training2 runs and 4 data runs using
each aid. A different wind3 shear profile is selected
for each run.
26
Total Data Runs: 104 + 104 + 104 = 312
52

As indicated in Table 14, the test plan provided data on a total of
312 runs and allowed estimates of operational performance to be based on
104 runs for each of the aiding configurations tested. Performance against
individual wind shear profiles was based on 26 data runs. While contrasts
between the alternative aiding configurations was not of prime importance
in this study, the test did allow for comparisons of their relative effec-
tiveness. For this purpose, the order of pilot exposure to the alterna-
tive aids was counterbalanced to preclude any systematic bias in the data
that might be attributed to the carry-over of fatigue, learning or moti-
vation effects from one simulator session to another.
The wind shear profiles selected for both training and data runs
are identified in Table 15. The profile designators given in the second
column refer the reader to the profile descriptions given in Section II
of this report. Notice that the profiles used for training and data runs
were not the same. The training profiles were intended to be similar to
the data profiles but to enhance realism test data were taken on the pi-
lot's first exposure to a particular shear. For training runs, the shear
profiles were always selected in the order shown. The order of exposure
to the shears on data runs was scrambled so that pilots would not be able
to anticipate the shear condition on their second or third session.
Test procedures and data recording activities were described in
Section II. In this test exercise, pilots were briefed to apply their
best efforts to complete the approach using the assigned aiding concepts
in accordance with the pre-session briefings. The briefings stressed
the fact that the decision to continue the approach or go-around was
left to the pilot's judgment and that a go-around should be initiated
at any time the pilot assessed the flight situation to exceed the limits
he would accept for an actual approach. First Officer announcements of
go-around advisories and pilot monitoring of the ENR or AA indicators
were to be treated as advisory information.
C. Aporoach and Landing Outcomes
As in the Initial Trial, the simulator runs were scored for accept-
ability in terms of approach outcomes, using the "window" at the Inner
53

Tab le 15
WIND SHEAR PROFILES SELECTED FOR
FULL- SCALE TESTING
Wind Profile
Training Runs: Type Severity
1 Boundary Layer Moderate
6 Thunderstorm Moderate
8 Thunderstorm Moderate
9 Thunderstorm High
Data Runs:
7 Thunderstorm Moderate
4 Thunderstorm High
5 Frontal Moderate
10 Thunderstorm High
Marker (100-ft glide slope point) defined by the limits of Table 6, and
also in terms of landing outcomes. Because a decision to abort the ap-
proach and execute a go-around was the appropriate action on many runs,
the most meaningful performance data is that which shows both the go-
arounds and the number of acceptable touchdowns. In this Full Trial
with the 26 subject pilots we scored a touchdown as "in-limits" if it
did not exceed the position, velocity and attitude limits of Table 6,
except that instead of the 3000-ft position limit along the runway we
used DC-10 stopping limits supplied by Douglas for a 7000-ft runway with
normal surface (thrust reverser forces were not used in computing stop-
ping distance). Thus, a landing was scored as acceptable or "in-limits"
if it met the Table 6 criteria and also if the combination of touchdown
position along the runway, longitudinal touchdown velocity, and longi-
tudinal surface wind indicated that the aircraft would have been able to
be braked to a stop without running over the runway end.
54

The resulting tabulations of landing outcomes for each of the 3
systems tested are shown in the bar charts of Figure 16. For each of
the 4 wind profiles of the test runs (training data is not included) the
length of a given section of the bar shows the percentage of the runs
that fell in the corresponding category: IL for "in-limits," G/A for"successful go-around," etc. The total number of runs in each bar is
shown at the top. The runs outside limits are separated according to
whether the system's go-around decision aid advised a G/A and was
announced by the First Officer, indicated by "A," and whether the simu-
lated aircraft touched down on the runway and would have been able to
stop on the runway, indicated by cross-hatching. The most unfortunate
category is "G/A attempted, not successful" indicating approaches on
which either G/A was advised too late or the pilot failed to respond in
time to avoid a bad landing.
As would be expected, the charts show that the high-severity wind
shears, profiles 4 (Allegheny at Philadelphia) and 10 (Eastern at JFK
Airport), produce a larger number of go-arounds than do the profiles of
moderate severity. The combined length of the "IL" and "G/A" categories
give the "safe outcome" percentage. These added to the "A" categories
show the percentage of runs for which the outcome would have been "safe"
if the G/A advisory had been honored; check of the data showed that in
every one of the "A" cases the advisory was issued at an altitude high
enough for a successful G/A if the pilot responded promptly. In evalu-
ating these results it is important to have a standard of performance
to serve as a basis for comparison, particularly since no simulated
exercise can be completely realistic even when the experiments have made
all reasonable efforts. In an earlier DC-10 wind shear simulation exer-
cise 2 we ran 60 approaches with 16 pilots using baseline approach manage-
ment (i.e., current conventional instrumentation and flight-director
procedures for the DC-l0) with wind fields that had no significant wind
shear. With the touchdown limits of Table 7 there were 54 acceptable
landings, which indicates that a rate of 90 percent "in-limits" landings
is the success rate to be expected in a simulation of no-wind-shear cur-
rent landing operations under comparable visibility conditions. Note
that the limits of Table 7 do not include the stopping criterion for a
55

d. -WO ZO (r L U L
IWO U. w Z 4 ZW 0 w 0 uz
02 z2 E>J Z0 >33.j wU.<HE lU, 0 U) )CC -< j w
24 0
LU
S.i
dca
- w00
2. z
0
Lu R . 2
56

w w U
uuI wI
> (w
ccn
o -.. VA~2/ 57

7000-ft runway and so are not as restrictive as those used here in the
Full Trial. The 90-percent standard is probably a little high.
Figure 16 shows that none of the 3 systems tested performed up to
the 90-percent standard on all wind profiles. The potential perfor-
mance--i.e., that we could assume would have been realized if the G/A
advisories had been honored--does exceed the 90-percent standard for
some of the profiles:
GS-3/ENR on profiles 5, 4, 10
GNS-6/AA on profiles 4 and 10
MFDT-2/ENR on profiles 5 and 10
It is clear that profile 4 (Allegheny at Philadelphia) presented the
most difficult problem, particularly for the MFDT-2/ENR system. We do
not have a good explanation for the relatively poor performance of this
system on this wind field.
Approach outcome data for the three aiding concepts tested are sum-
marized in Table 16. The counts presented in Table 16 are based on the
number of data runs (n) indicated in parenthesis at the bottom of each
column and thus represent the performance of all 26 subject pilots on
the four wind shear profiles. The "Performance Score" is the same as
that used in the G/A aid experiment of the Initial Trial.
When the smaller number of data runs on the GNS-3/ENR condition is
considered, the approach outcome data shows very little difference in the
performance of the three aiding concepts. A contrast with the results of
initial testing suggests that the approach outcome data in this Full Trial
may represent a somewhat pessimistic projection of the operational perfor-
mance of the aiding concepts. Most of the subject pilots participated in
the full-scale tests (20 of the 26) had no prior experience with the aid-
ing concepts or simulated shear profiles. The better performance of the
evaluation pilots in the initial tests may reflect their greater tamilia-
rity with the aids. A more important performance factor, however, may
have been the complexity of the aiding concept configurations tested and
the fact that the pilots were exposed to three different configurations
in one day of testing.
58
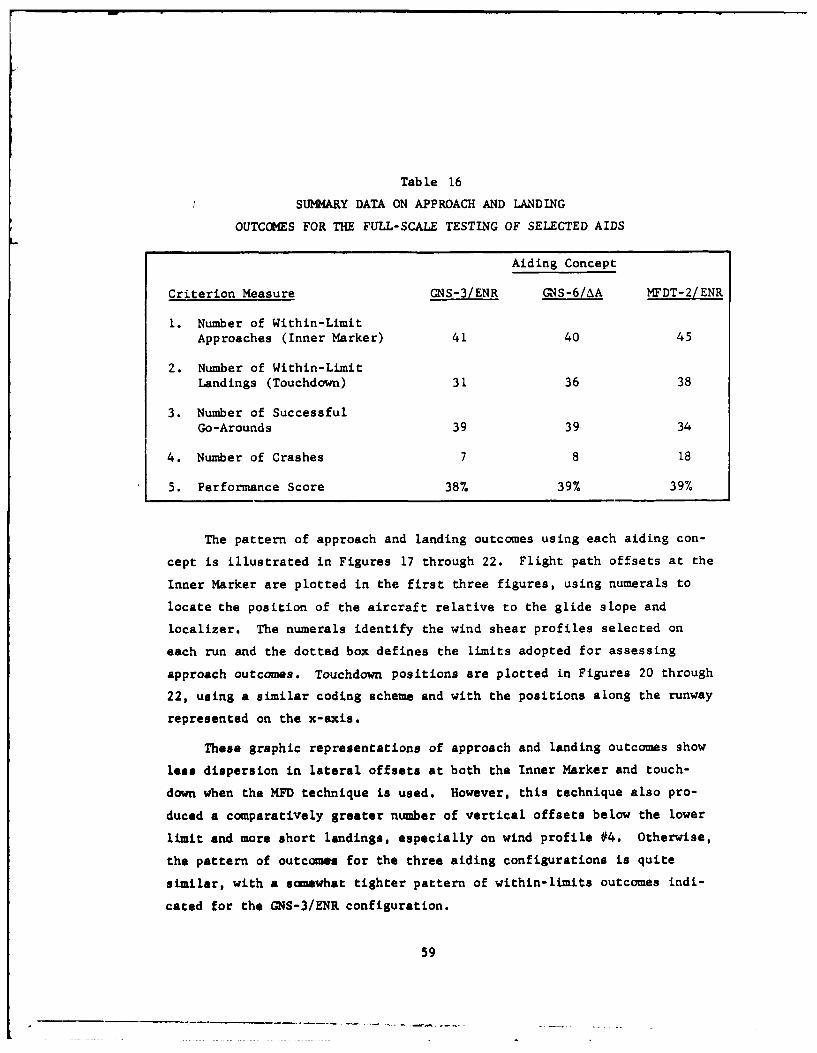
Tab le 16
SUMMARY DATA ON APPROACH AND LANDING
OUTCOMES FOR THE FULL-SCALE TESTING OF SELECTED AIDS
Aiding Concept
Criterion Measure GNS-3/ENR GNS-6/AA MFDT-2/ENR
i. Number of Within-LimitApproaches (Inner Marker) 41 40 45
2. Number of Within-LimitLandings (Touchdown) 31 36 38
3. Number of SuccessfulGo-Arounds 39 39 34
4. Number of Crashes 7 8 18
5. Performance Score 38% 39% 39%
The pattern of approach and landing outcomes using each aiding con-
cept is illustrated in Figures 17 through 22. Flight path offsets at the
Inner Marker are plotted in the first three figures, using numerals to
locate the position of the aircraft relative to the glide slope and
localizer. The numerals identify the wind shear profiles selected on
each run and the dotted box defines the limits adopted for assessing
approach outcomes. Touchdown positions are plotted in Figures 20 through
22, using a similar coding scheme and with the positions along the runway
represented on the x-axis.
These graphic representations of approach and landing outcomes show
less dispersion in lateral offsets at both the Inner Marker and touch-
down when the MFD technique is used. However, this technique also pro-
duced a comparatively greater number of vertical offsets below the lower
limit and more short landings, especially on wind profile #4. Otherwise,
the pattern of outcomes for the three aiding configurations is quite
similar, with a somewhat tighter pattern of within-limits outcomes indi-
cated for the GNS-3/ENR configuration.
59
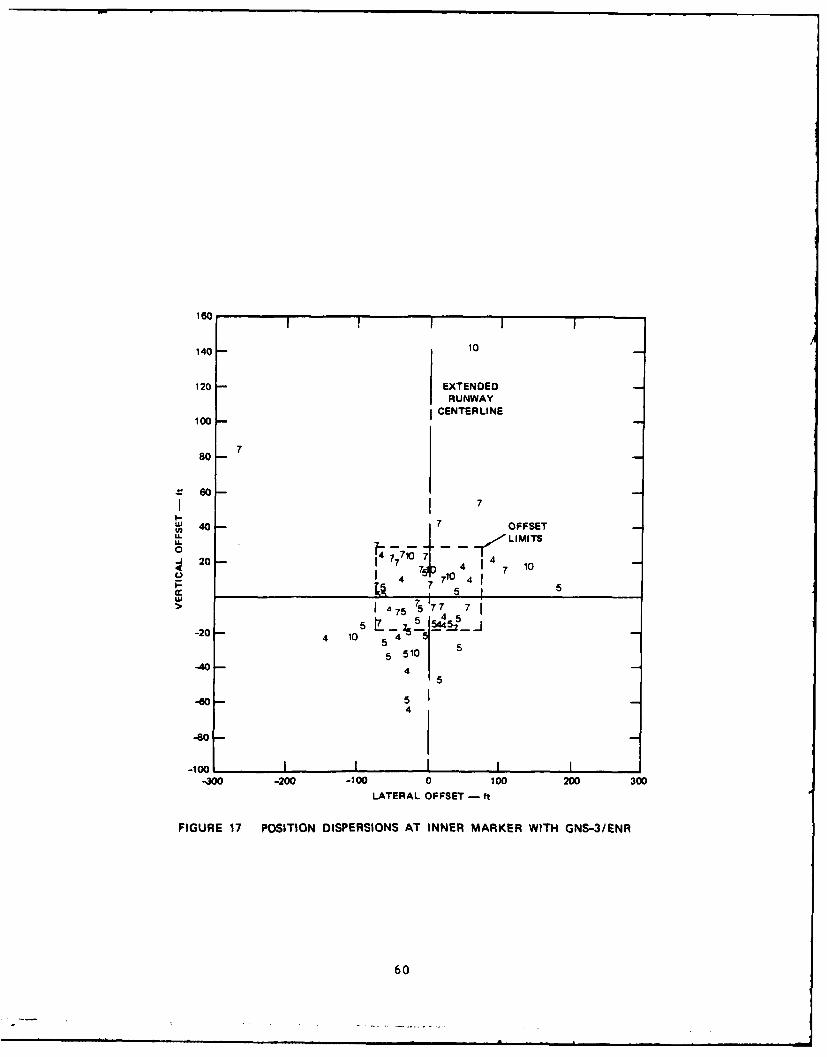
160
140 - 10
120 - EXTENOEDRUNWAY
1 CENTERLINE
780-
S60-
I-U,4,- OFFSETLL LIMITS
J 20 I 70 I 10144I 4 r7 4 !
, 5ILl I 5 757 7 I
4 105 510I
-40 -5
--60- 5
4-80 -
-100 I I I I-200 -100 0 100 200 300
LATERAL OFFSET - ft
FIGURE 17 POSITION DISPERSIONS AT INNER MARKER WITH GNS-3/ENR
60
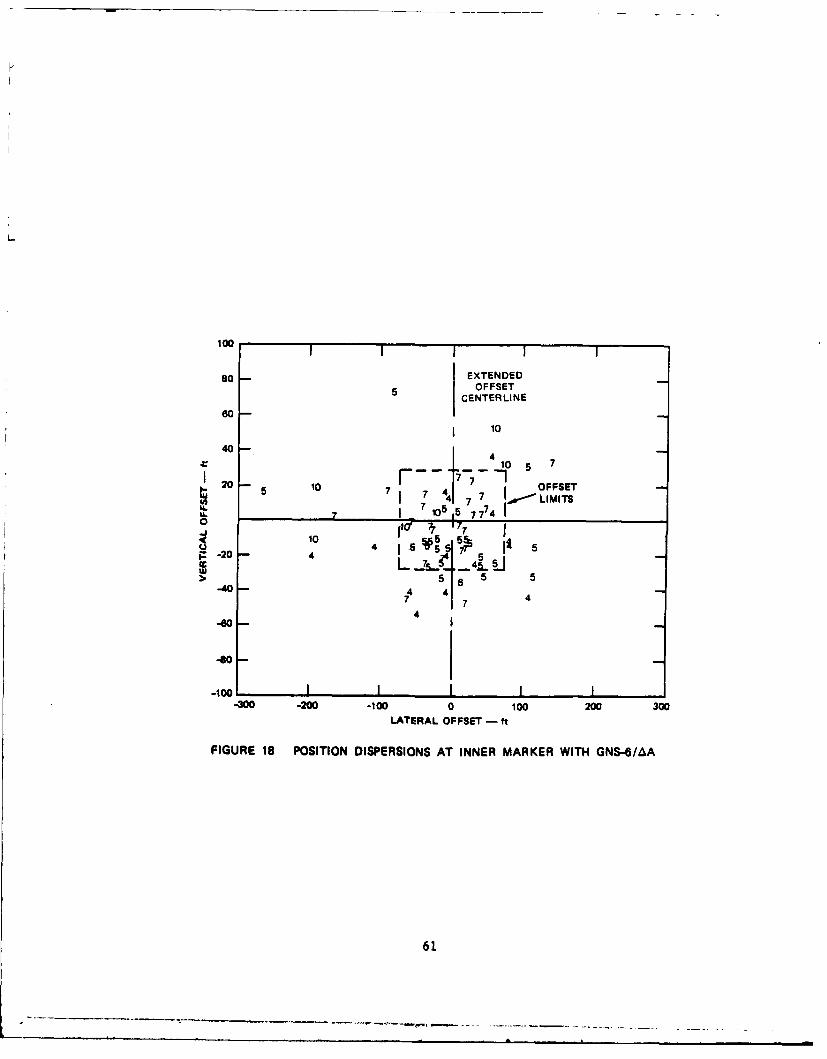
100
80 - EXTENDED
OFFSETCENTERLINE
60 -
40 - 404
010 5 7
20 7 7 5 0 7 OFFSET
I4 7 LIMITS
77
0 -
-20 -I IL 4jj
-40 - 4 4
480
-1001I I-0 -200 -100 0 100 200 300
LATERAL OFFSET - ft
FIGURE 18 POSITION DISPERSIONS AT INNER MARKER WITH GNS-6/&A
61
----------------------------------------- •---•-.---I-

L
I
5100 -
EXTENDED
8o - RUNWAYCENTERLINE
60 -
4= 40 -- 18104 -OFFSET
. 20 - XU.U. 7
oU- J 7______________________________
-40 7 4
5-60-- 4¢4
745
-100 I L I I I0-2 0 - 1 0 0 o 1 0 0 2 0 0 3 0 0
ATERAL OFFSE --
FIGURE 19 POSITION DISPERSIONS AT INNER MARKER WITH MFDT-2/ENR
62
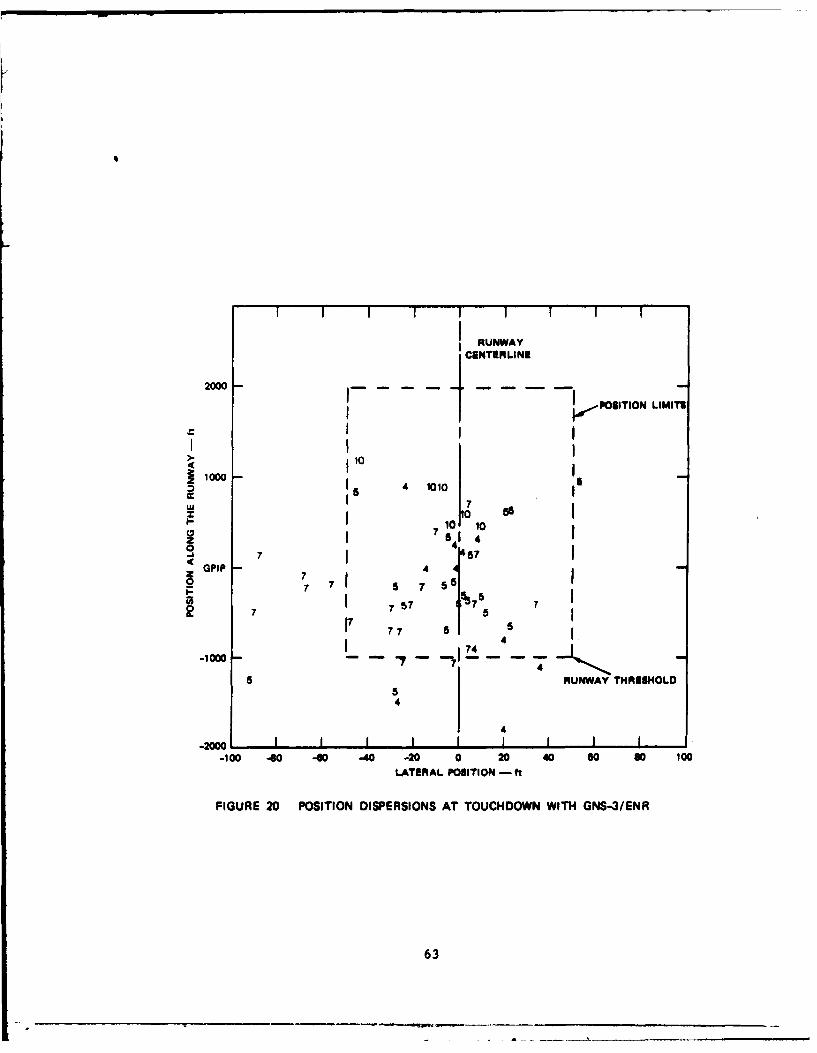
II III III
RUNWAYCEiNTERLINE
2000 4EER
POSITION LIMITS- I I
SI I I>100 11° I
4 41010II- I lll-to i
w 7 It 6 I7 84 4
GPIP - 4 4 I7 7 57 -r 5,
7 77 5 5 51 , I
-1000 I_ _ "
S RUNWAY TrES.HOLDS4
4
-2 0 1 I I I I I I I-100 40 -w -40 -20 0 20 40 60 o 100
LATERAL POSITION - ft
FIGURE 20 POSITION DISPERSIONS AT TOUCHDOWN WITH GNS-3/ENR
63
•.............
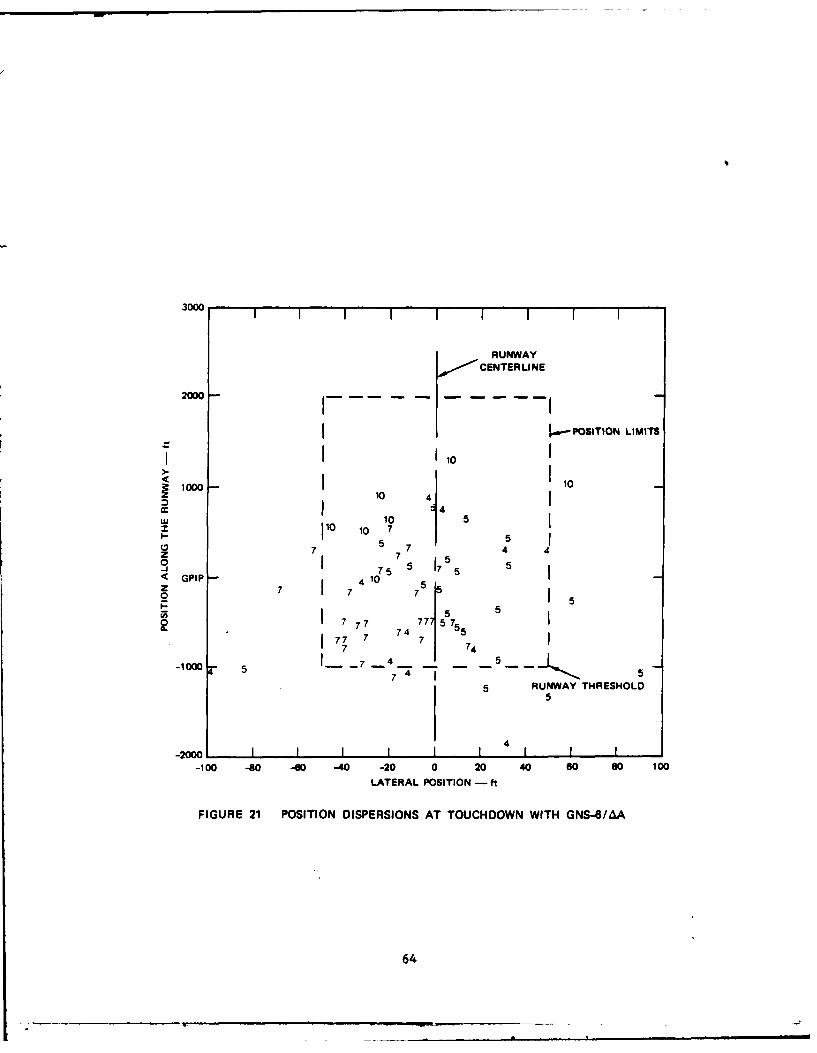
3000
RUNWAYCENTERLINE
2000
I .POSITION LIMITSII ho I
> [ 10
I~1000 10 410
10 Iz 10 10 7
755z77 7 5 4q 1 75 5 17I< GPIP 4 10
o I 57 777 55
I 7 74 7 7 I
-- 0 7 ___5I 7 4 I-10 5 4" 5
5 RUNWAY THRESHOLD5
4-20001 1 1 1
-100 -80 -40 -40 -20 0 20 40 60 so 100LATERAL POSITION - ft
FIGURE 21 POSITION DISPERSIONS AT TOUCHDOWN WITH GNS-6/4A
64

I II I I I1I
RL'NWAY
CENTERLINE
POSITION
I LIMITS
I ?o 1 I
1 Iwo 10II' I
04 5 5
7 75OPIP7 7
-1ow - _ .2 - I RUNWAY4 4 45THRESHOLD
5 4
4 7 4 4 4 4
4-I 4 IA I I I I I
-100 40 40 -40 -20 0 20 40 so 80 100LATERAL POSITION - ft
FIGURE 22 POSITION DISPERSIONS AT TOUCHDOWN WITH MFDT-2/ENR
65
The data in Figure 16 indicate that the aiding concepts may be more
effective for the severe shear conditions. As expected, a larger pro-
portion of within-limit approaches were recorded for the moderate shears.
However, more go-arounds were executed on the severe shears, particularly
on profile #10, and there were fewer out-of-limit outcomes on runs with
no go-around advisory given to the pilot. The bar diagrams also show the
differences in the performance of the aiding concepts on each of the test
shear profiles.
The validity of the go-around advisory announcements was assessed
using the same advisory classification scheme as that described for the
initial testing. Table 17 presents the counts of advisory announcements
for each validity category for each combination of aiding concept and
wind shear severity level. The "Correct Advisory Index" at the bottom
of the Table shows a clear trend toward more effective advisory announce-
ments for the severe shear profiles. The performance of the MFDT-2/ENR
configuration on the severe shears confirms the initial test results
showing that the best advisories were given when the energy rate indica-
tor was paired with the MFD technique. However, note that the highest
"False" alert rate was recorded when this aiding configuration was used
on the moderate shears.
In general, the data on approach and landing outcomes demonstrate
that the aiding configurations tested do provide the pilot with useful
information for detecting and avoiding severe wind shear encounters.
However, the number of "False" and "Suspect" go-around advisories is
unacceptably high and indicates the need for further development of the
ENR and AA techniques and/or the way they are used by the pilot.
1. Airspeed Management and Fliaht Path Control
Airspeed management and flight path control are the two basic
components of approach management and the various elements of the aiding
configurations tested were expected to support and enhance pilot perfor-
mance of these tasks. The results presented in this section provide an
indication of how well the pilot was able to perform the tasks when each
of the aiding concepts were used.
66
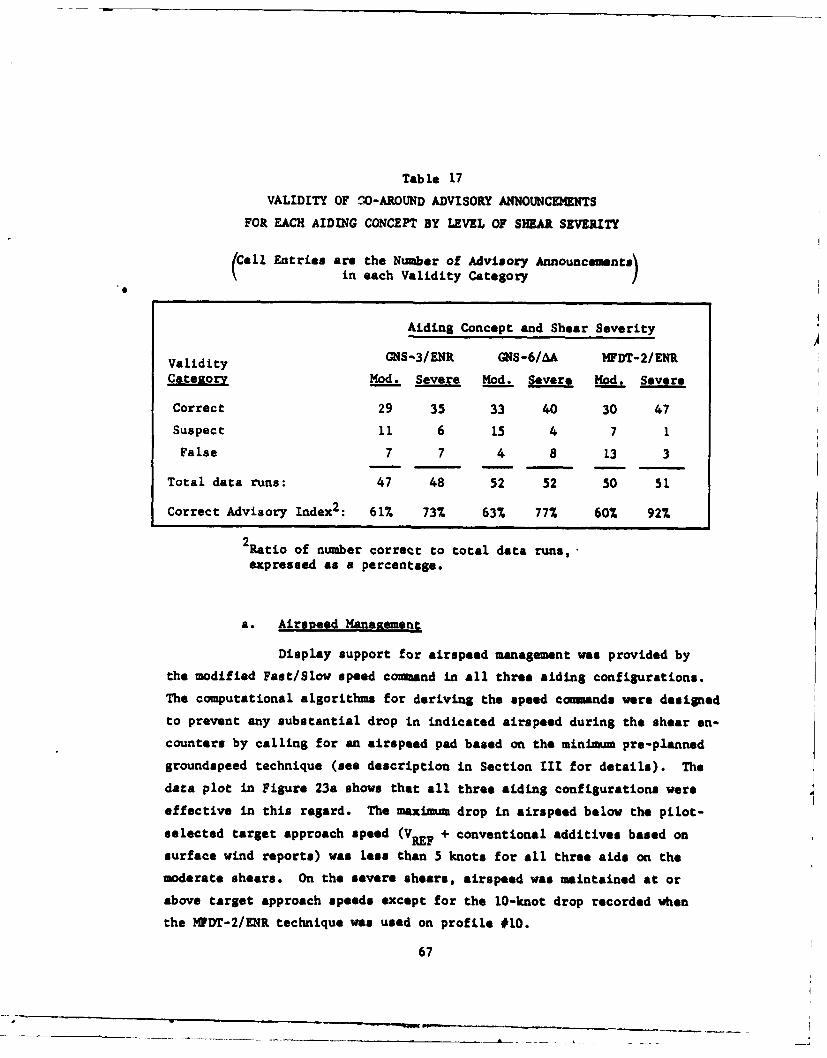
Table 17VALIDITY OF 1O-AROUND ADVISORY ANNOUNCEMENTS
FOR EACH AIDING CONCEPT BY LEVEL OF SHEAR SEVERITY
(Cell Entries are the Number of Advisory Announcements)in each Validity Category /
Aiding Concept and Shear Severity
Validity GNS-3/ENR GNS-6/AA MFDT-2/ENRCatezory Mod. Severe Mod. Severe Mod. Severe
Correct 29 35 33 40 30 47
Suspect 11 6 15 4 7 1
False 7 7 4 8 13 3- - - I
Total data runs: 47 48 52 52 50 51
Correct Advisory Index 2 : 61 73% 63 77% 60% 92%
2Ratio of number correct to total data runs,-expressed as a percentage.
a. Airspeed Manazemerit
Display support for airspeed management was provided by
the modified Fast/Slow speed comand in all three aiding configurations.
The computational algorithms for deriving the speed comands were designed
to prevent any substantial drop in indicated airspeed during the shear en-
counters by calling for an airspeed pad based on the minimum pre-planned
groundspeed technique (see description in Section III for details). The
data plot in Figure 23a shows that all three aiding configurations were
effective in this regard. The maximum drop in airspeed below the pilot-
selected target approach speed (VREF + conventional additives based on
surface wind reports) was less than 5 knots for all three aide on the
moderate shears. On the severe shears, airspeed was maintained at or
above target approach speeds except for the 10-knot drop recorded when
the MFDT-2/ENR technique was used on profile #10.
67

20
AIDING CONCEPT:
GNS-3/ENR
-10 -0 GNS-6/AA 01,.---- MFT-2/ENR
wJ TARGET APPROACH
Lc 0-
Lu
C -10
-205 7 4 10
MODERATE SEVEREWIND SHEAR PROFILE
Is) MAXIMUM DROP IN AIRSPEED OVER THE 500-TO-100-ftAPPROACH SEGMENT, AVERAGED ACROS PILOTS
oI
0
UJ Nuj
0 ,5 7 4 10
MODERATE SEVEREWIND SHEAR PROFILE
IbI RMS AIRSPEED ERROR OVER THE 0N0-TO-100-ftAPPROACH EGMENT, AVERAGED ACROS PILOTS
FIGURE 23 AIRSPEED MANAGEMENT DURING THE LOW-LEVEL SHEAR ENCOUNTERSUSING EACH AID
68

The data plot in Figure 23b shows the impact of carrying
the airspeed pad on conventional airspeed management. Mean displace-
ments (rms) from target approach speed (airspeed error) over the 500 to
100-foot approach segment, where most of the shear activity occurred,
are plotted for each wind shear profile. Since airspeed drop was less
than 10 knots over this approach segment, as shown in Figure 23a, the
rms airspeed errors shown generally represent the magnitude of the air-
speed required to fly the minimum pre-planned groundspeed technique. The
data indicate that this pad was substantial on the severe shears but gen-
erally less than 10 knots on the moderate shear encounters.
The effectiveness of the aiding techniques in actually
maintaining groundspeed at or above the pre-selected minimum (target
groundspeed) is shown in Figure 24. The data show that pilots were
generally able to keep the drop in groundspeed to less than 10 knots for
both moderate and severe shears using the modified Fast/Slow speed com-
mand associated with GNS-3 and GNS-6. When the thrust command developed
for the MFDT-2 technique was used, groundspeed drop averaged more than
20 knots. This difference was expected and is due to differences in the
computational algorithm for the MFD thrust command (see Figure 10, in
Section III). In the thrust coummand algorithm, the gains applied for
groundspeed management were set at half the value of the gains applied
for maintaining target airspeeds and groundspeed was thereby allowed to
drop below its reference value to a greater degree than in the modified
speed command.
Figure 25 shown the effects of carrying the excess approach
speeds on landing performance. The plot at the top of this figure shows
average touchdown positions along the runway and indicates a general ten-
dency for the aircraft to touchdown in the first 1000 feet of the runway,
i.e., short of the glide path intercept point (GPIP). With no excess
speed in this approach, nominal touchdown positions would be expected to
be about 500 to 600 feet beyond the GPIP. The touchdown positions re-
corded on wind profile #10 were about 200 feet beyond this nominal touch-
down none. Note that when the MFD technique was used on wind profile #4,
average touchdown positions were very short--right at the runway three-
69

10
TARGET GROUND- SPEED
g 06&
-100
> AIDING CONCEPT:
-20 - GNS-3/ENR
cc-!1- GNS-6/A
0-.-' MFDT-2/ENR
-30 I5 7 4 10
MODERATE SEVERE
WIND-SHEAR PROFILE
FIGURE 24 MAXIMUM DROP IN GROUNOSPEED OVER THE 500 TO 100-FT APPROACH
SEGMENT (averaged across pilots)
70
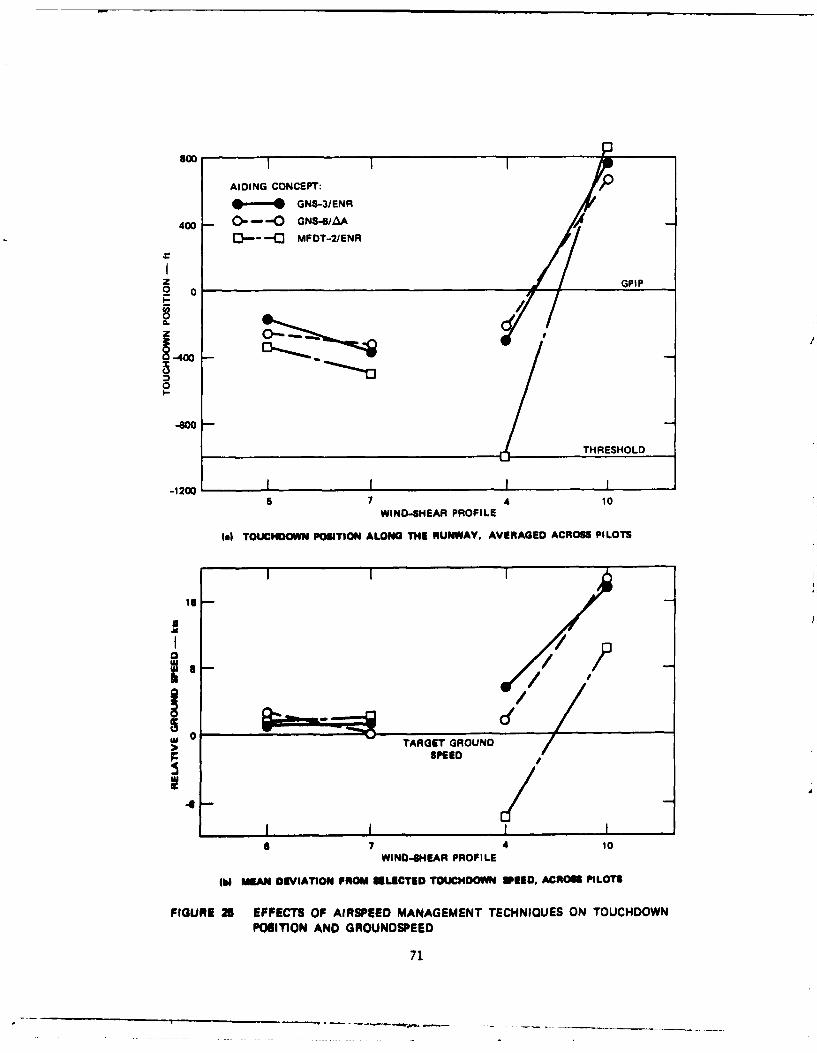
800
AIDING CONCEPT: O
* GNS-3/ENR
400 O---O GNS-/A[ --- MFOT-2/ENR
z GPIPO 0
z9-400
0
4w
THRESHOLD
-1200 I I5 7 4 10
WINDO4HEAR PROFILE
li TOUCHDOWN POSITION ALONG THE RUNWAY. AVERAGED ACROSS PILOTS
16
0
I' /
aou
0
I I Ia 7 4 10
WINO-SHEAR PROFILE
IM MEAN DEVIATION FROM ELECTED TOUCHDOWN WEED, ACROSS PILOTS
FIGURE 26 EFFECTS OF AIRSPEED MANAGEMENT TECHNIQUES ON TOUCHDOWNPOSITION AND GROUNDSPEED
71

hold. Figure 23b shows that the average airspeed pad on this profile
was more than 20 knots and it is clear that excess approach speed on
this type of shear encounter does not lead to long touchdowns.
Another concern relating to carrying excess airspeed on
the approach is that touchdown speeds might be higher than normal and
lead to stopping problems and/or excessive stress on braking systems and
tires. The plot in Figure 25b shows the average groundspeeds at touch-
down relative to the desired (target) groundspeed for reported surface
wind conditions. Touchdown speeds were not excessive for three of the
wind profiles, including profile #4 on which the highest airspeed pads
were recorded (see Figure 23b). However, average speeds as high as 18
knots above the target speed were recorded on wind profile #10 and, on
a short runway at the corresponding touchdown positions shown in Figure
25a, this level of excess speed could lead to serious stopping problems.
b. Fliaht Path Control
Display support for this task component was provided by
the standard DC-10 flight director, when the GNS-3 and GNS-6 aids were
used, and by the modified flight director steering commands when the
[FDT-2 techniques was used. Summary data on the accuracy of glide slope
and localizer tracking with these techniques are presented in Figures 26
and 27 for each wind profile. Data points in these plots are rms devia-
tions from the glide slope (vertical offset) and localizer (lateral off-
set) over the 500 to 100-foot approach segment that have been averaged
over the 26 pilots.
The accuracy of glide slope tracking was somewhat better
using the MFD, except for the cross-over shown on profile #10 for the
GNS-6/AA concept. However, except for the obvious superiority of the
MFD recorded on profile #4, the differences between the two flight di-
rectors for glide slope tracking was not substantial in this experiment.
A marked improvement in the accuracy of localizer tracking was recorded
for the MFD on all four wind profiles, as shown in Figure 27.
The data plots in Figure 28 provide an indication of how
closely the subject pilots were able to follow the pitch and roll steer-
72

70
AIDING CONCEPT:
S GNS-3/ENR
60o O GNS6/A
0 --- ] MFDT-2/ENR
so -,
I-
LA.
40
u
30 _
cc 20
10
0 I I IS 7 4 10
MODERATE SEVERE
WIND-SPEAR PROFILE
FIGURE 26 GLIDE SLOPE TRACKING ACCURACY DURING LOW LEVEL SHEARENCOUNTERS
73

80
o---
70 7
60
50 -
I- AIDING CONCEPT:S GNS-3/ENR
0I -- ,, GNS-6/ A40
-' 40 Q- -,C MFDT-2/ENR
i-,
,
- 30
20
10 -
10 II I
5 7 4 10MODERATE SEVERE
WIND-SHEAR PROFILE
FIGURE 27 LOCALIZER TRACKING ACCURACY DURING LOW LEVEL SHEARENCOUNTERS
74

S II
AIDING CONCEPT:
*- @ GNS-3/ENR
0O--- -o GNS-6/AAO 6-0 MFOT-2/ENR
UA
4/
2
10
0 7 4 10
MODERATE SEVERE
WINO-SHEAR PROFILE
(a) ACCURACY OF PITCH STEERING COMMAND FOLLOWING OVERTHE 500-TO-100-ft SEGMENT
4AII ox
S2
I 1 I05 7 4 10
WIND-SHEAR PROFILE
(hi ACCURACY OF ROLL STEERING COMMAND FOLLOWING OVERTHE 50 -TO-1O-ft MGMENT
FIGURE 28 ACCURACY OF FLIGHT DIRECTOR COMMAND FOLLOWING DURINGLOW LEVEL SHEAR ENCOUNTERS
75
ing commands using the conventional and modified flight directors. The
more abrupt and more active changes in steering commands represented on
the MFD were apparently more difficult for the pilots to follow closely,
as indicated by the consistently higher conmmand bar displacements for
all shear profiles. The comparatively poor following of pitch steering
commands on profile #10 may account for the poor glide slope tracking
shown in Figure 26. More accurate localizer tracking was obtained with
the MFD in spite of the poor roll steering command following shown in
Figure 28b.
2. Pilot Workload and Acceptance
In the debriefing sessions following each set of data runs in
'he simulator, pilots were asked to consider how hard they worked using
the aiding concepts they had just been exposed to and to rate the work-
load relative to that required for a conventional ILS approach. A five-
point rating scale was used for this assessment and the number of pilot
ratings at each level on this scale is given in Table 18 for each aiding
concept. It was somewhat surprising to note that most of the pilots ra-
zed the aiding concepts as "Somewhat Easier" and some rated them "Much
Easier" than conventional approach management technique. Perhaps the
pilots were indicating that it would be harder to cope with the wind
hear encounters without having the aids available and were not addres-
sing the issue of having more things to do. In any event, there is lit-
tle indication that pilots would feel that the experimental techniques
would involve an increase in pilot workload.
A more objective indication of pilot workload on the flight
control task was obtained using a measure of control activity. Figure
29 presents the average magnitude of control column (pitch axis acti-
vity) and control wheel (roll axis activity) displacements over the 500
to 100-foot approach segment. No appreciable differences in control
activity were recorded for the alternative aiding concepts, though a
slightly higher level of roll axis activity is indicated for the NFD on
the severe conditions. These data also support the contention that the
use of the experimental aids, in this case the MFD, would not involve an
increase in workload.
76

S I
AIDING CONCEPT:
* GNS-3/ENR
O- -- GNS-6/AA
6O---.-o MFDT-2/ENR
.,z
-j zOw4
a..g
2
0 I5 7 4 10
(a) MEAN CONTROL COLUMN DISPLACEMENTS OVER THE 600-TO-100-ftAPPROACH SEGMENT, AVERAGED ACROSS PILOTS
2
0 I I6 7 4
Ibl MEAN CONTROL WHEEL DISPLACIMENTE OVER THE NO-TO-100-ftAPPROACH MGMENT, ACROSS PILOTS
FIGURE 29 CONTROL ACTIVITY DURING LOW LEVEL SHEAR ENCOUNTERS
77
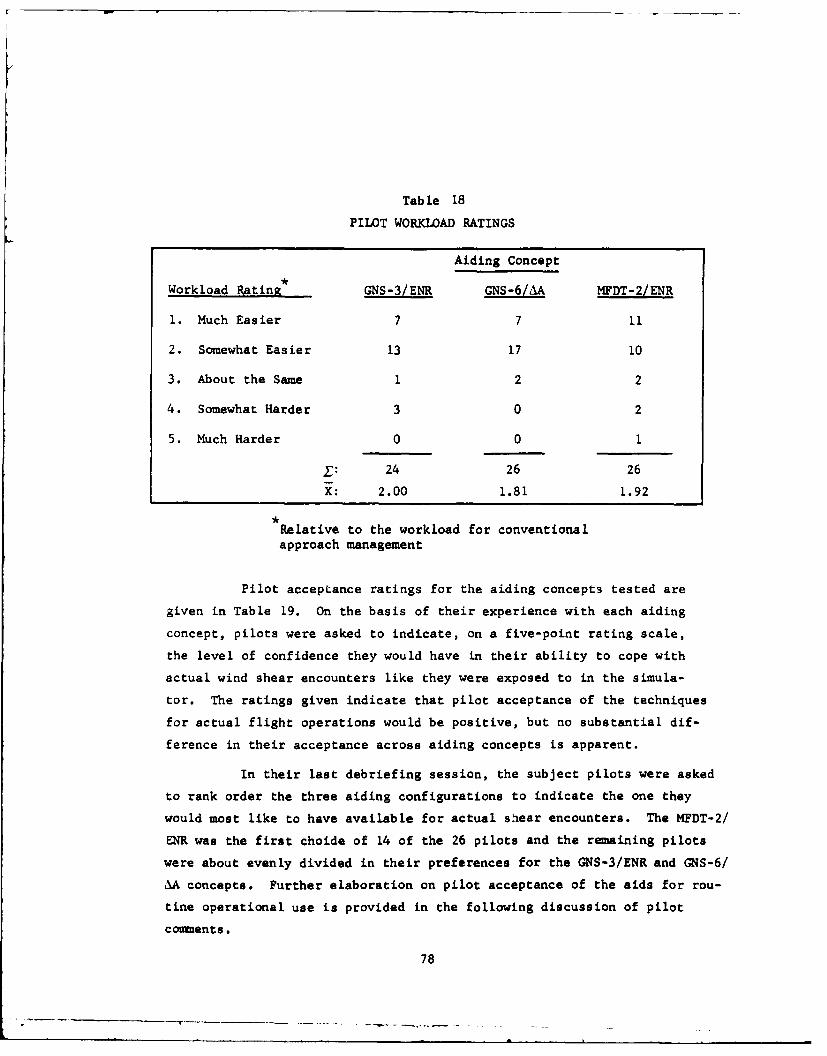
Table 18
PILOT WORKLOAD RATINGS
Aiding Concept
Workload Rating GNS-3/ENR GNS-6/AA MFDT-2/ENR
1. Much Easier 7 7 11
2. Somewhat Easier 13 17 10
3. About the Same 1 2 2
4. Somewhat Harder 3 0 2
5. Much Harder 0 0 1
1: 24 26 26
X: 2.00 1.81 1.92
Relative to the workload for conventionalapproach management
Pilot acceptance ratings for the aiding concepts tested are
given in Table 19. On the basis of their experience with each aiding
concept, pilots were asked to indicate, on a five-point rating scale,
the level of confidence they would have in their ability to cope with
actual wind shear encounters like they were exposed to in the simula-
tor. The ratings given indicate that pilot acceptance of the techniques
for actual flight operations would be positive, but no substantial dif-
ference in their acceptance across aiding concepts is apparent.
In their last debriefing session, the subject pilots were asked
to rank order the three aiding configurations to indicate the one they
would most like to have available for actual shear encounters. The MFDT-2/
ENR was the first choide of 14 of the 26 pilots and the remaining pilots
were about evenly divided in their preferences for the GNS-3/ENR and GNS-6/
NA concepts. Further elaboration on pilot acceptance of the aids for rou-
tine operational use is provided in the following discussion of pilot
comments.
78

Table 19
PILOT ACCEPTANCE RATINGS
Aiding Concept
Acceptance Rating GNS-3/ENR GNS-6/ A HFDT-2/ENR
5. Highly Confident 6 5 6
4. Confident 9 10 12
3. Somewhat Confident 8 1] 6
2. Uncertain 0 0 1
1. Not at all Confident 1 0 1
24 26 26
3.79 3.77 3.81
3. Pilot Critique of the Aiding Concepts
Subject pilot comments relating to the effectiveness and opera-
tional utility of the aiding concepts are summarized in this section.
This discussion is based on both the debriefing interviews and on the ob-
servations of project pilots who were in the simulator with the subjectpilots on all training and data runs. The pilots seemed to prefer to
treat the various components of the aiding concepts separately, rather
than as integrated aiding configurations such as the GNS-3/ENR modified
fast-slow command/energy rate combination. For consistency, then, these
components will also be treated separately in this discussion.
a. The Two-Pointer Display of Groundspeed
Most of the subject pilots like the idea of having ground-
speed displayed on the airspeed indicator using a second pointer, as they
did in earlier tests of this display concept. Some of them reported dif-
ficulties in confusing the two needles in their initial experience with
the concept but felt that this would not be a problem as they became more
familiar with the display. The pilots who liked this display said that
its most useful feature was the close association with airspeed informa-
79

tion and the direct indication this provided for assessing winds on the
approach and anticipating the potential shear.
b. The Digital Readout of Groundspeed
Eleven of the 26 pilots liked the digital readout better
than the two-pointer display, perhaps because it was simple and did not
get them involved in interpreting groundspeed/airspeed relationships.
The location of the readout above the ADI was highly acceptable and easy
to include in the pilot's scan. The project pilots observed that little
use was made of either groundspeed display during the approach, due to
the demands of the flight director and because the airspeed management
task could be accomplished by satisfying the Fast/Slow command. The
?otential difficulties in using the digital readout for maintaining a
pre-planned minimum groundspeed during the approach were thereby avoided.
The project pilots also noted that the principal use of
the groundspeed information occurred at the start of the approach. It
was used with airspeed to estimate the headwind-tailwind component at
altitude and then compared with the surface wind report to assess the
9otential shear condition. For this purpose, the digital readout was
as acceptable as the two-pointer display.
c. Modified Fast/Slow Indicator
Subject pilots were nearly unanimous in their acceptance
of this technique for airspeed management. Having the speed command
available for keeping both airspeed and groundspeed above minimums, with-
out having to include either the airspeed indicator or the digital read-
out in their scan, was considered essential by most pilots. The use of
this indicator was judged to be very effective in maintaining both speed
minimums and the pilots, generally, did not think it necessary to cross-
check the airspeed/groundspeed indicators to interpret or verify the
command information. The expanded scaling on tL|is indicator (* 20 knots
full scale) was either preferred over the conventional 1 10 knot scaling
or not considered objectionable 'y the pilots.
80

d. Modified Flight Director
The MFD was preferred over the standard flight director
by more than two-thirds of the pilots and most of the pilots felt that
they could do a better job of flight path tracking using the MFD. The
main objections to the MFD, as in earlier testing of this concept, were
that ". .it would give the passenger a very rough ride" and that it
was ". . .just a bit too quick," especially in the roll axis. Some of
the pilots felt that the gains should be reduced to some value between
those used for the standard steering commands and those driving the MFD.
Two pilots, both FAA engineering test pilots, felt that the MFD could not
be certified as it is presently mechanized and they expressed strong
doubts about line pilot acceptance of the highly demanding command fol-
lowing task.
The project pilots observed that when pilots did not fol-
low the commands closely and got behind, the steering bar excursions were
indeed too abrupt and extensive. However, in some instances, pilots
tracked the pitch commands very closely and found them to be more manage-
able. In this experiment, the sensitivity in the roll axis seemed to be
greater than in earlier testing and nearly all of the pilots found this
feature to be unacceptable.
Both project pilots felt that the modified steering com-
mends were a definite help in negotiating the shear encounters and that
the subject pilot performance using the MFD was better than on the stan-
dard director. They observed that the standard pitch steering commands
seemed heavily damped, with altitude changes up to 5 degrees producing
little or no change in the command. While these commands were compara-
tively easy to follow, glide slope tracking was characterized by large,
long term oscillations about the glide path with consequent pitch insta-
bility and large power changes required for speed management. The MPD,
if closely followed, was quick enough to avoid these large excursions
from the glide slope and resulted in better pitch stability and more pre-
cise tracking.
81
e. The Energy Rate Indicator
Fourteen of the 26 subject pilots preferred this indica-
tor over the Acceleration Margin (AA) light for the go-around advisory
and the AA indicator was the first choice for 6 of them (the other 6
wouldn't choose one over the other or felt that they were both unaccep-
table). The most common reason given for preferring the ENR display was
that this instrument provided trend information by showing needle move-
ment from the green zone toward the alert (yellow) and hazard (red) zones
of the indicator (see description in Section III). A display of this kind
could have been provided for AA, but in this experiment the only display
was a flashing light to indicate that AA had reached a critical value.
The ENR indicator was observed to be highly sensitive to
thrust changes and in most instances, pointer movements toward the ha-
zard zone could be rapidly checked or reversed simply by increasing
thrust. However, when conditions were really bad (i.e., high sink rate,
airspeed drop), additional thrust would not bring the pointer back to-
ward the green zone and a hazardous situation was clearly indicated.
By this time, the situation was also clear from other instruments and
the ENR did not add any new information.
The sensitivity of the ENR indicator to thrust changes
also produced numerous nuisance or false indications in the red zone and
pilots understandably tended to ignore this warning feature. As in the
initial tests, the tendency was to use it as a reminder that some sort
of energy deficiency was occurring and to cross-check other instruments
to determine the necessary control action. The availability of the war-
ning after these control actions were ineffective was characterized by
one of the observer pilots as ". . .like being told you'd just stepped
off a cliff, and were being advised to jump back."
f. The Acceleration Margin IndicaLor
This technique was generally accepted as providing a more
reliable basis for the go-around advisory and pilots reported that the
flashing light was an effective way to get their attention. Both pro-
ject pilots observed that there were substantially fewer false or nui-
82

sance alarms given by the AA light, as compared with the ENR indicator,
and that after some experience with this device, most of the pilots could
appreciate the predictive character of the AA alert. The most object-
ionable feature of this technique was the lack of trend information,
i.e., an indication that AA was moving forward the critical value of
insufficient thrust capability.
One of the project pilots commented that by the time the
dA light illuminated, a go-around attempt was often unsuccessful becauseacceleration capability at that time was only sufficient for maintaining
level flight with the aircraft still in the landing configuration. He
observed that reducing drag by going to the go-around flap setting did
help, but there appeared to be large increases in induced drag when the
go-around was initiated at lower than normal approach speed and speeds
often dropped quickly to the stick shaker region.
g. General Comments
Subject pilot acceptance of the DC-10 simulation and therepresentation of wind shear conditions was highly positive, as it was
in earlier studies using the Douglas facility. No sessions were missed
due to simulator down-time and pilot comments on the fidelity of the
simulation, especially the cab motion and the turbulence effects, were
quite favorable. Project pilots observed that the approach sequence may
have been initiated too close in (runs were started at a glide slope
height of 1500 feet) and that initial conditions were not always accu-
rately reflected on the instruments before the run was started (i.e.,
groundspeed below selected reference, wind component not accurately re-
flected on the two-pointer airspeed and vertical speed indicators).
The major difficulty with the test design was that the
aiding configurations were probably too complex for the subject pilots
to fully assimilate and use correctly in the time available to each pi.
lot in the simulator. The three configurations consisted of two types
of groundspeed display, two forms of flight director steering commands,
two different fast-slow commands, and two different techniques for pro-
viding go-around advisories. In many instances, the subjects were
83
saturated by the second or third session and it is unlikely that the
technical and operational features of the aiding concepts were fully
appreciated. Performance data therefore reflects the fact that pilots
were still somewhere on the low end of the learning curve and it is
likely that there was some confounding of the results for various com-
ponents of a particular aiding feature or use concept was difficult to
distinguish or assess.
4. Takeoff Outcomes
Takeoff sequences were flown against four versions of a thunder-
storm wind profile and one milder frontal shear condition. The five wind
profiles selected for the examination of takeoff performance are identi-
fied in Appendix A as profiles 11 through 15. The four thunderstorm pro-
files are characterized by a substantial headwind shearout. On three of
the four wind profiles, the headwind shearout occurs in combination with
downdrafts in excess of 10 knots. The frontal shear represents a milder
loss in the headwind component and is accompanied by a downdraft of less
than 5 knots.
Pilots were briefed to execute a normal, full-thrust takeoff
and reference speeds were based on the simulated takeoff gross weight of
407,000 lbs. Takeoff runs were included in the scheduled simulator ses-
sions on a time-available basis and data were obtained on 8 of the 26
subject pilots. Only minor variations in aircraft response to the shear
conditions were observed across pilots.
Typical aircraft responses to the shear encounters on takeoff
and climbout are shown in the strip chart recordings reproduced in Fi-
gures 30a through 30e. A plot of the longitudinal, lateral and vertical
wind components actually encountered by the aircraft is provided on chan-
nels 4, 5 and 6. The top three plots provide a corresponding time his-
tory of altitude above ground level (AGL), vertical speed, and indicated
airspeed.
These plots show that the encounter with all four versions of
the thunderstorm shear are extremely hazardous. Crashes were recorded
84

c800
200
2j 0
10
-10
-20
~140120
40
j 20
40
S 40
20
20
4 0
.9 20
'10
10
w 20
FIGURE 30 TYPICAL AIRCRAFT RESPONSE TO LOW LEVEL WIND SHEAR ON TAKEOFF
AND CLIMBOUT
85

,.I
600
o• o
LU 400
S200I-
20 i
10
0
J
LU> -10
-20
Z180
160
ow o
- UoC. 140
S120
40
U -C 20
0zz Z01. 20
LU
40 E
40.~8
20 -2z 0
40
20
~ 0
10
20
FIGURE 30 (Continued)
86

-J
LAI 0
20
10
-20
160 0ol
120
-20
120
140
40
Lm1- 20
i 0
200 U
140
20
10
20
10
w 20
FIGURE 30 (Continued)
87
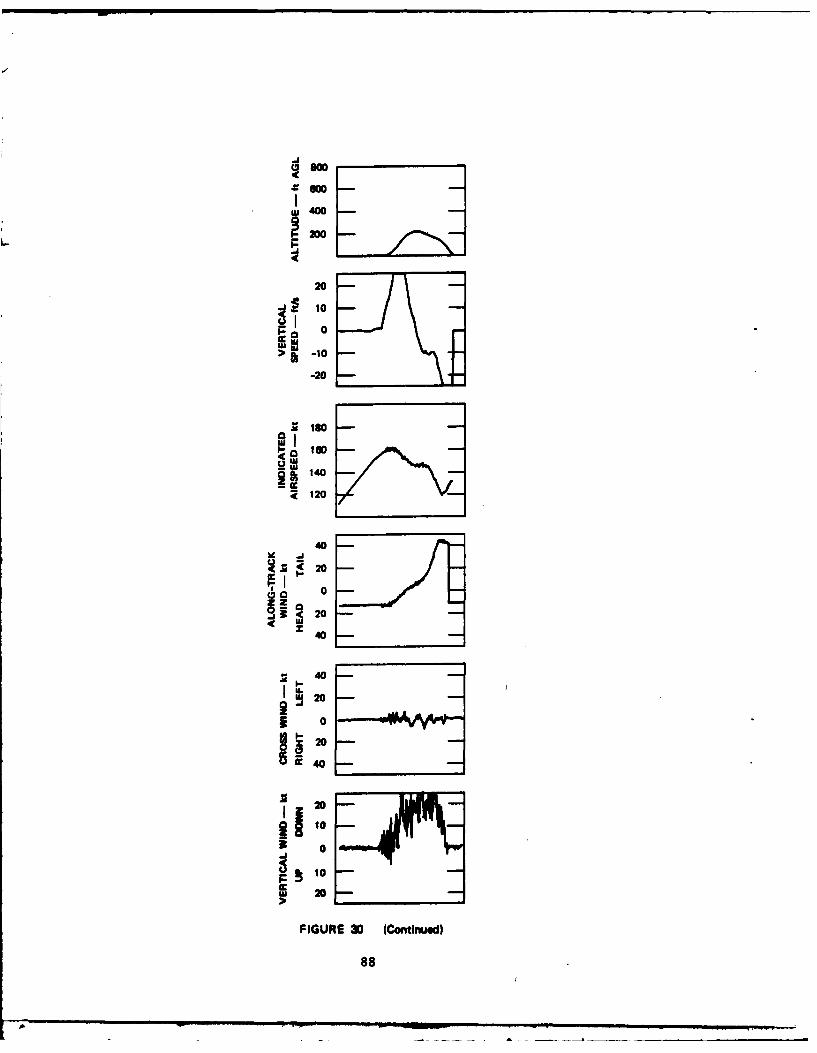
So
w400 -
1 1200 H
20
10
0
-10
-20
140
120
40
S20
20
z4 0
4 0~20
!o20
10
W 20
FIGURE 30 (Continued)
88
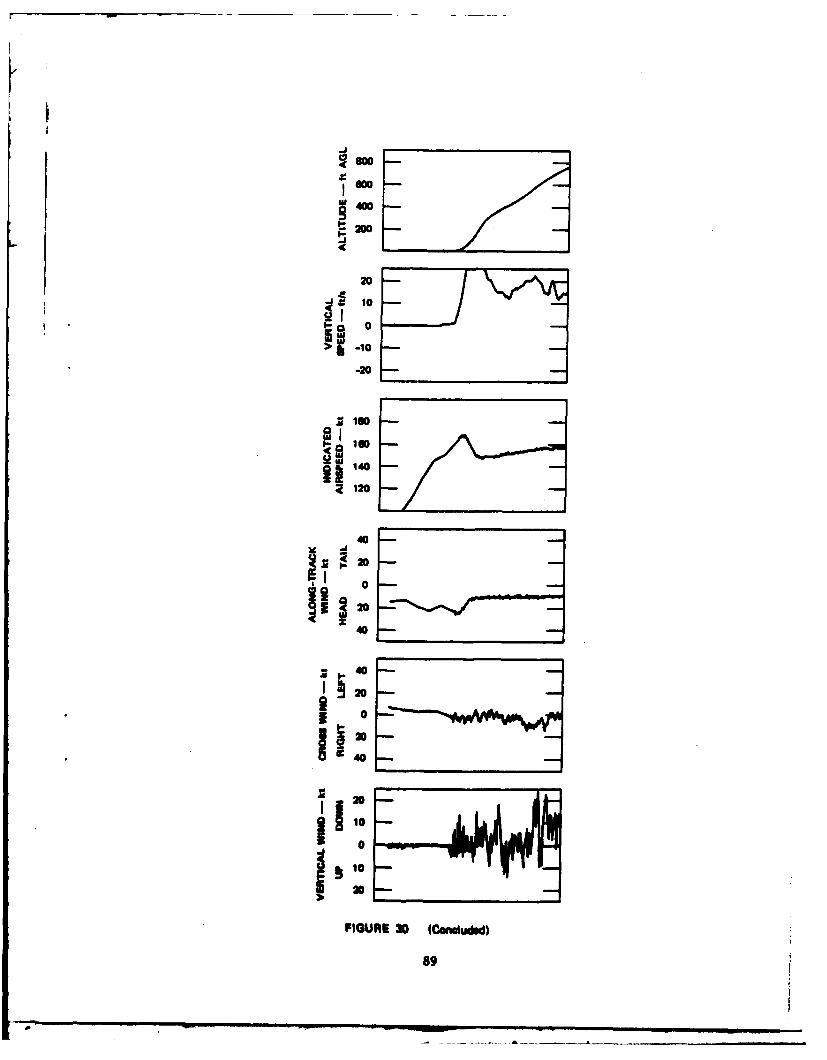
4600
20
10
P~ 0
> w 1
-20
3140
;1 120
-I40
S2o
0
20
40
40
- 40
'20
1 0
FIGURE 30 lCondudsd)
89
D 0
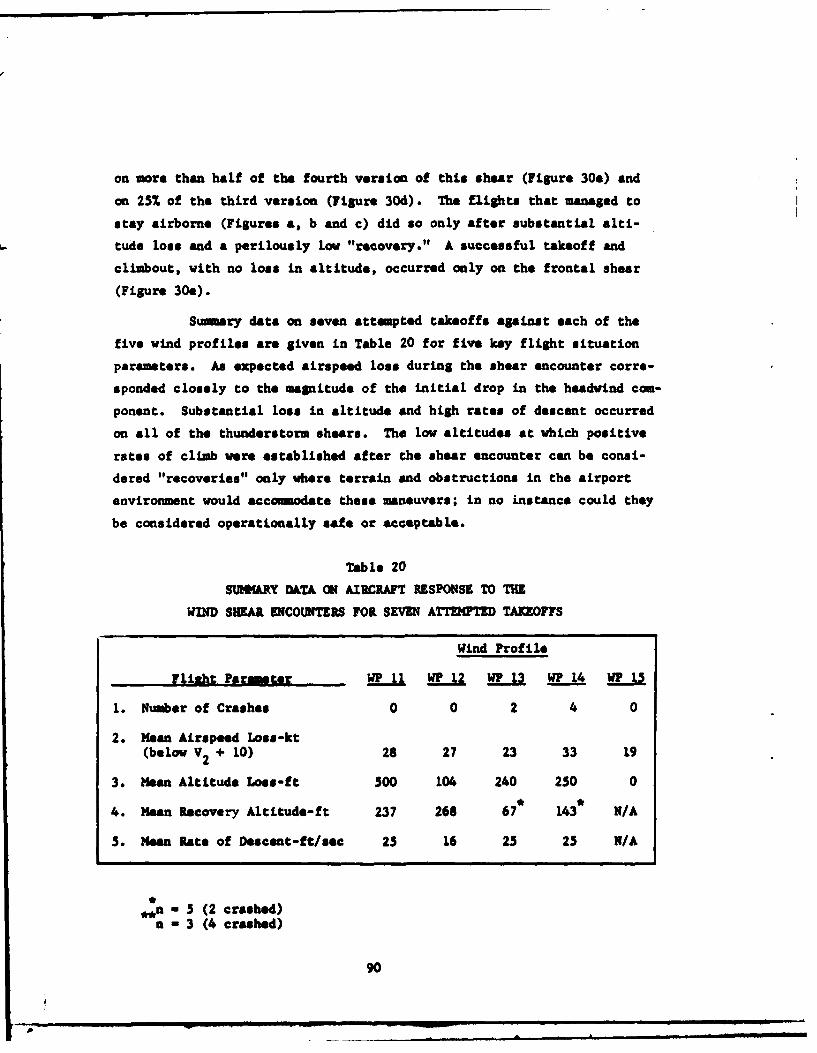
on more than half of the fourth version of this shear (Figure 30e) and
on 257. of the third version (Figure 30d). The flights that managed to
stay airborne (Figures a, b and c) did so only after substantial alti-
tude loss and a perilously low "recovery." A successful takeoff and
climbout, with no loss in altitude, occurred only on the frontal shear
(Figure 30e).
Sumary data on seven attempted takeoffs against each of the
five wind profiles are given in Table 20 for five key flight situation
parameters. As expected airspeed loss during the shear encounter corre-
sponded closely to the magnitude of the initial drop in the headvind com-
ponent. Substantial loss in altitude and high rates of descent occurred
on all of the thunderstorm shears. The low altitudes at which positive
rates of climb were established after the shear encounter can be consi-
dered "recoveries" only where terrain and obstructions in the airport
environment would accumoodate these maneuvers; in no instance could they
be considered operationally safe or acceptable.
Table 20
SUMMARY DATA ON AIRCRAFT RESPONSE TO THE
WIND SHEAR. ENCOUNTERS FOR SEVEN ATTEMPTED TAKEOFFS
Wind Profile
Flight Paramter WP 11 WP 12 W P1 P1
1. Number of Crashes 0 0 2 4 0
2. Mean Airspeed Loss-kt
(below V2 + 10) 28 27 23 33 19
3. Mean Altitude Loss-ft 500 104 240 250 0
4. Mean Recovery Altitude-ft 237 268 67 143 N/A
5. Mean Rate of Descent-ft/sec 25 16 25 25 N/A
**n - 5 (2 crashed)n - 3 (4 crashed)
90
p

V CONCLUSIONS AND RECOMMENDATIONS
L
This section presents the conclusions reached by SRI on the basis
of the data obtained in this study and outlines our recommendations re-
garding the subsequent development of the pilot aiding concepts tested.
Conclusions are stated with respect to the principal issues addressed in
the study, namely:
1) the relative merits of alternative display con-cepts and computational algorithms for the ground-speed (QNS) and modified flight director (FD)techniques;
2) the effects of augmenting these techniques withgo-around guidance based on acceleration margin(AA) and energy rate (ENR) concepts;
3) the level of operational performance and pilotacceptance to be expected when various combina-tions of GNS, 1FD, &A, and ER are available tothe pilot for coping with moderate and severeshear encounters; and
4) the hazard represented by an encounter with se-vere low-level shear during takeoff and climbout.
The conclusions are presented in a series of brief sumary state-
ments of the major findings of the study on each of these issues. For
an elaboration of these findings, the reader is referred to the more
complete representation of supporting data in preceding sections of the
report.
A. Conclusions Based on Initial Testing
1. Alternative GiS Disolay Cncents
a. On the basis of both approach and landing outcomes andpilot evaluations, the two-pointer display of groundspeed combined with
the groundspeed control algorithm incorporated in the Past/Slow indica-
tor (01S-3) can be considered the best implementation of the speed menage-
mint technique. Evaluation pilots epressed a clear preference for this
91
pv

alternative and all of them found it helpful to have the speed management
comiand integrated with the attitude director indicator (ADI).
b. Approach and landing outcomes were as good or better than
those recorded for the GQS-3 when the digital display of groundspeed was
used without the speed management feature on the Fast/Slow indicator
(GNS-5); however, pilot acceptance of this alternative was low.
c. Both approach outcome performance and pilot evaluations
were degraded when the Fast/Slow feature was used without a display of
groundspeed for cross-checking (GNS-4).
2. Alternative Thrust Coumands for the MFD
a. Approach and landing outcomes were substantially better
when groundspeed information was incorporated in the thrust comand al-
g~rithm to compensate for diminishing headwind shear (NFDT-2).
b. Pilot evaluations were the same for both versions of the
thrust command and most pilots felt that workload was excessive for both
versions.
3. Effects of Addins Go-Around Guidance
a. A substantial increase in the number of go-arounds, rela-
tive to baseline conditions (no pilot aiding), occurred when any form of
go-around advisory was provided.
b. Based on a logical analysis of approach outcomes (i.e.,
the Performance Score), the AA and ENR concepts were found to produce a
substantially greater number of safe outcomes than either the baseline or
modified baseline (First Officer callouts) procedures.
c. False or suspect advisories occurred on a third of the
approach sequences when either the AA or ENR techniques was used with
baseline approach msnagemnt techniques; false sad suspect advisories
were lowest when the INR advisories were paired with the HFDT-2 tech-
nique.
d. No clear preferences or endorsements of the AA or UMK con-
cepts were expressed by the evaluation pilots, but pilots did prefer
92
p

the scale pointer display that shoved 113 trends over the digital display
used for &A.
B. Conclusions Based on Full-Scale Testina
1. Pro.|ected Operational Performance
The most pertinent measures of performance for the Full Trial
were the approach-and-landing outcome data. Past simulation exercises
have shown that a rate of 91 percent in-limits landings can be expected
in comparable simulated conditions with no wind shear, so we take this
to be the standard of acceptance for the tests with wind shear. Over all
4 test wind profiles and counting both in-liLmts landings and successful
go-arounds, the systems (GS-3/ENR, with 91.57., and MFDT-2/EIR, with 91.17.
would have met this standard if all the system-gonerated go-around ad-visories had been honored; system GQS-6/AA was close with 86.57.. This
level was not attained because in some runs the pilots did not notice or
chose to ignore the advisory, so it represents potential performance. The
actual counts of in-limits landings and successful go-arounds were lover
than the standard, being 73.67. for GNS-3/E1N, 72.17. for GQS-6/,dA, nd 71.37.
for WD-2/ENL. The difference between potential and actual performance
emphasizes the need for an effective go-around decision aid in coping with
wind shear on approach and landing.
Appropriate responses to the shears of moderate severity were
quite different from those to high-severity shears. System HMDT-2/ENR was
best of the three on the moderate profiles, with 70.07. in-limLts landings,
8.07. go-arounds, and a potential of 92.07. success. On the high-severity
profiles system GNS-3/ER was best with 16.7% in-limits landings, 62.57
go-arounds and a potential success level of 1007.. The better success rate
on hiSh-severity shears was probably due to the go-around advisories being
more consistent with the pilot assessmnt,
The incidence of false alazus for the go-around advisories was
high. QNS-3 and GAS-6 showed better speed umanagmant (airspeed end ground-
speed), while MM)T-2 showed better lateral tracking. Workload ratinp were
about the sam. Taking all measures into consideration, there seem to be
little to choose between the three system.
93

2. Pilot Acceptance
s. Subject pilots expressed a high degree of confidence in
their potential ability to handle actual low-level shear encounters for
all three of the aiding configurations tested. As in earlier testing,
the pilots preferred the two-pointer display of groundspeed over the digi-
tal readout and most of them were critical of the excessive activity of
the HI5D steering commands.
b. The ENR concept was preferred over the AA concept for the
go-around advisory, primarily because it provided trend information on
the effects of the shear. The A information was considered to be more
useful for anticipating the need for a go-around, but most pilots vented
co see the trend developing rather than wait until the acceleration mar-
gin had reached a critical level.
c. The HFD was preferred over the standard flight director
by more than two-thirds of the pilots and most of them felt that they
could do a better job of glide slope tracking using the MFD. The incor-
poration of the groundspeed management algorithm into the Fast/Slow indi-
cator was highly regarded by all of the pilots and judged by them as very
effective in maintaining both indicated airspeed and groundspeed minimums.
3. The Takeoff Hazard
a. Low-level encounters with severe thunderstorm shears,
characterized by substantial headwind shearout and downdrafts in excess
of 10 knots, are extremely hazardous. Crashes were recorded on more than
half of the takeoffs attempted under this condition and flights that
managed to stay airborne did so only after substantial loss of altitude.
b. Successful takeoff and climbout was recorded for a frontal
shear with a 15 knot headwind shearout accompanied by a steady downdraft
component of approximately S knots.
C. kim dAionm
These tests emphasize the differences between moderate- and high-seve-
rity shears in the problem they present to the pilot. With a moderate
94

shear, a majority of pilots can land in limits when provided with effec-
tive path-tracking and speed-management aids. On high-severity shears,
such as the two test profiles (#4 like Allegheny/Philadelphia and #10
like Eastern/J. F. Kennedy) of the Full Trial, it is physically possible
to land the aircraft in limits but the most appropriate action probably
is to execute a go-around. It follows that a system for coping with low-
level shear requires both effective approach management and a useful go-
around decision aid.
It is clear that integration of the appropriate signals into the
drive commands for the normal flight-director steering bars and Fast/
Slow indicator is the most natural and effective way to aid the pilot
in approach management. Examples are the acceleration augmentation of
the steering and Fast/Slow commands of HFDT-2, and the use of ground-
speed information in all three systems of the Full Trial. Results of
the Initial Trial indicate, however, that this integration technique may
not be sufficient. There it was noted, in the groundspeed experiment,
that the pilot should have backup information to verify the aircraft
state and to provide some assurance that the Fast/Slow comand was appro-
priate.
Backup information is particularly important in support of any go-
around decision aid or advisory. This was emphasized in the Full Trial,
where the cNS-6/A system provided only a warning light to advise go-
around. While the outcome performance level was comparable to that of
the other two systems, the subject pilots expressed strong opposition to
having only the light without some information to show why the light had
turned on. It was noted that pilots in actual operations will be reluc-
tant to accept and act on a So-around advisory when the other displays
seem to indicate that the approach is within acceptable limits. When
cross-checks of the conventional instruments did confinm the go-around
warning it was often too late to execute a successful missed-approach.
Therefore, a So-around advisory or wind shear warning should not only be
issued in an on-off fashion but also should be supported by a display of
the reason for the warning and an analog display of information that will
enable the pilot to see a trend toward a hazardous state. The instruments
95
in current conventional use (e.g., the "baseline" DC-10 instrumentation)
do not supply all the information needed.
Our primary recommendation, then, is for additional study and deve-
lopment of the go-around guidance problem. Refinements to both the com-
putational algorithms for generating wind shear warnings and the display
of these alerts and supportive flight situation data are needed to enhance
their effectiveness and assure pilot acceptance and correct usage. It may
also be necessary to develop special demonstrations or confidence building
exercises so that pilots will more fully appreciate the predictive charac-
ter of the shear alerts and the need for a timely response.
The development effort leading up to these DC-10 advanced tests has
emphasized approach management, considering both acceleration augmenta-
tion and use of groundspeed information. The results of the Initial Tri-
al showed that groundspeed is particularly important; it was needed in
all systems selected for the Full Trial. The three systems differed in
their steering algorithms (baseline DC-10 or Collins acceleration augmen-
tation) and their speed comands (groundspeed error or Collins modifica-
tion with headwind shear compensation), but their performance was compar-
able. This suggests that several potential solutions to the wind shear
problem are available. Also, it would appear that further development
of precision approach management aids is not needed. The tests indicate
that all three systems, with improvement of go-around decision aids, have
the potential to provide an adequate level of performance in wind shear.
A major issue requiring further study is the need for improved gui-
dance for executing the go-around maneuver or takeoff and climbout through
the shear when the aircraft must operate as close as possible to aerodynamic
limits. Even with timely initiation of the go-around, the pilot will have
to fly through the shear and it may be necessary to fly at optimum angle-of-
attack, and close to stall speeds, in order to minimize altitude loss and
achieve a positive rate of climb. Standard flight director pitch steering
commands for the go-around mode and standard procedures for takeoff and
climbout may not produce aximum climb capability for coping with severe
low-level shear conditions.
96

APPENDIX A
Description of Wind Shear Profiles
Table A-I sumarizes the wind profiles selected for use in the DC-10
piloted simulator tests on wind shear. Each wind profile includes mean
wind and turbulence specifications. Figures A-I through A-10 show the
mean wind components, as encountered on a 3-degree glide slope, for the
approach wind profiles listed in Table A-I. The takeoff wind profile
wind components, as encountered on a 6-degree departure path, are shown
in Figures A-11 through A-15.
I. Mean Wind Specification
Each wind profile includes three wind components specified as a
function of both altitude and distance along track. Each component is
specified as a table lookup function with up to 21 altitude values and
up to 16 distance values with straight-line interpolation between points.
The altitude points are not equally spaced nor are they the same for each
wind profile, although they are the same over all distance values of a
given profile. The maximum amount of storage required for the mean wind
values is 3 x 21 x 16 - 1008 points.
2. Turbulence Specification
Turbulence parameters are included with each wind shear profile.
Six parameters (3 rme intensities and 3 scale lengths) are each speci-
fied as a function of altitude using a table lookup function with up to
21 altitude values. The maximum amount of storage required for the
turbulence associated with a wind profile in 6 x 21 = 126 points. This
brings the max'mm total storage for a wind profile with turbulence to
1008 + 126 - 1134 points.
The turbulence models used are developed from the Dryden spectra.8
Turbulence wind components are generated by feeding a random, white,
97
p ______________________

zero-mean, unit-variance Lnput into a filter F(s). Transfer functions
are as follows:
Longitudinal Fu(S) -a1 L
a 1+ vV-
a
LLateral~~ F~) v/__.1 + V53 L 'va
Lateral F (s) = w - 2
v L
+ A L+ wL V
Vertical F (s) a 0
+ V
where: vu., a - rms intensities
Lu, , L - scale lengths
V - true airspeeda
8 - Laplace transform variable.
98

ad0
-4
o - 0 ooogo 44. jA)4 1jiA 1 4
41) I wI~ 44 $£ £4 $4M.004 0 4 )0 4) 41 41 4) 4a lu ~ A~E V Va a
00 z0 0 01-4) 3: a 04
.0 .041 14 ~ 4 ) 4"44 -P4 u1u .92 41~ 41a
e tI uu0 41 9
Id,...4 04 0 9 0 04- "4o.. 0U . "4 .4 Ai
0 UOO 0 w : 4 41u 4 0a ao o
4)4 :04 o c
00 .0 o "4 mt 4)
V~d~ 01 v V 1 40P4 1 4 a0. 4 w41 A " U 4 " I
99j=Ai4A
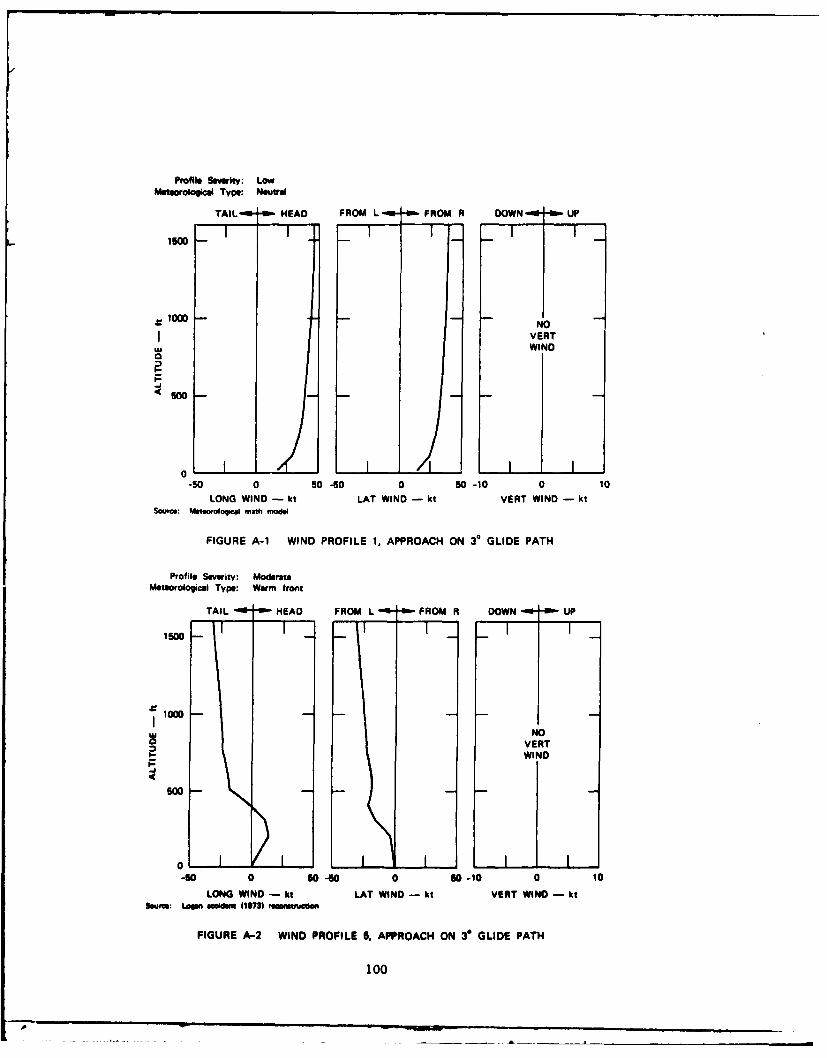
Profile S verlty: LowMeteoroloical Type: Neutral
TAIL-W- HEAD FROM L---- FROM R DOWN-wa- - UP
1000 1 0
= tO0 -- NO
VERTwWIND
500
o fi L. L W-50 0 50 -0 0 50 -10 0 10
LONG WIND - kt LAT WIND - kt VERT WIND - ktSounn: Metwologsc a math mode
FIGURE A-i WIND PROFILE 1, APPROACH ON 30 GLIDE PATH
Profile Severity: ModerateMeteorological Type: Warm front
TAIL HEAD FROM L - FROM R DOWN UP
1500 -~~
1000
VERTWIND
500
so-J-- -J-----W-" L W
0 NO
-50 0 0 -0 0 s0-10 0 10LONG WIND - kt LAT WIND - kt VERT WIND - It
Soue: Lnln acklers ) 1 ammtnae1
FIGURE A-2 WIND PROFILE 5, APPROACH ON 3° GLIDE PATH
100
- -p-

Profile Severit: MdateMsteoraloocI Type. Thundmm
TAIL - -6- HEAD FROM L FROM R DOWN UP
100
aoI-
50
o --- L W W40 0 4 -0 0 so-10 0 10
LONG WIND -It LAT WIND - kI VENT WIND - ktSour": Town, mememm
FIGURE A-3 WIND PROFILE 7. APPROACH ON 3 GLIDE PATH
Profile Ssfwity: ModitMuwobmlq*Al Type: Thndetorm
TAIL 0HEAD FROM L FROM N DOWN UP
-w 0 8040 0 rN-to 0 10LONG WINIt LATWMN- I VENT W - I
om., I ... L-e_ .u
FIGURE A-4 WIND PROFILE I APPROACH ON GLIDE PATH
101
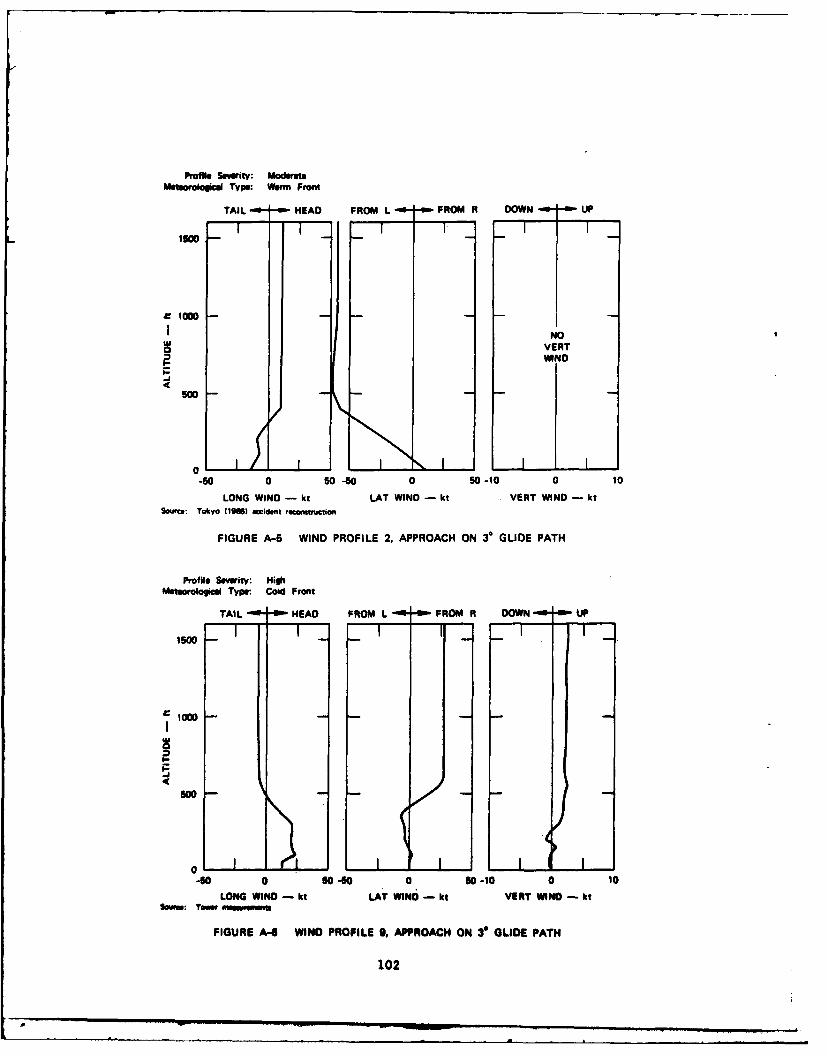
Profile Severity: ModerateMemorologicul Type: Warm Front
TAIL HEAD FROM L FROM R DOWN - .-m- UP
NOVERTWIND
.J
-50 0 so -60 0 50-10 0 10
LONG WIND --kt LAT WIND -- t. VERT WIND kt
Source: Tokyo 41985 acident recontrucion
FIGURE A-5 WIND PROFILE 2, APPROACH ON 30 GLIDE PATH
Proflle SOweit. HighMae~orokoice Type: Coid Front
TAIL ""- HEAD FROM L-OW" "- FROM R DOWN -11 -6 UP
1000
-wo 0 50-50 0 5o-10 0 10LONG WIND kt LAT WIN6I) tt VERT WIND I tt
Saw": Towswemmem
FIGURE A- WIND PROFILE 9, APPROACH ON 3e GLIDE PATH
102
• , i |
~~]
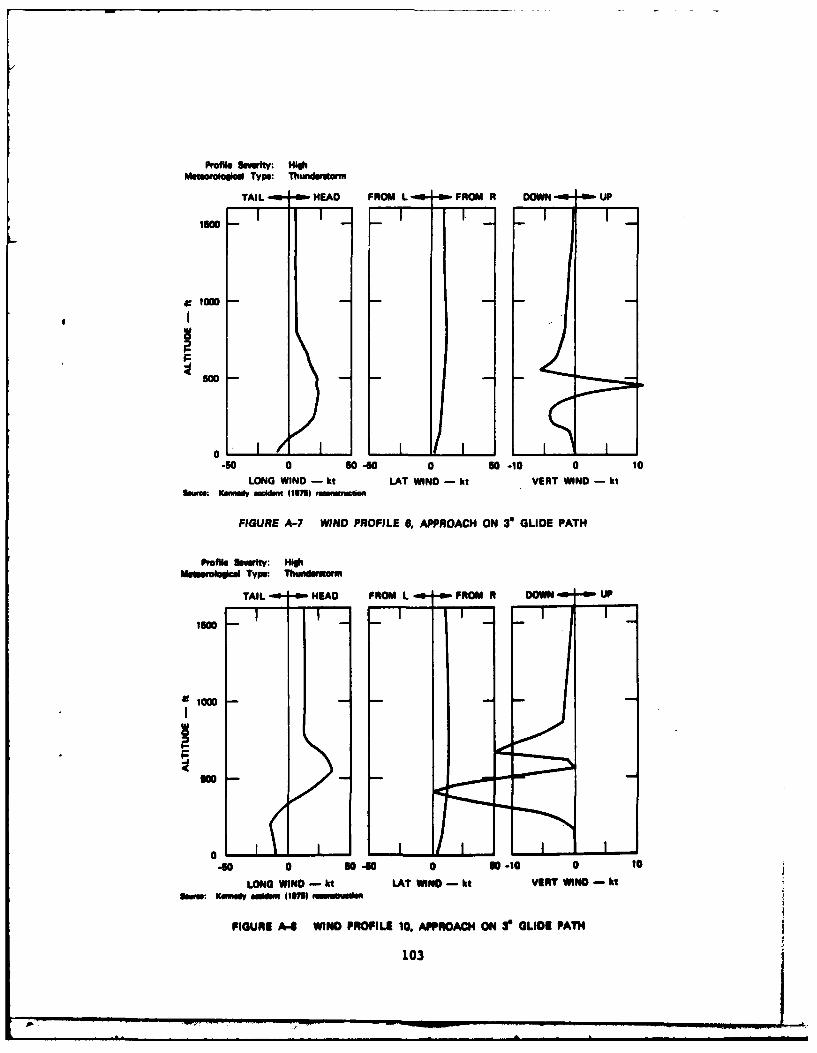
Profile Um'eft: H1iMenamlogle Type: Thwdmnomn
TAIL - -s- HEAD FROM L FROM R DOWN UP
lo -- K
000 -
0
-50 0 S-60 0 s0 -10 0 10LONG WIND - kt LAT WIND - kt VERT WIND - kt
lowca: Ke amdv lIiI ,ummlnihlia
FIGURE A-7 WIND PROFILE 8, APPROACH ON 30 GLIDE PATH
Profile Isvwfty: HighUemmloge Type: Thunidromi
TAIL HEAD FROM L FROM N DOWN UP
o
-0 0 I-60 0 N0-to 0 10
LONG WINO kt LAT WIND- It VR WINO kifIneu: Kam o lr IM) mise
FIGURE A4 WINO PROFILE 10, APPROACH ON * GLIDE PATH
103

P Tyre :
Mmer1ee Type: Thunipuim
TAIL HEAD PROM L - - FROM A DOWN --f UP
Ism -_ r - r-
NoLATI WINO
o w. W-0 0 30-40 0 30-10 0 10
LONG WIND - hI LAT WINO - kt VERT WIND - kt
3,..: ftdaemeo aUni lio3n m
FIGURE A-9 WIND PROFILE 4, APPROACH ON 3 GLIDE PATH
Profile Severity: HighMetoilooical Type: Thuemruorm
TAIL HEAD FROM N -a- FROM L DOWN UP
INO NO
LAT VERYWIND WIND
50
0 0 o - 0 0-10 0 10LONG WINO -It LAT WIND -h i VENT WIND It
berFAA ,E Iesa Imu*
FIGURE A-10 WIND PROFILE 3, APPROACH ON* GLIDE PATH
104

TAIL ow4wEAD PAOM L b PROM N DOWN up
low
0 LL4.0 0 so040 0 90-10 0 10
LONG WIND - Itt SAT WINIO - Itt VENT WINO - Itt
FIGURE A-11 WIND PROFILE 11. TAKEOFF WITH e CLIMBOUT
-mom TWO. ThAMMwm
TAIL IN- 0 PRO FU P ROM N DON UP
NO NoLA? VENT
"N Moto
-10 0 U.s0e-I@ 0
LONG WINS-k't LA? WIN-k'I VINT W11110INltIlor ftUblow *um IWN uams
FIGUR A-12 WIND PROFLE it. TAKEOF WITH r cumUouT
105

Metewolog Type: Thundpworm
TAIL 1w- HEAD FROM L FROM R DOWN -" UP
1000
w NOi -LATWIND
o-50 0 50 -50 0 50 -10 0 10
LONG WIND - kt LAT WIND -I kt VERT WIND - ktSomm-e: P"ils he smcideft (11761 remmtnwctioe
FIGURE A-13 WIND PROFILE 13, TAKEOFF WITH 60 CLIMBOUT
Meteorolopcel Type: Thunderorm
TAIL HEAD FROM L -- 0- FROM R DOWN 00-,- UP
NOLATWIND
500
o W. W .l L
-50 0 5040 0 so -to 0 10
LONG WIND - It LAT WIND - Itt VERT WIND - ItSamru: phos16de lalmm 411741 vocow we son
FIGURE A-14 WIND PROFILE 14. TAKEOFF WITH 6 CLIMBOUT
106
_ON-m, I. ,m .-.- "
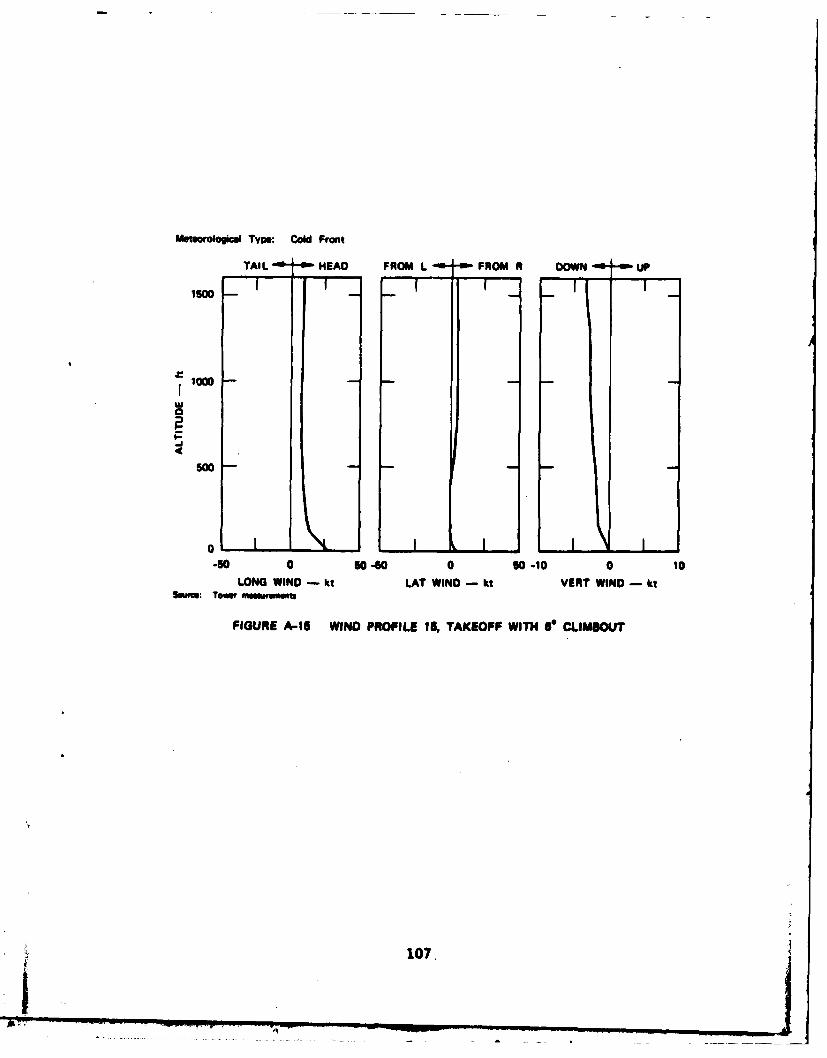
Metearologkal Type: Cold Front
TAIL - - HEAD FROM L - -m- FROM R DOWN UP
, _- _- J _ - --
1000
uJ
500
-50 0 s0-s0 0 50-10 0 10LONG WIND - kt LAT WIND It VERT WIND - It
Saum: Toww eemmuntI
FIGURE A-15 WIND PROFILE 15, TAKEOFF WITH 0 CLIMBOUT
107.
L
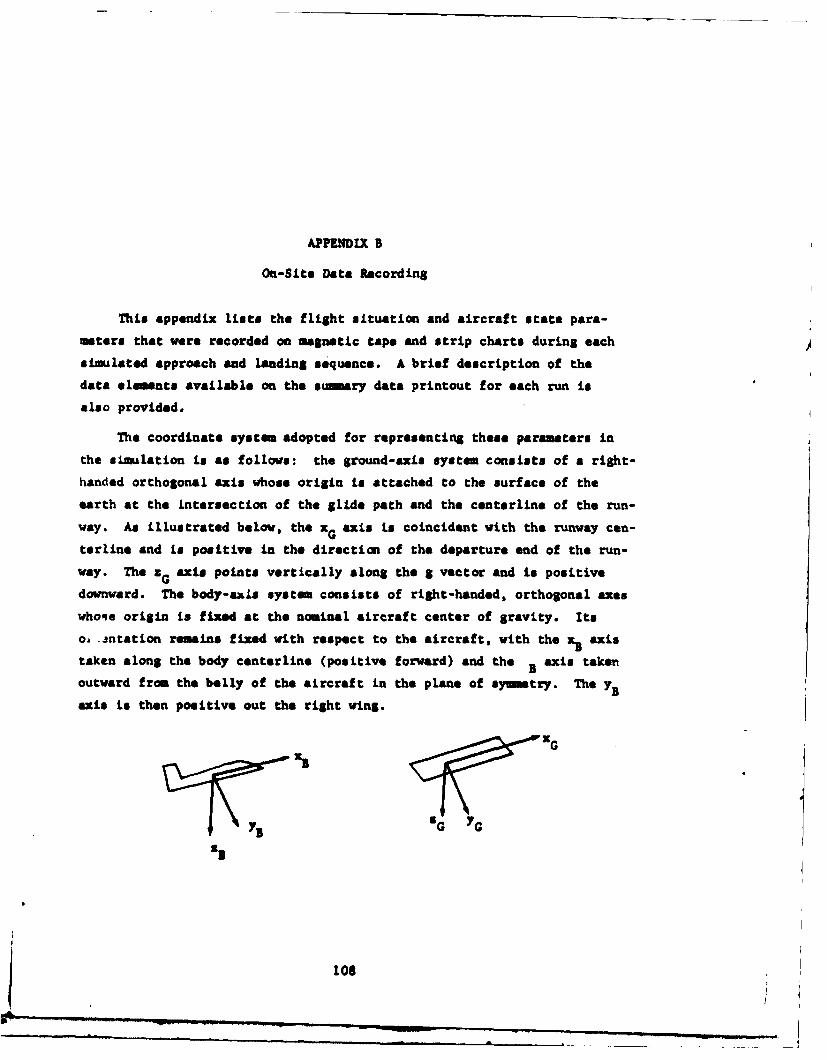
APPENDIX B
On-Site Data Recording
This appendix lists the flight situation and aircraft state para-
meters that were recorded on magnetic tape and strip charts during each
simulated approach and landing sequence. A brief description of the
data elements available on the susmary data printout for each run is
also provided.
The coordinate system adopted for representing these parameters in
the simulation is as follows: the ground-axis system consists of a right-
handed orthogonal axis whose origin is attached to the surface of the
earth at the intersection of the glide path and the centerline of the run-
way. As illustrated below, the xG axis is coincident with the runway cen-
terline and is positive in the direction of the departure end of the run-
way. The ZG axis points vertically along the g vector and is positive
downward. The body-axis system consists of right-handed, orthogonal axes
whoqe origin is fixed at the nominal aircraft center of gravity. Its
oa 3ntation remains fixed with respect to the aircraft, with the xB axis
taken along the body centerline (positive forward) and the B axis taken
outward from the belly of the aircraft in the plane of symmtry. The YB
axis is then positive out the right wing.
xG
108!_

1. Data Recorded on Maxnetic Tape
The digitally logged data were recorded on 9-track 800 BPI digital
magnetic tape. The characteristics of the sampling process were as fol-
los:
a.) Sampling rate was 5 Hz.
b.) Each parameter was represented as a scaled 16-bit 2's
complement number. In the event of an overflow the
number will be clipped at either 215 - 1 (positive)
or 215 (negative).
c.) A frame consisted of the 40 parameters listed in Table
B-1.
Table B-1
FLIGHT SITUATION PARAMETERS RECORDED ON MAGNETIC TAPE
EngineeringNumber Symbol Description Units
1 t Time code, elapsed time from initiation .050 secof run
2 X Position coordinates as measured to the ft3 Y aircraft center of gravity, ground-axis ft4 Z referenced ft
5 V Heading angle referenced to the runway dega heading (positive right of runway head-
inS on approach)
6 e Pitch angle (positive nose up) deg
7 a Angle of attack (pitch angle minus air deg
referenced flight path angle)
8 Roll angle (positive right wing down) deg
9 Ground reference velocities, the rate ft/sec10 of change of x, y and x components ft/sec11 2 ft/sec
12 A Longitudinal acceleration along the ft/sec 2
x x-body axis at the center of gravity(positive forvard)
13 A Normal acceleration parallel to the ft/sec2n z-body axis at the center of gravity
109
AL ,

Table B- I
FLIGHT SITUATION PARAMETERS RECORDED ON MAGNETIC TAPE (con't)
Engineering
Number Symbol Description Units
14 p Pitch rate, angular velocity about deg/secy-body axis (positive nose up)
15 q Roll rate, angular velocity about deg/secx-body axis (positive right wing down)
16 r Yaw rate, angular velocity about deg/secz-body (positive nose right)
17 W Wind velocity, ground-axis referenced knots18 Wx x, y and x components knots19 Wy knotsU
20 lAS Indicated airspeed as displayed knots
21 GNS Groundspeed after computation as knotsdisplayed
22 PSB Pitch and bank steering bars and speed bar widths23 BSB command as displayed on the pilot's bar widths24 SC ADI knots
25 LOC Localizer and glide slope deviation as dots26 GS displayed dots
27 ENR Energy rate as displayed to be defined
28 not used
29 N1 Engine RPM N1 of the center engine %
30 "A Acceleration margin ft/sec
31 6TH Position of the center engine throttle deglever
32 F Flap position deg
33 VAPp Approach airspeed knots
34 6e Elevator position deg
35 ih Stabilizer angle deg
36 ar Rudder deflection deg
37 a Aileron deflection deg
38 Aw Control wheel position deg
39 6€ Control colmn position deg
40 This 16-bit word was reserved for thefollowing binary events a
110

Bit No. Description
0 (MSB) Spare1-5 Spare6 Spare7 Stall warning8 Outer marker9 Middle marker10 Inner marker11 Trim up12 Trim down13 Landing gear down14 Main gear touchdown15 Go-around initiation, true,
when pilot or first officerbutton pushed
2. Strip Chart Recordin&
Sixteen channels of analog data are required. The recorded para-
meters are listed in Table B-2.
Table B-2
FLIGHT SITUATION PARAMETERS RECORDED ON STRIP CHARTS
Parameter Symbol Unit Range
1. Range R nm -0.5 to 4.5
2. Vertical height H ft 0 to 1000
3. Localizer deviation LOC dots + 2.5(positive right of path)
4. Glide slope deviation GS dots ± 2.5(positive above glide path)
5. Vertical speed ft/s + 25.0
6. Indicated airspeed IAS kt 50 to 250
7. Groundspeed GNS kt 50 to 250
8. RM (center engine) N1 10 to 110
9. Vertical height (same as 2 above, repeated on stripchart 2)
10. Along-track wind component W kt + 50x
11. Cross-track wind component W kt + 50Y12. Vertical wind component Wz kt + 50
111
-i
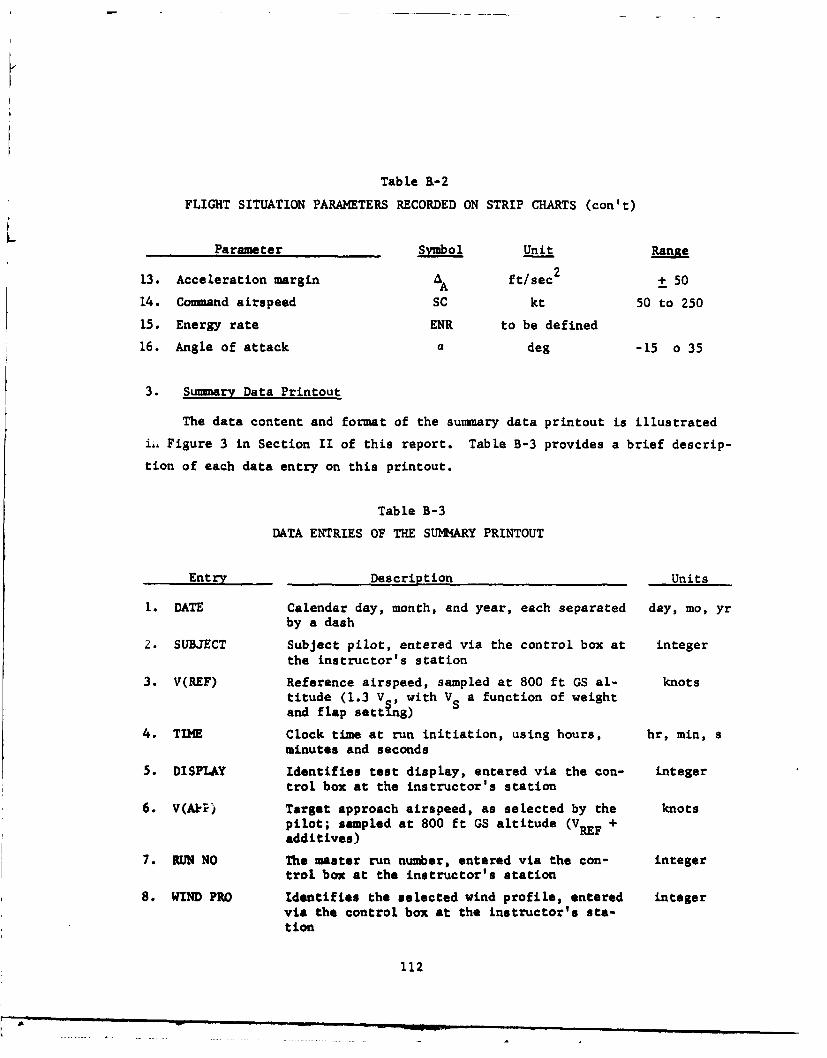
Tab le R-2
FLIGHT SITUATION PARAMETERS RECORDED ON STRIP CHARTS (con't)
Parameter Symbol Unit Range
13. Acceleration margin A ft/sec 2 + 50
14. Command airspeed SC kt 50 to 250
15. Energy rate ENR to be defined
16. Angle of attack a deg -15 o 35
3. Summary Data Printout
The data content and format of the summary data printout is illustrated
ii. Figure 3 in Section II of this report. Table B-3 provides a brief descrip-
tion of each data entry on this printout.
Table B-3
DATA ENTRIES OF THE SUMMARY PRINTOUT
Entry Description Units
1. DATE Calendar day, month, and year, each separated day, mo, yr
by a dash
2. SUBJECT Subject pilot, entered via the control box at integerthe instructor's station
3. V(REF) Reference airspeed, sampled at 800 ft GS al- knotstitude (1.3 V,, with VS a function of weightand flap setting)
4. TIME Clock time at run initiation, using hours, hr, min, sminutes and seconds
5. DISPLAY Identifies test display, entered via the con- integertrol box at the instructor's station
6. V(Aki) Target approach airspeed, as selected by the knots
pilot; sampled at 800 ft GS altitude (VREF +additives)
7. RUN NO The master run number, entered via the con- integertrol box at the instructor's station
8. WIND PRO Identifies the selected wind profile, entered integervia the control box at the instructor's sta-tion
112
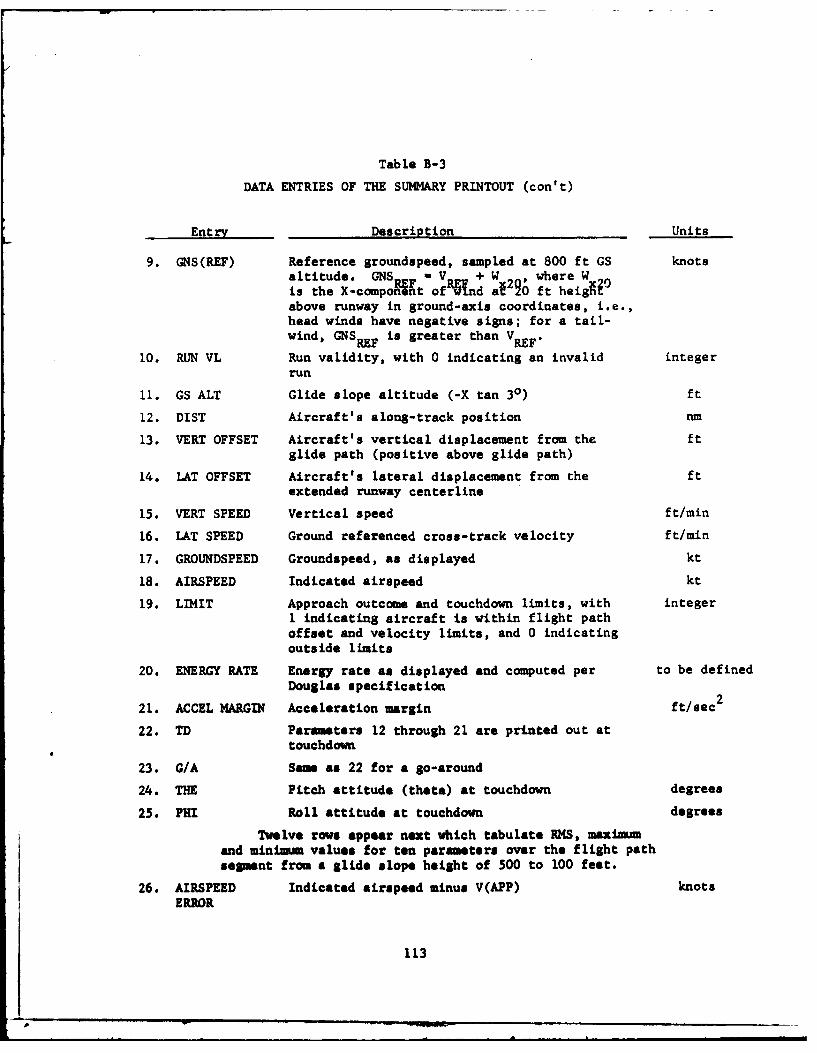
Table B-3
DATA ENTRIES OF THE SUMMARY PRINTOUT (con't)
Entry Description Units
9. GNS(REF) Reference groundspeed, sampled at 800 ft GS knotsaltitude. GNS a V + W 2 ^ , where Wis the X-compo nt of Rnd A ft heliabove runway in ground-axis coordinates, i.e.,head winds have negative signs; for a tail-wind, GNSREF is greater than VREF.
10. RUN VL Run validity, with 0 indicating an invalid integer
run
11. GS ALT Glide slope altitude (-X tan 30) ft
12. DIST Aircraft's along-track position nm
13. VERT OFFSET Aircraft's vertical displacement from the ftglide path (positive above glide path)
14. LAT OFFSET Aircraft's lateral displacement from the ftextended runway centerline
15. VERT SPEED Vertical speed ft/min
16. LAT SPEED Ground referenced cross-track velocity ft/mmn
17. GROUNDSPEED Groundspeed, as displayed kt
18. AIRSPEED Indicated airspeed kt
19. LIMIT Approach outcome and touchdown limits, with integerI indicating aircraft is within flight pathoffset and velocity limits, and 0 indicatingoutside limits
20. ENERGY RATE Energy rate as displayed and computed per to be definedDouglas specification
21. ACCEL MARGIN Acceleration margin ft/sec 2
22. TD Parameters 12 through 21 are printed out attouchdown
23. G/A Same as 22 for a go-around
24. THE Pitch attitude (theta) at touchdown degrees
25. PHI Roll attitude at touchdown degrees
Twelve rows appear next which tabulate RMS, maximmand minimum values for ten parameters over the flight pathsegment from a glide slope height of 500 to 100 feet.
26. AIRSPEED Indicated airspeed minus V(APP) knotsERROR
113
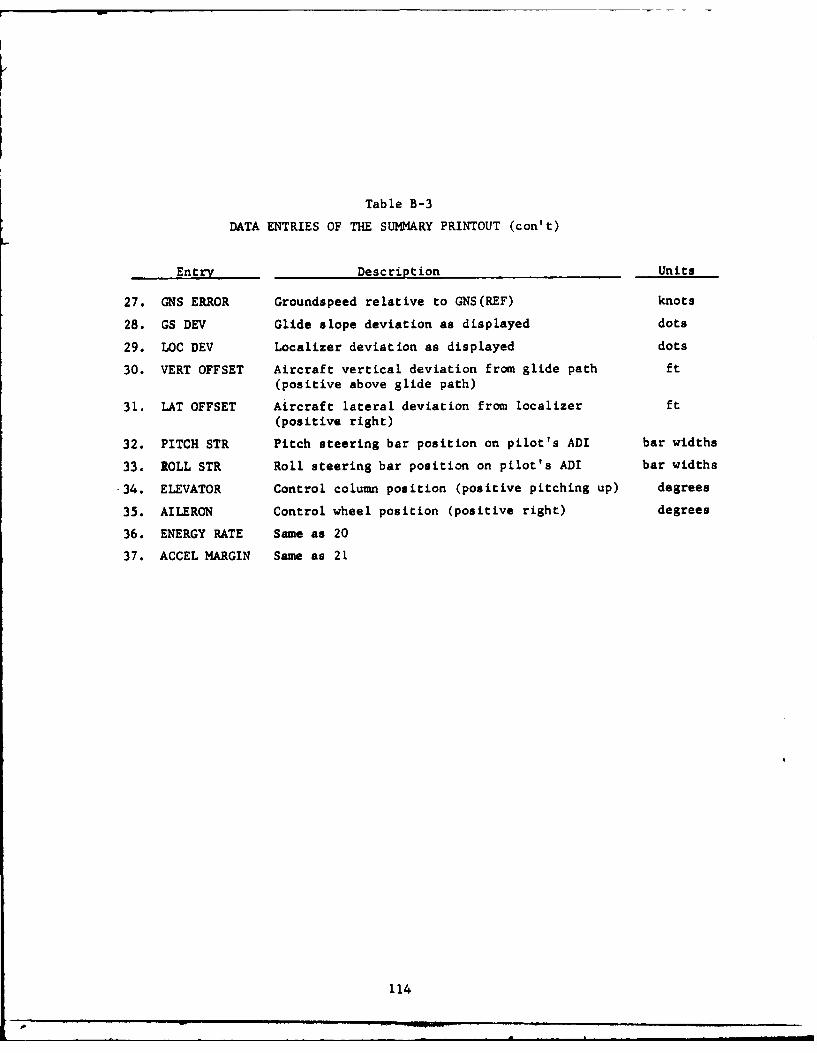
Table B-3
DATA ENTRIES OF THE SUMMARY PRINTOUT (con't)
Entry Description Units
27. GNS ERROR Groundspeed relative to GNS(REF) knots
28. GS DEV Glide slope deviation as displayed dots
29. LOC DEV Localizer deviation as displayed dots
30. VERT OFFSET Aircraft vertical deviation from glide path ft(positive above glide path)
31. LAT OFFSET Aircraft lateral deviation from localizer ft(positive right)
32. PITCH STR Pitch steering bar position on pilot's ADI bar widths
33. ROLL STR Roll steering bar position on pilot's ADI bar widths
34. ELEVATOR Control column position (positive pitching up) degrees
35. AILERON Control wheel position (positive right) degrees
36. ENERGY RATE Same as 20
37. ACCEL MARGIN Same as 21
114
p .-- J _ Il
REFERENCES
I. W. B. Gartner and A. C. McTee, "Piloted Flight Simulator Study ofLow-level Wind Shear, Phase 1," Report No. FAA-RD-77-166 by SRIInternational for U.S. DOT Federal Aviation Administration (May1977).
2. W. B. Gartner, et al, "Piloted Flight Simulator Study of Low-levelWind Shear, Phase 2," Report No. FAA-RD-77-157 by SRI Internationalfor U.S. DOT Federal Aviation Administration (March 1977).
115