Embed Size (px)
Citation preview

Leuven STATistics STATe of the Art Training Initiative2014-2015
DOC_BRO_LSTAT_2014-2015_DOC_BRO_LSTAT_2014-2015 28/08/14 08:45 Pagina 1

Course timetable 2014-2015
DATE TITLE PRESENTERS LEVEL AND MORE LANGUAGE ON PAGE
September 2014 29, 30 September, Flames: Essential Tools for R Goele Bossaert Basic (English) 51, 2 October 2014
October 2014 6, 7, 8 October 2014 Fundamentele statistische Marlies Lacante Basis (Nederlands) 6methoden
14 October 2014 Fundamentele statistische Martine Beullens Basis (Nederlands) 8methoden, toegepast met SAS Eguide
14 October 2014 Fundamentele statistische Marlies Lacante Basis (Nederlands) 8methoden, toegepast met SPSS
14 October 2014 Fundamental Statistical Resarch Anna Ivanova Basic (English) 9Methods, applications with R
13, 14 and 30, 31 Optimization and Numerical Francis Tuerlinckx Advanced (English) 7October 2013 Methods in Statistics Geert Molenberghs
Katrijn Van DeunTom Wilderjans
22, 23, 24 October 2014 Models for Longitudinal Geert Molenberghs, Advanced (English) 1017, 18, 19 November 2014 and Incomplete data Geert Verbeke
November 2014 3, 4 November 2014 Advanced programming in R Jan Wijfels Intermediate (English) 12
3, 4 November 2014 Regression and Analysis Anna Ivanova Basic (English) 13of Variance Marlies Lacante
14 November 2014 Regressie- en variantieanalyse, An Carbonez Basis (Nederlands) 14toegepast met SPSS
14 November 2014 Regressie- en variantieanalyse, Martine Beullens Basis (Nederlands) 14toegepast met SAS Eguide
13, 18 November 2014 Regression and Analysis of Anna Ivanova Basic (English) 15Variance, applications with R
24, 25 November 2014 Uitbreiding bij Regressie- An Carbonez Verdiepend (Nederlands) 16en variantieanalyse Marlies Lacante
27, 28 November 2014 Statistical Machine Jan Wijfels Advanced (English) 17Learning with R
December 2014 10 December 2014 Niet-parametrische statistiek Marlies Lacante Basis (Nederlands) 18
February 2015 10, 17, 24 February Experimental Design Peter Goos Intermediate (English) 193, 10, 17, 31 March and 28 April 2015
11, 25 February, Chemometrics Wouter Saeys Advanced (English) 204, 11, 18 March 2015
March 2015 10, 11, 12 March 2015 Cluster analysis, principal Anne Marie De Meyer Intermediate (English) 21component analysis and An Carbonez exploratory factor analysis Martine Buellenswith SAS, SPSS and R
17, 18, 19 March 2015 Fundamental statistical methods Marlies Lacante Basic (English) 22
19, 20 March 2015 Introduction to the analysis An Carbonez Basic (English) 23of contingency tables
10, 31 March, 28 April Concepts of multilevel, Geert Verbeke Advanced (English) 24and 5, 12 May 2015 longitudinal and mixed models
23, 24 March 2015 Introduction to correspondence Anne-Marie De Meyer Intermediate (English) 25analysis and multiple correspondence analysis with SAS, SPSS and R
April 2015 23 April 2015 Weblecture on Sampling Theory Geert Molenberghs Intermediate (English) 26
28, 29 April 2015 Logistic Regression Models Anne Marie De Meyer Intermediate (English) 27with SAS
28, 30 April 2015 Logistic Regression Models Anne Marie De Meyer Intermediate (English) 27with SPSS
data to be announced Nonparametic Smoothing to be announced Advanced (English) 28in 2015 Techniques and Applications
May 2015 6, 7 May 2015 Poisson regression with SAS Anne-Marie De Meyer Intermediate (English) 29
6, 8 May 2015 Poisson regression with SPSS Anne-Marie De Meyer Intermediate (English) 29
6, 7, 8 May 2015 Inleiding tot enquêtering Marlies Lacante Basis (Nederlands) 30Kristel Hoydonckx
8, 9, 11, 12 June 2015 Flames: Essential Tools for R Goele Bossart Basic (English) 5
DOC_BRO_LSTAT_2014-2015_DOC_BRO_LSTAT_2014-2015 28/08/14 08:45 Pagina 2

1
Preface
I take pleasure and pride in welcoming you to the Leuven STATistics STATe of the Art Training Initiative, a scientific
and educational project of the Leuven Statistics Research Centre (LStat), offering a range of short courses.
Statistics in Leuven is varied and broad based. Statisticians are active throughout the university, in mathematics, computer
science, economy, psychology, education, bio-engineering, engineering, biology, chemistry, medicine, pharmacy, iphysical
education, psychology, social science, linguistics, etc. Many colleagues combine an excellent international scientific
reputation with highly effective teaching skills. At the same time, statistical consulting for internal and external clients
is a wholesome component of LStat’s mission.
It is therefore not surprising that the short course programme has been highly successful and in great demand.
Celebrating this success, we are shifting into higher gear and the time-honoured programme of short courses is
gradually being expanded with further highly relevant topics, many located at the heart of our faculty’s expertise.
Due to increasing demand, some courses are offered more than once per academic year.
A selected set of courses is offered in an open educational concept, in the sense that, for example, also contingents
of students of our highly successful MSc in Statistics partake in them. This ensures stimulating interaction.
Courses take place in one of the university’s campuses, dotted around the beautiful college town of Leuven.
Should your company or institute be looking for a tailor-made training initiative, perhaps on-site, then we will be
delighted to explore options and work towards an individualized proposal.
Professor Marlies Lacante
2013-2015 chair of Lstat
Leuven Statistics Research Centre
Celestijnenlaan 200 B bus 5307
3001 HEVERLEE
+ 32 16 32 22 14
www.lstat.kuleuven.be
DOC_BRO_LSTAT_2014-2015_DOC_BRO_LSTAT_2014-2015 28/08/14 08:45 Pagina 1

22
Presenters
Martine Beullensgraduated in Mathematics at KU Leuven. From 1990onwards she has been working at KU Leuven and theFederal Police on projects commissioned by the Belgiangovernment on the development and statistical exploitationof federal databanks containing judicial or police information.Currently she is working at KU Leuven at the Teachingand Learning Vision and Quality department in the Datamanagement section.
Goele Bossaertis FLAMES coordinator of the KU Leuven. She obtainedher Phd degree in Educational Sciences in 2012 and aMaster degree in Statistics the following year. She organizes,together with the other FLAMES coordinators at the fourother Flemish universities, the inter-universitary and localFLAMES events @ KU Leuven.
An Carbonezis professor aan het Leuven Statistics Research Centre(LStat) van de KU Leuven. Ze behaalde haar doctoraatwiskunde aan de KU Leuven in 1992. Ze is coördinatorvan het MSc in Statistics programma van de KU Leuven.Ze is ook betrokken bij statistische consulting projectenen het geven van statistische opleidingen binnen bedrijven.
Anne-Marie De Meyeris Professor at the KU Leuven in the Faculty of Science,Department of Mathematics. She received her PHD inMathematics (Applied Probability) in 1979 and is currentlyteaching statistics in the MSc in Statistics and in theBachelor of Criminology. Since more than 25 years shehas been involved in the short course program for avariety of courses in applied statistics and is also active inthe statistical consulting of LStat.
Peter Goosis a full professor at the Department of Biosystems of theFaculty of Bioscience Engineering of the University of Leuvenand the Department of Environment, Technology andTechnology Management of the Faculty of Applied Economicsof the University of Antwerp. He has been a guest professorat the Econometric Institute of the Erasmus School ofEconomics (Erasmus University of Rotterdam), the Facultyof Business and Economics of the University of Leuven,the Antwerp Management School and the InternationalSchool of Management in Saint-Petersburg. Peter Gooshas received the Shewell Award and the Lloyd S. NelsonAward of the American Society for Quality, the Ziegel Awardand the Statistics in Chemistry Award of the AmericanStatistical Association, and the Young Statistician Awardof the European Network for Business and IndustrialStatistics. In 2013, Peter Goos was ranked 7th in the top40 of economists in the Netherlands.
Kristel Hoydonckxis werkzaam aan de afdeling “Faciliteiten voor onderzoek”van de KU Leuven en staat daar ondermeer in voor deenquêteservice.
DOC_BRO_LSTAT_2014-2015_DOC_BRO_LSTAT_2014-2015 28/08/14 08:45 Pagina 2
3
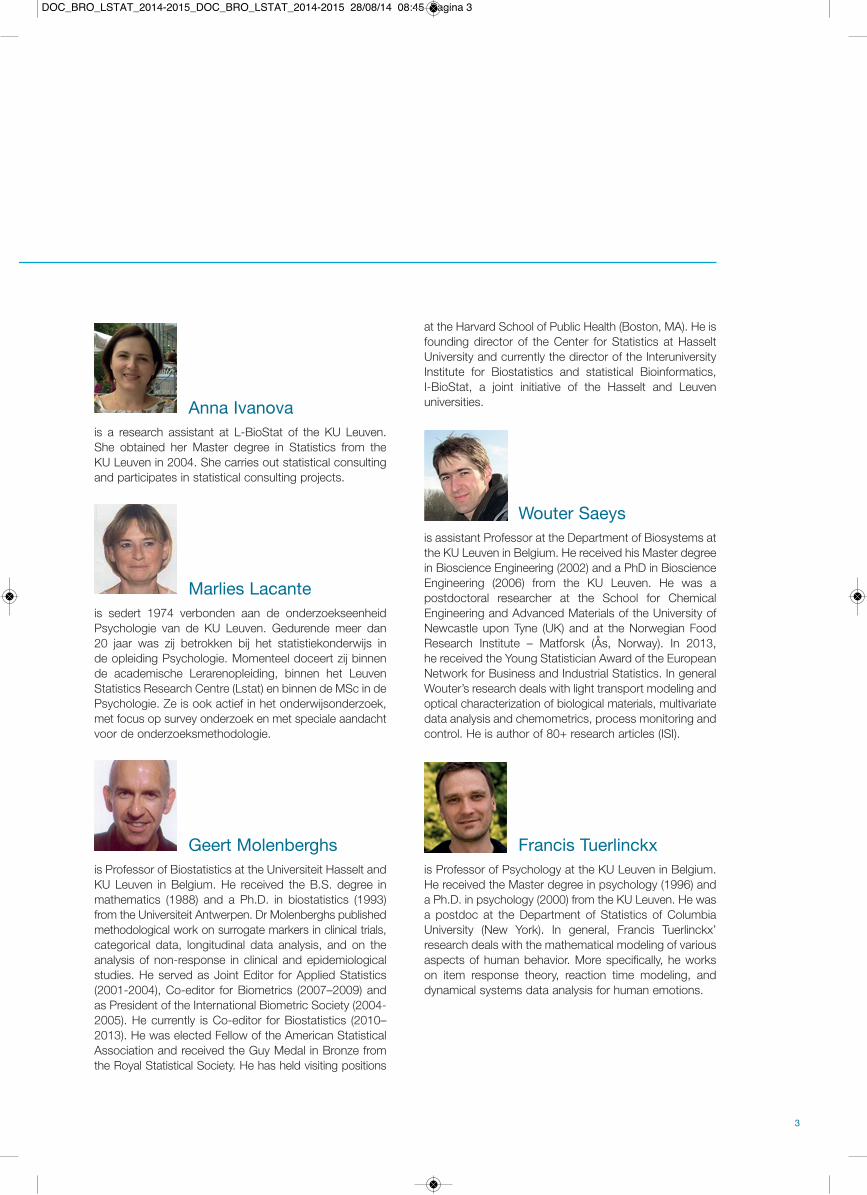
Anna Ivanovais a research assistant at L-BioStat of the KU Leuven.She obtained her Master degree in Statistics from the KU Leuven in 2004. She carries out statistical consultingand participates in statistical consulting projects.
Marlies Lacante is sedert 1974 verbonden aan de onderzoekseenheidPsychologie van de KU Leuven. Gedurende meer dan 20 jaar was zij betrokken bij het statistiekonderwijs in de opleiding Psychologie. Momenteel doceert zij binnende academische Lerarenopleiding, binnen het LeuvenStatistics Research Centre (Lstat) en binnen de MSc in dePsychologie. Ze is ook actief in het onderwijs onderzoek,met focus op survey onderzoek en met speciale aandachtvoor de onderzoeksmethodologie.
Geert Molenberghs is Professor of Biostatistics at the Universiteit Hasselt andKU Leuven in Belgium. He received the B.S. degree inmathematics (1988) and a Ph.D. in biostatistics (1993)from the Universiteit Antwerpen. Dr Molenberghs publishedmethodological work on surrogate markers in clinical trials,categorical data, longitudinal data analysis, and on theanalysis of non-response in clinical and epidemiologicalstudies. He served as Joint Editor for Applied Statistics(2001-2004), Co-editor for Biometrics (2007–2009) andas President of the International Biometric Society (2004-2005). He currently is Co-editor for Biostatistics (2010–2013). He was elected Fellow of the American StatisticalAssociation and received the Guy Medal in Bronze fromthe Royal Statistical Society. He has held visiting positions
at the Harvard School of Public Health (Boston, MA). He isfounding director of the Center for Statistics at HasseltUniversity and currently the director of the Inter universityInstitute for Biostatistics and statistical Bioinformatics, I-BioStat, a joint initiative of the Hasselt and Leuvenuniversities.
Wouter Saeysis assistant Professor at the Department of Biosystems atthe KU Leuven in Belgium. He received his Master degreein Bioscience Engineering (2002) and a PhD in BioscienceEngineering (2006) from the KU Leuven. He was apostdoctoral researcher at the School for ChemicalEngineering and Advanced Materials of the University ofNewcastle upon Tyne (UK) and at the Norwegian FoodResearch Institute – Matforsk (Ås, Norway). In 2013, he received the Young Statistician Award of the EuropeanNetwork for Business and Industrial Statistics. In generalWouter’s research deals with light transport modeling andoptical characterization of biological materials, multivariatedata analysis and chemometrics, process monitoring andcontrol. He is author of 80+ research articles (ISI).
Francis Tuerlinckxis Professor of Psychology at the KU Leuven in Belgium.He received the Master degree in psychology (1996) anda Ph.D. in psychology (2000) from the KU Leuven. He wasa postdoc at the Department of Statistics of ColumbiaUniversity (New York). In general, Francis Tuerlinckx’research deals with the mathematical modeling of variousaspects of human behavior. More specifically, he workson item response theory, reaction time modeling, anddynamical systems data analysis for human emotions.
DOC_BRO_LSTAT_2014-2015_DOC_BRO_LSTAT_2014-2015 28/08/14 08:45 Pagina 3

4
Katrijn Van Deun is assistant professor in Methodology and Statistics atTilburg University and a research fellow of the KU Leuven.She obtained a Master in psychology, a Master’s degreein statistics and a PhD in psychology. Her main area ofexpertise is scaling, clustering and component analysistechniques, which she applies in the fields of psychology,chemometrics and bioinformatics. She has various publi -cations in both methodological and substantive journalsin psychometrics, chemometrics and bio informatics.Katrijn is secretary of the Dutch/Flemish Classification society.
Geert Verbeke is Professor in Biostatistics at KU Leuven and UniversiteitHasselt. He received the B.S. degree in mathematics (1989)from the KU Leuven, the M.S. in biostatistics (1992) fromUniversiteit Hasselt, and earned a Ph.D. in biostatistics(1995) from the KU Leuven. Geert Verbeke has publishedextensively on longitudinal data analyses. He has heldvisiting positions at the Gerontology Research Center andthe Johns Hopkins University (Baltimore, MD). Geert Verbekeis Past President of the Belgian Region of the Inter nationalBiometric Society, International Program Chair for theInternational Biometric Conference in Montreal (2006),Board Member of the American Statistical Association.He is past Joint Editor of the Journal of the Royal StatisticalSociety, Series A (2005–2008) and currently editor ofBiometrics (2010– 2013). He is the director of the LeuvenCenter for Bio statistics and statistical Bioinformatics (L-BioStat), and vice-director of the InteruniversityInstitute for Biostatistics and statistical Bioinformatics (I-BioStat), a joint initiative of the Hasselt and Leuvenuniversities in Belgium.
Jan Wijffels is the founder of www.bnosac.be - a consultancy companyspecialised in statistical analysis and data mining. He holdsa Master in Commercial Engineering, a MSc in Statisticsand a Master in Artificial Intelligence and has been usingR for 10 years, developing and deploying R-basedsolutions for clients in the private sector. He has developedand co-developed the R packages ffbase, ETLUtils, RMOAand RMyrrix.
Tom Wilderjans is a post-doctoral researcher at the Fund for ScientificResearch (FWO-Flanders). He obtained a Master’s degree(2005) and a PhD (2009) in Mathematical Psychologyfrom the KU Leuven. Tom’s research deals with multi -variate data analysis (component analysis, clustering, andcombinations thereof) and model selection.
Presenters
DOC_BRO_LSTAT_2014-2015_DOC_BRO_LSTAT_2014-2015 28/08/14 08:45 Pagina 4

5
Flames: Essential tools for R
Course outlineThis course gives an introduction to the use of the statisticalsoftware language R. R is a language for data analysis andgraphics. This introduction course to R is aimed at beginners.The course covers data handling, graphics, mathematicalfunctions and some statistical techniques. R is for free and formore information you can visit the site http://cran.r-project.org/
Target audienceEverybody who is interested in using the R programminglanguage. You will learn how to write and manage your R scripts.
PrerequisitesThere are no prerequisites.
PresenterGoele Bossaert
Tourse Material A .pdf file with the course material will be made available.
Dates 29, 30 September and 1, 2 October 2014 from 9.00 hrto 12.00 hr or8, 9, 11, 12 June 2015 from 9.00 hr to 12.00 hr
LanguageEnglish
Flames Price• PhDs and postdocs of a Flemish University: free• Other academics: € 120• Non profit/social sector € 200• Private sector € 400
FLAMESFlanders Training Network for Methodology and Statistics(FLAMES) is an inter-university training network rooted inthe five Flemish universities: Free University of Brussels,Ghent University, Hasselt University, University of Antwerp,and KU Leuven.
This network aims to support doctoral students and youngempirical researchers in their pursuit of best-in-class trainingin methodology and statistics. FLAMES seeks to optimize,intensify, and extend the methodological and statisticaltraining currently offered by Flemish universities and bringexisting training to new audiences. It also develops newtraining modules for complex and advanced statistical methods taught by experts, a series of seminars on qualitativemethods, organizes a yearly summer school, and deliversspecialized workshops.
The FLAMES initiative originated in 2013 with the financialsupport of the Pact 2020 ('Vlaanderen in Actie', translated:Flanders in action) and the Flemish Minister of InnovationIngrid Lieten.
DOC_BRO_LSTAT_2014-2015_DOC_BRO_LSTAT_2014-2015 28/08/14 08:45 Pagina 5

Fundamentele statistische methoden
BeschrijvingDeze basiscursus statistiek richt zich op het kiezen vangeschikte statistische methoden en het trekken van decorrecte conclusies uit de verkregen resultaten. Wiskundigegrondslagen van de gebruikte methoden komen in dezecursus slechts beknopt ter sprake. De nadruk ligt op toe-passing in de praktijk. Men krijgt inzicht in het adequaatgebruik van basis-statistieken: centrummaten, spreidings-maten, tabellen, box-plots, enz. Daarnaast worden betrouwbaarheidsintervallen opgesteld en krijgt men degrondslagen van toetsen van hypothesen.
Inhoud van de cursus:• Beschrijvende grootheden: grafische en numerische
samenvatting van de data• Verdelingen: Binomiale, Poisson, Normale, T-verdeling• Steekproefverdeling van het gemiddelde• Betrouwbaarheidsintervallen• Hypothese testen omtrent een gemiddelde (één en
twee steekproeven)• Gepaarde t-test• Schatten en testen van proporties
DoelgroepIedereen die een opfrissing van fundamentele statistischetechnieken wenst.
VoorkennisEr wordt geen voorkennis ondersteld.
LesgeverProf. Marlies Lacante
CursusmateriaalCursusmateriaal wordt als .pdf file ter beschikking gesteld.
Datum 6, 7, 8 oktober 2014 telkens van 9 u. tot 12 u.
TaalNederlands
Prijs• Personeel en studenten KU Leuven en Associatie
KU Leuven: zie: https://icts.kuleuven.be/cursus/• PhD studenten, niet KU Leuven € 120• Non profit/sociale sector € 187,50• Private sector € 450
6
DOC_BRO_LSTAT_2014-2015_DOC_BRO_LSTAT_2014-2015 28/08/14 08:45 Pagina 6

7
Optimization & Numerical Methods in Statistics
Course outlineNumerical problems are frequently encountered by statis-ticians. Prominently, the estimation of the parameters of astatistical model requires the solution of an optimizationproblem. In a few simple cases, closed-form solutions existbut for many probability models the optimal parameter estimates have to be determined by means of an iterativealgorithm. The goal of this course is threefold. First, we wantto offer the readers an overview of some frequently usedoptimization algorithms in (applied) statistics. Second, we wantto provide a framework for understanding the connectionsamong several optimization algorithms as well as betweenoptimization and aspects of statistical inference. Third, although very common, optimization is not the only numericalproblem and therefore some important related topics suchas numerical differentiation and integration will be covered.
Target audienceThe intended target audience includes PhD students andresearchers in a variety of fields, including biostatistics,psychometrics, educational measurement, public health,sociology. We aim at readers who apply and possibly developstatistical models and who wish to learn more about thebasic concepts of numerical techniques, with an emphasison optimization problems, and their use in statistics.
Prerequisites Participants should have a basic knowledge of the principlesof statistical inference. This includes some familiarity withthe concept of a likelihood function and likelihood-basedinference for linear, binomial, multinomial, and logistic regression models. Readers should also have a basic understanding of matrix algebra. A working knowledge ofthe basic elements of univariate calculus is also a prere-quisite, including (the concepts of continuity of a function,derivative and integration).
PresentersFrancis Tuerlinckx, Geert Molenberghs, Katrijn Van Deun,Tom Wilderjans
Course MaterialsA .pdf file with the course material will be made available.
Background reading:• Everitt, B.S. (1987). Introduction to Optimization Methods
and Their Application in Statistics. London: Chapman& Hall.
• Lange, K. (1999). Numerical Analysis for Statisticians.New York: Springer.
• Lange, K. (2004). Optimization. New York: Springer.
Dates 13 - 14 and 30 - 31 October 2014: 9.00 hr - 12.30 hr; 13.30 hr - 17.00 hr
LanguageEnglish
Price• Staff and students KU Leuven and Association
KU Leuven: go to: https://icts.kuleuven.be/cursus/• PhD students, non KU Leuven € 320• Non profit/social sector € 500• Private sector € 1200
DOC_BRO_LSTAT_2014-2015_DOC_BRO_LSTAT_2014-2015 28/08/14 08:45 Pagina 7

8
CURSUS 1: FUNDAMENTELE STATISTISCHE METHODEN, TOEGEPAST MET SPSS
BeschrijvingDit is een inleidende cursus tot het gebruik van SPSS. Aan de hand van cases wordt geïllustreerd hoe men metSPSS tot exploratie van gegevens komt. Hierbij wordt denodige aandacht besteed aan het interpreteren van deverkregen output. Hypothesetesten voor onafhankelijke engepaarde groepen worden uitgevoerd en besproken. Er istijd om zelf te werken met deze software.
DoelgroepIedereen die gegevens wenst te exploreren met SPSS.
VoorkennisDe technieken die aangeleerd werden bij FundamenteleStatistische Methoden.
Lesgever Prof. Marlies Lacante
CursusmateriaalCursusmateriaal wordt als .pdf file ter beschikking gesteld.
Datum 14 oktober 2014, 9 u. - 12 u. en 13 u. - 16 u.
Taal Nederlands
CURSUS 2: FUNDAMENTELE STATISTISCHE METHODEN, TOEGEPASTMET SAS EGUIDE
BeschrijvingDit is een inleidende cursus tot het gebruik van SAS Enterprise Guide. Aan de hand van cases wordt geïllustreerdhoe men met de SAS Eguide tot exploratie van gegevenskomt. Hierbij wordt de nodige aandacht besteed aan hetinterpreteren van de verkregen output. Hypothese testenvoor onafhankelijke en gepaarde groepen worden uitgevoerden besproken. Er is tijd om zelf te werken met deze software.
DoelgroepIedereen die gegevens wenst te exploreren met SASEguide.
VoorkennisDe technieken die aangeleerd werden bij FundamenteleStatistische Methoden.
Lesgever Martine Beullens
CursusmateriaalCursusmateriaal wordt als .pdf file ter beschikking gesteld.
Datum 14 oktober 2014, 9 u. - 12 u. en 13 u. - 16 u.
Taal Nederlands
Fundamentele statistische methoden, t
DOC_BRO_LSTAT_2014-2015_DOC_BRO_LSTAT_2014-2015 28/08/14 08:45 Pagina 8

9
COURSE 3: FUNDAMENTAL STATISTICAL METHODS, APPLICATIONS WITH R
Course outline By using cases, one explores data by using R. Attentionis paid to the interpretation of the output. Topics as exploringdata, construction of confidence intervals and hypothesistesting is covered. This is a hands-on session.
Target audienceEverybody who wants to explore data by using R
PrerequisitesFundamental Statistical Methods (distributions, confidenceintervals, hypothesis testing) and Introduction to R.
Presenter Anna Ivanova
Course MaterialsA .pdf file with the course material will be made available.
Date 14 October 2014, 9.00 hr - 12.00 hr and 13.00 hr - 16.00 hr.
Language English
PRICE COURSE 1, 2 or 3:
• Staff and students KU Leuven and Association KU Leuven: go to: https://icts.kuleuven.be/cursus/
• PhD students, non KU Leuven € 80• Non profit/social sector € 125• Private sector € 300
n, toegepast met SAS Eguide, SPSS en R
DOC_BRO_LSTAT_2014-2015_DOC_BRO_LSTAT_2014-2015 28/08/14 08:45 Pagina 9

10
Models for Longitudinal and Incomplete D
Course outlineWe first present linear mixed models for continuoushierarchical data. The focus lies on the modeler’sperspective and on applications. Emphasis will be onmodel formulation, parameter estimation, and hypothesistesting, as well as on the distinction between the random-effects (hierarchical) model and the implied marginalmodel. Apart from classical model building strategies,many of which have been implemented in standardstatistical software, a number of flexible extensions andadditional tools for model diagnosis will be indicated.Second, models for non-Gaussian data will be discussed,with a strong emphasis on generalized estimatingequations (GEE) and the generalized linear mixed model(GLMM). To usefully introduce this theme, a brief review ofthe classical generalized linear modeling framework will bepresented. Similarities and differences with the continuouscase will be discussed. The differences between marginalmodels, such as GEE, and random-effects models, suchas the GLMM, will be explained in detail. Third, it isoftentimes necessary to consider fully non-linear modelsfor longitudinal data. We will discuss such situations, andplace some emphasis on the non-linear mixed-effectsmodel. Fourth, non-linear mixed models will be discussed.Applications in the PK/PD world will be brought to thefront. Fifth, when analyzing hierarchical and longitudinaldata, one is often confronted with missing observations,i.e., scheduled measurements have not been made, dueto a variety of (known or unknown) reasons. It will beshown that, if no appropriate measures are taken, missingdata can cause seriously jeopardize results, and inter -pretation difficulties are bound to occur. Methods toproperly analyze incomplete data, under flexibleassumptions, are presented. Key concepts of sensitivityanalysis are introduced. All developments will be illustratedwith worked examples using the SAS System. However,the course is conceived such that it will be of benefit toboth SAS users and users of other platforms.
Target audienceThe targeted audience includes methodological and appliedstatisticians and researchers in industry, public health organi -zations, contract research organizations, and academia.Important: The course will also serve for the MSc in Statisticsstudents.
Prerequisites Throughout the course, it will be assumed that theparticipants are familiar with basic statistical modelingconcepts, including linear models (regression and analysisof variance), as well as generalized linear models (logisticand Poisson regression) and basic knowledge of mixedand multilevel models. Moreover, pre-requisite knowledgeshould also include general estimation and testing theory(maximum likelihood, likelihood ratio). When registering forthis course, you have to mention the topics you havefollowed before and/or indicate where you becameacquainted with the requested material.
PresentersGeert Verbeke and Geert Molenberghs
Course MaterialsA .pdf file with the course material will be made available.
Background reading:• Verbeke, G. and Molenberghs, G. (2000) Linear Mixed
Models for Longitudinal Data. New York: Springer.• Molenberghs, G. and Kenward, M.G. (2007) Missing
Data in Clinical Studies. Chichester: John Wiley & Sons.• Molenberghs, G. and Verbeke, G. (2005) Models for
Repeated Discrete Data. New York: Springer.
CONCEPTS, MODELS AND HANDS-ON APPLICATION WITH THE OPTION TO ANALYSE ONE’S OWN DATA
DOC_BRO_LSTAT_2014-2015_DOC_BRO_LSTAT_2014-2015 28/08/14 08:45 Pagina 10

11
e Data
DatesOctober 22, 2014: 9.00 hr - 12.00 hrOctober 23, 2014: 9.00 hr - 12.30 hr; 13.30 hr - 17.00 hrOctober 24, 2014: 9.00 hr - 12.30 hr; 13.30 hr - 17.00 hr
November 17, 2014: 9.00 hr - 12.30 hr; 13.30 hr - 17.00 hrNovember 18, 2014: 9.00 hr - 12.30 hr; 13.30 hr - 17.00 hrNovember 19, 2014: 9.00 hr - 12.00 hr
LanguageEnglish
Price• Staff and students KU Leuven and Association
KU Leuven: go to: https://icts.kuleuven.be/cursus/• PhD students, non KU Leuven € 400• Non profit/social sector € 625• Private sector € 1500
DOC_BRO_LSTAT_2014-2015_DOC_BRO_LSTAT_2014-2015 28/08/14 08:45 Pagina 11

12
Advanced R programming topics
Course outlineR is the lingua franca of statistical research and dataanalysis. But in order to get you up and running with R,and to get over the steep learning curve, you need toknow how to use it efficiently.
This course is a hands-on course covering the basic toolkityou need to have in order to use R efficiently for dataanalysis tasks.
It is an intermediate course aimed at users who have theknowledge from the course ‘Essential tools for R’ and whowant to go further to improve and speed up their dataanalysis tasks.
The following topics will be covered in detail• The apply family of functions and basic parallel
programming for these, vectorisation, regular expressions,string manipulation functions and commonly usedfunctions from the base package. Useful other packagesfor data manipulation.
• Making a basic reproducible report using Sweave andknitr including tables, graphs and literate programming
• If you want to build your own R package to distributeyour work, you need to understand S3 and S4 methods,you need the basics of how generics work as well as Renvironments, what are namespaces and how are theyuseful. This will be covered to help you start up andbuild an R package.
• Basic tips on how to organise and develop R code andtest it.
Target audiencePeople who have had their initial use of R and want to goone step further.
This covers people using R for a few months already toseveral years. And more specifically users who want toextend their data manipulation techniques to speed uptheir day-to-day data analysis tasks.
Researchers from the university interested in makingreproducible research reports or users who want to use Ras a report generating tool.
R users interested in getting the fundamentals you needto know before you can create your own R package.
Business users who want to learn how to get the maximumout of R by speeding up their code, learn vectorisation,execute the basics of parallel programming and want tolearn how to build methods and code which is reproduciblein production environments.
PrerequisitesInitial experience in R ranging from a few weeks to severalyears.
Course materialsA .pdf file with the course material will be made available.
PresenterJan Wijffels
Date3 and 4 November 2014, 9.00 hr - 12.00 hr and 13.00 hr - 16.00 hr
LanguageEnglish
Price• Staff and students KU Leuven and Association
KU Leuven: go to: https://icts.kuleuven.be/cursus/• PhD students, non KU Leuven € 160• Non profit/social sector € 250• Private sector € 600
DOC_BRO_LSTAT_2014-2015_DOC_BRO_LSTAT_2014-2015 28/08/14 08:45 Pagina 12

13
Regression and Analysis of variance
Course outlineLinear statistical models are widely used today in manyapplications. Successfully applying these techniques requirea good understanding of the underlying theory and thepractical problems that you may encounter in real-lifesituations.
DAY 1: REGRESSION ANALYSIS• Correlation • Simple linear regresssion
Ordinary least squares: estimating parameters, confidenceintervals and tests, diagnostics, prediction.
• Multiple regression Ordinary least squares: estimating parameters, confidenceintervals and tests, diagnostics, prediction.Variable selection techniques.
DAY 2: ANALYSIS OF VARIANCE• One-way Anova
Comparing meansThe Anova model: estimating parameters, hypothesistests, Anova tabel, F testMultiple comparisons, Contrasts
• Two-way AnovaThe two-way Anova ModelMain effects, interaction effectsMultiple comparisons
Target audienceThis course is important for persons involved withmodeling data.
PrerequisitesParticipants are familiar with basic statistical modelingconcepts (see topics described in Fundamental StatisticalMethods).
Course materialsA .pdf file with the course material will be made available.
PresenterAnna Ivanova, Marlies Lacante
DateNovember 3, 4 2014: 9.00 hr - 12.00 hr; 13.00 hr -16.00 hr
LanguageEnglish
Price• Staff and students KU Leuven and Association
KU Leuven: go to: https://icts.kuleuven.be/cursus/• PhD students, non KU Leuven € 160• Non profit/social sector € 250• Private sector € 600
DOC_BRO_LSTAT_2014-2015_DOC_BRO_LSTAT_2014-2015 28/08/14 08:45 Pagina 13

14
Regressie- en variantieanalyse, toeg e
CURSUS 1: REGRESSIE- EN VARIANTIEANALYSE, TOEGEPAST MET SPSS
BeschrijvingDe technieken die aangeleerd werden bij Regressie- envariantieanalyse, worden hier toegepast met SPSS. Aande hand van cases wordt geïllustreerd hoe men met SPSStot het modelleren van gegevens komt. Hierbij wordt denodige aandacht besteed aan het interpreteren van deverkregen output. Er is voldoende tijd om zelf te werkenmet deze software.
DoelgroepIedereen die gegevens wenst te modelleren via SPSS.
VoorkennisWe veronderstellen een basiskennis van SPSS. Cursistendienen eveneens vertrouwd te zijn met de methodiekaangebracht in Regressie- en variantieanalyse.
Lesgever An Carbonez
CursusmateriaalCursusmateriaal wordt als .pdf file ter beschikking gesteld.
Datum 14 november 2014 van 9 u. - 12 u. en 13 u. - 16 u.
Taal Nederlands
CURSUS 2: REGRESSIE- EN VARIANTIEANALYSE, TOEGEPAST MET SAS EGUIDE
BeschrijvingDe technieken die aangeleerd werden bij Regressie- envariantieanalyse, worden hier toegepast met SAS Eguide.Aan de hand van cases wordt geïllustreerd hoe men metde SAS Eguide tot het modelleren van gegevens komt.Hierbij wordt de nodige aandacht besteed aan het inter-preteren van de verkregen output. Er is voldoende tijd omzelf te werken met deze software.
DoelgroepIedereen die gegevens wenst te modelleren via SAS Eguide.
VoorkennisWe veronderstellen een basiskennis van SAS Eguide. Cursisten dienen eveneens vertrouwd te zijn met de methodiek aangebracht in Regressie en variantie analyse.
Lesgever Martine Beullens
CursusmateriaalCursusmateriaal wordt als .pdf file ter beschikking gesteld.
Datum 14 november 2014, 9 u. - 12 u. en 13 u. - 16 u.
Taal Nederlands
DOC_BRO_LSTAT_2014-2015_DOC_BRO_LSTAT_2014-2015 28/08/14 08:45 Pagina 14

15
g epast met SPSS, SAS Eguide en R
COURSE 3: REGRESSION AND ANALYSIS OF VARIANCE: APPLICATIONS WITH R
Course outline The linear models, provided by the course ‘Regression andAnalysis of Variance’, are applied on examples. In this course,the R package is used. By means of cases, we illustratehow to model your data in R and how to interpret the corresponding output. There is a hands-on session to trainyou with the functionality of R.
Target audienceEverybody who wants to model data with R.
PrerequisitesEverybody should be familiar with the techniques coveredin ‘Regression and Analysis of Variance’ and have a basicknowledge of working with R.
Presenter Anna Ivanova
Course MaterialsA .pdf file with the course material will be made available.
Date 13 November 2014, 9.00 hr - 12.00 hr and 13.00 hr - 16.00 hr. and 18 November from 9 hr - 12 hr.
Language English
PRICE FOR COURSE 1 AND 2 PRICE FOR COURSE 3
• Staff and students KU Leuven and Association KU Leuven: go to: https://icts.kuleuven.be/cursus/
• PhD students, non KU Leuven € 80• Non profit/social sector € 125• Private sector € 300
• Staff and students KU Leuven and Association KU Leuven: go to: https://icts.kuleuven.be/cursus/
• PhD students, non KU Leuven € 120• Non profit/social sector € 187,50• Private sector € 450
DOC_BRO_LSTAT_2014-2015_DOC_BRO_LSTAT_2014-2015 28/08/14 08:45 Pagina 15

16
Uitbreiding bij Regressie- en variantieanalyse
BeschrijvingDe resultaten van een lineaire regressieanalyse zijn sterkbeïnvloedbaar door speciale datapunten. Het detecterenvan uitschieters en invloedrijke waarnemingen wordt indeze cursus bestudeerd. Daarnaast wordt geïllustreerdhoe men via robuuste regressie dit probleem kanopvangen. De praktijk leert ook dat de resultaten van eenlineaire regressie ook sterk beïnvloed worden doorassociaties tussen verklarende variabelen. Dit probleemvan multi collineariteit wordt besproken en geïllustreerd.Verder is er een uitbreiding van variantieanalyse naarspecifieke deelhypothesen en covariantieanalyse. Er wordttelkens geïllustreerd hoe de analyses met SAS Eguide enSPSS kunnen uitgevoerd worden.
Inhoud van de cursus:Dag 1: Uitbreiding van regressie• Speciale datapunten: detectie van uitschieters en invloed-
rijke waarnemingen• Inleiding tot robuuste regressie• Multicollineariteit
Dag 2: (halve dag)• Covariantie analyse
DoelgroepDeze cursus is bedoeld voor personen die regelmatiglineaire regressieanalyse wensen te gebruiken.
VoorkennisCursisten dienen vertrouwd te zijn met de methodiekaangebracht in ‘Regressie- en variantieanalyse’.
LesgeverMarlies Lacante, An Carbonez
CursusmateriaalCursusmateriaal wordt als .pdf file ter beschikking gesteld.
Datum 24 november 2014 van 9 u. -12 u. en 13 u. -16 u. en 25 november 2014 van 9 u. -12 u.
TaalNederlands
Prijs• Personeel en studenten KU Leuven en Associatie
KU Leuven: zie https://icts.kuleuven.be/cursus/• PhD studenten, niet KU Leuven € 120• Non profit/sociale sector € 187,50• Private sector € 450
DOC_BRO_LSTAT_2014-2015_DOC_BRO_LSTAT_2014-2015 28/08/14 08:45 Pagina 16

17
Statistical Machine Learning with R
Course outlineThis course is a hands-on course covering the use of statistical machine learning methods available in R. The following basic learning methods will be covered andused on common datasets.• classification trees (rpart)• feed-forward neural networks and multinomial regression• random forests• boosting for classification and regression• bagging for classification and regression• penalized regression modelling (lasso/ridge regularized
generalized linear models)• model based recursive partitioning (trees with statistical
models at the nodes)• training and evaluation will be done through the use of
the caret and ROCR packages
The course will cover the techniques from a high-levelviewpoint, useful for day-to-day R users.
Target audienceThe course is for R users in industry/academics who areinterested in building predictive models in R which havesome experience with regressions but have less knowledgeof machine learning and techniques of artificial intelligence.
Also persons interested in the statistical learning techniquesitself will find this course usefull.
Or people with a data science background with lessknowledge of R and which are interested in machinelearning in general.
PrerequisitesInitial experience in R ranging from a few weeks to severalyears (at least understanding of the course 'Essential Toolsfor R' is needed). Some practical experience in regressionmodelling.
Course materialsA .pdf file with the course material will be made available.
PresenterJan Wijffels
Date27 and 28 November 2014, 9.00 hr - 12.00 hr and 13.00 hr - 16.00 hr
LanguageEnglish
Price• Staff and students KU Leuven and Association
KU Leuven: go to: https://icts.kuleuven.be/cursus/• PhD students, non KU Leuven € 160• Non profit/social sector € 250• Private sector € 600
DOC_BRO_LSTAT_2014-2015_DOC_BRO_LSTAT_2014-2015 28/08/14 08:45 Pagina 17

18
Niet-parametrische statistiek
BeschrijvingDeze cursus behandelt een aantal statistische technieken- analoog aan parametrische statistiek (bv. t-test, variantie -analyse) - waarbij de klassieke onderstellingen uit de parametrische statistiek niet hoeven gemaakt te worden(distributievrije technieken), technieken gebaseerd op ‘ordeningen’ of ‘rankings’, alsook technieken specifiek geschikt voor nominale gegevens.
Inhoud van de cursus:• Chi- kwadraat goodness of fit testen• Testen mbt verschil tussen twee onafhankelijke
steekproeven• Testen mbt verschil tussen twee afhankelijke
steekproeven • Testen mbt verschil tussen meerdere onafhankelijke
steekproeven• Testen mbt verschil tussen meerdere afhankelijke
steekproeven• Kengetallen mbt de samenhang tussen variabelen
DoelgroepGebruikers van basis statistische technieken (t-test - variantie-analyse)
VoorkennisCursisten dienen vertrouwd te zijn met de methodiek aangebracht in ‘Fundamentele Statistische technieken’ en variantie analyse.
LesgeversMarlies Lacante
CursusmateriaalCursusmateriaal wordt als .pdf file ter beschikking gesteld.
Datum 10 december 2014 van 9 u. tot 12 u.
TaalNederlands
Prijs• Personeel en studenten KU Leuven en Associatie
KU Leuven:zie https://icts.kuleuven.be/cursus/• PhD studenten, niet KU Leuven € 40• Non profit/sociale sector € 62,50• Private sector € 150
DOC_BRO_LSTAT_2014-2015_DOC_BRO_LSTAT_2014-2015 28/08/14 08:45 Pagina 18

19
Experimental Design
Course outlineThis course discusses the design of factorial experiments.Initially, the focus is on completely randomized experimentaldesigns. Next, the focus shifts to experimental designsinvolving a restricted randomization. First, the concept ofblocking is discussed. Next, split-plot and strip-plot designsare studied.
The emphasis in the course is on the optimal design ofexperiments. In optimal design of experiments, the experi -mental design is tailored to the problem at hand (unlikeclassical experimental design, where standard designsfrom catalogs are chosen).
The course builds on concepts from regression andanalysis of variance, such as fixed and random effects,power calculations, variance inflation factors, multi collinearity,confidence intervals, prediction and lack-of-fit tests.
Every topic in the course is introduced and illustrated bymeans of a case study from industry. The case studies arerealistic in the sense that they involve quantitative andqualitative experimental factors, experimenters have todeal with limited budgets and difficulties to randomize, and forbidden combinations of factor levels. In each of the case studies, the goal is to enhance to performanceof a process or a product.
The statistical software package used is JMP.
Target audienceThe target audience for the course is master students orPh.D. students in statistics, engineers and engineeringstudents planning to perform experiments. The course isideal for Six Sigma black belts, quality managers andpeople working in environments where collecting data isexpensive.
PrerequisitesPrerequisites for the course are knowledge of basic statistics,regression analysis (least squares, multicollinearity), and matrixalgebra (matrix products, inverse matrices, determinants).
PresenterPeter Goos
Course materialsTextbook: Optimal Design of Experiments: A Case StudyApproach (Peter Goos & Bradley Jones)
DatesFebruary 10, 2015: 9.00 hr - 11.30 hr February 17, 2015: 9.00 hr - 11.30 hrFebruary 24, 2015: 9.00 hr - 11.30 hr
March 3, 2015: 9.00 hr - 11.30 hrMarch 10, 2015: 9.00 hr - 11.30 hrMarch 17, 2015: 9.00 hr - 11.30 hrMarch 31, 2015: 9.00 hr - 11.30 hrApril 28, 2015: 9.00 hr - 11.30 hr
LanguageEnglish
Price• Staff and students KU Leuven and Association
KU Leuven: go to https://icts.kuleuven.be/cursus/• PhD students, non KU Leuven € 320 • Non profit/social sector € 500• Private sector € 1200
DOC_BRO_LSTAT_2014-2015_DOC_BRO_LSTAT_2014-2015 28/08/14 08:45 Pagina 19
20
Chemometrics
Course outlineThe goal of the course is to teach students how to performmultivariate sensor calibration. Students will becomefamiliar with the use of statistical concepts in chemometricapplications. Most attention will be given to the ideasunderlying the different methods and the application ofthese methods to realistic examples. Theoretical considera -tions and equations will be limited to what is needed to have sufficient insight to properly use the methods.Most examples will be related to spectroscopy andanalytical chemistry, but the scope is broader. By using acombination of lectures, computer sessions and takehome assignments the students will really learn how toapply the chemometric methods. The following aspects ofchemometrics will be handled in this course:• Classical modelling concepts for quantitative calibration:
Classical Least Squares (CLS), Inverse Least Squares(ILS), Multivariate Linear Regression (MLR), PrincipleComponent Regression (PCR) and Partial Least Squares(PLS).
• Necessary steps for the creation and successful deploy-ment of calibrations; selection of calibration standardsand assessment of the reliability of the models: (Test setvalidation vs. Cross-validation, model statistics). Specialattention will be given to the methods for the selectionof the number of principle components or latent variablesin the projection methods.
• Methods for data pre-processing with special attentionfor the phenomena of light scattering and instrumentdrift and the methods to deal with these phenomena:derivatives, standard normal variate (SNV), multiplicativesignal correction (MSC) and extended multiplicative signalcorrection (EMSC).
• Variable selection in a chemometric context and somecommonly used methods for this.
• Qualitative analysis in a chemometric context: discrimi -nation and classification
• New trends in chemometrics such as functional dataanalysis and augmented classical least squares (ACLS).
Target audienceThe intended target audience includes PhD students andresearchers in a variety of fields, including statistics,chemistry, biosciences and engineering. We aim at readerswho wish to learn more about multivariate calibration ofsensor systems and the use of statistical concepts inchemometric applications.
Prerequisites Knowledge of basic concepts of statistics and linearalgebra is required. Some notions of analytical chemistry,sensor technology and multivariate statistics are a plus.
PresenterWouter Saeys
Course MaterialsSlides from the lecturesPapers discussed in the lecturesSoftware manualDatasets for the take home assignmentsAdditional material (suggested)• A user-friendly guide to Multivariate Calibration and
Classification by Naes, Isaksson, Fearn and Davies,NIR Publications 2004
• Multivariate Calibration by Martens and Naes, 1989
DatesFebruary 11, 2015: 9.00 hr -12.00 hr February 25, 2015: 9.00 hr - 12.00 hr
March 4, 2015: 9.00 hr - 12.00 hrMarch 11, 2015: 9.00 hr - 12.00 hr March 18, 2015: 9.00 hr - 12.00 hr
LanguageEnglish
Price• Staff and students KU Leuven and Association
KU Leuven: go to: https://icts.kuleuven.be/cursus/• PhD students, non KU Leuven € 200• Non profit/social sector € 312,50• Private sector € 750
DOC_BRO_LSTAT_2014-2015_DOC_BRO_LSTAT_2014-2015 28/08/14 08:45 Pagina 20

21
Course outlineMultivariate data consist of observations on two or morevariables for each individual or unit.
The variables will be generally correlated, and a variety oftechniques are available to analyse these data.
The objective of cluster analysis is to form groups ofobservations such that each group is as homogeneous aspossible with respect to certain characteristics. The groupsare as different as possible.
Principal component analysis is one of the popular toolsto summarize quantitative multivariate data.
During this course, PCA and exploratory factor analysis,will be introduced and the relation between them examined.
The emphasis of the course will be on the interpretationof the example data and on the results through the Biplot.Mathematical details are kept to a minimum.
For the exercises, participants can choose to use thestatistics package SAS (through Enterprise Guide), SPSSor R.
Course content:• Hierarchical cluster analysis• Nonhierarchical cluster analysis• Linear combination of variables• Eigenvalues and eigenvectors • PCA scores and Factor scores• What is a loading or the factor pattern?• Screenplot• How many components or factors to retain? • Communalities• The biplot• The Varimax rotation
Target audienceData analysts and scientists involved in analysing multi -variate data.
Prerequisites A practical knowledge of basic statistics will be assumed,such as standard deviations and correlations.
PresentersAnne-Marie De Meyer, An Carbonez and Martine Beullens
Course MaterialsA.pdf file with course material will be made available
Dates10, 11 and 12 March 2015 from 9.00 hr - 12.00 hr
LanguageEnglish
Price• Staff and students KU Leuven: go to
https://icts.kuleuven.be/cursus/• Staff and students Association KU Leuven
and PhD students, non-KU Leuven € 120• Non profit/social sector € 187,50• Private sector € 450
Cluster analysis, principal componentanalysis and exploratory factor analysis with SAS, SPSS and R
DOC_BRO_LSTAT_2014-2015_DOC_BRO_LSTAT_2014-2015 28/08/14 08:45 Pagina 21

22
Course outlineThis basic course in statistics emphasizes on selecting theappropriate statistical method and drawing the rightconclusions from the obtained results. Mathematical detailswill be kept to a minimum. The emphasis will be on under -standing the concepts and on practical applications. The adequate use of basis statistical summaries (measuresof central tendency, measures of dispersion, box-plots, ...)will be illustrated. The foundations of confidence intervalsand of testing hypotheses will be dealt with.
Course content:• Descriptive statistics: graphical and numerical summaries
of the data• Distributions: Binomial, Poisson, Exponential, Normal
and t-distribution• Distribution of the sample mean• Confidence intervals• Hypothesis tests for a population mean (one and two
samples)• Paired t-test• Estimating and testing for proportions
Target audienceAnyone who wishes to understand basic statisticaltechniques more thoroughly.
Prerequisites There are no prerequisites
PresentersMarlies Lacante
Course MaterialsA .pdf file with the course material will be made available.
Dates17, 18, 19 March 2015 from 9.00 hr - 12.00 hr
LanguageEnglish
Price• Staff and students KU Leuven and Association
KU Leuven: go to: https://icts.kuleuven.be/cursus/• PhD students, non KU Leuven € 120• Non profit/social sector € 187,50• Private sector € 450
Fundamental Statistical Methods
DOC_BRO_LSTAT_2014-2015_DOC_BRO_LSTAT_2014-2015 28/08/14 08:45 Pagina 22

23
Introduction to the analysis of contingency tables
Course outlineIn this course, chi-square tests and association measuresare used to identify if there is significant association incontingency tables and to determine how strong thisasso ciation is. By use of examples, it is illustrated thatexact tests are necessary in certain situations. There isenough time to practice with SAS Eguide, SPSS and R.
Course content:• Construction of a contingency table• Tests for independence: chi square tests• Association measures• Analysis of a 2x2 table: relative risk, odds ratio• Exact test
Target audienceEveryone who wants to analyse contingency tables.
Prerequisites Participants are familiar with basic statistical concepts(which are e.g. introduced in the course ‘FundamentalStatistical Methods’).
PresenterAn Carbonez
Course MaterialsA .pdf file with the course material will be made available.
Dates19 March 2015 13.00 - 16.00 hr20 March 2015 9.00 - 12.00 hr and 13.00 - 16.00 hr.
LanguageEnglish
Price• Staff and students KU Leuven and Association
KU Leuven: go to: https://icts.kuleuven.be/cursus/• PhD students, non KU Leuven € 120• Non profit/social sector € 187,50• Private sector € 450
DOC_BRO_LSTAT_2014-2015_DOC_BRO_LSTAT_2014-2015 28/08/14 08:45 Pagina 23

24
Concepts of Multilevel, Longitudinal and Mixed models
Course outlineStarting from ANOVA models with random factor levels,the concepts of mixed models are introduced and the basicsabout inference in random-effects models will be explained.Afterwards, the mixed ANOVA model is extended to generallinear mixed models for continuous data. Finally, extensionsto models for binary or count data will be briefly discussed.Omitting all theoretical details, sufficient background willbe given such that practising statisticians can apply mixedmodels in a variety of contexts, know how to use up-to-date software, and are able to correctly interpret generatedoutputs. Many applications, taken from various disciplines,will be discussed.
Target audienceThe targeted audience includes methodological andapplied statisticians and researchers in industry, publichealth organizations, contract research organizations andacademia. Important: this course will also serve the MScin Statistics students.
Prerequisites The student knows the basics of statistical inference, andstatistical modeling (regression, Anova and general(ized)linear models).
PresenterGeert Verbeke
Course MaterialsA .pdf file with the copies of the transparencies used inthe course will be made available.
DatesMarch 10, 2015 13.00 hr - 16.00 hrMarch 31, 2015 13.00 hr - 16.00 hr
April 28, 2015 13.00 hr - 16.00 hr
May 5, 2015 13.00 hr - 16.00 hrMay 12, 2015 13.00 hr - 16.00 hr
LanguageEnglish
Price• Staff and students KU Leuven and Association
KU Leuven: go to: https://icts.kuleuven.be/cursus/• PhD students, non KU Leuven € 200• Non profit/social sector € 312,50• Private sector € 750
DOC_BRO_LSTAT_2014-2015_DOC_BRO_LSTAT_2014-2015 28/08/14 08:45 Pagina 24

25
Introduction to correspondence ana lysis and multiple correspondenceanalysis with SAS, SPSS and R
Course outlineCorrespondence analysis (CA) , is an exploratory techniqueto simultaneously score the categories and the columncategories in a bivariate contingency table in a lower dimensional space The objective is also to clarify the relationship between the row and the column variable. It is well suited for large contingency tables. It can also beused for continuous variables as Age, which can be groupedin different age categories.
In three-way and high dimensional contingency tables, anintroduction to multiple correspondence analysis (MCA) ispresented, also called Principal components for categoricaldata. MCA is a method to visualize the joint properties ofmore than 2 categorical variables The individual observationsand the categories of the variables can be displayed in thesame plot.
In this course, the focus will be on the data examples, the interpretation of the results and the Biplot. SAS and/orSPSS are used for the examples and exercises.
Course content:• Introduction and short historical overview• CA
- Revisit Pearson Chi-square statistic- Inertia and Eigenvalues- CA row and column coordinates- CA plots and association between row and
columns- Quality of the visual presentation- Illustration in SAS and in SPSS
• MCA - Super Indicator matrix - The Burt matrix- Joint presentation of categories- Illustration in SAS and in SPSS
Target audienceData analysts and scientists involved in analysing multi-variate categorical data.
Prerequisites A working knowledge of basic statistics (e.g. Pearson Chi-square Statistic) in contingency tables will be assumed.
PresenterAnne-Marie De Meyer
Course MaterialsA.pdf file with the course material will be made available
Dates23 and 24 March 2015 from 9.00 hr - 12.00 hr
LanguageEnglish
Price• Staff and students KU Leuven: go to
https://icts.kuleuven.be/cursus/• Staff and students Association KU Leuven
and PhD students, non-KU Leuven € 80• Non profit/social sector € 125• Private sector € 300
DOC_BRO_LSTAT_2014-2015_DOC_BRO_LSTAT_2014-2015 28/08/14 08:45 Pagina 25

26
Web lecture on Sampling Theory
Course outlineDifferent methods for selecting a (survey) sample from anexisting population will be considered. Problems arising inthe sampling designs will be discussed. The focus will beon the concepts rather than on the formulas. Nevertheless,attention will be paid at the estimation of the populationparameters of interests.
Target audienceEveryone with an interest in sampling theory, from an appliedand/or methodological point of view.
Prerequisites Participants should have an intimate knowledge of basicconcepts of descriptive and inductive statistics.
PresenterGeert Molenberghs
Course MaterialsA.pdf file with the course material will be made available
DatesFace to face lecture: April 23 2015: 16.30 hr - 20.00 hrThe other lectures will be accessible via the web.
Face to face question and answer session 1: May 5 2015: 18.00-20.00 hr
Face to face question and answer session 2: May 12 2015: 18.00-20.00 hr
LanguageEnglish
Price• Staff and students KU Leuven: go to
https://icts.kuleuven.be/cursus/• Staff and students Association KU Leuven
and PhD students, non-KU Leuven € 200• Non profit/social sector € 312.5• Private sector € 750
DOC_BRO_LSTAT_2014-2015_DOC_BRO_LSTAT_2014-2015 28/08/14 08:45 Pagina 26

27
Logistic Regression Models with SAS and SPSS
DescriptionThe focus is on the statistical model with a categoricaloutcome or response variable.
A categorical response variable can be a binary variable,an ordinal variable or a nominal variable and each typerequires a different model to describe its relationship withthe predictor variables.
We will define, interpret and illustrate the models for eachtype of outcome and place the models in the frameworkof the Generalized Linear Model.
SAS (through SAS Enterprise Guide) or SPSS are used inthe applications.
Outline• Introduction• Binary Logistic Regression• Multinomial Logistic Regression for nominal outcome
variables• Proportional Odds Model - Ordinal Logistic Regression• Logistic regression in the framework of the Generalized
Linear Model
Target audienceData analysts in all disciplines
Prerequisites ‘Fundamental Statistical Methods’ and ‘Introduction to theanalysis of contingency tables’. Knowledge of the standard regression model
PresenterAnne-Marie De Meyer
Course MaterialsA.pdf file with the course material will be made available.
DatesLogistic regression models with SAS: 28 and 29 April2015 from 9.00 hr - 12.00 hrLogistic regression models with SPSS: 28 and 30 April2015 from 9.00 hr - 12.00 hr
LanguageEnglish
Price• Staff and students KU Leuven: go to
https://icts.kuleuven.be/cursus/• Staff and students Association KU Leuven
and PhD students, non-KU Leuven € 80• Non profit/social sector € 125• Private sector € 300
DOC_BRO_LSTAT_2014-2015_DOC_BRO_LSTAT_2014-2015 28/08/14 08:45 Pagina 27

28
Nonparametric smoothing techniques and applications
Course outlineNonparametric smoothing techniques are an importantclass of tools for identifying the true signal hidden in noisydata. These tools are widely used in statistical analysis ina variety of application areas. This course will provide thestudents with a thorough overview of the most importantsmoothing techniques (such as kernel smoothing, localpolynomial fitting, spline smoothing, wavelet decomposition,regularization techniques, …). The course will addresstheoretical and computational aspects. We will discusshow to use these techniques in different settings (e.g. in aunivariate or multivariate regression setting, in case ofincomplete data, …). The course includes illustrations withdata examples and the use of the R software.
Target audiencePhD students or practitioners/researchers with a goodbackground knowledge of statistics and statistical inference.
Prerequisites Participants should have a good background in statistics,in particular in statistical inference.
Presenterto be announced
Course MaterialsA .pdf file with the course material will be made available.
Background reading:• Fan, J. and Gijbels, I. (1996). Local Polynomial Modeling
and Its Applications. Chapman and Hall, New York. • Hastie, T., Tibshirani, R. and Friedman, J. (2001).
The Elements of Statistical Learning. Springer, New York.• Simonoff, J.S. (1996). Smoothing Methods in Statistics.
Springer, New York.
Dates5 days in Spring 2015
LanguageEnglish
Price• Staff and students KU Leuven and Association
KU Leuven: go to: https://icts.kuleuven.be/cursus/• PhD students, non KU Leuven € 400 • Non profit/social sector € 625 • Private sector € 1500
DOC_BRO_LSTAT_2014-2015_DOC_BRO_LSTAT_2014-2015 28/08/14 08:45 Pagina 28

29
Poisson regression with SAS or SPSS
DescriptionA Poisson regression model fits a count or the number ofoccurrences of an event or the rate of occurrence of anevent as a function of some predictor variables. For example:the number of occurrences or the rate of a certain disease.The Poisson model is a special case of the GeneralizedLinear model. SAS (through SAS Enterprise Guide) or SPSSare used in the applications.
Outline• Introduction to Poisson regression• The Poisson model in the framework of the Generalized
Linear model • Correction for overdispersion • The negative binomial model • Poisson regression models for rates
Target audienceData analysts in all disciplines
Prerequisites ‘Fundamental Statistical Methods’ and ‘Introduction to theanalysis of contingency tables’. Knowledge of the standard regression model
PresenterAnne-Marie De Meyer
Course MaterialsA.pdf file with the course material will be made available.
DatesPoisson regression with SAS: 6 and 7 May 2015 from9.00 hr - 12.00 hrPoisson regression with SPSS: 6 and 8 May 2015 from9.00 hr - 12.00 hr
LanguageEnglish
Price• Staff and students KU Leuven: go to
https://icts.kuleuven.be/cursus/• Staff and students Association KU Leuven
and PhD students, non-KU Leuven € 80• Non profit/social sector € 125• Private sector € 300
DOC_BRO_LSTAT_2014-2015_DOC_BRO_LSTAT_2014-2015 28/08/14 08:45 Pagina 29

30
Inleiding tot enquêtering
BeschrijvingVia survey onderzoek wil men informatie verzamelen omtrent mensen, ideeën, opinies, houdingen, plannen, gezondheid, sociale - educatieve - of familiale achter-grond. Zulk soort onderzoek gebeurt vaak bij sociologischevraagstellingen, in psychologie, bij marktonderzoek, enz…Informatie over dergelijke onderwerpen kan men moeilijkop ‘experimentele wijze’ verzamelen. Daarom moet mende personen in kwestie bevragen. Dit kan via een interview,een vragenlijst, een telefonische enquête, enz. ... Dit soortbevragingen kent een eigen methodologie en eigen onder -zoeksregels die moeten gerespecteerd worden. In dezecursus wordt achtereenvolgens ingegaan op de verschillendestappen in dit onderzoeksproces.
Tevens zal een half dagdeel besteed worden aan de enquête -service aan de KU Leuven, die gebaseerd is op de open-source software “Limesurvey”. Deze software laat gebruikerstoe om snel zeer krachtige online enquêtes te ontwikkelen.
Inhoud van de cursus:• analyse van de onderzoeksvraag: wat wil men te
weten komen? • verzamelen van de gevraagde informatie • welke regels moet men in acht nemen bij het formuleren
van de vragen? (invloed van de vraagstelling op het antwoord, betrouwbaarheid en validiteit)
• methoden van steekproeftrekkingen • verwerken van de gegevens • rapportering • hoe werkt de enquêteservice van de KU Leuven• algemene instellingen voor de enquête• beschikbare vraagtypes en hun mogelijkheden • werken met tokens• uitnodigen van de respondenten en opvolgen van de
responses• exporteren van de resultaten naar statistische pakketten
DoelgroepGebruikers van vragenlijstonderzoek
VoorkennisCursisten dienen vertrouwd te zijn met de methodiek aan-gebracht in ‘Fundamentele Statistische technieken’ en decursus ‘Regressie- en variantie analyse’.
LesgeversMarlies Lacante en Kristel Hoydonckx
CursusmateriaalCursusmateriaal wordt als .pdf file ter beschikking gesteld.
Datum 6 en 7 mei 2015 telkens van 9 u. - 12 u., 8 mei 2015 van 9 u. -12 u. en 13 u. - 16 u.
TaalNederlands
Prijs• Personeel en studenten KU Leuven en Associatie
KU Leuven: zie https://icts.kuleuven.be/cursus/• PhD studenten, niet KU Leuven € 160• Non profit/sociale sector € 250• Private sector € 600
DOC_BRO_LSTAT_2014-2015_DOC_BRO_LSTAT_2014-2015 28/08/14 08:45 Pagina 30
31
Consulting was our historical embryo and remains a core business.
The statistical consulting service center acts as the main pivot to determine the ideal combination between the customer
and the most appropriate university entity.
We recommend that you contact us in an early stage of your project and write a short description of your problem and
send it to [email protected].
The LStat Statistical consulting Service covers
• Statistical support for researchers within the university. The LStat provides statistical help for university research
groups and for the central administration of the university. We help you with advice and we offer support with the
design of your study and with the statistical analysis of your data whether elementary or sophisticated. The first
hour of first-line consulting is provided free of charge.
• Statistical service and execution of projects for government and industry, in service or in partnership.
The LStat uses the administrative help of Leuven Research and Development (LRD) in the negotiation of the contracts
with industries and the private sector.
We have experience with major financial companies, inter national institutions, manufacturers, medical organizations,
marketing companies, FMCG as well as small and medium-sized enterprises.
Our solutions range from basic regression, multivariate techniques, analysis of variance, mixed models, data mining,
process control, to risk theory, categorical data analysis, longitudinal data analysis and tailor-made simulations and
calculations.
If you have any questions, do not hesitate to contact us at: [email protected] and take a look at our website:
http://lstat.kuleuven.be/consulting/
Statistical consulting Service
DOC_BRO_LSTAT_2014-2015_DOC_BRO_LSTAT_2014-2015 28/08/14 08:45 Pagina 31

32
• REGISTRATION COSTS The indicated prices correspond to training for 1 person.
There are several fee categories: - Students and staff from KU Leuven and Association KU Leuven- PhD students from other universities € 80 / full day - non-profit sector, social sector € 125 / full day - private sector € 300 / full day
Prices include all course material. If the course takes a whole day and the course takes place at the Arenberg campus in Heverlee a sandwich lunch is included as well.
Payments have to be settled before the start of the course.
• CONFIRMATIONYou will receive a confirmation upon receipt of your application form. This confirmation gives information on how to make the payment and on the course venue. Please contact us in case you do not receive a confirmation letter.
• DISCOUNT When you subscribe for several courses, you can get a discount of 10% if the total number of full training days equals or exceeds 5 days per person and a discount of 20% is attributed if you follow courses for at least 10 full days.
• CANCELLATION - If you are unable to attend a course for which you have registered, you can let a colleague replace you. - Full cancellation for a specific course always has to be done in writing. Administrative costs for cancellation
are set at € 20 when the cancellation is carried out more than 2 weeks before the course takes place. After that, the full course fee will be charged.
INFORMATION
For other questions on registration and extra information contact: tel. + 32 16 32 22 14 [email protected]
Practical Matters
DOC_BRO_LSTAT_2014-2015_DOC_BRO_LSTAT_2014-2015 28/08/14 08:45 Pagina 32

Faculty of Science
Registration form Short courses in Statistics 2014-2015
Post or e mail this form to: LStat, Celestijnenlaan 200B, 3001 HEVERLEE, Belgium or [email protected] use the registration form at www.lstat.kuleuven.beStaff and students of (Association) KU Leuven should register online: https://icts.kuleuven.be/cursus/
Applicants details:
Mr. / Mrs. / Ms. Family name ____________________________________________ First name ______________________________
Company/Institute__________________________________________________
Street ________________________________________________________________________________ Number ______________________
P.O. Box ____________ Postcode______________ City ____________________________________ Country ______________________
E mail address ____________________________________________________
Fee category:nn PhD students, non- KU Leuven Price per full day: € 80nn Non profit/social sector Price per full day: € 125nn Private sector Price per full day: € 300
Indicate the courses that you wish to attend:nn Flames: Essential Tools for R 29, 30 September, 1, 2, October 2014nn Fundamentele statistische methoden 6, 7, 8 October 2014nn Fundamentele statistische methoden, toegepast met SAS Eguide 14 October 2014nn Fundamentele statistische methoden, toegepast met SPSS 14 October 2014nn Fundamental Statistical Methods, applications with R 14 October 2014nn Optimization and Numerical Methods in Statistics 13,14 and 30,31 October 2014 nn Models for Longitudinal and Incomplete data 22, 23, 24 October 2014, 17, 18, 19 November 2014nn Advanced programming in R 3, 4 November 2014nn Regression and Analysis of Variance 3, 4 November 2014nn Regressie- en variantieanalyse toegepast met SPSS 14 November 2014nn Regressie- en variantieanalyse toegepast met SAS Eguide 14 November 2014nn Regression and Analysis of Variance, applications with R 13, 18 November 2014nn Uitbreiding bij Regressie- en variantieanalyse 24, 25 November 2014nn Statistical Machine Learning with R 27, 28 November 2014nn Niet-parametrische statistiek 10 December 2014nn Experimental Design 10, 17, 24 February and 3, 10, 17, 31 March
and 28 April nn Chemometrics 11, 25 February, 4, 11, 18 March 2015 nn Fundamental statistical methods 17, 18, 19 March 2015 nn Cluster analysis, principal component analysis and exploratory factor
analysis with SAS, SPSS and R 10, 11, 12 March 2015nn Introduction to the analysis of contingency tables. 19, 20 March 2015 nn Concepts of multilevel, longitudinal and mixed models 10, 31 March, 28 April, and 5, 12 May 2015nn Introduction to correspondence analysis and multiple correspondence
analysis with SAS, SPSS and R 23, 24 March 2015nn Weblecture on Sampling Theory 23 April 2015nn Logistic Regression Models with SAS 28, 29 April 2015nn Logistic Regression Models with SPSS 28, 30 April 2015nn Nonparametic Smoothing Techniques and Applications data to be announced in 2015nn Poisson regression with SAS 6, 7 May 2015nn Poisson regression with SPSS 6, 8 May 2015nn Inleiding tot enquêtering 6, 7, 8 May 2015nn Flames: Essential Tools for R 8, 9, 11, 12 June 2015
DOC_BRO_LSTAT_2014-2015_DOC_BRO_LSTAT_2014-2015 28/08/14 08:45 Pagina 33

LEUVEN STATISTICSRESEARCH CENTRECelestijnenlaan 200 B
3001 HEVERLEE, Belgiëtel. + 32 16 32 22 14
v.u.
: P
rof.
M.
Laca
nte,
Leu
ven
Sta
tistic
s R
esea
rch
Cen
tre,
Cel
estij
nenl
aan
200
B,
3001
HE
VE
RLE
E,
Bel
gië
DOC_BRO_LSTAT_2014-2015_DOC_BRO_LSTAT_2014-2015 28/08/14 08:45 Pagina 34