Embed Size (px)
Citation preview

Leucadia National Corporation
2017 Investor Meeting October 5, 2017

Note on Forward Looking Statements
Certain statements contained herein may constitute "forward-looking statements," within the meaning of Section 27A of the Securities Act of 1933, Section 21E of the Securities Exchange Act of 1934 and/or the Private Securities Litigation Reform Act of 1995, regarding Leucadia National Corporation, HRG Group, Inc., Global Brokerage, Inc. and HomeFed Corporation, and their respective subsidiaries. These forward-looking statements reflect the respective issuer’s current views relating to, among other things, future revenues, earnings, operations, and other financial results, and may include statements of future performance, plans, and objectives. Forward-looking statements may also include statements pertaining to an issuer’s strategies for the future development of its business and products. These forward-looking statements are not historical facts and are based on the respective issuer’s management expectations, estimates, projections, beliefs and certain and other assumptions, many of which, by their nature, are inherently uncertain and beyond management’s control. It is possible that the actual results may differ, possibly materially, from the anticipated results indicated in these forward-looking statements. Accordingly, readers are cautioned that any such forward-looking statements are not guarantees of future performance and are subject to certain risks, uncertainties and assumptions that are difficult to predict including, without limitation, the cautionary statements and risks set forth in the respective issuer’s Annual and Quarterly Reports and other reports or documents filed with, or furnished to, the SEC from time to time, which are accessible on the SEC website at sec.gov. This information should also be read in conjunction with each respective issuer’s Consolidated Financial Statements and the Notes thereto contained in the Annual, Quarterly and Periodic Reports filed by such issuer that are also accessible on the SEC website at sec.gov. Any forward-looking statements made by an issuer herein are unique to that issuer and are not to be attributed as statements made or endorsed by any other issuer.
i

Leucadia’s Momentum
Leucadia’s operating performance continues to strengthen
─Jefferies performed well over the last twelve months (“LTM”) ended August 31, 2017, with Net Revenues of $3.1 billion and Pre-Tax Income of $459 million, reduced risk and volatility, and scope for further growth and margin expansion
─National Beef generated record results for LTM June 30, 2017 on the back of a more balanced supply of cattle and robust end market demand: EBITDA(1) of $485 million and Pre-Tax Income of $380 million
Strong market conditions and solid operating results have created opportunities to monetize investments at attractive prices and well above carrying value
─January 2017 sale of Conwed yielded $295 million of cash and up to an additional $40 million over five years in an earnout. 2016 EBITDA(1) of about $29 million
─July 2017 sale of KCG yielded cumulative revenues and fees(1) of $419 million vs. maximum net investment exposure of $125 million
─Pending sale of HRG Group’s 80%-owned Fidelity & Guaranty to CF Corp, which would yield ~$1.4 billion in net proceeds to HRG
We continue to prospect for new opportunities and are always seeking to “get the call”
(1) These are Non-GAAP measures. See pages 105-111 in Appendix for reconciliation to GAAP amounts. 1
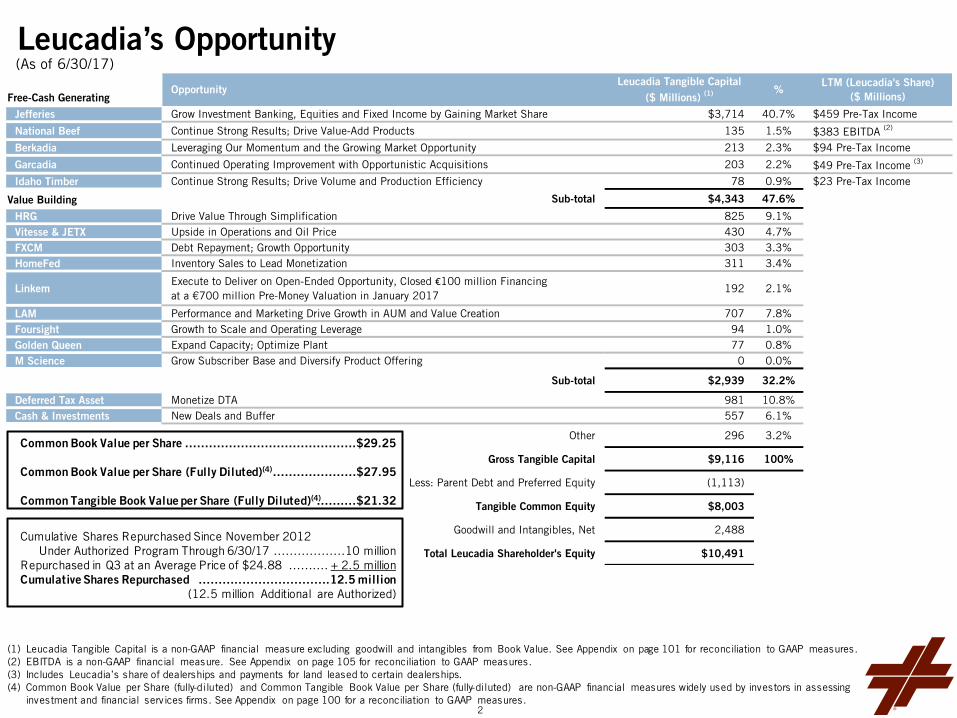
Free-Cash GeneratingOpportunity
Leucadia Tangible Capital ($ Millions) (1) %
LTM (Leucadia's Share)($ Millions)
Jefferies Grow Investment Banking, Equities and Fixed Income by Gaining Market Share $3,714 40.7% $459 Pre-Tax Income
National Beef Continue Strong Results; Drive Value-Add Products 135 1.5% $383 EBITDA (2)
Berkadia Leveraging Our Momentum and the Growing Market Opportunity 213 2.3% $94 Pre-Tax Income
Garcadia Continued Operating Improvement with Opportunistic Acquisitions 203 2.2% $49 Pre-Tax Income (3)
Idaho Timber Continue Strong Results; Drive Volume and Production Efficiency 78 0.9% $23 Pre-Tax Income
Value Building Sub-total $4,343 47.6%
HRG Drive Value Through Simplification 825 9.1%Vitesse & JETX Upside in Operations and Oil Price 430 4.7%FXCM Debt Repayment; Growth Opportunity 303 3.3%HomeFed Inventory Sales to Lead Monetization 311 3.4%
LinkemExecute to Deliver on Open-Ended Opportunity, Closed €100 million Financing at a €700 million Pre-Money Valuation in January 2017
192 2.1%
LAM Performance and Marketing Drive Growth in AUM and Value Creation 707 7.8%Foursight Growth to Scale and Operating Leverage 94 1.0%Golden Queen Expand Capacity; Optimize Plant 77 0.8%M Science Grow Subscriber Base and Diversify Product Offering 0 0.0%
Sub-total $2,939 32.2%
Deferred Tax Asset Monetize DTA 981 10.8%Cash & Investments New Deals and Buffer 557 6.1%
Other 296 3.2%
Gross Tangible Capital $9,116 100%
Less: Parent Debt and Preferred Equity (1,113)
Tangible Common Equity $8,003
Goodwill and Intangibles, Net 2,488
Total Leucadia Shareholder's Equity $10,491
Leucadia’s Opportunity
Common Book Value per Share Common Book Value per Share (Fully Diluted)(4)
Common Tangible Book Value per Share (Fully Diluted)(4)
(1) Leucadia Tangible Capital is a non-GAAP financial measure excluding goodwill and intangibles from Book Value. See Appendix on page 101 for reconciliation to GAAP measures. (2) EBITDA is a non-GAAP financial measure. See Appendix on page 105 for reconciliation to GAAP measures. (3) Includes Leucadia’s share of dealerships and payments for land leased to certain dealerships. (4) Common Book Value per Share (fully-diluted) and Common Tangible Book Value per Share (fully-diluted) are non-GAAP financial measures widely used by investors in assessing
investment and financial services firms. See Appendix on page 100 for a reconciliation to GAAP measures.
…………………………………….$29.25
…………………$27.95
……....$21.32
(As of 6/30/17)
(4)
Cumulative Shares Repurchased Since November 2012 Under Authorized Program Through 6/30/17
Repurchased in Q3 at an Average Price of $24.88 Cumulative Shares Repurchased
………………10 million
…….... + 2.5 million ………..………………….12.5 million
(12.5 million Additional are Authorized)
2

National Beef (79%) $713 Million
Linkem (53%) $192 Million
Jefferies Finance (50%) $541 Million
KCG Holdings (24%)
$316 Million (<$0 Million at Cost)
Golden Queen (35%) $77 Million
HRG Group (23%) $825 Million
($476 Million at Cost)
Vitesse Energy (96%) $316 Million
Financial Services $7.3 Billion
Merchant Banking $2.6 Billion
Corporate / Liquidity $1.8 Billion
Jefferies LoanCore (49%)
$218 Million
Jefferies (100%) $5.6 Billion (2)
FXCM (50%) $303 Million
($12 Million Invested, Net of Receipts) (3)
HomeFed (70%)
$311 Million (4) ($488 Million at MV) (5)
Parent Company Cash & Investments
$0.6 Billion
Deferred Tax Asset
$1.0 Billion (6)
Common Equity – $10.5 Billion (1)
Preferred Equity – $0.125 Billion
Parent Debt – $1.0 Billion
Leucadia National Corporation Parent Capital – $11.6 Billion
Leucadia Asset Management (100%)
$708 Million
JETX Energy (98%)
$114 Million
Garcadia (~75%) $203 Million
Idaho Timber (100%) $78 Million
Berkadia (50%) $213 Million
Foursight (100%) $94 Million
Corporate Other, Net
$0.2 Billion
Folger Hill
54 Madison
Topwater Capital
Strategic Investments
CoreCommodity
Global Equity Events
Lake Hill
Tenacis
M Science (94%) $8 Million
SOLD
Leucadia Overview
Conwed (100%) SOLD Note: Dollar amounts are Leucadia’s net carrying amount as of 6/30/17 for each investment; for consolidated subsidiaries equal to their assets less liabilities and non-controlling interest. (1) Includes $2.5 billion of goodwill and intangibles. (2) Includes $1.9 billion of goodwill and intangibles. (3) Represents the initial cash outlay of $279 million reduced by cash receipts of $267 million as of 6/30/17. (4) Carrying amount is net of deferred gain on real estate sale. (5) Market value as of 6/30/17. (6) Represents the Leucadia net deferred tax asset; the Jefferies net deferred tax asset is reflected within the Jefferies book value presented.
(As of 6/30/17)
3

Jefferies recorded Net Revenues of $3.1 billion and Pre-Tax Income of $459 million for LTM 8/31/17
Jefferies is delivering solid results with lower risk and lower volatility
Poised to make further market share gains and increase operating margins
National Beef’s LTM 6/30/17 EBITDA(1) and Pre-Tax Income of $485 million and $380 million, respectively
National Beef has outperformed during the first two quarters of 2017 versus the prior year thanks to increasing cattle availability coupled with robust end-market demand
Leucadia Business Highlights
(1) These are Non-GAAP measures. See page 105 in Appendix for reconciliation to GAAP amounts. (2) Assumes 2015 adjusted for exceptional $5 billion single client Freddie Mac deal. (3) Based on Leucadia’s share of income. (4) Based on Automotive News 2016 rankings published in March 2017.
Berkadia recorded LTM 6/30/17 Cash Earnings(1) of $156 million and Pre-Tax Income of $205 million, representing a 50% pre-tax ROE
Originated $19.5 billion of new financings for clients in 2016, best year ever (2)
3rd largest U.S. Primary and Master Servicer
Garcadia recorded Pre-Tax Income of $58 million for LTM 6/30/17, representing a 21% pre-tax ROE (3)
4th largest private auto dealership group in the U.S. in 2016 based on new sales volume(4)
Idaho Timber recorded Pre-Tax Income of $23 million for LTM 6/30/17, representing a 30% pre-tax ROE
Overall housing demand continues gradual rebound from recessionary lows
Strategic focus on driving volume and production efficiency
4

JETX (formerly Juneau Energy) transitioned to non-operated strategy, now managed by the Vitesse team Focusing on joint ventures to pool and develop its Eastern Eagleford acreage with Lonestar Resources
and others as partners and operators
Vitesse continues to partner with leading operators in lower risk infill horizontal development drilling in the core areas of the Bakken Oil field that produce good economics at $45/bbl oil prices
Drilling costs have fallen 30-40% since 2015 while reserves in new wells in Bakken core have increased over 40%, the combination of which produces strong new well returns
$25 million of LTM 6/30/17 Adjusted EBITDA(1) with 89+ % of the company’s expected $2.0 billion of long-term cash flow net of capital expenditures still in the ground to be developed in the future
Last year closed acquisition of 31 drilled-but-not-yet-completed wells operated by EOG and located in the Denver-Julesburg (“DJ”) Basin that will boost overall production
Leucadia Business Highlights (Continued)
Through September 30, 2017, Leucadia has received total cash of $349 million from principal, interest and fees (including $61 million in the third quarter), with $67 million of the original $300 million term loan still outstanding which is accruing interest at 20.5% per annum. The book value of our interest was $303 million as of June 30, 2017
HRG Group’s underlying businesses are performing well and we are effectively unlocking value
HRG is exploring strategic alternatives with a view to maximizing shareholder value
HRG has agreed to sell FGL to CF Corp for $31.10 per share (16% above failed Anbang transaction)
The Village of Escaya, the first stage of Otay Ranch to be developed, hosted its grand opening this summer; in excess of 100 of the 992 planned homes are under contract and closings are scheduled to begin in December. The 273 planned apartments are scheduled to begin construction in November
The office space at Renaissance Plaza in Brooklyn will be debt-free at the end of 2018 and a sizeable tenant renewed their lease on favorable terms, allowing for refinancing opportunities; the hotel renovation was completed in 2016
Additional holdings in California, Florida, South Carolina and Virginia have significant underlying value
(1) This is a Non-GAAP measure. See page 109 in Appendix for reconciliation to GAAP amount. 5

In January 2017, closed a €100 million preferred equity financing at a €700 million pre-money valuation, including €50 million from new investor Blackrock (no further equity financing planned); €800 million post-money valuation equates to €427 million in value for the €258 million invested by Leucadia in Linkem
Fast-growing fixed wireless broadband provider, currently reaching ~60% of Italian households 455K subscribers as of 6/30/17; 66% compounded annualized subscriber growth rate since 2011 Positive Adjusted EBITDA since Q4 2014
Leucadia Business Highlights (Continued)
M Science is a data analytics provider that serves institutional investors and companies
Founded in 2002, M Science is the pioneer in utilizing data analytics for securities research; Leucadia purchased M Science in May 2016 from ITG
Focus on growing subscriber base and expanding product offering
Recently completed its 4th auto loan securitization; resulted in a AAA rating from DBRS & Kroll
Continues to drive market share and originations, while maintaining a disciplined approach to credit quality
Since its first gold pour in March 2016, the Soledad Mountain project has sold ~43,000 and ~310,000 ounces of gold and silver, respectively, through June 2017, generating revenue of $59 million and positive Adjusted EBITDA
Mining and processing activities are operating seven days per week
Leucadia Asset Management
Early in building foundation for a differentiated alternative asset management business Eight platforms operating today
6

Leucadia 2.0 versus Pre-2013
12/31/12 Versus 6/30/17 Significant Businesses & Investments (ex-Jefferies) 10(1) +90% 19(2)
Average Size of Divestitures / Investments $351 Million per Divestiture(3)
Increased Diversification
$184 Million per Investment(4)
Jefferies Business Model, Risk Metrics and Liquidity √ Further Enhanced √ Concentration Ratio x Diversified Risk √ Liquidity Ratio x Maintained Solid
Liquidity √ Leverage Ratio x Limited Leverage √ Jefferies Finance Commitment Ratios N/A
Consistent Risk Management √
Asset Management Foundation x LAM Launched and Diversified √
Speculative Projects (Sangart, Lake Charles) x No Material Speculation √
Non-Core Assets (Crimson, Real Estate, OLNG) x No Diversions √ Next Leucadia Maturity 2013 Six Years Away 2023
(1) Includes Berkadia, Conwed, Crimson, Garcadia, HomeFed, Idaho Timber, Inmet, Linkem, National Beef and Premier Entertainment. (2) Includes 54 Madison, Berkadia, CoreCommodity, Folger Hill, Foursight Capital, FXCM, Garcadia, Golden Queen, HRG Group, HomeFed, Idaho Timber, JETX Energy, Lake Hill,
Linkem, M Science, National Beef, Tenacis, Topwater and Vitesse Energy. (3) Includes Conwed, Fortescue Metals, Global Caribbean Fiber, Inmet, Keen Energy, Mueller, Premier Entertainment and TeleBarbados. (4) Includes 54 Madison, Folger Hill, Foursight, FXCM, Garcadia, Golden Queen, HRG Group, JETX Energy, Lake Hill, Linkem, M Science, Tenacis, Topwater Capital and Vitesse
Energy.
Since 2012, Leucadia’s risk profile has been significantly reduced through a highly conservative management approach, better diversification and monetization positioning, and continuing improvements to portfolio businesses
7

Leucadia 2.0 versus Pre-2013 – Detailed 2012 Versus Today
2012 Status Business Developments Status Today
-Performance Improved? -Subsidiary Level Balance Sheet Improved? -Asset Monetized?
Impr
oved
Per
form
ance
&
Val
ue C
reat
ion
Jefferies $2.8bn Adjusted Revenues (1) ⬆ $3.1bn LTM Revenues √
National Beef $155mm EBITDA(1) ⬆ $485mm LTM EBITDA(1) √
Berkadia $135mm of Cash Earnings (1) ⬆ $156mm LTM Cash Earnings(1) √
Garcadia $37mm Pre-Tax Income ⬆ $58mm LTM Pre-Tax Income √
Idaho Timber $12mm EBITDA(1) ⬆ $26mm LTM EBITDA(1) √
HomeFed $6mm Net Earnings ⬆ $16mm LTM Net Earnings √
Linkem 100k Subscribers ⬆ 455k Subscribers √
KCG $100mm Net Investment & $154mm
Net FMV Gain Value Realization No Net Investment & >$400mm in
Cumulative Revenues and Fees(1) (Virtu Sale) √
Opp
ortu
nist
ic I
nves
tmen
ts
Gen
erat
ing
Val
ue
(Min
imal
Goo
dwill
)
HRG NA Acquired at $10.21, $15.61 at 9/29/17 Sum-of-the-parts: $16.09 √
Vitesse & JETX NA Started At-Cost Positive Cash flow from Operating Activities √
FXCM NA Initial Investment Recouped, $67mm Remaining Note; Equity Upside
$45mm LTM Adj. EBITDA(1) √
LAM NA Started At-Cost Profitability expected in 2017 √
Foursight NA Started At-Cost $462mm Loan Portfolio √
Golden Queen NA Started At-Cost Commercial Production √
Mon
etiz
ed
Valu
e
Conwed $18mm EBITDA(1) Cash Proceeds of $295mm Sold √
Inmet Mining $116mm Growth in Fair Value Cash Proceeds of $732mm Sold √ Premier Entertainment
$13mm Pre-Tax Income Cash Proceeds of $250mm Sold √
Pru
dent
Man
agem
ent
& E
nded
Spe
cula
tion
Sangart $277mm Invested Terminated Project Over √ Lake Charles $146mm Invested Terminated Project Over √ LNG Development $75mm Invested Terminated Project Over √ Next Leucadia Maturity
Next Maturity in One Year (2013) Refinanced and Extended Next Maturity in Six Years (2023) √ Federal Income Taxes
Offset Cash Taxes on $3.6bn of Income Utilization of NOL Offset Cash Taxes on $2.6bn of Income √ Rating Agency Guidelines
NA Established and Followed Proven Commitment √ (1) These are Non-GAAP measures. See pages 102-111 in Appendix for reconciliation to GAAP amounts.
8

Leucadia Businesses’ Executive Management Experienced leadership, both at operating company level and with Leucadia’s Managing Directors
CEO – Justin Wheeler since 2014
(previously at Leucadia since 2000)
CFO – Randy Jenson since 2011
Rich Hander & Brian Friedman
Leucadia Board of Directors
Richard Handler, CEO (32 / 27) Brian Friedman, President (37 / 16)
Fixed Income Equities Investment Banking
Finance / Corporate Legal
Fred Orlan Global Head of Fixed Income
(31 / 3)
Pete Forlenza Global Head of
Equities (28 / 4)
Ben Lorello Global Head of IB & Capital Markets
(37 / 8)
Peg Broadbent Chief Financial
Officer (29 / 9)
Mike Sharp General Counsel
(35 / 7)
Nick Daraviras (23 / 16)
Jimmy Hallac (26 / 14)
George Hutchinson (37 / 10)
David Severn (11 / 10)
Leucadia Managing Directors
John Stacconi Global Treasurer
(31 / 6)
Paul Frean Chief Risk Officer
(34 / 8)
Matt Smith Chief Admin.
Officer ( 19 / 9)
Joseph S. Steinberg (47 / 39)
Linda L. Adamany (41 / 4)
Robert D. Beyer (33 / 5)
Francisco L. Borges (38 / 4)
W. Patrick Campbell (36 / 5)
Robert E. Joyal (36 / 5)
Jeffrey C. Keil (50 / 14)
Michael T. O’Kane (32 / 5)
Stuart H. Reese (32 / 5)
CEO – Davide Rota since inception (2001)
CFO – Massimo Ballerini since 2013
President and CEO – Ted Ellis since 2005
(with company since 1990) CFO – Scott Beechie
since 2006 (with company since 1999)
President and CEO – Mark Miller since inception (2012) CFO – Cory Goodfellow since inception (2012)
CEO – Brett Hopkins since inception (2006)
CFO and President – Phil Johnson since inception (2006)
CEO – Robert Walish since 2015
CFO – Guy Le Bel since 2017
CEO and President – Tim Klein since 2009
(with company since 1991) CFO – Simon McGee
since 2011 (with company since 2006)
CEO – Brendan Callan since 2017
(with company 2001) CFO – Robert Lande
since 2010
President – Paul Borden since 1988
CFO – Erin Ruhe since 1999
CEO – Joseph S. Steinberg since 2017
CFO – George Nicholson since 2016
Jefferies Board of Directors
Joseph S. Steinberg (47 / 10)
Barry J. Alperin (51 / 4)
W. Patrick Campbell (36 / 18)
Richard G. Dooley
(36 / 24)
MaryAnne Gilmartin (31 / 4)
Richard Handler, CEO (32 / 27) Brian Friedman, President (37 / 16)
Jacob Katz
(43 / 1)
* (Years of Experience / Years at Jefferies or Leucadia)
CEO – Bob Gerrity since inception (2014)
CFO and President – Brian Cree since inception (2014)
CEO – Andreas Rouvé since 2014
CFO – Douglas Martin since 2014
CEO – Chris Littlefield since 2014
CFO – Dennis Vigneau since 2016
9

Two Q & A’s – [email protected]

10

Note on Adjusted Financials
Note on the Use of Non-GAAP Financial Measures to Show Results Exclusive of the Bache Futures Business:
In 2015, Jefferies exited its Bache futures business. Jefferies has supplemented certain of its financial disclosures to show results that exclude the Bache futures business. These supplemental financial measures begin with information prepared in accordance with U.S. GAAP and are adjusted to exclude the operations of the Bache futures business. These adjusted financial measures are non-GAAP financial measures. Management believes such measures, when presented in conjunction with comparable U.S. GAAP measures, provide meaningful information as it enables investors to evaluate results in the context of the exit of the Bache futures business. These measures should not be considered a substitute for, or superior to, financial information prepared in accordance with U.S. GAAP.
Reconciliations of these non-GAAP financial measures to U.S. GAAP financial measures are contained throughout this presentation and on pages 102-103 of the Appendix.
11

Jefferies Overview
12

Strong earnings momentum over the last 18 months, with potential for further growth and margin expansion
We continue to build a leading, client-focused global investment banking firm, seeking to provide clients with the best ideas, expertise and execution
Our competitive position has strengthened further, as several major competitors have experienced challenges and may face a near-term inflection point, which may lead to further industry consolidation, creating additional market share growth opportunities for Jefferies
Investment Banking business continues to broaden, and we continue to strengthen and expand our team
Equities is recording growth in market share that should accelerate
Fixed Income is delivering meaningfully improved performance, with increased capital efficiency and lower risk, after successful efforts to enhance the team, refocus the business and reduce risk, balance sheet and capital utilization
─ Firm-wide assets of $39.4 billion as of August 31, 2017, down from $44.1 billion as of May 31, 2015
─ Fixed Income assets of $19.5 billion as of August 31, 2017, down from $22.5 billion as of May 31, 2015
Our priorities are revenue growth and margin expansion, while maintaining our discipline around liquidity and risk management
─ Revenue growth being led by Investment Banking maturation and new hires, as well as Equities and Fixed Income market share gains as capabilities strengthen and competitors reshuffle
─ Margin expansion will be achieved over time with active outsourcing efforts, further automation and net revenue growth reducing operating expenses as a percent of net revenue, and net revenue growth will allow compensation ratio to be reduced
─ Digitalization effort focused on leveraging technology and innovation to help increase both revenue and efficiency
Jefferies Update
13

Jefferies Strategic Priorities
Investment Banking
Continue to increase the productivity of the sector MDs we have hired since January 2016
Drive market share gains in M&A by further expanding our sell-side franchise and continuing to increase the average size of our M&A transactions
Increase our strong market share in financial sponsor investment banking
Selectively enter new industry sub-sectors, taking advantage of high quality investment bankers available because of the ongoing disruption at several of our competitors
Equities
Key product opportunities: further penetration in Global Cash & Electronic Trading and Cross-Selling across Non-Cash Products (including Prime Brokerage, Options, Convertibles and Swaps)
Differentiation through focus on building a competitively unique and alpha-generating client offering, such as event-driven strategies, data science and bespoke corporate access
Fixed Income
Capitalize on our realigned, client-focused Fixed Income platform to deliver consistent recurring revenues
Continue to focus on core businesses and lever our Investment Banking and Equity platforms
Optimize resources and capital to maximize returns
Note: Jefferies will release additional details about its third quarter 2014 results on September 16, 2014. These preliminary results are being release in advance of Jefferies’ normal earnings release schedule in light of the Leucadia Investor Meeting to be held on September 3, 2014. Actual fiscal third quarter 2014 results may differ from these preliminary estimated results, either positively or negatively, in connection with normal and customary quarterly closing processes for valuations and revenue and expense accruals.
14

Jefferies Operating Results
15

Jefferies Adjusted Earnings Overview(1)
Note: As reported in Jefferies’ public filings. (1) The adjusted financial measures presented herein are non-GAAP financial measures and represent Jefferies results of operations excluding the impact of the results of
operations of the Bache business for 2015. See Appendix on pages 102-103 for a reconciliation to GAAP measures.
FYE Nov. 30, LTM($ Millions) 2015 2016 8/31/17
Equities 757 550 781
Fixed Income (Adjusted) 191 640 673
Trading 948 1,190 1,454
Equity 408 235 285
Debt 398 305 603
Capital Markets 807 540 888
Advisory 632 654 763
Investment Banking 1,439 1,194 1,651
Asset Management 8 31 13
Adjusted Net Revenues 2,395 2,415 3,117
Non-Compensation Expenses (Adjusted) 767 816 857
Compensation and Benefits (Adjusted) 1,379 1,569 1,801
Adjusted Total Expenses 2,146 2,385 2,658
Adjusted Earnings Before Tax & Non-Controlling Interest 249 30 459
16

Jefferies Group LLCBalance Sheet as of 8/31/2017
Assets Liabilities and EquityCash & Cash Equivalents 4,807$ Short-term Borrowings 417$ Cash & Securities Segregated 904 Financial Instruments Sold, Not Yet Purchased 8,461 Financial Instruments Owned 14,037 Securities Loaned 2,763 Investments in Managed Funds 170 Securities Sold Under Agreements to Repurchase 8,473 Loans to and Investments in Related Parties 898 Other Secured Financings 553 Securities Borrowed 7,759 Payables to Brokers, Dealers and Clearing Organizations 2,648 Securities Purchased Under Agreements to Resell 3,371 Payables to Customers 2,460 Receivables from Brokers, Dealers and Clearing Organizations 2,566 Accrued Expenses and Other Liabilities 1,479 Receivables from Customers 1,292 Long-term Debt 6,450 Fees, Interest and Other Receivables 344 Total Liabilities 33,703$ Premises and Equipment 291 Goodwill 1,643 Jefferies Group LLC Member's Equity 5,654 Other Assets 1,278 Noncontrolling Interests 1
Total Equity 5,655$
Total Assets 39,358$ Total Liabilities and Equity 39,358$
Leverage: (1) 7.0xTangible Gross Leverage: (2) 9.8xLevel 3 Financial Instruments as % of Total Financial Instruments: 2.5%VaR Average 9M 2017: $8.6 million
Balance Sheet Overview As of August 31, 2017 ($ Millions)
(1) Leverage ratio equals total assets divided by total equity. (2) Tangible gross leverage ratio (a non-GAAP financial measure) equals total assets of $39,358 million less goodwill and identifiable intangible assets of $1,841 million divided by
tangible Jefferies Group LLC member's equity of $3,813 million. Tangible Jefferies Group LLC member's equity represents total Jefferies Group LLC member's equity of $5,654 million less goodwill and identifiable intangible assets of $1,841 million. The tangible gross leverage ratio is used by rating agencies in assessing our leverage ratio.
17

Historical Quarterly Leverage (1) ($ Millions)
Disciplined Approach to Risk
(1) Tangible gross leverage ratio and tangible gross assets are non-GAAP financial measures. Tangible gross leverage ratio equals tangible g ross assets divided by
tangible Jefferies Group LLC member's equity. Tangible gross assets equals total assets less goodwill and identifiable intangible assets. Tangible Jefferies Group LLC member's equity represents total Jefferies Group LLC member's equity less goodwill and identifiable intangible assets. The ta ngible gross leverage ratio is used by rating agencies in assessing our leverage ratio. See Appendix on page 104 for a reconciliation to GAAP measures.
Jefferies has a long-standing policy of carefully managing balance sheet leverage
In periods of stress, Jefferies has demonstrated the ability to rapidly reduce leverage without unduly impacting our business
5.0x
6.0x
7.0x
8.0x
9.0x
10.0x
11.0x
12.0x
13.0x
$-
$10,000
$20,000
$30,000
$40,000
$50,000
Tangible Gross Assets Leverage
18

Level 3 Financial Instruments Owned (1) as a Percentage of Tangible Jefferies Group LLC Member’s Equity (2) ($ Millions)
Level 3 Financial Instruments Owned (1) as a Percentage of Financial Instruments Owned ($ Millions)
97% of inventory is Levels 1 and 2, with a minimal amount of Level 3 Trading Assets (1)
Level 3 Trading Assets (1) represent only 10% of tangible common equity
Level 3 Trading Assets (1) of $365 million at 2/28/17 down from $540 million at 5/31/15
Disciplined Approach to Risk (Continued)
(1) Note: In May 2015, the Financial Accounting Standards Board issued Accounting Standards Update No. 2015-07, "Fair Value Measurement (Topic 820) - Disclosures for Investments in Certain Entities That Calculate Net Asset Value per Share (or Its Equivalent)." Jefferies has adopted this guidance retrospectively during the second quarter of fiscal 2015.
(2) Tangible Jefferies Group LLC member's equity (a non-GAAP financial measure) represents total Jefferies Group LLC member's / common stockholders' equity less goodwill and identifiable intangible assets. See Appendix on page 104 for a reconciliation to GAAP measures.
98% of inventory is Levels 1 and 2, with a minimal amount of Level 3 Trading Assets (1)
Level 3 Trading Assets (1) represent only 9.1% of tangible Jefferies Group LLC member’s equity
Level 3 Trading Assets (1) of $348 million at 8/31/17 down from $540 million at 5/31/15
2.8% 2.9% 2.5% 3.3% 3.6% 2.9% 3.0% 3.0% 2.8% 2.2% 2.5%
0.0%
2.0%
4.0%
6.0%
8.0%
10.0%
1Q 15 2Q 15 3Q 15 4Q 15 1Q 16 2Q 16 3Q 16 4Q 16 1Q 17 2Q 17 3Q 17
15.3% 15.1% 13.2% 15.0% 14.4% 12.6% 12.5% 11.7% 10.1% 8.3% 9.1%
0%
10%
20%
30%
40%
1Q 15 2Q 15 3Q 15 4Q 15 1Q 16 2Q 16 3Q 16 4Q 16 1Q 17 2Q 17 3Q 17
19

Jefferies Business Review
20

Investment Banking
21

Investment Banking – Overview
Jefferies Investment Banking is a leading advisor and underwriter to our clients globally
789 investment bankers with deep sector expertise and extensive experience across major industry verticals
On-the-ground presence in 13 countries across the world
74% of our LTM revenue was from repeat clients
Sector Focus
Consumer
Investment Banking & Capital Markets
Energy
REGAL
Public Finance
Regions
Americas
Product Capabilities
Restructuring
Healthcare
TMT
Financial Services
Industrials
Debt Capital Markets
Equity Capital Markets
Mergers & Acquisitions
EMEA
Asia Financial Sponsors
22

Investment Banking – Sector and Regional Footprint We have continued to expand into new sub-sectors and geographies, adding 44 managing directors since January
2016, including
─ 34 client coverage bankers, 28 of which are sector-focused managing directors across six of our eight major industry verticals
─ 10 product-focused managing directors across Mergers and Acquisitions, Leveraged Finance, Equity Capital Markets, and Private Financing
─ Among our 44 new managing directors, 15 are regional and global business leaders across both the United States and Europe
Consumer and Retail ─ Consumer Products ─ Food & Beverage ─ Retailing ─ Restaurants
Technology, Media & Telecom ─ Entertainment & Broadcast ─ Internet & Telecom Infrastructure ─ Payments & Processing ─ Semiconductors & Hardware ─ Software ─ Technology & Information Services
Financial Services ─ Broker Dealers & Market Structure ─ Insurance ─ Specialty Finance
Note: Green Represents New Hires at the Regional or Global Leadership Level Since 1/1/16
Healthcare ─ Biotechnology ─ Healthcare IT ─ Healthcare Services ─ Managed Care ─ Medical Devices ─ Pharmaceuticals
REGAL ─ Real Estate ─ Gaming ─ Lodging
Financial Sponsors Public Finance
Energy ─ Oil & Gas Exploration ─ Oil & Gas Midstream ─ Oil Field Services
Industrials ─ Aviation, Aerospace & Defense ─ Automotives ─ Automotive Aftermarket ─ Building Materials ─ Business Services ─ Capital Goods ─ Chemicals ─ Industrial and Distribution Services ─ Infrastructure ─ Maritime ─ Metals & Mining ─ Paper & Packaging ─ Power & Renewables
Expansion of Sector Presence
23

Investment Banking Net Revenues
$1.5 $1.4 $1.2
$0.8
$1.2
$0.0
$0.5
$1.0
$1.5
$2.0
Equity Capital Markets Debt Capital Markets Advisory
Investment Banking – Performance and Market Update Our investment banking net revenue for the 9 months of fiscal 2017 increased 59% compared to the same period in 2016
Our Q3 2017 net revenue was the highest quarterly performance in the history of our firm
Our performance was driven by significant revenue increases across all major product areas: Leveraged Finance, M&A, and ECM, resulting in our market share increasing across the U.S. and Europe
Revenue from both M&A and Leveraged Loans were at record levels for our firm, driven by a significant increase in larger transactions
─ In M&A, we closed 32 $1 billion+ M&A transactions in the first 9 months of fiscal 2017, a 68% increase over the same period in 2016
─ In Leveraged Finance, we acted as lead arranger on 35 $1 billion+ Leveraged Loan transactions in the first 9 months of fiscal 2017, a 250% increase from the same period in 2016
Note: As reported in Jefferies’ public filings.
($ Billions)
24

Jefferies Finance – Overview
Total Arranged Deal Volume
($ Billions)
Jefferies Finance, our corporate lending joint venture with Massachusetts Mutual Life Insurance Company, continues to grow steadily and prudently
─ Established in 2004, Jefferies Finance has demonstrated growth and resilience across multiple business cycles
Well-balanced business model with multiple revenue streams, including underwriting and arrangement fees, direct middle market lending investments and broadly syndicated loan investments
Jefferies Finance has built a highly successful franchise arranging leveraged loans for distribution to the capital markets
─ Significant growth in arranged loans, with modest balance sheet expansion
Since inception, Jefferies Finance has successfully syndicated over 98% (1) of $82 billion of commitments
Jefferies Finance’s strategy will remain focused on growing market share in its core U.S. and European underwriting business as well as further expanding into middle market direct lending, which represents a significant growth opportunity
(1) Successful syndications include transactions in which intended principal was fully syndicated during the primary marketing period.
$3.8 $7.7
$11.6
$21.1 $23.4 $21.4
$17.0
$40.9
40
64 69
118 132
101
80
158
-11M 2010 2011 2012 2013 2014 2015 2016 LTM Q3 2017
Committed Best Efforts # of Deals
Since inception, Jefferies Finance has arranged $145 billion of deal volume, including $82 billion of committed volume
$3,816 $7,689 $11,638
$21,136 $23,375 $21,419 $16,987
$40,858
40
64 69
118 132
101 80
158
-11M 2010 2011 2012 2013 2014 2015 2016 LTM Q3 2017
Arranged Volume # of Deals
25

Investment Banking – Strategic Priorities
Continue to increase the productivity of our sector MDs
─ In LTM 8/31/17, our revenue per sector MD increased by 45% year-over-year, and is at its highest level ever for our firm
Capitalize on revenue opportunities in recently entered and enhanced sectors
Drive market share gains in M&A by further expanding our sell-side franchise and continuing to increase the average size of our M&A transactions
Increase our strong market share in financial sponsor investment banking
─ We rank 2nd in M&A market share YTD among all investment banks for financial sponsor transactions in the U.S. and 3rd across the U.S. and Europe
─ We rank 2nd in Leveraged Finance market share YTD among all investment banks for financial sponsor transactions in the U.S. and 4th across U.S. and Europe
Selectively enter new industry sub-sectors, taking advantage of high quality investment bankers available because of the ongoing disruption at several of our competitors
─ Our expansion priorities are Industrials, Consumer and Infrastructure in both the U.S. and Europe, and Financial Services in the U.S.
26

Equities
27

Equities – Overview Global Equities at Jefferies is a leading client franchise that continues to grow strategically and gain market share. With sales,
trading and advisory capabilities across North America, Europe and Asia, and with major trading hubs in New York, London and Hong Kong, we are well-equipped to serve our global clients across all products and regions
Jefferies has strong client-offerings across Cash Equities, Electronic Trading, Listed Equity Derivatives, Convertibles, Prime Services and Equity Capital Markets
Our core U.S. Equity Sales & Trading business was a pioneer in the evolution of block trading more than 50 years ago
We continue to focus on trading execution, as well as providing our clients with best-in-class alpha-generating advisory
Asia Pacific
Cash Equities
Americas
Equity Derivatives
EMEA
Global Equities
Electronic Trading
Capital Markets
Equity Derivatives
Electronic Trading
Capital Markets
Electronic Trading
Convertibles Research
Research Research
Convertibles Convertibles
Prime Services Prime Services
Prime Services Investment Companies
Capital Markets
Cash Equities Cash Equities
28

80% 75%
70% 70% 69% 66%
14% 18%
21% 19% 21% 23%
6% 7% 9% 11% 9% 11%
2012 2013 2014 2015 2016 2017
Americas Europe Asia
Equities – Business Expansion & Development Regional Sales & Trading Revenue Contribution:
Growing our Global Franchise
Note: Revenue excludes Equity Capital Markets .
Expanding and Developing our Global and Cross-Product Businesses
A core strategy for our Global Equities business has
been to expand and grow across products and regions
─ International Cash: We have more than doubled
our European Cash business since 2012. In Asia, we have nearly tripled our Cash business since 2012 through a focus on our co-branded partnerships and a build-out of Japanese Equities
─ Global Electronic Trading: We have nearly tripled our Global Electronic Trading business since 2012 and are focused on continuing to grow
─ Prime Services: We have become one of the
preferred Prime Brokers for Emerging Managers and have grown our Prime Services business by nearly 40% since 2012
─ Global Convertibles: With a market-leading Convertibles business, we are focused on replicating our U.S. strength in Europe and Asia
2017 International S&T Revenue:
34%
2012 International S&T Revenue:
20%
YTD 2017
29

Equities – Performance Update
Most of our Sales & Trading businesses are on pace to increase revenue versus 2016 including: Global Cash, Global Electronic Trading, Prime Services and Global Convertibles. All of our businesses have great potential to grow in 2018 and beyond
While the Global Cash & Electronic market wallet declined in 2017, Jefferies is achieving record market share across its U.S., European, and Asian businesses. We continued our momentum in our Global Cash & Electronic business and are a top 5 market share gainer
We are focused on increasing product capabilities and deepening client relationships in our core Sales & Trading businesses. We continued our focus on growing our European and Asian businesses and expanding our client footprint across a number of cross-product businesses
30

Equities – Momentum in our Core Businesses
2017
5 Years Ago
2017
5 Years Ago
U.S. Convertibles
U.S. Electronic Trading Institutional Investor
Equity Research
Ranked 10th; Less
than 5% Share
Derivatives
Top 8; 6%+ Share
Not in Top 10
Ranked 2nd;
11.1% Share
159 Bps Growth since 2012
Ranked 1st in Sales,
Trading
Not in Top 10
Ranked 3rd in II
Ranked 2nd with Large Clients
8 Ranked Analysts
15 Ranked Analysts
Only U.S.
Ranked
U.S. and
Europe Ranked
1,534 Stocks Covered
2,800+ Stocks Covered
No Co-Branded Markets in Asia
9 Add’l Markets in Asia (861
Stocks)
Our Evolution into a Global, Full-Service, Leading Equities Platform
2017 Business Growth
Regional and Product Growth
In 2017, we continued to grow across regions and products including:
─ Co-Branded Partnership: Focusing on this low-cost strategy in Asia with 9 additional markets (861 stocks)
─ Global Swaps Capabilities: Growing the franchise with a focus on client breadth and cross-selling across existing clients
─ Geographic Footprint: Growing our geographic reach across advisory and execution capabilities
Differentiated and Unique Offering
In 2017, we continued our focus on our differentiated and unique product offering including:
─ Event-Driven Strategies
─ Data Science
─ Intelligent Liquidity Solutions
Note: U.S. and U.K. Cash & Electronic and Derivatives market share sourced from third-party survey. U.S. and U.K. Cash excludes Program Trading. Convertibles market share sourced from Greenwich Associates.
U.K. Cash & Electronic U.S. Cash & Electronic
Ranked 13th
Within the Top 10 at
Rank 9
Ranked 14th
Within the Top 10 at
Rank 9
31

0.47% 0.54%
0.81% 1.00%
1.12% 1.28%
2012 2013 2014 2015 2016 2017A
Equities – Market Share Update Jefferies has significantly increased market share post-financial crisis
Growth largely driven by our client focus, enhanced global capabilities, and the momentum of the overall Jefferies platform
We have considerably diversified our business, with electronic trading and international markets having grown to represent a significant proportion of Equities revenues and we continued to diversify our regional and product capabilities in 2017
Consistent Growth in our Global Cash & Electronic Businesses
Note: The Cash & Electronic market share is sourced from a third-party survey and excludes Program Trading. The U.S. Listed Options market share is also sourced from a third-party survey. Convertibles metrics are sourced from Greenwich Associates.
2.50% 2.88%
3.19% 3.56%
3.98% 4.36%
2012 2013 2014 2015 2016 2017A
2.27% 2.30% 2.99%
3.29% 3.42% 3.86%
2012 2013 2014 2015 2016 2017A
Market Share
Market Rank
U.S. (Record Market Share and Top 10 Rank)
U.K. (Record Market Share and Top 10 Rank)
Asia (Record Market Share and Rank)
13th 11th 10th 10th 10th 9th
14th 14th 10th 10th 10th
9th
21st 22nd 19th 18th
17th
16th
Strength, Stability and Historical Growth in our Non-Cash Businesses
U.S. Options (6%+ Market Share and Top 10 Rank)
4.74% 6.02%
6.63% 7.87% 7.33%
6.33%
2012 2013 2014 2015 2016 2017A
10th 9th 9th
6th 7th 8th
U.S. Convertibles (Record Market Share and 2nd Ranked)
10th 9th 9th
6th 7th 2.50% 2.70%
8.60% 10.40% 11.10%
2012 2013 2014 2015 2016
11th 11th
5th 4th
2nd 1.48% 1.66%
2.04% 2.25%
2.59% 2.82%
2012 2013 2014 2015 2016 2017A
Pan-Europe (Record Market Share)
17th 17th 16th
13th 13th 13th
2017 Annualized
2017 Annualized
2017 Annualized
2017 Annualized
2017 Annualized
32

Equities – Strategic Priorities
Growing Non-Cash Business
Our focus is on product and revenue diversification by cross-selling and leveraging client relationships across Electronics, Listed and OTC Derivatives, ETFs, Prime Brokerage, and Securities Finance & Swaps
─ Electronic: Continuing to innovate across our algorithmic trading capabilities and offering clients customized trading solutions
─ Prime Brokerage: Growing our Prime business by capitalizing on the U.S. opportunity to serve mid-market clients that are underserved by large bank holding companies as well as becoming the complimentary 2nd or 3rd prime broker to larger clients
─ Swaps: Increase client breadth and continue onboarding new client relationships to grow our global Swaps business
─ Derivatives: Maintaining our strong market share position in U.S. listed options while cross-selling OTC derivatives and growing our Corporate Derivatives business
Continuing the Enhancement of Our Alpha-Generating Research Offering
Focus on improving our global equity research footprint and continue to enhance our product by using primary data
Continuing the Momentum in our Core Global Cash Business
Increase the global penetration in the Cash product by leveraging the relationship strength in one region to cross-sell our capabilities in other regions
Continue our execution focus with clients by being a primary liquidity provider for blocks
Growing our Differentiated and Unique Advisory for Clients
Increase client awareness and penetration regarding our differentiated and unique product offering including event-driven strategies, data-science consulting, and bespoke corporate access
33

Fixed Income
34

Fixed Income – Overview
*Hires made at leadership level since 1/1/15 *Hires made at leadership level since 1/1/15
Jefferies serves clients across all major cash products in the U.S. and Europe ─ 435 sales, trading, capital markets, research and strategy professionals globally
─ Primary Dealer or equivalent in U.S., U.K., Germany, Netherlands, Portugal and Slovenia
─ Focused on providing best-in-class ideas, facilitation and execution to our clients ─ Global presence with offices in North America, Europe and Asia
Denotes Key Hires / Coverage* Fixed Income
Emerging Markets
Capital Markets
Global Sales & Trading
Municipal Securities
Sales & Trading
Capital Markets
Investment Grade
Capital Markets
U.S. Corporates Sales & Trading
International Sales & Trading
Leveraged Finance
U.S. Sales & Trading
International Sales & Trading
Distressed
Global Rates
U.S. Treasuries
U.S. Agencies
European Government
Bonds
U.S. & Euro Repo Financing
European Supras & Agencies
Covered Bonds
Securitized Markets
Global CDO/CLO
Global ABS
Global MBS
Global CMBS
Marketplace Lending
Global Capital Markets
Foreign Exchange
Global Sales & Trading
Capital Markets Global
Structured Solution
Repositioned franchise starting in late 2015
─ Focused resources on businesses with best opportunities
─ Added 88 new senior team members (MDs and SVPs) across most businesses since January 2015
─ Emphasis on liquid, high-turnover inventory
35

67% 86% 93%
2015 2016 YTD 3Q17
% Profitable Trading Days (5)
More consistent revenues on lower cost, balance sheet, capital and risk
Fixed Income – Repositioned and Refocused
(1) Adjusted quarterly Fixed Income Net Revenues excluding Bache. (2) Period End Fixed Income Balance Sheet. (3) Period End Headcount with 2Q15 adjusted to exclude Municipal Public Finance. (4) Quarterly Interest Rate VaR as presented in Jefferies public filings. (5) Based on daily sales & trading revenues.
Fixed Income Sales & Trading Revenues (1)
10-Q may not be published by 10/5 ID. Otherwise use 2Q17 with -13% drop
Adjusted Fixed Income Sales & Trading Revenues (1)
$77 $118
($14) $10 $57
$238 $195 $149
$222 $159 $143
($50)
$150
$350
PF 2Q15 3Q17
Headcount (3)
2Q15 3Q17
Interest Rate VaR (4)
2Q15 3Q17
Balance Sheet (2)
Q3 2015 Q3 2017
36

Fixed Income – Performance Update
The realignment of resources that began in late 2015 is yielding more consistent revenues and returns
Jefferies Fixed Income is focused on sales and trading of cash products in credit, rates and foreign exchange markets globally
Fixed Income Net Revenues; No Credit for Investment Banking Origination and Distribution
(1) 2015 is presented as an adjusted non-GAAP financial measure that represents Jefferies results of operations excluding the impact of the results of operations of the Bache business. See Appendix on pages 102-103 for a reconciliation to GAAP measures.
($ Millions)
Q1 Q1
Q1 Q2 Q2
Q2
Q3
Q3 Q3
$181
$491 $524
2015 2016 2017
9M 2016
(1)
9M 2015
9M 2017
37

Fixed Income – Market Share Growth
Ranked #4 in EM credit market share, up from #12 in 2016
Ranked #4 for Top 3 relationships (by share)
#1 Dealer for Most Helpful Traders, with #1 and #2 ranked Traders
#2 Dealer for Most Helpful Analysts, with 4 of our Analysts in the Top 10
Emerging Markets:
─ MarketAxess – Dealer Volume Ranks as of Q1 2017
#2 LatAm Overall
#3 Global EM
#4 CEEMEA
Investment Grade Corporates:
─ Ranked #13 dealer by MarketAxess in trade volume and
market share as of July 2017
(1) Source: 2017 Greenwich Survey, US Fixed Income results. (2) Source: IFR Markets/Thomson Reuters (through 3/31/2017). (3) Source: Bloomberg (through 6/30/2017).
Jefferies voted #1 most positive business momentum in US Fixed Income (1)
Clients expect to do more business with Jefferies in the next 6 to 12 months
Electronic Trading Platform Highlights
Emerging Markets (1)
A top-2 underwriter of Ginnie Mae Commercial Mortgage-Backed Securities for the last 8 years (2)
#3 underwriter of US CLO Resets for 1st Half 2017 (3)
#5 underwriter of US Broadly Syndicated CLO New Issues plus Resets (3)
Securitized Markets
Leveraged Loan Primary Market ranked #2 overall, up from #10 in 2016 (6)
Ranked #10 in market share for secondary HY Cash Bonds (1)
Ranked #9 in market share for distressed debt (1)
Leveraged Finance
Top 5 market share in 13 months-5 years and 5-10 year maturities (5)
Municipals
Top 2 Primary Dealer in Dutch Treasury Bonds since 2016 (4) Top 5 market share Federal Agency Discount Notes (5)
Rates
Ranked #11 in secondary IG market share (1)
Investment Grade Corporates
US Clients Ranked Jefferies as a Top 10 Trading Counterparty, up from #12 (1)
(4) Dutch State Treasury Agency, 2016 - 2017. (5) Source: FedStats Market Share (4/1/17 to 6/30/17). (6) Source: Dealogic, rankings by proceeds (1/1/17 to 8/31/17 vs. full year 2016).
38

2016 vs. 2014 (%∆)
1H17 vs. 1H16 (%∆)
Asset Manager +4% +7%
Hedge Fund -13% +31%
Banks / Brokers -4% +1%
Other +16% +40%
Corp / Insurance / Pension
+11% +3%
1H 2017 Fixed Income Sales Credit by Client Segment
Asset Manager 47%
Hedge Fund 19%
Banks / Brokers 14%
Other (1) 11%
Corp / Insurance / Pension
9%
1H 2017 Fixed Income Sales Credit by Client Segment
(1) Other includes governments and central banks
“Clients First–Always”
Market share improvements leading to increased volumes across client strategies
Global Fixed Income up 13% in 1H17 vs. 1H16
(1)
Fixed Income – Client Trends
39

Fixed Income – Strategic Priorities
Drive consistent results by continuing to emphasize our long-standing client centric strategy
Building deeper partnerships with targeted clients
Highly productive balance sheet with emphasis on high turnover inventory
Reinvigorated focus on technology that drives productivity, enhances client connectivity and is integrated throughout the firm
Relentlessly focus on capital efficiency and cost containment
40

Risk Management
41

Risk Principles
Jefferies' comprehensive risk management framework has been a foundation for our success across market cycles
Culture
─ We are all Partners at our firm, collectively building for the long-term on a foundation established over 50+ years
Hands-on
─ Our senior management and Board are deeply involved in the “nuts and bolts” of how and where we are taking risks across the firm
Integrated
─ Our independent risk management group and our business leaders are deeply integrated into our trading desks, ensuring a clear and comprehensive view of the firm’s risk
Asset Quality
─ Jefferies is dedicated to serving our clients in liquid, transparent products. We limit illiquid assets and derivatives to ensure the overall liquidity and health of our balance sheet
42

Note: Dotted lines represent communication lines.
Risk Management Summary Framework
Jefferies Group Board of Directors
Firmwide Committees
Independent Price
Verification New Business
Business Line Committees
Market Risk Management
Credit Risk Management
Operational Risk
Management
Underwriting Acceptance
Audit Firm Management Compensation Corporate
Governance and Nominating
Executive Operating Risk Management
Asset / Liability
Chief Risk Officer / Global Treasurer
Capital and Liquidity
Margin Oversight
43

VaR Report
0
5
10
15
VaR
Quarterly VaR Average ($Millions)
Avg. VaR related to KCG
Avg. Firmwide VaR Excl. KCG
VaR Excl. KCG moving average
0
5
10
15
2015 2016 2017
VaR
Annual VaR Average ($ Millions)
Avg. VaR related to KCG
Avg. Firmwide VaR Excl. KCG
VaR Excl. KCG moving average
9M 2017
44

VaR Report and Trading Revenues
(1) Historically, Jefferies has presented Distribution of Daily Net Trading Revenues including KCG Holdings. KCG was sold in July 2017. (2) Number of Breaches represents the number of days during a given period where net trading losses were greater than VaR estimates.
Distribution of Daily Net Trading Revenues (Excluding KCG Holdings) (1)
0
20
40
60
80
100
120
<(8) (8)-(4) (4)-(0) 0-4 4-8 8-12 12-16 16-20 >20
# of
Day
s
$ Millions
2015 2016 9M 2017
Historical Negative Trading Revenues Days
2015 2016 2017
Q1 Q2 Q3 Q4 Q1 Q2 Q3 Q4 Q1 Q2 Q3
Negative Trading Rev. Days ex. KCG 9 5 18 23 12 1 4 4 3 4 3
Total Number of Negative Trading Rev. Days: 11 10 21 22 17 2 8 11 3 3 3
Number of Breaches(2) - - 2 - 2 - - 1 - - -
45

Capital and Liquidity Management
46

Liquidity and Funding Principles
Jefferies’ long-standing liquidity and funding principles have maintained the strength and soundness of our platform across market cycles
Owning inventory that is composed of liquid assets that turn over regularly, with Level 3 assets at 2.5% of inventory as of 8/31/2017
Maintaining a sound, long-term capital base and reasonable leverage relative to our business activity
No material reliance on short-term unsecured funding or customer balances. No commercial paper program
Short-term secured funding that is readily and consistently available through clearing houses, or fixed for periods of time that exceed the expected tenure of the inventory they are funding
Assessing capital reserves and maintaining liquidity to withstand adverse changes in the trading or financing markets and a firm specific idiosyncratic stress
Where appropriate, entering into partnerships and joint ventures with complementary long-term partners to pursue business opportunities that otherwise may exceed our capital capacity or risk tolerance (Jefferies Finance, Jefferies LoanCore)
47

Limited Leverage Jefferies has a long-standing policy of carefully managing balance sheet leverage
In periods of stress, Jefferies has demonstrated the ability to rapidly reduce leverage without unduly impacting our business
(1)
Historical Quarterly Leverage (1) ($ Millions)
5.0x
6.0x
7.0x
8.0x
9.0x
10.0x
11.0x
12.0x
13.0x
$-
$10,000
$20,000
$30,000
$40,000
$50,000
Tangible Gross Assets Leverage
(1) Tangible gross leverage ratio and tangible gross assets are non-GAAP financial measures. Tangible gross leverage ratio equals tangible gross assets divided by
tangible Jefferies Group LLC member's equity. Tangible gross assets equals total assets less goodwill and identifiable intangible assets. Tangible Jefferies Group LLC member's equity represents total Jefferies Group LLC member's equity less goodwill and identifiable intangible assets. The ta ngible gross leverage ratio is used by rating agencies in assessing our leverage ratio. See Appendix on page 104 for a reconciliation to GAAP measures.
48

Fundability of Collateral
Liquid, easy to fund collateral. 91% Tier 1 or Tier 2 collateral funded with average haircuts of 5% or below. Tier 3 average haircut of 12%
100 lenders providing liquidity for Tier 2, 3 and 4 collateral with the largest lender at only 9% of the total
Less than 1% of inventory deemed Tier 4 with an average haircut of 20%
Tier 1: CCP Eligible 65%
Tier 2: Agency CMO's, IG Fixed Income, Listed
Equities 26%
Tier 3 Non-IG Fixed Income, Convertibles, Mortgage Whole Loan
8%
Tier 4: Corporate Loans, Distressed Debt and
Equities, Investments, CLO/CDO Equity
1%
49

Global and Legal Entity Liquidity Stress Model Stress test contingency liquidity outflows at the global and regional level
─ 100% loss of non-cleared repo and stock loan
─ Higher margins at CCP’s and clearing organizations
─ 100% loss of customer credit balances
─ Buy back Jefferies debt for market support
─ Collateral outflows on ISDA/CSA’s
─ Intraday liquidity at clearing banks
─ No sale of assets for a minimum 30 Days
─ Assume no movement of liquidity between regulated entities.
Maintain positive stressed liquidity position for a minimum of 30 days at global and at legal entity level
Jefferies Group, $2,001 MM, 32%
Jefferies International, $1,084 MM,
18%
Jefferies LLC, $2,627 MM, 42%
Other, $479 MM, 8%
Global Liquidity Pool – $6,191 million or 16% of Assets
50

Long-Term Debt Profile
Long-Term Debt Maturity Schedule (Notional) ($ Millions)
As of August 31, 2017, our $6.4 billion notional of long-term debt had a weighted average maturity of approximately 7 years
$345 million convertible bond is callable/puttable in November 2017
No maturity of long-term debt in a single year is greater than 20% of outstanding long-term debt
During the nine months ended August 31, 2017, long-term debt increased $966 million, net of retirements. This amount includes the issuance of senior notes with a total principal amount of $750 million on January 20, 2017 and structured notes with a total principal amount of approximately $288 million
Pre-Funded
51

Q & A’s – [email protected]

52

4th Largest U.S. Beef Company LTM 6/30/17 Sales – $7.0 Billion Market Share – 12.75% Employees – 8,200
#1 U.S. exporter of chilled beef 2nd Largest U.S. Hide Tanner
Market Share – 27%
Intensely Focused on Value-Added Production LTM 6/30/17 EBITDA(1) and Pre-Tax Income of $485 million and $380 million, respectively
Company Overview
(1) This is a Non-GAAP measure. See page 105 in Appendix for reconciliation to GAAP amount. 53

Beef Processing Consumer Ready
Transportation
Direct to Consumer
Wet Blue Leather
Business Segments
54

National Beef processes ~3 million fed cattle per year representing ~12.75% U.S. market share
2 processing plants strategically located in Liberal and Dodge City, KS
Primary competitors: Cargill, JBS, Tyson
Export beef and beef by-products to more than 20 countries
─ National Beef is the #1 U.S. exporter of chilled beef globally, as well as into Japan, the most important export market for U.S. beef
National Beef is intensely focused on value-added production to drive superior performance versus its competitors
─ The company’s Dodge City and Liberal processing plants are consistently ranked among the top 3 producers of Certified Angus Beef, the most sought after premium brand in beef
Selected Value-added Brands
Beef Processing Overview
55

Cattle Supply Update
Growth in cattle available for slaughter is on track and is expected to continue until least until 2021
─ Industry slaughter typically peaks approximately 4 years after peak heifer retention
511
525 529
520
501
512 505
489 483
457
436
465
485
400
425
450
475
500
525
550
2005 2006 2007 2008 2009 2010 2011 2012 2013 2014 2015 2016 YTDSep-17
U.S. Steer and Heifer Slaughter — Industry Weekly Average
(1) Reflects the average actual weekly slaughter through 09/16/17.
(1)
The increasing supply of slaughter-ready cattle is expected to support continued strong profitability
for at least the next several years
56

($40.3) ($123.9)
$329.0
($200)($100)
$0$100$200$300$400
2014 2015 2016
Financial Performance
Pre-Tax Income ($ Millions)
(1) Adjusted EBITDA is a non-GAAP measure. See page 105 in the Appendix for a reconciliation to GAAP amounts.
FYE December,
2016 2015 2017
6 Months Ending June
Adjusted EBITDA ($ Millions) (1)
$84.3
$135.5
$0
$50
$100
$150
H1 2016 H1 2017
$60.1
($13.3)
$436.3
($100)$0
$100$200$300$400$500
2014 2015 2016
FYE December,
2016 2015 2017
6 Months Ending June
$137.4 $186.3
$0
$100
$200
H1 2016 H1 2017
57

2017 Update
An increased supply of cattle in 2017 has driven higher margins and greater capacity utilization versus 2016
For the first half of 2017, gross margin percentage improved to 6.4% vs. 5.0% in the prior year period, while total volume was up 4.9%
based on same equivalent weeks
Sales efforts are driving demand from new and existing customers for our consumer-ready products
Our tannery continues to ramp up production and to seek the optimal product and grade mix
58

Strategic Priorities
Focus on additional value-added production
─Ongoing marketing to retailers and food service providers of consumer-ready, portion-controlled and other value-added product lines
─As capacity utilization increases, seek margin enhancement opportunities
Manage for growth and enhanced profitability ─Capture benefits of the rebound in cattle herd size
─Continue to drive efficiencies and operational improvements ─Focus on export opportunities (now including China) to capitalize on long-term secular growth in global protein consumption
Drive volume and margin at tannery ─Provide the highest quality, wet blue hides from one of the largest and most technologically advanced facilities in the world
59

60

Company Overview
Berkadia is a full-service mortgage banking firm that provides clients middle market services and products in mortgage finance, advisory and servicing
Business Lines:
─ Permanent, Bridge and Construction loans
─ Investment Sales
─ Master/Primary Servicing
2nd largest GSE and HUD commercial real estate lender by origination $ volume in 2016
─ Largest FHA commercial real estate lender by $ of commitments from HUD FY 2016
─ 2nd largest FHLMC commercial real estate lender by $ volume in 2016
─ 4th largest FNMA commercial real estate lender by purchased $ volume in 2016
3rd largest servicer of U.S. commercial real estate loans by $ volume as of June 30, 2017
61

Loan Originations ($ billion) Pre-Tax Margin (% of revenue)
Pre-Tax Income(1) ($ million) Cash Earnings(2) ($ million)
Financial Performance
(1) 2016 Core Earnings included recovery of Mortgage Servicing Rights impairment driven largely by forward interest rates. (2) Cash Earnings is a non-GAAP measure. See Appendix on page 105 for a reconciliation to GAAP amounts.
$4.6 $5.2
$9.5 $10.4
$12.8
$22.0
$19.5
$8.3 $9.3
$-
$5
$10
$15
$20
$25
2010 2011 2012 2013 2014 2015 2016 1H2016
1H2017
$71
$107
$135 $153
$173 $158 $152
$72 $76
$-
$20
$40
$60
$80
$100
$120
$140
$160
$180
$200
2010 2011 2012 2013 2014 2015 2016 1H2016
1H2017
9% 10%
24%
29% 31%
23%
28%
23% 21%
0%
5%
10%
15%
20%
25%
30%
35%
2010 2011 2012 2013 2014 2015 2016 1H2016
1H2017
$5 $37
$59 $105
$73 $40
$19 $15 $31 $30
$67
$94
$86
$91 $165
$53 $58
$-
$50
$100
$150
$200
$250
2010 2011 2012 2013 2014 2015 2016 1H2016
1H2017
Investment Securities Interest and Gains Core Earnings
62

2017 Update
Berkadia’s results show continued growth in core pre-tax income. 1H 2017 core pre-tax income of $58 million up ~8% year over year
Interest earnings on escrows benefitting from rising short-term rates
Improved productivity of Bankers / Sales Advisors. Annualized volume per MB increased to $132 million in 1H 2017 from $122 million in 1H 2016, an 8% increase. Annualized volume per Sales Advisor increased to $60 million in 1H 2017 from $55 million in 1H 2016, a 9% increase
Round trips, where we act as both sales advisor and debt originator have increased steadily with each passing year. During 1H 2017, 26% of our investment sales volume resulted in a round trip, up from 20% in 1H 2016
Added top-tier Bankers / Sales Advisors to the South Florida, Southern California, DC Metro and Atlanta markets. Expanded IS focus outside of multifamily by hiring Seniors Housing and Land Acquisition specialists
No material economic impact is anticipated from Harvey and Irma
63

Industry Update
$30 $37 $42 $40 $49 $64 $68
$46 $67
$81
$146
$69 $55 $53
$71 $63
$80 $74
$100 $83
$-
$50
$100
$150
$200
201
7
201
8
201
9
202
0
202
1
202
2
202
3
202
4
202
5
202
6
Multifamily Non-Multifamily
Unpaid Principal Balance of Non-Bank Commercial/Multifamily Mortgages, By Year of
Maturity ($ billion)
Positive Long-Term Market Opportunities
The final wave of pre-2007 commercial mortgage maturities passes in 2017
Multifamily maturities, specifically GSE and HUD, will continue to climb over the next several years, presenting long-term opportunities
Source: Mortgage Bankers Association Commercial Real Estate/Multifamily Finance Loan Maturity volumes as of December 31, 2016.
$12 $23
$30 $30 $35
$54 $54
$29
$49
$65
$-
$50
$100
201
7
201
8
201
9
202
0
202
1
202
2
202
3
202
4
202
5
202
6
GSE and HUD
Unpaid Principal Balance of GSE and HUD Mortgages, By Year of Maturity ($ billion)
*Berkadia’s Business is Multifamily
64

Servicing Portfolio
Unpaid principal balance as of June 30, 2017 was $214 billion; $194 billion, or 91%, relate to loans added since initial acquisition (2009)
Servicing Portfolio – UPB ($ billions)
65

2017-2018 Strategic Priorities
Our Vision
─ Through spirited and relentless pursuit, we will become the unmistakable firm of choice for employees and customers in middle market commercial real estate finance, with unyielding fidelity to our values
Our Values
─ Integrity is everything
─ We take the long view
─ We believe people matter
─ We stand for excellence
─ We love our jobs
Our Long-term Goals
─ Be the #1 Combined Fannie Mae, Freddie Mac, and HUD lender (2nd in 2016)
─ Be Top 5 in Life Company Originations (6th in 2016)
─ Drive process excellence throughout the firm
─ Leverage technology to provide proprietary solutions to clients
66

67

Garcadia Overview 11th Largest U.S. Auto Dealership Group in 2016 Based on New Sales Volume
4 Clusters, 28 dealerships – 14 domestic, 14 foreign brands
One company, 28 dealerships with a common vision to be “Most Esteemed”
─ Single brand maniacally focused on employee and customer experience
─ Common operating principles and management routines emphasizing people development
─ Proprietary reporting systems providing real time results by transaction and employee
─ High throughput and performance metrics vs industry
MICHIGAN 3 DEALERSHIPS
IOWA 5 DEALERSHIPS
TEXAS 8 DEALERSHIPS
CALIFORNIA 12 DEALERSHIPS
68

Industry Update – Key Indicators Remain Positive
(1) WardsAuto. (2) IHS Automotive – 2016 Annual Study. (3) Q2 2017 The Haig Report.
--
5
10
15
20
'97 '98 '99 '00 '01 '02 '03 '04 '05 '06 '07 '08 '09 '10 '11 '12 '13 '14 '15 '16
U.S
. New
Veh
icle
Sal
es (i
n M
illio
ns)
Vehicle Sales Remain Elevated1
Annual SAARs 5-Yr Trailing Average
75.0
69.4 65.4 63.7
66.1
72.3
78.4
83.2
40
50
60
70
80
90
2009
2010
2011
2012
2013
2014
2015
2016Tr
ailin
g 5
Ye
ar U
nit
Sal
es
(in
Mill
ion
s)
Growing Pool of Serviceable Vehicles1
6
7
8
9
10
11
12
'95
'96
'97
'98
'99
'00
'01
'02
'03
'04
'05
'06
'07
'08
'09
'10
'11
'12
'13
'14
'15
'16
Avg
. Age
of U
.S. L
igh
t V
ehic
les
(Yea
rs)
AVG. Age of All U.S. Light Vehicles²
3.6%
(1.8%)
(6.9%)
1.9%
4.9%
(1.0%)
4.8% 5.4% 5.7%
8.0%
2.2%
(10%)
(5%)
-
5%
10%
200
7
200
8
200
9
201
0
201
1
201
2
201
3
201
4
201
5
201
6
YTD
'17
NADA - Yearly Fixed Ops Growth³
2.4%
69

Financial Performance
(1) Represent combined amounts for all Garcadia dealership holdings, not just Leucadia’s share. (2) Represents Leucadia’s share of cash distributions. (3) Represents Leucadia’s net carrying amount for Garcadia (excluding land) and percentage return.
Fis c al Year Ended Dec ember 31, L TM
($ Millions ) 2012 2013 2014 2015 2016 6/30/2017
Tota l Units S old 35,394 48,576 65,514 84,643 85,320 85,127
# of D ealers hips 18 21 26 27 28 28
G arcadia R evenue (1) 1,100.8$ 1,548.4$ 2,071.1$ 2,727.0$ 2,796.7$ 2,794.0$
% G rowth 39.4% 40.7% 33.8% 31.7% 2.6% NA
G arcadia P re-Tax Incom e (1) 37.4$ 46.9$ 59.2$ 64.7$ 62.8$ 57.8$
% Margin 3.4% 3.0% 2.9% 2.4% 2.2% 2.1%
G arcadia D is tributions (2) 24.4$ 33.1$ 41.3$ 51.5$ 52.6$ 51.7$
E quity - B eg inning of Year(3) 72.3$ 82.4$ 120.0$ 167.9$ 172.7$ 187.2$
E quity - E nd of Year(3) 82.4$ 120.0$ 167.9$ 172.7$ 185.8$ 182.4$
P re-Tax R eturn on B eg . E quity(3) 35.6% 39.2% 34.1% 26.3% 25.0% 21.1%
Hurricane Update: Harvey shutdown Houston dealerships for a week and resulted in significant inventory loss at two stores (fully insured). Stores are experiencing sales lift post Harvey
70

Evolution 20/20
Lay Foundation
Structure For
Success
Company Conversion
Executional Mastery
Vision Attainment
Current Reality
• 100% Alignment
• One Hour Sales
Model
• Attract the Best
People
• 45 Minute Oil Change
• 20% Net to Gross
Vision
• Flattening Market
• Best “Best Practices”
• Deep in “Brand”
Change Curve
• Regional Leadership
Transitioning
• Profit Down
• One Hour Sales Model
• Service Drive Loyalty
• Advanced Technology
• Leading HR Culture
• Structured for Success
2017 2018 2016 2019 2020
Change Strategies
71

72

Company Overview NYSE-listed diversified holding company (NYSE: HRG) that is exploring strategic alternatives to
maximize value for shareholders:
─ Consumer Products – Spectrum Brands (NYSE: SPB, ~59% ownership (1))
─ Insurance – Fidelity & Guaranty Life (NYSE: FGL, ~80% ownership (1)); FrontStreet Re (100% ownership) ─ Sale of both insurance businesses to CF Corporation, funds affiliated with Blackstone and Fidelity National
Financial, are under contract and expected to close by the end of the year
─ 338(h)10 election will result in significant tax savings and therefore the preservation of the HRG Net Capital Loss Carryforwards and Net Operating Loss Carryforwards
Initial investment September 2013 with follow-on purchases in March and November 2014
Since Leucadia invested in 2014 and 2015 HRG has: ─ Transitioned to new leadership;
─ Unlocked value by exiting certain businesses including:
Total Cost: $476 million; Fair Market Value at 6/30/17: $825.3 million
Ownership: 23.2% (2)
Joseph Steinberg serves as Chairman and CEO and Andrew Whittaker serves as a Director
(1) Source: HRG Group’s 3rd Quarter August 7, 2017 Conference Call presentation and SPB / FGL FQ3 10Q. (2) Leucadia owned 46.6 million shares as of 6/30/17.
─ HGI Energy ─ Compass ─ Salus Capital Partners ─ Five Island Asset Management
─ Energy & Infrastructure Capital ─ CorAmerica Capital ─ Agreeing to the pending sale of FGL
73

Spectrum Brands Overview
Spectrum Brands (NYSE: SPB) is a global consumer products company focused on delivering a portfolio of consumer products with the same performance for a lower price / better value
Core segments are Global Batteries & Appliances, Pet, Home & Garden, Hardware & Home Improvement, and Global Auto Care
Achieved quarter-over-quarter net sales and adjusted EBITDA growth with few exceptions since FY 2009
─ Share price up more than 3.5x over the past 5 years; ~30% CAGR
Expects to generate up to $590 million of adjusted free cash flow in FY 2017 (ending 9/30/17), up from $535 million in 2016 and $454 million in 2015 (1) (3)
(1) As per Spectrum Brands 7/27/17 Earnings Call Presentation. (2) As per Spectrum Brands 6/21/17 Oppenheimer Consumer Conference Presentation and 7/27/17 Earnings Call Presentation. “TNM” reflects a Trailing Nine Months. (a)
Reflects pro forma as if HHI acquired at beginning of respective period. The pre-acquisition earnings and capital expenditures of HHI do not include the TLM Taiwan business as stand alone financial data is not available for the periods presented. The TLM Taiwan business is not deemed material to Spectrum’s operating results. (b) Reflects results for GAC from acquisition date of May 21, 2015 through September 30, 2015.
(3) These are Non-GAAP measures. See pages 107-108 in Appendix for reconciliation to GAAP amounts.
$457
$668 $677 $724
$801
$953
$716 $698
14.3% 15.8% 15.8% 16.4%
17.1%
18.9% 18.9% 18.9%
Adjusted EBITDA ($ Millions) / Margin Performance (2)(3)
$3,187
$4,226 $4,277 $4,429 $4,690
$5,040
$3,790 $3,686
Net Sales Performance ($ Millions) (2)
74

Sum of the Parts Valuation (Dilutive) without AOCI
Source: Sum of the Parts Valuation per HRG Group’s 3rd Quarter August 7, 2017 Conference Call presentation, updated for closing market prices on 9/29/17. Book values are as of 6/30/17. Valuation excludes HRG Group's share of Accumulated Other Comprehensive Income (“AOCI”). (1) HRG Group’s 8/7/17 Conference Call presentation valuation of Spectrum Brands is based on a volume weighted average closing price of $130.47 for the 20 day trading period
ended 6/30/17. On 9/29/17, Spectrum Brands’ closing price was $105.92. HRG Group’s 8/7/17 Conference Call presentation valuation of the Insurance Segment is based on a volume weighted average closing price of $31.06 for Fidelity & Guaranty Life for the 20 day trading period ended 6/30/17, and transaction or book value as of 6/30/17 for FrontStreet Re of $65.0 million. Fidelity & Guaranty Life’s proceeds from the sale to CF Corporation after the payment of $30 million in exchange for the 338(h)10 election come to $30.46 per share.
(2) Per share amount for each of the mentioned assets and liabilities is calculated by dividing the total valuation of each asset or liability by the 200,548,374 shares of HRG Group’s common stock outstanding as of 6/30/17.
HRG Sum of the Parts Valuation (Dilutive) without AOCI
Method Total ($ Bn) Per Share(2)
Spectrum Brands(1)
Market Value 3.637$ 18.14$
Fidelity & Guaranty Life(1)
Transaction Value 1.432 7.14
FrontStreet Re Transaction Value 0.065 0.32
HGI Funding LLC, HGI Energy & HGI AM Book Value (0.227) (1.13)
Cash Book Value 0.148 0.74
Debt & Other Liabilities (1.829) (9.12)
Total Estimated Value 3.226$ 16.09$
Estimated Value
75

76

Company Overview Vitesse Energy formed in May 2014 – Leucadia has invested $300 million to acquire
and develop oil and gas properties in proven, lower risk oil & gas fields in the growing core of the Bakken Field and Denver-Julesburg (“DJ”) Basin
Partner with the leading operators who drill and complete new horizontal wells
─ More than 75% of current activity with EOG, XTO (Exxon), Burlington (COP), Oasis, Continental and Hess
$25 million of LTM 6/30/17 Adjusted EBITDA(1) with 89+ % of the company’s expected $2.0 billion of long-term cash flow net of capital expenditures still in the ground to be developed in the future. Our long lived reserves provide Vitesse with meaningful long-term exposure to rising oil prices, improving completion technologies and the expansion of the core
Only four unprofitable quarters out of thirteen since inception on a Pre-Tax Income basis
Our Strategy – acquire leasehold interests in the best parts of the Bakken and DJ and participate in the conversion of those yet to be developed drilling locations into cash flow producing horizontal wells
Acknowledged as a leading non-op management team, with cutting edge evaluation, big data analytics and accounting systems providing Vitesse with a competitive advantage in the acquisition and consolidation of non-op assets
(1) This is a Non-GAAP measure. See page 109 in Appendix for reconciliation to GAAP amount. 77

Case Study: Deeper / Denser / Cheaper / Better
Vitesse participates in Oasis’ White unit which has seen significant improvements since 2011
EUR increased from 600 Mboe (2011, original frac) to over 1,800 Mboe today
Decreased well costs by more than 30% since 2011 and increased frac size from 4 MM pounds to 10 MM pounds +
Second infill wells are generating >120% IRR at strip pricing
Source: Oasis Petroleum February 2017 Presentation – http://oasispetroleum.investorroom.com/events.
2011
(Original Well)
2014
(First Infill)
Sept. 2017
(Second Infill)
2011 – Sept. 2017
Number of Wells 1 7 5 13 (+2 Lease
lines)
Completion (Stages) 30 36 50
Gross Capex ($M) $9,300 $10,500 $6,500 30%
EUR (Mboe) 600 840 1,800 3.0 x
WTI Oil Price ($/bbl) $95 $75 $50 50%
IRR (%) 34% 40% >120% 3.5 x
ROI (x) 3.9 x 4.2 x 7.0 x 1.8 x
Source: Oasis Feb. 2017 Presentation
78

Financial Performance
Through June 30, 2017
20,283 net acres in the core Bakken counties of Williams, McKenzie, Mountrail and Dunn
1,420 gross producing wells (37.23 net)
413 permitted, drilling or completing wells (14.58 net, of which 8.92 are completing)
170+ net future drilling locations ($1.0 billion of estimated future capital expenditures)
$2.0 billion of future Cash Flow net of capital expenditures based on WTI strip pricing of:
Financial and operating results for 1H 2017:
─ 3,359 boe/d, with average cash margin of $22.36/boe (approaching 5,000 boe/d at end of year)
─ $24.8 million revenue from oil and gas sales / $12.1 million of cash flow from operating activities
─ $11.1 million of capital expenditures (expect $40 million FY 2017)
Rem. 2017 2018 2019 2020 2021 and beyond
$49/bbl $49/bbl $50/bbl $51/bbl $52/bbl
79

Strategic Priorities
Optimize our assets
─ Reinvest and compound cash flow into future horizontal wells
Add assets opportunistically at compelling valuations
─ Increase our exposure to high rate of return areas in Bakken and DJ Basins
Basin will consolidate
─ Leverage our best in class evaluation, big data analytics and accounting systems to evaluate management or consolidation opportunities from other non-op owners
80

JETX Overview
JETX (formerly Juneau Energy, LLC) is a Denver-based oil and gas company which has successfully transitioned to a non-op strategy, led by the Vitesse Energy management team
JETX owns producing assets and leasehold acreage to be developed in Texas:
─ Current production exceeds 500 boe/d with close to 14,000 net acres in Brazos and Grimes Counties
─ Recently participated as a 50/50 partner with Lonestar Resources (NASDAQ:LONE) in the drilling of the Wildcat B-1H well that had a 30 day IP rate of 2,123 boe/d
─ Positive cash flow from operating activities with book value as of 6/30/2017 of $114 million
Wildcat B-1H Well
81

JETX 2017 Plan
East Eagle Ford
─ Maintain Arhopulos acreage block – continue leasing program
─ Evaluate development program
─ Expand our strategic partnership with Lonestar Resources
82
83

Company Overview
FXCM Group LLC is a leading online provider of foreign exchange trading services to approximately 124,000(1) active retail trading accounts outside the U.S.
Multi-asset class product offering – with approximately 69% of volumes in OTC Spot FX and 31% in contracts for difference (“CFDs”) on OTC precious metals, oil, commodities and equity-indices (Q2/17)
Global reach – serving customers in 172 countries and 20 languages
On January 15, 2015, Leucadia provided $300 million in secured financing to FXCM to meet the capital shortfall that resulted from extraordinary volatility in the Swiss Franc as a result of the de-pegging action taken by the SNB
─ $67 million principal outstanding as of 9/30/17
─ Leucadia owns 49.9% of FXCM’s equity and is entitled to up to 65% of the economics of FXCM
Asia 41%
EMEA 42%
Rest of World 17%
Volume by Geography - Continuing Operations (Q2/17)
(1) Active accounts as at 7/31/17
84

FXCM is the fifth largest retail FX broker globally (ex. Japan) - with particular strength in Asia, especially China
Currency volatility (“CVIX”) in 2017 has decreased to near-record lows
Industry Update
(1) Based on Forex Magnates Q2/17 Quarterly Industry Report. Excludes Japanese brokers.
Global FX Daily Volumes By Retail Broker (ex. Japan) (1)
Q2/2017
6.0
8.0
10.0
12.0
Monthly Average JP Morgan Global FX CVIX
23.1
14.8
10.9 9.9 9.4 9.0 8.6 7.2
6.5 4.9 4.8 4.4 4.3 4.2 4.1
0.0
5.0
10.0
15.0
20.0
25.0
(In $ bil l ions)
85

Financial Performance Despite low volatility and lower trading volumes & revenues, FXCM has maintained
profitability
─ Revenue per million up 12% 1H 17 vs. 1H 16 due in large part to initiative to rollout dealing desk model to smaller clients
─ In addition, significant cost reductions: $16M less adjusted operating expenses 1H 17 vs 1H 16
Cash position solid, with $124 million in operating cash in continuing operations (and an additional $10 million in discontinued operations) at 6/30/17
FXCM’s regulatory capital position is strong
─ Minimum regulatory capital requirements in continuing operations of $24 million versus current regulatory capital of $97 million, a surplus of $73 million (6/30/17)
$114
$94
$-
$40
$80
$120
1H 16 1H 17
Trading Revenues
$24
$18
$-
$10
$20
$30
1H 16 1H 17
Adjusted EBITDA(1)
$93
$77
0
150
1H 16 1H 17
Adjusted Operating Expenses (1) $ Millions $ Millions
$1.8
$1.3
$-
$0.5
$1.0
$1.5
$2.0
1H 16 1H 17
Trading Volume(2)
$ Trillions $ Millions
(1) Source: Adjusted Operating Expenses and Adjusted EBITDA per FXCM’ Group’s Financials . Adjusted Operating Expenses and Adjusted EBITDA are non-GAAP measures and are for FXCM Group Continuing Operations only. See page 110 in the Appendix for a reconciliation to GAAP measures.
(2) Source: Retail Volume and Daily Average Trades per FXCM Group’s Monthly Metrics press releases and based upon Continuing Operations. 86
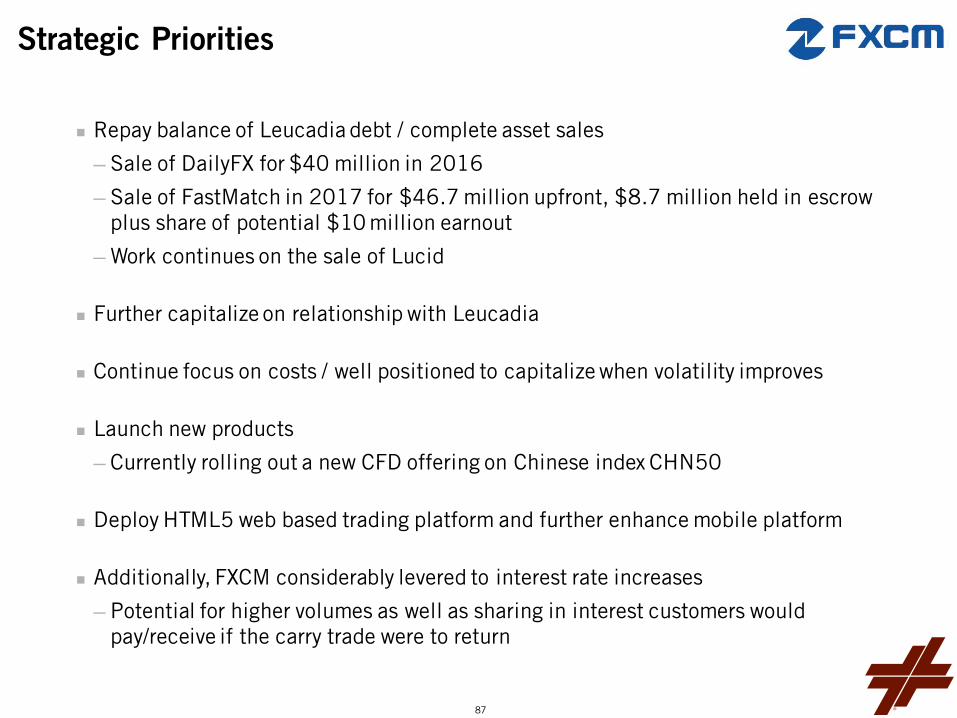
Strategic Priorities
Repay balance of Leucadia debt / complete asset sales
─ Sale of DailyFX for $40 million in 2016
─ Sale of FastMatch in 2017 for $46.7 million upfront, $8.7 million held in escrow plus share of potential $10 million earnout
─ Work continues on the sale of Lucid
Further capitalize on relationship with Leucadia
Continue focus on costs / well positioned to capitalize when volatility improves
Launch new products
─ Currently rolling out a new CFD offering on Chinese index CHN50
Deploy HTML5 web based trading platform and further enhance mobile platform
Additionally, FXCM considerably levered to interest rate increases
─ Potential for higher volumes as well as sharing in interest customers would pay/receive if the carry trade were to return
87

88

Company Overview
Fastest-growing fixed wireless broadband internet provider in Italy
─ Offers pre- and post-paid subscribers a simple product at a compelling price point: unlimited broadband services with speeds up to 30 Mbps for €25/month
─ 454,986 subscribers as of 6/30/17
─ 66% compound annual subscriber growth rate since Leucadia’s initial investment in 2011
─ $101 million LTM Revenue and $9 million LTM Adj. EBITDA(1)
Nationwide network deployment with base stations, fiber exchange points, points of sale and customers in every region of Italy
─ As of 6/30/17, over 2,125 base stations deployed reaching 62% of the population
─ Network expected to reach 100% LTE-enabled in the fourth quarter 2017
─ 420+ fiber points of presence
─ 4,900+ indirect sales and distribution points
84MHz of 3.5 GHz spectrum covering 82% of the population and at least 42 MHz in the remaining 18%
65% national brand awareness
(1) This is a Non-GAAP measure. See page 109 in Appendix for reconciliation to GAAP amount. 89

Industry Update
The Italian broadband market continues to be dominated by low-speed ADSL
─ Over the coming years, ADSL will be replaced by both wireless and fiber solutions
─ With a comparable service to fiber, significantly lower capex and an unmatched speed of deployment, Linkem is poised to become an integral component of Italy’s broadband solution
Major U.S. and Asian telecom operators and equipment manufacturers have become increasingly dedicated to building out 5G mobile wireless standard infrastructure, which will deliver ultrafast connection speeds using higher frequency spectrum, including Linkem’s 3.5GHz, garnering front-page news
─ The European Commission and China’s Ministry of Industries and Information Technology have designated 3.4-3.6GHz frequencies for 5G
─ In May, the CBRS Alliance, an industry group backed by Google, Qualcomm, Intel, AT&T, Verizon, T-Mobile, Sprint and others, signed a cooperation agreement to establish ecosystem focused on commercializing 3.5GHz in the U.S.
Potential 3.6-3.8GHz auction in Italy in 2018 is attracting significant interest among the major operators and the government is proposing very high reserve prices
90

Italian Market Potential
Today: 62% Coverage, ~16MM HH 2019E: ~70%+ Coverage, ~18MM+ HH
Household Coverage Evolution
Over the next three years, Linkem plans to continue increasing its coverage and significantly grow penetration across Italy’s 26 million households
0-20% 21-40% 41-60% 61-80% 81-100%
Household Coverage Key
Linkem currently covers 62% of the country, representing ~16 million households
The city of Bari, where our initial LTE deployment was focused, serves as a powerful case study of Linkem’s potential in a market where its network is fully developed
─ Bari household penetration currently stands at ~7%, versus Linkem’s current ~3% national penetration of households covered
Network development in Rome is nearing completion; Linkem’s current ~1% household penetration versus its full potential represents a significant opportunity to add subscribers
91

Subscriber and Network Growth
0
50
100
150
200
250
300
350
400
450
500
Q1 Q2 Q3 Q4 Q1 Q2 Q3 Q4 Q1 Q2 Q3 Q4 Q1 Q2 Q3 Q4 Q1 Q2 Q3 Q4 Q1 Q2 Q3 Q4 Q1 Q2
Subscriber Growth Subscribers (000’s)
2011
Network Growth Base Stations On-air
Built WiMAX Scale LTE Growth Network Optimization
2012 2013 2014 2015 2016 2017
2011 2012 2013 2014 2015 2016 2017
0
500
1,000
1,500
2,000
2,500
3,000
Q1 Q2 Q3 Q4 Q1 Q2 Q3 Q4 Q1 Q2 Q3 Q4 Q1 Q2 Q3 Q4 Q1 Q2 Q3 Q4 Q1 Q2 Q3 Q4 Q1 Q2
92

2017 Update
During the first quarter, Linkem closed a €100 million preferred equity financing at a pre-money valuation of €700 million (post-money valuation of €800 million)
─ Existing shareholders, along with funds managed by BlackRock, invested €100 million in cash to fund future expansion plans
─ Leucadia's share was €30 million, and our fully-diluted ownership as of 6/30/17 is 53%
Service is now available in 19 of the 20 largest cities, including Rome, Florence, Bologna, Bari, Palermo, Naples, Brescia and Turin (Milan will be launched soon)
Signed a licensing agreement with a major Italian telecom operator whereby the partner will wholesale Linkem’s services to its customers
Entered into an agreement with Sky Italy to bundle major football and other sports content with Linkem service
Launching an Internet of Things offering to further leverage our distribution, installer, and call center assets
Announced a 5G test in the city of Catania
Linkem has had positive Adjusted EBITDA since Q4 2014
93

Strategic Priorities
Increase coverage through LTE network deployment with the goal of reaching 80%+ Italian household coverage
Maintain excellent operating metrics and customer satisfaction
Increase coverage and distribution capacity in larger cities to fully leverage the network investments in each city and increase brand awareness nationally
Build off recent record-setting pace of base station deployments and continue subscriber growth on the existing footprint
─ Linkem deployed ~470 LTE BTS during the last four months of 2016, showcasing it’s ability to rapidly expand the network
Increase focus on business customers
Evaluate wholesaling opportunities
94

Leucadia Asset Management
95

Diversified alternative asset management platform – supporting and developing focused funds managed by distinct management teams
Compelling edge – leverage Jefferies to source, and Leucadia to capitalize and market
Fee-generating assets; prospect of long-term stable cash flows; ability to recycle seed capital
Goal of growing third party AUM, while earning a reasonable return on our invested capital
─Expanding LAM-level marketing & IR function
Manage platforms to minimize cost and mitigate risk
─Leverage Jefferies back office to minimize launch costs and operating expenses
─Strict controls to manage and limit risk
─Cut losses when necessary at pre-determined levels; low cost to exit investments
Continue to seek new platforms/partners
Aggregate Regulatory AUM of $13 billion ($5 billion in CoreCommodity) as of June 30, 2017
$708 million Leucadia book value in LAM products as of June 30, 2017 – this does not reflect any potential value of the management companies executing these strategies
Overview & Strategy Leucadia Asset Management
96

Strategic Investments Division (Quantitative Strategies)
─Systematic strategy with a multi-quant approach across asset classes, geographies and time horizons
─Structured Alpha B, Managed Futures, Grouper (equity market neutral)
Folger Hill Asset Management (Multi-Manager)
─Multi-manager discretionary long/short equity hedge fund platform
Topwater Capital (Multi-Manager / First-loss)
─First-loss, scalable multi-manager and multi-strategy liquid securities fund
Global Equity Events Opportunity Fund (Event-Driven Strategies)
─Event driven strategy investing in merger arbitrage, relative value and stock loan arbitrage
Platform and Strategies Leucadia Asset Management
97

Tenacis (Quantitative Strategies)
─Systematic macro fund encompassing equities, credit, FX, rates and volatility
Lake Hill
─Electronic trading of listed options and futures across asset classes
CoreCommodity Management (Commodity Strategies)
─Active strategies designed to provide enhanced commodity exposure
54 Madison (Real Estate)
─Long-term, opportunistic real estate private equity fund providing equity capital for hotel, timeshare, resort, residential and specialty retail real estate development projects
Platform and Strategies (Continued) Leucadia Asset Management
98

Q & A’s – [email protected]

Appendix
99

Leucadia – Tangible Book Value and Fully-Diluted Shares Outstanding GAAP Reconciliations
Telecom – Linkem Real Estate Development – HomeFed
Industrial
─ Conwed ─ Idaho Timber
Metals & Mining – Golden Queen
Consumer, Healthcare and Media
Note: Fully Diluted shares exclude shares for options, convertible debt and preferred shares.
Reconciliation of Leucadia Book Value (Leucadia's Shareholders' Equity) to Tangible Book Value
($ millions)
6/30/2017
Leucadia Shareholders' Equity / Book Value (GAAP) 10,491$
Less: Goodwill and Intangible Assets 2,488
Leucadia Tangible Book Value (Non-GAAP) 8,003$
Reconciliation of Leucadia GAAP Shares Outstanding to Fully Diluted Shares Outstanding
(millions of shares)
6/30/2017
Leucadia Shares Outstanding (GAAP) 358.6
Restricted Stock Units 16.1
Other 0.7
Leucadia Fully Diluted Shares Outstanding (Non-GAAP) 375.4
100

Leucadia – Tangible Book Value GAAP Reconciliation
(1) Dollar amounts are Leucadia's net carrying amount as of 6/30/17 for each investment, for consolidated subsidiaries equal to their assets less liabilities and non-controlling interest.
Reconciliation of Book Value to Tangible Book Value
($ Millions) Tangible
Book Value Goodwill and Book Value
(GAAP) (1)
Intangibles, Net (Non-GAAP)
Jefferies 5,614$ 1,900$ 3,714$
Leucadia Asset Management 708 1 707
FXCM 303 - 303
HomeFed 311 - 311
Berkadia 213 - 213
Foursight 94 - 94
M Science 8 8 -
National Beef 713 578 135
HRG 825 - 825
Vitesse & JETX 430 - 430
Garcadia 203 - 203
Linkem 192 - 192
Golden Queen 77 - 77
Idaho Timber 78 - 78
Cash & Investments 557 - 557
Deferred Tax Asset 981 - 981
Other 297 1 296
Debt and Preferred Equity (1,113) - (1,113)
10,491$ 2,488$ 8,003$
101

This presentation of Adjusted financial information is an unaudited non-GAAP financial measure. Adjusted financial information begins with information prepared in accordance with U.S. GAAP and then those results are adjusted to exclude the operations of Jefferies’ Bache business. Management believes that the disclosed Adjusted measures and any adjustments thereto, when presented in conjunction with comparable U.S. GAAP measures are useful to investors as they enable investors to evaluate Jefferies’ results in the context of exiting the Bache business. These measures should not be considered a substitute for, or superior to, measures of financial performance prepared in accordance with U.S. GAAP. Accompanying footnotes on the following slide.
Jefferies – Bache Adjusted Earnings GAAP Reconciliation Reconciliation of Consolidated Adjusted Financial Information
($ millions)
Twelve Months Ended 11/30/2015 Twelve Months Ended 11/30/2014
GAAP Adjustments Adjusted GAAP Adjustments Adjusted
Revenues
Fixed Income 271$ 80$ (1) 191$ 748$ 203$ (1) 545$
Other -$ -$ -$ -$ -$ -$
Net Revenues 2,475$ 80$ (1) 2,395$ 2,990$ 203$ (1) 2,787$
Net Revenues After Preferred Interest 2,475$ 80$ (1) 2,395$ 2,990$ 203$ (1) 2,787$
Non-Compensation Expenses 894 127 (2) 767 989 250 (2)(4)(5) 739
Compensation and Benefits 1,467 88 (3) 1,379 1,699 99 (3) 1,600
Total Expenses 2,361 215 2,146 2,687 349 2,338
Earnings Before Tax & Non-Controlling Interest 114 (135) 249 303 (146) 449
Full Year Ended 11/30/2012 Full Year Ended 11/30/2011
GAAP Adjustments Adjusted
Revenues
Fixed Income 1,253$ 249$ (1) 1,004$
Net Revenues 3,062$ 249$ (1) 2,813$
Nine Months Ended 8/31/2015
GAAP Adjustments Adjusted
Revenues
Fixed Income 261$ 81$ (1) 181$
Net Revenues 1,962$ 81$ (1) 1,882$
Twelve Months Ended 11/30/2015 Twelve Months Ended 11/30/2014
GAAP Adjustments Adjusted
Revenues
Fixed Income 271$ 80$ (1) 191$
Net Revenues 2,475$ 80$ (1) 2,395$
Non-Compensation Expenses 894 127 (2) 767
Compensation and Benefits 1,467 88 (3) 1,379
Total Expenses 2,361 215 2,146
Earnings Before Tax & Non-Controlling Interest 114 (135) 249
102

(1) Revenues generated by the Bache business, including commissions, principal transaction revenues and estimated net interest revenue, for the presented period have been classified as a reduction of revenue in the presentation of Adjusted financial information.
(2) Expenses directly related to the operations of the Bache business for the presented periods have been excluded from Adjusted non-compensation expenses. These expenses include floor brokerage and clearing fees, amortization of capitalized software used directly by the Bache business in conducting its business activities, technology and occupancy expenses directly related to conducting Bache business operations and business development and professional services incurred by the Bache business as part of its client sales and trading activities, including estimates of certain support costs dedicated to the Bache business. Estimates of certain support costs were derived based on direct support costs for the presented period in relationship to the average head count of corporate support personnel with responsibilities associated with operating the Bache business.
(3) Compensation expense and benefits, including salaries, benefits, cash bonuses, commissions, annual cash compensation awards and the amortization of certain share-based and cash compensation awards, recognized during the presented period for employees whose sole responsibilities pertained to the activities of the Bache business, including front office personnel and dedicated support personnel, have been classified as a reduction of Compensation and benefits expense in the presentation of Adjusted financial information. In addition, compensation and benefits for other corporate support personnel with duties specific to the Bache operations included in this adjustment were estimated based on an average per person cost applied to the average head count for this employee population type across the presented periods.
Jefferies – Bache Adjusted Earnings GAAP Reconciliation (continued)
103

Jefferies – Tangible Assets and Tangible Jefferies Group LLC Member’s Equity GAAP Reconciliation
Note: Tangible gross assets and tangible Jefferies Group LLC member’s equity are unaudited non-GAAP financial measures that begin with information prepared in accordance with U.S. GAAP and then are adjusted to exclude goodwill and intangibles. Management believes that the tangible gross assets and tangible Jefferies Group LLC member’s equity are common metrics used by many investors in its industry to evaluate performance from period to period.
2015 2016 2017($ Billions) 1Q 2Q 3Q 4Q 1Q 2Q 3Q 4Q 1Q 2Q 3Q
Total Assets (GAAP) 43.8 44.1 42.8 38.6 35.2 37.1 38.1 36.9 37.7 40.1 39.4Less: Goodwill and Intangibles 1.9 1.9 1.9 1.9 1.9 1.9 1.9 1.8 1.8 1.8 1.8
Tangible Gross Assets (Non-GAAP) 41.9 42.2 40.9 36.7 33.3 35.2 36.3 35.1 35.9 38.2 37.5
Total Jefferies Group LLC Member's Equity (GAAP) 5.4 5.5 5.5 5.5 5.3 5.3 5.3 5.4 5.5 5.6 5.7Less: Goodwill and Intangibles 1.9 1.9 1.9 1.9 1.9 1.9 1.9 1.8 1.8 1.8 1.8
Tangible Jefferies Group LLC Member's Equity (Non-GAAP) 3.5 3.6 3.6 3.6 3.4 3.5 3.5 3.5 3.6 3.7 3.8
104

National Beef – Adjusted EBITDA GAAP Reconciliation
(1) Leucadia’s share is $383 million based on its 78.95% ownership. Note: National Beef Adjusted EBITDA represents pre-tax income (loss) exclusive of depreciation and amortization expenses, impairment charges and net interest income/expense, which is a common metric used by many investors in its industry to evaluate operating performance from period to period.
Berkadia – Cash Earnings Reconciliation
Note: Berkadia cash earnings represents pre-tax income plus depreciation, amortization and impairments of mortgage servicing rights (MSRs), intangible assets, the increase in balance sheet loan loss reserves, less gains attributable to the origination of MSRs and unrealized gains and losses on loans and investments, which is a common metric used by many investors in its industry to evaluate operating performance from period to period.
Reconciliation of Pre-Tax Income to EBITDA (a Non-GAAP measure)
($ Millions)
LTM
2012 2013 2014 2015 2016 6/30/16 6/30/17 6/30/17
Pre-Tax Income (loss) (GAAP) 59$ (42)$ (40)$ (124)$ 329$ 84$ 136$ 380$
Interest Expense/(Income), net 12 12 15 17 13 8 4 9
Depreciation & Amortization 83 89 85 89 95 45 47 96
EBITDA (Non-GAAP) 155 59 60 (18) 436 137 186 485
Impairments - 63 - 5 - - - -
Adjusted EBITDA (Non-GAAP) 155$ 122$ 60$ (13)$ 436$ 137$ 186$ 485$
6 months ending
(1)
Reconciliation of Pre-Tax Income to Cash Earnings (a non-GAAP measure)
($ Millions)
LTM
2010 2011 2012 2013 2014 2015 2016 6/30/16 6/30/17 6/30/17
Pre-Tax Income (GAAP) 31$ 35$ 104$ 153$ 191$ 164$ 205$ 72$ 72$ 205$
Depreciation, amortization and impairments of MSRs and intangibles88 108 113 95 105 144 93 55 66 104
Gains attributable to origination of MSR's (42) (45) (93) (120) (117) (148) (191) (67) (101) (225)
Loan loss reserves and guarantee liabilities, net of cash losses 3 3 19 29 29 36 47 8 30 70
Unrealized (gains) losses; and all other, net (9) 7 (8) (4) (35) (37) (2) 4 8 2
Cash Earnings (Non-GAAP) 71$ 107$ 135$ 153$ 173$ 158$ 152$ 72$ 76$ 156$
6 months ending
105

Idaho Timber – EBITDA GAAP Reconciliation
Note: Idaho Timber EBITDA represents pre-tax income exclusive of depreciation and amortization expenses, which is a common metric used by many investors in its industry to evaluate operating performance from period to period.
Conwed – EBITDA GAAP Reconciliation
Note: Conwed EBITDA represents pre-tax income exclusive of depreciation and amortization expenses, which is a common metric used by many investors in its industry to evaluate operating performance from period to period.
R econc iliation of P re-T ax Income to E B IT DA (a Non-G AAP meas ure)
($ Millions )
LTM
2012 6/30/17
P re-Tax Income (GAAP ) 6$ 23$
D eprec iation & Amortiz ation 6 3
E B ITD A (Non-GAAP ) 12$ 26$
R econc iliation of P re-T ax Income to E B IT DA (a Non-G AAP meas ure)
($ Millions )
2012 2016
P re-Tax Income (GAAP ) 12$ 19$
D eprec iation & Amortiz ation 7 10
E B ITD A (Non-GAAP ) 18$ 29$
106

Spectrum Brands – Adjusted EBITDA GAAP Reconciliation
(1) "TNM" reflects a Trailing Nine Months. Note: Adjusted EBITDA is a metric used by Spectrum Brands' management and frequently used by the financial community which provides insight into an organization's operating trends and facilitates comparisons between peer companies, because interest, taxes, depreciation and amortization can differ greatly between organizations as a result of differing capital structures and tax strategies. Adjusted EBITDA can also be a useful measure of a company's ability to service debt and is one of the measures used for determining Spectrum Brands' debt covenant compliance. Adjusted EBITDA excludes certain items that are unusual in nature or not comparable from period to period. Adjusted EBITDA Margin reflects adjusted EBITDA as a percentage of net sales. Source: Spectrum Brands 6/21/17 Oppenheimer Consumer Conference Presentation and 7/27/17 Earnings Call Presentation
Reconciliation of Net Income to Adjusted EBITDA (a Non-GAAP measure)
($ Millions)
2011 2012 2013 2014 2015 2016 7/3/16 7/2/17
Net income (loss) (GAAP) (75)$ 49$ (55)$ 215$ 149$ 358$ 269$ 203$
Income tax expense 92 60 27 59 44 40 47 89
Interest expense 208 192 376 202 272 250 176 158
Depreciation and amortization 105 105 140 157 170 183 136 143
EBITDA (Non-GAAP) 330 406 488 633 635 831 628 593
Share based compensation 30 29 44 47 48 64 48 28
Pre-acquisition earnings - 183 30 - - - - -
Restructuring and related charges 29 19 34 23 29 15 8 33
Acquisition and integration related charges 37 31 48 20 59 37 31 15
Write off from impairment of intangible assets 32 - - - - 5 - -
Pet safety recall - - - - - - - 25
Accelerated depreciation and amortization (1) - - - - - - -
Purchase accounting inventory fair value adjustment - - 31 - 22 - - -
Venezuelan devaluation - - 2 - 2 - - -
Other - - - 1 6 1 1 4
Adjusted EBITDA (Non-GAAP) 457$ 668$ 677$ 724$ 801$ 953$ 716$ 698$
Fiscal Year TNM (1)
107

Spectrum Brands – Adjusted Free Cash Flow GAAP Reconciliation
Note: Adjusted free cash flow is useful to both Spectrum Brands' management and investors in their analysis of Spectrum Brands’ ability to service and repay its debt and meet its working capital requirements. In addition, the calculation of adjusted free cash flow does not reflect cash used to service debt and therefore, does not reflect funds available for investment or discretionary uses. Source: Spectrum Brands 7/27/17 Earnings Call Presentation
R econc iliation of C as h F low F rom O perating Activ ities to Adjus ted F ree C as h F low (a Non-G AAP meas ure)
($ Millions )
2015 2016
F orecas ted
2017
Net cas h provided from operating activities (GAAP ) 444$ 615$ $680-$695
C as h interes t charges related to refinanc ing 75 15 -
C as h res tructuring, acquis ition and intergration cos ts 24 - -
P urchas es of property, plant and equipment (89) (95) (105) -(115)
Adjus ted free cas h flow (Non-GAAP ) 454$ 535$ $575-$590
108

Vitesse – Cumulative Net Revenues GAAP Reconciliation
Note: Vitesse Adjusted EBITDA represents pre-tax loss exclusive of depletion, depreciation, amortization and accretion expenses, interest expense and unrealized losses on commodity derivative instruments, which is a common metric used by many investors in its industry to evaluate operating performance from period to period.
Linkem – Adjusted EBITDA GAAP Reconciliation
Note: Linkem Adjusted EBITDA represents pre-tax loss exclusive of interest expense, depreciation and amortization expenses and other adjustments, which is a common metric used by many investors in its industry to evaluate operating performance from period to period. (1) Other includes primarily asset impairment costs and provision for doubtful accounts.
R econc iliation of P re-tax L os s to Adjus ted E B IT DA (a Non-G AAP meas ure)
($ Millions )
LTM
2012 6/30/17
P re-tax Los s (GAAP ) (64)$ (64)$
Interes t expens e 2 2
D eprec iation & Amortiz ation 16 64
O ther (1) 3 7
Adjus ted E B ITD A (Non-GAAP ) (43)$ 9$
Reconciliation of Pre-Tax Loss to Adjusted EBITDA (a non-GAAP measure)
($ Millions)
LTM
6/30/17
Pre-Tax Loss (GAAP) (1)$
Depletion, depreciation, amortization and accretion 23
Interest expense 1
Unrealized losses on commodity derivative instruments 2
Adjusted EBITDA (Non-GAAP) 25$
109
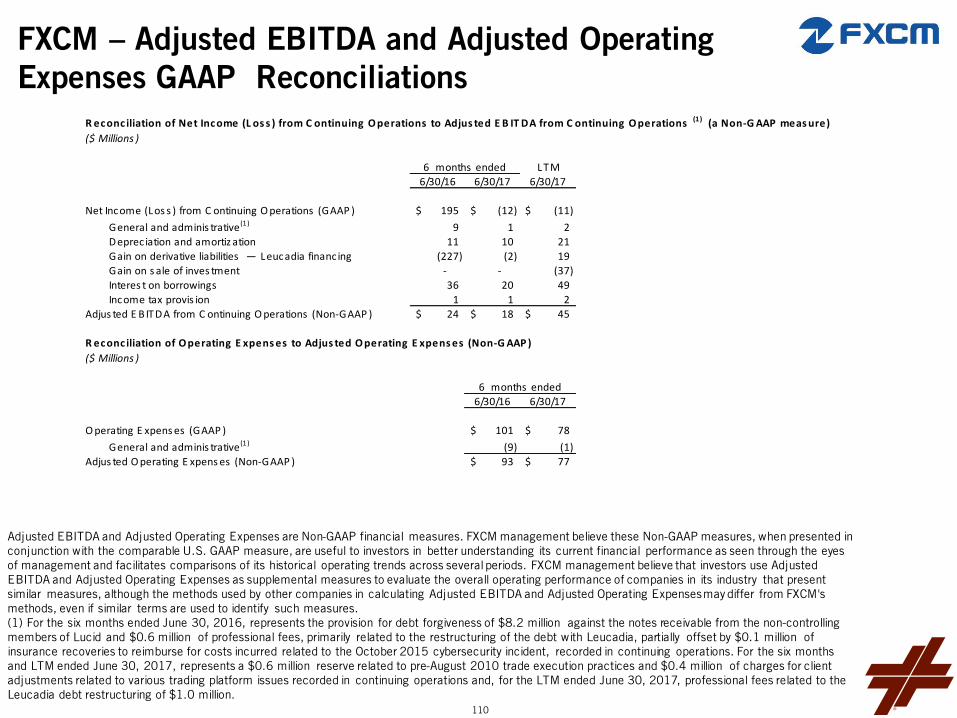
FXCM – Adjusted EBITDA and Adjusted Operating Expenses GAAP Reconciliations
Adjusted EBITDA and Adjusted Operating Expenses are Non-GAAP financial measures. FXCM management believe these Non-GAAP measures, when presented in conjunction with the comparable U.S. GAAP measure, are useful to investors in better understanding its current financial performance as seen through the eyes of management and facilitates comparisons of its historical operating trends across several periods. FXCM management believe that investors use Adjusted EBITDA and Adjusted Operating Expenses as supplemental measures to evaluate the overall operating performance of companies in its industry that present similar measures, although the methods used by other companies in calculating Adjusted EBITDA and Adjusted Operating Expenses may differ from FXCM's methods, even if similar terms are used to identify such measures. (1) For the six months ended June 30, 2016, represents the provision for debt forgiveness of $8.2 million against the notes receivable from the non-controlling members of Lucid and $0.6 million of professional fees, primarily related to the restructuring of the debt with Leucadia, partially offset by $0.1 million of insurance recoveries to reimburse for costs incurred related to the October 2015 cybersecurity incident, recorded in continuing operations. For the six months and LTM ended June 30, 2017, represents a $0.6 million reserve related to pre-August 2010 trade execution practices and $0.4 million of charges for client adjustments related to various trading platform issues recorded in continuing operations and, for the LTM ended June 30, 2017, professional fees related to the Leucadia debt restructuring of $1.0 million.
R econc iliation of Net Income (L os s ) from C ontinuing O perations to Adjus ted E B IT DA from C ontinuing O perations (1) (a Non-G AAP meas ure)
($ Millions )
LTM
6/30/16 6/30/17 6/30/17
Net Income (Los s ) from C ontinuing O perations (GAAP ) 195$ (12)$ (11)$
General and adminis trative (1) 9 1 2
D eprec iation and amortiz ation 11 10 21
Gain on derivative liabilities — Leucadia financ ing (227) (2) 19
Gain on s ale of inves tment - - (37)
Interes t on borrowings 36 20 49
Income tax provis ion 1 1 2
Adjus ted E B ITD A from C ontinuing O perations (Non-GAAP ) 24$ 18$ 45$
R econc iliation of O perating E xpens es to Adjus ted O perating E xpens es (Non-G AAP )
($ Millions )
6/30/16 6/30/17
O perating E xpens es (GAAP ) 101$ 78$
General and adminis trative (1) (9) (1)
Adjus ted O perating E xpens es (Non-GAAP ) 93$ 77$
6 months ended
6 months ended
110

KCG – Cumulative Net Revenues GAAP Reconciliation
(1) In April 2017, Virtu Financial agreed to acquire KCG at a price of $20.00 per share. The transaction closed on July 20, 2017. (2) Jefferies became a wholly-owned subsidiary of Leucadia on March 1, 2013.
Reconciliation of Cumulative Net Revenues to Cumulative Net Revenues Through Date of Sale (a Non-GAAP measure)
($ Millions, excluding per share amount)
Net
Revenues
Leucadia cumulative net revenues related to KCG through second quarter 2017 (GAAP) 222$
Net revenues subsequent to second quarter 2017 (1)2
Net revenues related to KCG prior to acquisition of Jefferies by Leucadia (2)
195
Cumulative net revenues through date of sale (Non-GAAP) (1)419$
111


![1 Décembre 2009 Fr, Total33,4 millions [31,1 – 35,8 millions] Adultes31,3 millions [29,2 – 33,7 millions] Femmes (15 ans et plus)15,7 millions [14,2 –](https://img.dokumen.tips/doc/110x75/551d9d80497959293b8b9b3d/1-decembre-2009-fr-total334-millions-311-358-millions-adultes313-millions-292-337-millions-femmes-15-ans-et-plus157-millions-142-.jpg)