Embed Size (px)
Citation preview

Lettuce Plant
Lettuce (Lactuca sativa)– Butterhead variety– Quick turnover
5 weeks– Cultivars
Rex Tom Thumb
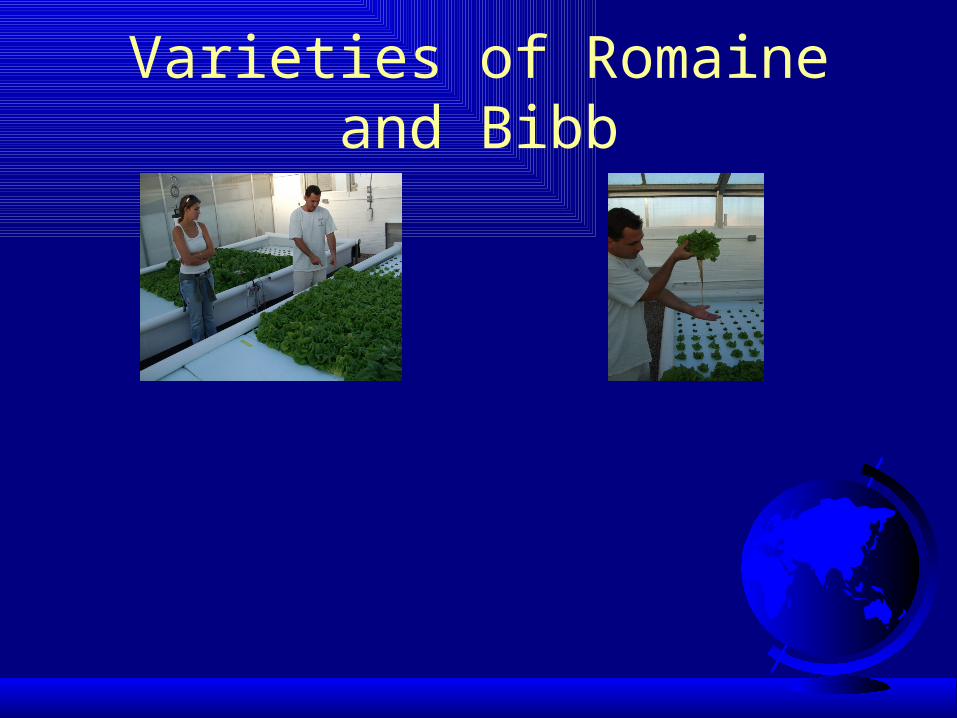
Varieties of Romaine and Bibb
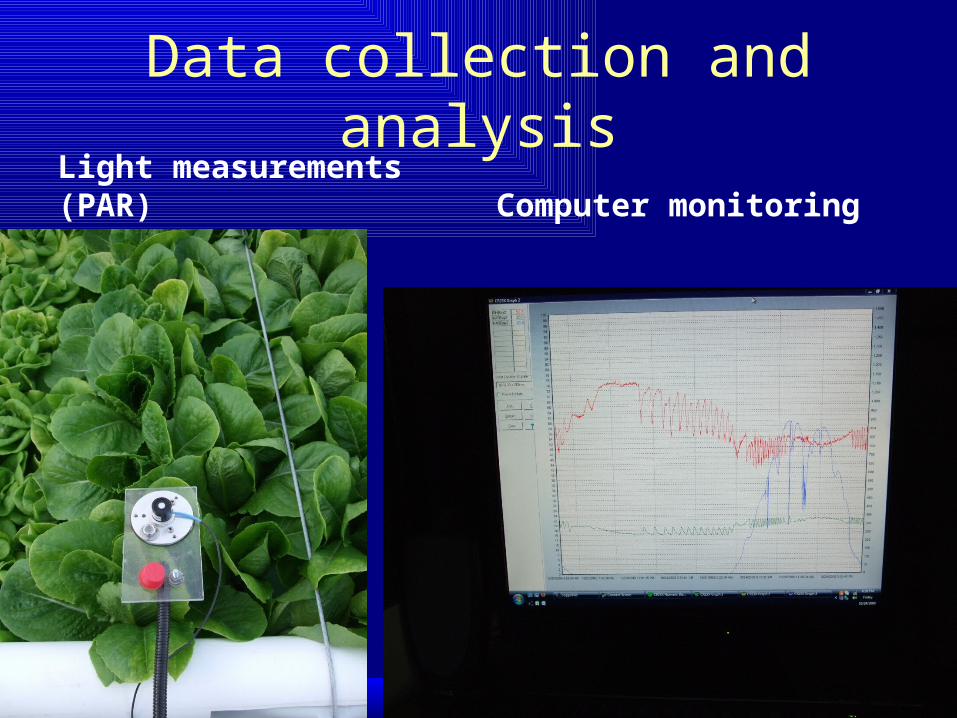
Data collection and analysis
Light measurements (PAR) Computer monitoring

Nutrient Balance
Nutrient Balance– Feed
32% Protein 2-4% System Biomass FCR 2:1
– Filtration Clarifier Nitrification
– Hydroponics Nutrient uptake Water
Water Chemistry
N, TAN, NH4, NO2, NO3, K, P, Ca, Fe, pH, alkalinity, T, EC

Aquaponic Inputs
Inputs:– Water– Fish Food
Star Milling Co. 1/8” Floating Tilapia Feed
– Dolomite 65 Ag CaCO3 46.0% MgCO3 38.5% Ca 22.7% Mg 11.8%
– Biomins Biomin Fe+ (5%) Biomin Mn+ (5%) Biomin Zn+ (7%)
Crude Protein 32%
Crude Fat 5%
Crude Fiber 3.5%
Ash 9%
FISH FEED
% N 5.97
% P 1.53
% K 1.46
% Ca 1.61
% Mg 0.26
% Na 0.24
% S 0.46
mg/L Cu 15
mg/L Zn 143
mg/L Mn 93
mg/L Fe 461
mg/L B 18
– Nutrient Content Analysis

pH & Oxygen
pH Range Tilapia 6.5-9– Fish = 6.5 – 8.5– Plant = 5.0 – 7.5
Diurnal pH Flux– Reduce shifts to stabilize pH
Shifts can inhibit organism's physiology thus reducing growth Acidic pH can effect solubility of Fertilizers
– Alkalinity Optimal: 75-150 mg/L Stabilizes pH ; provides nutrients for growth
Dissolved Oxygen– > 4 mg/l (ppm)

UAAQ CEACMethodology
Data Collection– Fish : Lettuce
Fish FCR Fish Biomass (1 kg) Plant Wet/Dry Weight Plant Height/Diameter
– Lettuce quality Apogee CCM-200 Chlorophyll Concentration
Index (CCI)– Relative chlorophyll value– Compare a cultivar of
lettuce growing in different systems

UAAQ CEACBiomass Density
CEAC GH#3118– Tilapia Density
0.04 – 0.06 kg/L 2% Biomass / day 1.6 – 1.8 kg feed / day Harvest weight 1kg
– Lettuce 32 plants / m2
6” off center Harvest head wet weight
150-200 grams

UAAQ CEACWater Chemistry
Nutrient Deficiency Succession– [ Fe+, Mn+, Mo+] <– [Ca+, Mg+]<– [Zn+]
Hydroponic Water Parameters– pH 6.5-6.7 – EC 1.5 – 2.0 – DO 4-7mg/L– T = 23-25oC
Water Chemistry (mg/L)CEAC
Lettuce GH#3118
Target
NITROGEN
Ammonia NH3-N 0 0
Nitrate NO3-N 180 50
Boron (B) 0.35 <1
Calcium (Ca) 200 60
Copper (Cu) 0.05 <0.05
Iron (Fe) 2.4 2
Magnesium (Mg) 40 20
Manganese (Mn) 0.55 0.5
Molybdenum (Mo) 0.05 0.05
PO4-P 50 50
Potassium (K) 198 150
Sulfate (SO4)-S 52 20< >100
Zinc (Zn) 0.34 0.3

Data and video live on Internethttp://ag.arizona.edu/tomlive/gh3118_idx.html
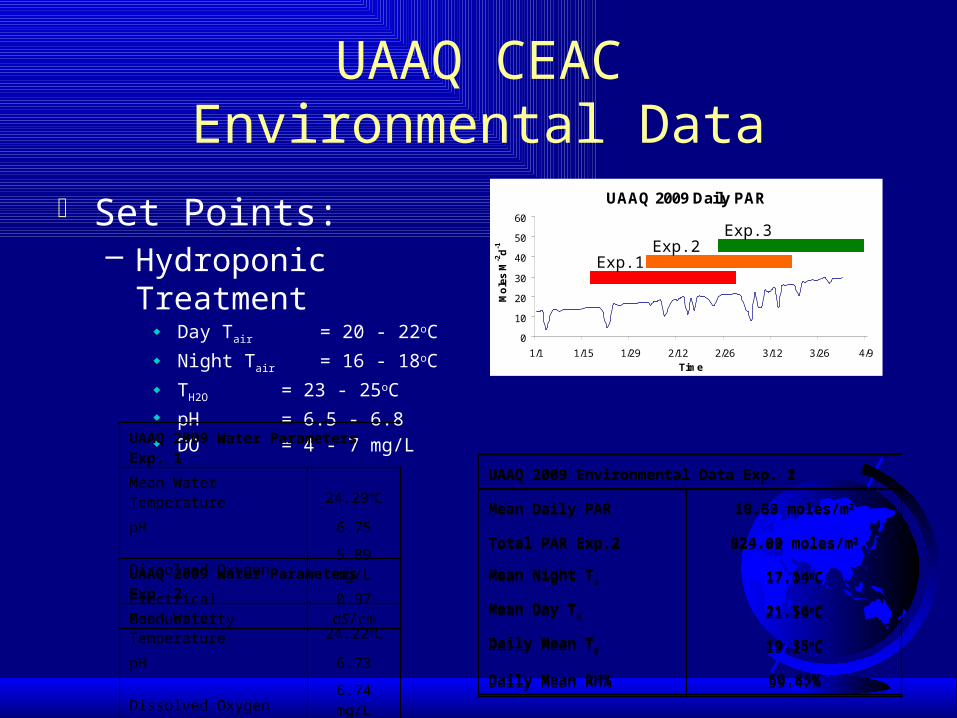
UAAQ CEACEnvironmental Data
Set Points:– Hydroponic Treatment
Day Tair = 20 - 22oC
Night Tair = 16 - 18oC
TH2O = 23 - 25oC pH = 6.5 - 6.8 DO = 4 - 7 mg/L
UAAQ 2009 Daily PAR
0
10
20
30
40
50
60
1/1 1/15 1/29 2/12 2/26 3/12 3/26 4/9Time
Mo
les
M-2
d-1
UAAQ 2009 Environmental Data Exp. 1
Mean Daily PAR 16.60 moles/m2
Total PAR Exp.2 829.82 moles/m2
Mean Night Ta 17.09oC
Mean Day Ta 21.19oC
Daily Mean Ta 19.14oC
Daily Mean RH% 59.47%
Exp.1Exp.2
Exp.3
UAAQ 2009 Environmental Data Exp. 2
Mean Daily PAR 19.33 moles/m2
Total PAR Exp.2 924.00 moles/m2
Mean Night Ta 17.14oC
Mean Day Ta 21.56oC
Daily Mean Ta 19.35oC
Daily Mean RH% 60.85%
UAAQ 2009 Water Parameters Exp. 1
Mean Water Temperature 24.29oC
pH 6.75
Dissolved Oxygen 5.89 mg/L
Electrical Conductivity 0.97 dS/cm
UAAQ 2009 Water Parameters Exp. 2
Mean Water Temperature 24.22oC
pH 6.73
Dissolved Oxygen 6.74 mg/L
Electrical Conductivity 0.93 dS/cm

UAAQ CEACNitrogen Mass Flow
Fish Feed – % N = 5.97
1800 grams/day 107 grams nitrogen/day
Sludge– N = 3.38% per g dry weight
5 Liters day produced Collect dry weight / day
Fish – 27% nitrogen retention
Lettuce – Samples to be analyzed
Water– 40-60 mg/L Nitrate
UAAQ Water ChemstryNPK
0.00
50.00
100.00
150.00
200.00
250.00
1/1 1/15 1/29 2/12 2/26 3/12
Time
mg
/L
NH3-N
NO3-N
K
PO4-P
Exp.1Exp.2
Exp.3
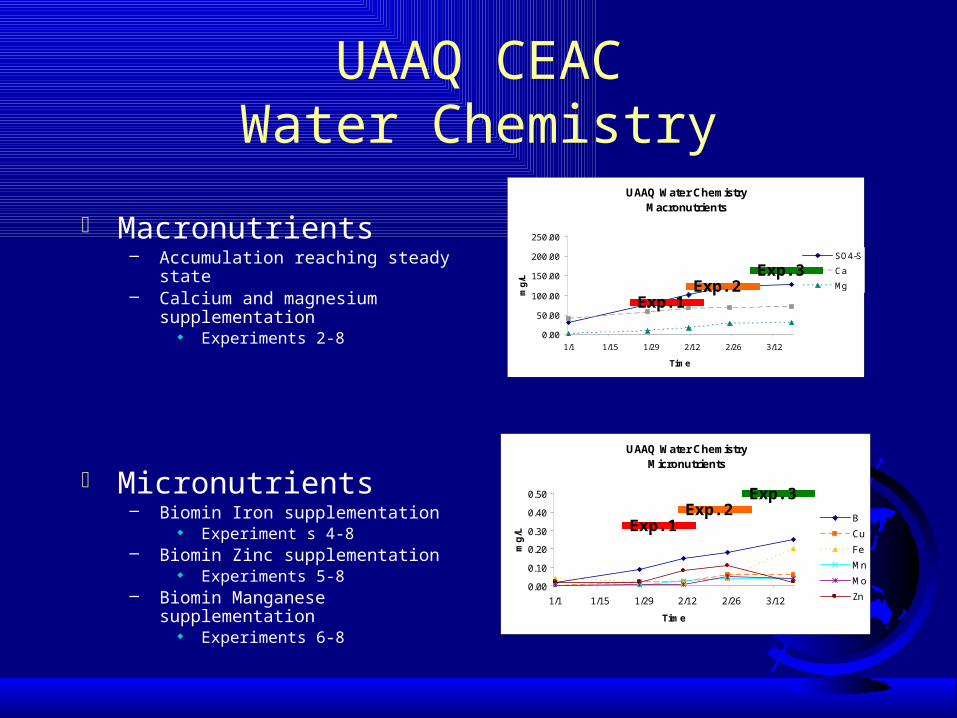
UAAQ CEACWater Chemistry
Macronutrients– Accumulation reaching steady state– Calcium and magnesium supplementation
Experiments 2-8
Micronutrients– Biomin Iron supplementation
Experiment s 4-8– Biomin Zinc supplementation
Experiments 5-8– Biomin Manganese supplementation
Experiments 6-8
UAAQ Water ChemistryMacronutrients
0.00
50.00
100.00
150.00
200.00
250.00
1/1 1/15 1/29 2/12 2/26 3/12
Time
mg
/L
SO4-S
Ca
Mg
UAAQ Water Chemistry Micronutrients
0.00
0.10
0.20
0.30
0.40
0.50
1/1 1/15 1/29 2/12 2/26 3/12
Time
mg
/LB
Cu
Fe
Mn
Mo
Zn
Exp.1Exp.2
Exp.3
Exp.1Exp.2
Exp.3

UAAQ Exp. 2 Aquaponics vs. Hydroponics
Hydroponic Solution– Nitrogen uptake– Experiment 2 Data
40-60 mg/L NO3-N 10-20 mg/L P 100+ mg/L K
UAAQ 2009 Water ChemistryH1 Primary Nutrients
0
50
100
150
200
250
Feb-09 Mar-09
Time
mg
/L
NH3-N
NO3-N
K
PO4-P
UAAQ 2009 Hydroponics WaterH2 Primary Nutrients
0
50
100
150
200
250
Feb-09 Mar-09
Time
mg
/L
NH3-N
NO3-N
K
PO4-P

Arizona Aquaculture Websiteag.arizona.edu/azaqua

What’s needed next? Investment in production
and more research Best technologies of ag
and aquaculture Limited governmental
regulation Trained production staff
and semi-skilled farming staff