Embed Size (px)
Citation preview

Let’s Not Make a Deal: An EmpiricalStudy of Decision Making inUnsuccessful Settlement NegotiationsRandall L. Kiser, Martin A. Asher, and Blakeley B. McShane*
This study quantitatively evaluates the incidence and magnitude of errorsmade by attorneys and their clients in unsuccessful settlement negotiations.The primary study analyzes 2,054 contested litigation cases in which theplaintiffs and defendants conducted settlement negotiations, decided toreject the adverse party’s settlement proposal, and proceeded to arbitrationor trial. The parties’ settlement positions are compared with the ultimateaward or verdict, revealing a high incidence of decision-making error byboth plaintiffs and defendants. This study updates and enhances three priorstudies of attorney/litigant decision making, increasing the number of casesin the primary data sets more than threefold, adding 72 explanatory vari-ables from 19 classes, applying a multivariate analysis, presenting an histori-cal review of error rates during the 1964–2004 period, and comparing theprimary study error rates with error rates in cases where the parties arerepresented by attorney-mediators. Notwithstanding these enhancements,the incidence and relative cost of the decision-making errors in this studyare generally consistent with the three prior empirical studies, demonstrat-ing the robustness of the earlier works by Samuel Gross and Kent Syverud,and Jeffrey Rachlinski. The multivariate analysis, moreover, shows that theincidence of decision-making error is more significantly affected by“context” variables (e.g., case type and forum) than by “actor” variables(e.g., attorney gender and experience level).
*Address correspondence to Randall L. Kaiser, DecisionSet, 550 Hamilton Ave., Ste. 300, PaloAlto, CA 94301; email: [email protected]. Asher is Director, Research and Scholars Pro-grams, Wharton Undergraduate Division, and Adjunct Professor of Finance at The WhartonSchool, University of Pennsylvania; McShane is a graduate student in the Department ofStatistics, The Wharton School, University of Pennsylvania.
We thank Jeffrey Rachlinski, Theodore Eisenberg, and an anonymous review for their insight-ful comments on previous versions of this article.
Journal of Empirical Legal StudiesVolume 5, Issue 3, 551–591, September 2008
© 2008, Copyright the AuthorsJournal compilation © 2008, Cornell Law School and Wiley Periodicals, Inc.
551

I. Introduction
The decision to settle or litigate necessarily requires an assessment of thelikely trial outcome.1 Absent extrinsic motivations, a rational litigant roughlyweighs an adversary’s settlement proposal against the likely trial outcome,makes some adjustments for attorney fees, court costs, and the possibility ofdelays and appeals, and either accepts or rejects the adversary’s settlementproposal. For litigants unwilling to accept an adversary’s settlement offer andintent on obtaining a judgment on the merits, trials are their best alternativeto a negotiated agreement (BATNA). As Roger Fisher and William Ury assertin Getting to Yes, a party’s BATNA “is the standard against which any proposedagreement should be measured. That is the only standard which can protectyou both from accepting terms that are too unfavorable and from rejectingterms it would be in your interest to accept.”2
To test whether attorneys and litigants accurately measure trialoutcomes against settlement alternatives in adjudicated cases, this studyexamines 2,054 California civil cases ultimately resolved through trial orarbitration, following unsuccessful settlement negotiations.3 The cases werereported in a 38-month period between November 2002 and December2005; about 20 percent of all California litigation attorneys represented theparties in these cases. The parties’ settlement positions in those cases arecompared with the ultimate award or verdict to determine whether theparties’ probability judgments about trial outcomes were economically
1Samuel Gross & Kent Syverud, Don’t Try: Civil Jury Verdicts in a System Geared To Settlement,44 UCLA L. Rev. 51 (1996): “Every theory of pretrial bargaining assumes that a negotiatedsettlement is determined, at least in part, by the parties’ predictions of the outcome of the caseif it did go to trial.”
2Rober Fisher & William Ury, Getting to Yes: Negotiating Agreement Without Giving In(Penguin Books 1991).
3The vast majority of civil cases, of course, are resolved by voluntary settlements or pretrialproceedings. It is impossible to objectively measure the economic utility of decision making inthe settled cases, as the settlement consideration cannot be compared with an actual trialoutcome. The results of this study are limited to decision making in adjudicated cases withconfirmed settlement positions and, due to this selection bias, may not have any explanatoryvalue in settled cases. As Ward Farnsworth explained in his study of injunctions: “I am notpurporting to ask or answer any questions about what happens in cases that settle, so excludingthem is just a limitation on what the study means.” Ward Farnsworth, Do Parties to NuisanceCases Bargain After Judgment? A Glimpse Inside the Cathedral, in Behavioral Law & Economics(Cass Sunstein, ed., Cambridge University Press 2000).
552 Kiser et al.
efficacious, that is, did the parties commit a decision error by rejecting asettlement alternative that would have been the same as or better than theultimate award? Employing a multivariate analysis, the study presents a quan-titative evaluation of those attorney/client probability judgments regardingliability and damages, the costs of inaccurate probability assessments, and theeffect of explanatory variables such as offers of compromise, case type,nature of alleged damages, and forum.
The results of this 38-month study are complemented by a 40-yearsurvey of settlement decisions in adjudicated cases from 1964 to 2004. The40-year survey indicates whether attorney/litigant decision error rates areconstant and whether the incidence of adverse outcomes in the 38-monthstudy is atypical. Lastly, to tentatively assess whether the decision-makingerrors shown in this study may be attributable to the study attorneys’ pos-sible risk-taking propensities and bias against negotiated resolutions, thestudy results are compared with error rates in cases where the parties arerepresented by attorney-mediators who meet state-mandated mediatortraining requirements and have been selected to serve on their localcourt’s panel of mediators. This group of attorney-mediators, skilled incase evaluation and conflict resolution, presumably would exhibit lowerdecision-making error rates if the study attorneys’ error rates resulted fromsingular risk-taking propensities or anti-settlement biases. Alternatively,similar error rates for the study attorneys and the attorney-mediators coulddemonstrate that the study attorneys are not uniquely risk seeking or thatclients, not their attorneys, assume the dominant role in making settlementdecisions.4
The study serves two principal purposes. First, it is a large-scale empiri-cal study of settlement decision error in adjudicated cases, demonstratingthe extent, costs, and persistence of attorney/litigant judgment error.Second, it updates and evaluates the continued validity of three pioneeringempirical studies of attorney/litigant settlement decision making: SamuelGross and Kent Syverud’s 1991 article, “Getting to No: A Study of SettlementNegotiations and the Selection of Cases for Trial,” their 1996 study, “Don’t
4Attorneys, of course, are required to abide by “a client’s decision whether to accept an offer ofsettlement of a matter.” American Bar Association Model Rules of Professional Conduct, Rule1.2. In referring to “attorney/litigant” decision making, we intend to convey the collaborativenature of the attorney/client relationship while acknowledging that the client is the ultimatedecisionmaker.
Decision Making in Unsuccessful Settlement Negotiations 553
Try: Civil Jury Verdicts in a System Geared to Settlement,” and JeffreyRachlinski’s 1996 study, “Gains, Losses and the Psychology of Litigation.”5
II. A Brief Review of Prior Studies
In the three prior studies by Samuel Gross and Kent Syverud and JeffreyRachlinski, the authors analyzed settlement behavior in actual civil cases andconcluded that the conventional economics model of rational choiceleading to optimal economic outcomes is inapplicable, misleading, or inac-curate. Noting that “the absence of data on pretrial negotiations has handi-capped development of this topic,” law professors Gross and Syverud firststudied a nonrandom sample of 529 cases between June 1985 and June 1986.Their data showed that “the main systemic determinants of success at trialand in pretrial bargaining are contextual and relational [e.g., litigants’resources, reputations, insurance, fee arrangements, repeat litigants]” andthat prior theoretical models of attorney/litigant settlement behavior were“quite alien to actual litigation.”6 Specifically, their study challenged a priortheoretical model of litigation posited by George Priest and Benjamin Klein:“the fifty percent implication.”7 According to Priest and Klein’s theory, trialsoccur primarily in “close cases,” plaintiffs and defendants are equally adeptin predicting trial outcomes, plaintiffs will win about 50 percent of the casesthat proceed to trial, and “mistakes” about outcomes will be evenly distrib-uted between plaintiffs and defendants. Priest and Klein’s hypotheses,however, are discrepant with the data compiled by Gross and Seyverud:
Economic theories of trial and pretrial bargaining call to mind the standardimage of a competitive market: numerous individuals intelligently pursuingindependent self-interests. Social reality, as usual, is inconsiderate of globaltheories. In this case it provides a competing image that is less susceptible to
5Samuel Gross & Kent Syverud, Getting to No: A Study of Settlement Negotiations and theSelection of Cases for Trial, 90 Michigan L. Rev. 319 (1991); Gross & Syverud (1996), supra;Jeffrey Rachlinski, Gains, Losses and the Psychology of Litigation 70 S. Cal. L. Rev. 113 (1996).
6Gross & Syverud (1991), supra, at 319, 330, 379.
7George L. Priest & Benjamin Klein, The Selection of Disputes for Litigation, 13 J. of LegalStudies 1 (1984); George L. Priest, Reexamining the Selection Hypothesis, 14 J. of Legal Studies215 (1985).
554 Kiser et al.

statistical prediction: stragglers picking their way in the dark, trying to avoid anoccasional land mine.8
Presaging a broader application of behavioral economics’ framing conceptsto attorney/litigant settlement behavior, Gross and Syverud observed thatplaintiffs usually are more risk averse than defendants; plaintiffs and defen-dants attach “separate values to each possible outcome”; and “their stakesmay be unequal (or equal) with respect to victories, or defeats or both.”9
In their second study, Gross and Syverud added a sample of 359 casesreported between 1990 and 1991. Their results again conflicted with thePriest-Klein litigation model. Instead of a 50/50 distribution of “mistakes,”Gross and Syverud found that plaintiffs were more likely than defendants tomake a mistake, that is, to reject a settlement proposal that turned out to bethe same as or more favorable than the actual trial award. Plaintiffs were“clear losers” in 61 percent of the cases in their first sample (1985–1986) andin 65 percent of the cases in their second sample (1990–1991). The defen-dants, in contrast, made mistakes in only 25 percent and 26 percent, respec-tively, of the cases in the two samples.
In the third major empirical study of attorney/litigant decision makingin adjudicated cases, Rachlinski compared final settlement offers with juryawards in 656 cases. His data showed decision error by plaintiffs in 56.1percent of the cases, contrasted with a defendant decision error rate of 23percent. Although plaintiffs’ decision error rate was markedly higher thandefendants’ decision error rate, the average cost of plaintiffs’ decision errorwas dramatically smaller ($27,687) than defendants’ mean cost of error($354,900). Observing that litigants’ decisions are “suboptimal” and “maynot comport with rational theories of behavior,” Rachlinski found that the“consistently divergent risk preferences between plaintiff and defendant”could be explained by behavioral economics’ framing theories.10 Litigants’“risk preferences depend upon characterizing a decision as a gain or loss”and “vary systematically depending upon whether they are in the role ofplaintiff or defendant.”11 Plaintiffs are consistently risk averse, while defen-
8Gross & Syverud (1991), supra, at 385.
9Gross & Syverud (1991), supra, at 319, 381.
10Rachlinski, supra, at 114, 118, 120, 142.
11Rachlinski, supra, at 119.
Decision Making in Unsuccessful Settlement Negotiations 555
dants are risk seeking. Consequently, plaintiffs generally benefited fromlitigation and “defendants as a class paid heavily for their decision” to litigate:“When settlement negotiations failed, the plaintiffs were unwittingly forcedto undertake a risk that, on average, benefited them and cost the defendantsdearly.”12
III. Data and MethodsA. Data Source
The study database consists of 2,054 contested civil litigation cases reportedin Verdict Search California during the 38-month period between November2002 and December 2005. Verdict Search California, previously titled Califor-nia Jury Verdicts Weekly, is the primary reporting source for judgments andsettlements in California, and the reliability of its reports has been con-firmed in law review articles and by research studies.13 Gross and Syverud,for instance, “concluded that the information contained in the journal isreliable and found no systematic bias among the errors by either plaintiffor defendant to misreport the winning party, the size of the award, or thesettlement offers.”14 The Rand Corporation also utilized the data reportedin Verdict Search California to prepare its periodic reports on jury trialsand verdicts in major metropolitan areas, including “Trends in Civil JuryVerdicts Since 1985.”15
Verdict Search California does not report every verdict rendered inCalifornia but relies on voluntary submissions from attorneys and solicitsreports based on court dockets and trade publications. The informationVerdict Search California obtains from attorneys, including the parties, attor-neys, factual contentions, damages, results, and settlement offers, is com-piled in a draft case report. To confirm the contents of the draft case report,
12Rachlinski, supra, at 160.
13Gross & Syverud (1991), supra; Rachlinski, supra; M.A. Peterson & G.L. Priest, The Civil Jury:Trends in Trial and Verdicts, Cook County, Illinois, 1960–1979 (Rand Institute for Civil Justice1982); M.G. Shanley & M.A. Peterson, Comparative Justice: Civil Jury Verdicts in San Franciscoand Cook Counties, 1959–1980 (Rand Institute for Civil Justice 1983).
14Rachlinski, supra, at 149 n.133.
15Erik Moller, Trends in Civil Jury Verdicts Since 1985 (Institute for Civil Justice, RAND 1996).
556 Kiser et al.
Verdict Search California then attempts to contact counsel for all parties byfacsimile and telephone. All information received from the parties’ attor-neys, Verdict Search California affirms, is incorporated in the case report.Verdict Search publishes similar weekly verdict reports for the courts of NewYork and Texas and monthly reports for four other state courts.
Cases reported in Verdict Search California during the 38-month studyperiod were included in the study database if they met five basic require-ments: (1) a jury verdict, judge’s decision, or arbitrator’s award was enteredin a specific monetary amount; (2) the plaintiff submitted a settlementdemand in a specific monetary amount; (3) the defendant made a settle-ment offer in a specific monetary amount or its settlement offer wasdescribed as “none”; (4) there was no reported disagreement among theparties regarding the amount of the ultimate result and the parties’ priorsettlement positions; and (5) the parties were represented by counsel. Thestudy database thus is limited to documented cases in which the partiesconducted unsuccessful settlement negotiations and the parties’ liability, ifany, was ultimately decided by a judge, jury, or arbitrator.
The database excludes a few cases that otherwise might satisfy the fiverequirements above. Any trials concluded on technical or proceduralgrounds prior to an adjudication on the merits (for example, mistrials,directed verdicts, and defense verdicts based on motions for nonsuit,summary judgment, and judgment notwithstanding the verdict) wereexcluded. The outcome in those cases is a matter of law and frequentlyrepresents the losing attorney’s error of law, as opposed to an attorney/client decision about mixed and disputed issues of both fact and law. Classactions also are excluded from the database since the relationship betweenattorneys and clients in those cases is too attenuated to assess attorney/clientdecision making. Cases in which typographical or reporting mistakesappeared on the face of the report or the parties’ settlement positions werenot adequately allocated among multiple parties were eliminated.
B. Variables Identified and Classified in Database
The variables in this study consist of three variables (award, offer, anddemand) used to construct the dependent variable (decision error) and19 classes of independent variables (case types, two sets of party variables, 10sets of attorney variables, damage claim, 998 offers of compromise, forum,alleged wrong, insurance coverage, and pretrial ADR procedures). Variabledefinitions and coding methods are described below.
Decision Making in Unsuccessful Settlement Negotiations 557

1. Awards
The award in each case is the net financial award made by the judge, jury, orarbitrator. If an award to the plaintiff includes court costs and attorney feesin addition to the base award, the additional amounts were included. Grossawards were recalculated as necessary to adjust for comparative negligenceallocations, “high-low” agreements, workers’ compensation intervenorclaims, and similar legally mandated adjustments. In cases where the defen-dant prevails (defense verdict), the award is classified as $0 unless fees orcosts are awarded to the defendant. In those fee or cost award cases, the netresult is recorded; for example, an award of $10,000 in attorney fees to aprevailing defendant is recorded as a -$10,000 result.
In this article, the term “net award” refers to any net award in favor ofthe plaintiff; the term “win rate” refers to the incidence of plaintiff netawards. The term “defense verdict” includes any award in favor of the defen-dant and against the plaintiff; a defense verdict does not imply or necessitatean ancillary award of costs, fees, or monetary sanctions to the defendant.
2. Settlement Demands and Offers
The study records the last settlement offer made before the jury renders averdict, the judge issues a decision, or the arbitrator serves an award. Defen-dant offers are recorded as $0 when the Verdict Search California report states“none reported,” “none,” or “waiver of costs.”
Cases in which a precise monetary amount could not be ascertained(e.g., “$100,000 offer with an indication of $125,000,” “mid $800,000,” or“$50,000 plus reasonable attorneys fees”) were excluded from the study. Ifequitable relief was a component of the settlement negotiations (“$10,000plus return of the car”) or part of the award (“$15,000 to plaintiff anddefendant to forthwith return the car”), the case also was excluded.16
16About 4,600 cases were reported in Verdict Search California during the 38-month study period.Twenty-nine percent of those cases were excluded because they reported pretrial settlementsand thus did not proceed to an adjudicated outcome (coded as “mediated settlement” or“settlement” in the case data questionnaire), and 26 percent were excluded because the amountof settlement demands or offers was omitted or disputed, nonmonetary relief was sought, theparties were not represented by counsel, the trial was bifurcated and only the liability outcomewas reported, or the case did not otherwise meet the selection criteria described in Section III.Aand Section III.B.
558 Kiser et al.

Although the term “settlement offer” is used interchangeably todescribe settlement proposals by both plaintiffs and defendants, this articleusually employs the term “demand” to readily distinguish the plaintiff’s offer(“demand”) from the defendant’s offer (“offer”).
3. Case Type
Cases are classified by the type or nature of the legal claim asserted: contract,employment, fraud, intentional tort (nonfraud), medical malpractice, per-sonal injury, premises liability, eminent domain,17 product liability, negli-gence (nonpersonal injury), and other. These claims are tort, contract, andreal property disputes; Verdict Search California does not report trials in othertypes of state court civil cases, for example, family law and probate matters.
Cross-complaints are treated as separate cases where the parties’settlement positions can be distinguished between the complaint and thecross-complaint. Where multiple plaintiffs or defendants have severablesettlement positions or case outcomes, those cases also are coded as separatecases or excluded due to insufficient allocation information.
4. Parties
Both plaintiff and defendant parties are classified into nine categories: cor-poration, business (unincorporated business or possibly incorporated entitynot specifically identified in the case facts as a corporation), insurer, maleindividual, female individual, female/male individuals, public entity, trust,or “other” party type.
5. Attorneys
Plaintiff and defendant attorneys are identified and coded by gender; firmsize (whether among the 50 largest law firms in California as ranked by TheDaily Journal in 2003 or 2004 or California Lawyer in 2005); years of experi-ence after admission to the State Bar of California; academic rank of lawschool from which he or she graduated (whether a graduate of the nation’s20 best law schools as ranked by U.S. News and World Report in 2003, 2004, and
17The nominal positions of the parties in an eminent domain action (public entity as plaintiffand owner as defendant) are reversed in the data sets for consistency with their functional roles(owner seeks compensation from public entity) and eminent domain trial procedure (defen-dant owner assumes role of plaintiff in presenting its evidence first and commencing andconcluding the argument). California Code of Civil Procedure § 1260.210(a).
Decision Making in Unsuccessful Settlement Negotiations 559
2005); and diversity ranking of the law school from which he or she gradu-ated (whether a graduate of the 20 law schools with the highest diversityindex, as ranked by U.S. News and World Report in 2003, 2004, and 2005).18
The total number of attorneys included in the study database is 5,116,an estimated 17–21 percent of all California civil litigation attorneys.19
18California Top 50 Law Firms, Daily J. Extra, July 28, 2003, at 1–2; California Top 50 Law Firms,Daily J. Extra, July 26, 2004, at 14; Eric Cummins, The California 50, Cal. Law. (December 2005);Top 100 Law Schools, U.S. News & World Rep., retrieved Aug. 2, 2004, from !http://www.usnews.com/usnews/edu/grad/rankings/law/brief/lawrank_brief.php"; Law School DiversityIndex, U.S. News & World Rep., retrieved Aug. 2, 2004, from !http://www.usnews.com/usnews/edu/grad/rankings/law/brief/lawdiv_brief.php"; Schools of Law, The Top 100 Schools andLaw School Diversity, U.S. News and World Rep. 60–64 (2005). Verdict Search California reportsonly the name, firm, and location of the attorneys in each case. Data regarding other attorneycharacteristics, e.g., years of experience, law school, and law firm size, were obtained frommembership records on the State Bar of California’s public website, Martindale.com, theMartindale-Hubbell Law Directory, The Daily Journal’s California Directory of Attorneys, and thewebsites of the subject law firms. In cases where more than two attorneys represent one party,only the first two listed attorneys are coded, except where multiple law firms represent a singleparty. In those multiple law firm conditions, the first attorney listed in the first two law firms iscoded, to incorporate data from at least two different law firms representing that party. In publicentity cases, however, the perfunctory listing of the county counsel in the first position is ignoredand the next two listed attorneys from the county counsel’s office are coded.
19Some attorneys appear in more than one case in the database, although this is an infrequentoccurrence. Thus, the total number of individual attorneys is slightly less than 5,116. Althoughthe State Bar of California does not maintain records regarding the precise number of civillitigation attorneys in California, 16 percent of the attorneys responding to its February 2006survey identified civil litigation as their primary area or field of practice. Forty-five percent of thesurveyed attorneys indicated a “secondary area of legal practice,” and among that group 14percent designated “civil litigation” as the secondary area. When asked what state bar section themembers belonged to, only 7 percent of all surveyed members designated “litigation.” HertzResearch, Final Report of Results, Member Services Survey, The State Bar of California—February 2006 17 (2006). Another source, Martindale-Hubbell, indicates that litigation attor-neys comprise about 20 percent of all California attorneys, based on the total number ofattorneys and litigation attorneys obtained from Martindale.com in June 2006 for the 20 largestcities in California. Attorneys in the Martindale-Hubbell directory can list more than onepractice area. Hence, the Martindale-Hubbell data include attorneys who practice litigationexclusively and attorneys for whom litigation may be a secondary practice area. For the purposesof this study, acknowledging the limited data available and the possibility that attorneys forwhom litigation is a peripheral practice area do not often try cases to verdict, the estimatedpercentage of California litigation attorneys is 16–20 percent of the total 154,073 activemembers as of June 15, 2006. Thus, the total estimated number of California litigation attorneysis 24,652–30,814. Since the total number of attorneys included in the study database is 5,116, thestudy attorneys represent an estimated 17–21 percent of California civil litigation attorneys.
560 Kiser et al.

6. Nature of Damages
In classifying damages, the study applies the nomenclature of cognitivepsychology and behavioral economics theories, attempting to test the appli-cability of those theories to litigants’ behavior. Damages, accordingly, areclassified as either “current” damages (injuries, damages, and pain andsuffering already incurred or sustained, variously described in other studiesas out-of-pocket damages, expenditures, positive outlays, actual losses orexpenses, and reimbursements) or “future” damages (comparatively remoteclaims for prospective loss not yet paid or incurred, such as projectedmedical expenses, future lost earnings, profits, anticipated pain and suffer-ing, and royalties, variously referred to as “forgone gains,” “failure to makegains,” “negative losses,” “expected economic gains,” and “expectation inter-ests”).20 In addition, punitive damages are classified separately where specifi-cally sought.
7. Nature of Alleged Wrong
The study further classifies the underlying factual basis for the damage claimas an omission, commission, or both, again employing cognitive psychologyand behavioral economics nomenclature to test “omission/commissionbias,” that is, the tendency to judge acts of commission as more blameworthythan acts of omission even when they cause identical economic harm. Acollapsed lung allegedly caused by an assault, for instance, is coded as an actof commission, while the same injury, allegedly caused by an inattentivedriver overlooking a stop sign, is classified as an act of omission. The classi-fication is based on the plaintiff’s allegations; an allegation of negligencealone is coded as an omission, while allegations of reckless, intentional, andmalicious conduct, for example, are coded as commissions.
8. Forum
The type of adjudicator is coded as judge, arbitrator, or jury.21
20David Cohen & Jack L. Knetsch, Judicial Choice and Disparities Between Measures of Eco-nomic Value, in Choices, Values, and Frames, at 436–39 (Daniel Kahneman & Amos Tversky,eds., Press Syndicate of the University of Cambridge 2000).
21Gross and Syverud and Rachlinski limited their Verdict Search California data to jury verdicts.During the 10-year period after publication of their articles, the number of arbitration casesreported in Verdict Search California, as a percentage of all reported cases, has steadily
Decision Making in Unsuccessful Settlement Negotiations 561
9. Section 998 Offers of Compromise
The study database records whether a party submitted a settlement demandor offer under California Code of Civil Procedure Section 998 (a “998offer”). This statutory “offer of compromise” procedure, similar to Rule 68 ofthe Federal Rules of Civil Procedure, is intended to promote settlement byshifting certain costs onto a party who declines a 998 offer and fails to obtaina more favorable judgment at trial. The inclusion of this factor tests whetherthis cost-shifting sanction, as applied to these non-settling parties, promotesrational settlement positions or incites risk-taking negotiating behavior, asshown in Rachlinski’s study of a “loser pays” litigation system and somebehavioral economics studies of incentives and penalties.
10. Insurance
The existence of a reported insurer is coded in the database.22
11. Pretrial Dispute Resolution Procedures
The study database records whether a party reported participation in apretrial alternative dispute resolution procedure, either nonbinding arbitra-tion or mediation.23
increased, doubling between 1997 and 2006. Conversely, the percentage of reported juryverdicts decreased from 82 percent to 51 percent during that period, reflecting an increasedreporting of arbitrations and settlements. In an email to a co-author dated May 31, 2007, theeditor of Verdict Search California confirmed that the reporting and verification procedures forjury verdicts, bench decisions, and arbitration awards are identical.
22Attorneys may underreport insurance, as many Verdict Search California case reports omit the“Insurer(s)” section but indicate elsewhere that insurance existed. In the settlement demandpart of the report, for instance, an attorney may report a “policy limits” demand but fail toreport a carrier in the insurer section of the report. In cases where insurance is indicated but notexplicitly reported in the insurer section, the existence of insurer was coded.
23Parties’ participation in alternative dispute resolution procedures probably is underreported.Many case reports omit the “Arbitrator/Mediator” or “Neutral” section but indicate elsewherethat the parties participated in some form of ADR. The settlement demand part of the report,for instance, may state “$26,000 (Arbitration Award)” but omit the “Neutral” section. In caseswhere ADR participation is indicated but not expressly reported in the “Arbitrator/Mediator” or“Neutral” section, the case is coded for ADR participation.
562 Kiser et al.
C. Definition—Decision Error
Both Rachlinski and Gross and Syverud regard as error a party’s failure toachieve a more favorable result at trial than could have been achieved byaccepting the adverse party’s demand or offer. Under this definition, a partyerrs when the award is the same as or worse than the demand or offer itdeclined. As Gross and Syverud state: “Any plaintiff who was offered as muchas the verdict or more, and any defendant who could have settled for asmuch as the verdict or less, has lost.”24
A “decision error,” for purposes of this study, thus occurs when eithera plaintiff or a defendant decides to reject an adversary’s settlement offer,proceeds to trial, and finds that the result at trial is financially the same as orworse than the rejected settlement offer—the “oops” phenomenon. In abso-lute terms, the attorney and/or client made a decision error and the clientsustained an unequivocal, quantifiable financial loss.25 Decision error isstrictly a mathematical calculation and does not signify or connote attorneynegligence.
D. Methods
Having enumerated the variables that could affect decision making in settle-ment negotiations, we now identify the methodological approaches forunderstanding the most salient relationships in the Verdict Search Californiadata. Decision error, our dependent variable, consists of three categories:plaintiff error, defendant error, and no error. Similarly, all our dependentvariables are categorical; from the 19 classes of explanatory variables identi-fied in the previous section (e.g., party or case type), we constructed 72 0/1indicator variables (e.g., whether the plaintiff was a corporation or individualand whether the case type was a contract or medical malpractice dispute).We modeled the effect of these variables on decision error via multinomiallogistic regression.
24Gross & Syverud (1996), supra, at 41–42.
25Parties, of course, may be motivated to litigate for reasons other than obtaining an optimaleconomic outcome. Gross and Syverud (1996), however, interviewed 735 attorneys in their dataset and reported that “only three attorneys mentioned a desire for vindication as an explanationfor why their case went to trial,” and a “noneconomic motive” was highly infrequent.” Supra, at57.
Decision Making in Unsuccessful Settlement Negotiations 563

As the number of explanatory variables is exceedingly large, we used avariety of techniques to determine which of the covariates were most perti-nent for predicting decision error. For example, when we fit the model tothe full set of covariates, a large number of the 146 coefficients26 were notsignificant at any standard level. Deciding which of these variables to includein our model presented a challenge because, when conducting a largenumber of statistical tests, any standard level of statistical significance risksincorrectly rejecting several true null hypotheses of zero effect (i.e., themultiple comparisons problem). We attempted to obviate this problem inseveral separate (though related) ways. In general, our methods were bothconservative and consistent in their results; thus, our goal—allowing the datato determine which covariates had the strongest statistical effect27—was well-served by them.
The first method we used to reduce our predictor set was to simply usethe individual coefficient p values, with a Bonferroni adjustment for multiplecomparisons. The Bonferroni threshold is quite high, requiring a variable inour data set to have a p value of 0.00034 to remain in the model. Notsurprisingly, very few variables achieved this level of statistical significance(the indicator for medical malpractice cases, forum, and the two 998 offer ofcompromise variables).
Second, rather than looking at p values for individual coefficients, welooked at the p values generated by log-likelihood tests on our 19 variableclasses (see Appendix), again taking multiple comparisons into account.When we did this, five variable groups remained: plaintiff attorney gender,case type, nature of damages, forum, and the two 998 offer of compromisevariables.28 Thus, this second method identified variables that were verysimilar to those identified by our first method.
Finally, we looked at the model chosen by the well-known Bayesianinformation criterion (BIC). This criterion is noted for finding parsimoni-ous models that are consistent and practically efficient. Essentially, the BIC
26(3 decision error types - 1 base type) * (72 variables + 1 intercept) = 146 coefficients.
27Had our goal been, for example, either prediction of decision error probability vector or theidentification of all factors that influence decision error, we may have included more covariates.We commend these as fruitful areas for further research.
28We do not consider plaintiff attorney gender in the remainder of the article because in boththe full model and the reduced model containing only these five variable groups, none of theindividual plaintiff attorney gender coefficients was statistically significant.
564 Kiser et al.

assigns a score to a model based on the quality of the fit along with a penaltyfor the number of variables used. Due to this penalty factor, the BIC can berobust to overfitting and avoid selection of spurious variables (as would bedone if one ran the full model and took all variables with p values less than0.05). Because there were 273 (approximately 1022) different possible models,we could not evaluate them all and choose the one with the best BIC.Instead, we used a procedure that evaluated models one by one until the BICstopped improving; since roughly the same variables were selected when weprovided the procedure with different starting points, we were satisfied thatthe key predictor variables were identified. We present one such model inTable 4 and note that it largely agrees with the results of the two othermodels mentioned above.
Because multinomial logistic regression coefficients can be difficult tointerpret,29 we use univariate and bivariate tables (in addition to the regres-sion output table) to summarize the effects of indicator variables identifiedby the multivariate analysis as most significant. The advantage of thisapproach, beyond simplifying the explanation of the relationships, is that italso permits a presentation of the cost of error, not just the kind of error,precisely as described by Rachlinksi in his work on this subject.
IV. Study Results
The study results are summarized in this order: Section IV.A presentsthe aggregate study results, compares those results with prior studies, and
29The multinomial logit model assumes that the conditional probability of a given class is of theform:
P Y j XX
X
j
ii
J=( ) = ( )
( )=#
exp
exp,
$
$1
where j = 1, . . . , J where the vector b1 is assumed to be zero without loss of generality in orderto identify the model. The numbering of the categories is arbitrary and in our case we take “noerror” to be Category 1, “plaintiff error” to be Category 2, and “defendant error” to be Category3. This model specification implies that the log odds of plaintiff error (or defendant error)relative to the base category (no error) follows a linear function. That is, the regressioncoefficients can be interpreted in the ordinary way when applied to the log odds. Since all ourcovariates are categorical variables, the estimated coefficients show the change in the log oddson a case for which this variable is true compared to one for which it is false.
Decision Making in Unsuccessful Settlement Negotiations 565
provides a historical context for those results; Section IV.B explains themultivariate analysis and discusses the effects of four key variables (offersto compromise, case type, forum, and nature of damages); and SectionIV.C summarizes and compares the results from the attorney/mediatorsample.
A. Decision Error and its Costs—General Overview
To facilitate comparisons with earlier works and to highlight the robustnessof results across alternative formulations and samples, we have chosen tosummarize our findings using the tabular framework adopted by Rachlinski(1996). It succinctly captures both the prevalence of decision error by plain-tiffs and defendants and the magnitude of those errors. Multiplying thosetwo aggregate measures—decision error (in percent) and mean cost oferror—yields an estimate of the expected cost of each party’s error.
1. Aggregate Results
As indicated in Table 1, the incidence of decision error for plaintiffs ishigher than for defendants, but the cost of decision error is higher fordefendants than for plaintiffs. In this sample of adjudicated cases, plaintiffscommitted decision error, receiving an award less than or equal to the lastoffer made by the defendant, in 61.2 percent of the cases. By contrast,defendants committed decision error in 24.3 percent of the cases.30 None-theless, there is a substantial difference in mean cost of error betweenplaintiffs and defendants ($43,100 and $1,140,000, respectively31). Given therelatively large discrepancy between the parties’ mean cost of error, it is notsurprising that the expected cost of error is greater for defendants by a factorof 10.
The findings from our sample are qualitatively similar to those ofRachlinski (1996). Some quantitative differences, however, are noteworthy.Though defendants’ decision error did not change substantially (24.3percent in our sample compared with 23.0 percent in Rachlinski’s sample),plaintiffs’ decision error rose from 56.1 percent to 61.2 percent, with a
30Decision error rates are significantly different at the 0.01 level.
31Significantly different at the 0.01 level.
566 Kiser et al.

corresponding decline in “no error” cases from 20.9 percent to 14.5 percent.The largest change was in defendants’ mean cost of error, with mean cost oferror rising from $354,900 to $1,140,000 and expected cost of error risingfrom $81,600 to $277,300. Even after adjusting for inflation, there was a 78percent rise in defendants’ mean cost of error and an 89 percent increase indefendants’ expected cost of error. Notwithstanding the increase in plain-tiffs’ decision error, their mean cost of error after adjusting for inflation waslower in the 2003–2005 period relative to Rachlinski’s results in the 1981–1988 period. The declines in plaintiffs’ real mean cost of error and realexpected cost of error were 14 percent and 5 percent, respectively.
Our sample findings also parallel the decision error rates compiled byGross and Syverud (1996). The plaintiffs’ decision error rate of 61.2 percentin our study nearly replicates Gross and Syverud’s conclusion that “plaintiffswere clear losers in most of these trials, at least in economic terms—61%overall in 1985–86, 65% in 1990–91.”32 The defendants’ decision error rateof 24.3 percent in our study closely reflects the 25 percent and 26 percentdefense error rates in Gross and Syverud’s 1985–1986 and 1990–1991samples, respectively.
Defendants’ relatively high mean cost of error in our study ($1,140,000for defendants vs. $43,100 for plaintiffs) is consistent with the “framing”effects discerned by both Gross and Syverud and Rachlinski. Gross andSyverud found that plaintiffs usually are more risk averse than defendants,and Rachlinski concluded that “plaintiffs behavior was, on balance, risk-averse,” while defendants’ behavior “can only be described as risk-seeking.”33
32Gross and Syverud (1996), supra, at 42.
33Gross and Syverud (1991), supra, at 381; Rachlinski (1996), supra, at 159.
Table 1: Decision Error and Cost of Error—All Cases
Error Type
Decision Error
MeanAward
($1,000s)
MeanDemand
($1,000s)
MeanOffer
($1,000s)
Cost of Error
# ofCases
% ofCases
MeanCost ofError
($1,000s)
ExpectedCost ofError
($1,000s)
No error 296 14.5% 467.8 918.6 191.3 NA NAPlaintiff error 1250 61.2% 5.7 565.8 48.7 43.1 26.4Defendant error 497 24.3% 1,910.9 770.9 222.4 1,140.0 277.3
Decision Making in Unsuccessful Settlement Negotiations 567
2. Historical Context
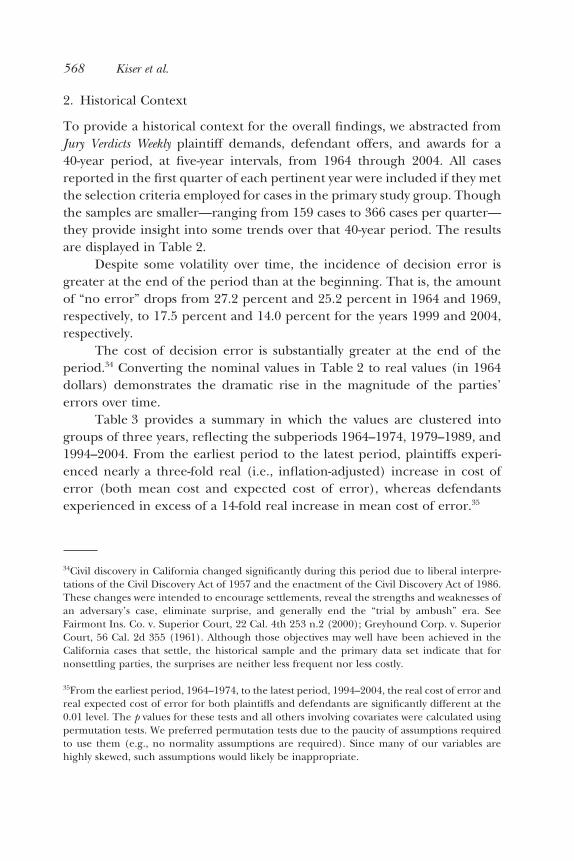
To provide a historical context for the overall findings, we abstracted fromJury Verdicts Weekly plaintiff demands, defendant offers, and awards for a40-year period, at five-year intervals, from 1964 through 2004. All casesreported in the first quarter of each pertinent year were included if they metthe selection criteria employed for cases in the primary study group. Thoughthe samples are smaller—ranging from 159 cases to 366 cases per quarter—they provide insight into some trends over that 40-year period. The resultsare displayed in Table 2.
Despite some volatility over time, the incidence of decision error isgreater at the end of the period than at the beginning. That is, the amountof “no error” drops from 27.2 percent and 25.2 percent in 1964 and 1969,respectively, to 17.5 percent and 14.0 percent for the years 1999 and 2004,respectively.
The cost of decision error is substantially greater at the end of theperiod.34 Converting the nominal values in Table 2 to real values (in 1964dollars) demonstrates the dramatic rise in the magnitude of the parties’errors over time.
Table 3 provides a summary in which the values are clustered intogroups of three years, reflecting the subperiods 1964–1974, 1979–1989, and1994–2004. From the earliest period to the latest period, plaintiffs experi-enced nearly a three-fold real (i.e., inflation-adjusted) increase in cost oferror (both mean cost and expected cost of error), whereas defendantsexperienced in excess of a 14-fold real increase in mean cost of error.35
34Civil discovery in California changed significantly during this period due to liberal interpre-tations of the Civil Discovery Act of 1957 and the enactment of the Civil Discovery Act of 1986.These changes were intended to encourage settlements, reveal the strengths and weaknesses ofan adversary’s case, eliminate surprise, and generally end the “trial by ambush” era. SeeFairmont Ins. Co. v. Superior Court, 22 Cal. 4th 253 n.2 (2000); Greyhound Corp. v. SuperiorCourt, 56 Cal. 2d 355 (1961). Although those objectives may well have been achieved in theCalifornia cases that settle, the historical sample and the primary data set indicate that fornonsettling parties, the surprises are neither less frequent nor less costly.
35From the earliest period, 1964–1974, to the latest period, 1994–2004, the real cost of error andreal expected cost of error for both plaintiffs and defendants are significantly different at the0.01 level. The p values for these tests and all others involving covariates were calculated usingpermutation tests. We preferred permutation tests due to the paucity of assumptions requiredto use them (e.g., no normality assumptions are required). Since many of our variables arehighly skewed, such assumptions would likely be inappropriate.
568 Kiser et al.
Tab
le2:
Dec
isio
nEr
ror
and
Cos
tof
Erro
r—H
isto
rica
lSam
ples
Year
Erro
rT
ype
Dec
ision
Erro
r
Mea
nA
war
d($
1,00
0’s)
Mea
nD
eman
d($
1,00
0’s)
Mea
nO
ffer
($1,
000’
s)
Cost
ofEr
ror
#of
Case
s%
ofCa
ses
Mea
nCo
stof
Erro
r($
1,00
0’s)
Expe
cted
Cost
ofEr
ror
($1,
000’
s)
1964
No
erro
r50
27.2
%11
.522
.14.
0N
AN
A19
64Pl
aint
iffer
ror
9953
.8%
2.0
11.5
3.1
1.2
0.6
1964
Def
enda
nter
ror
3519
.0%
19.4
13.5
5.7
5.9
1.1
1969
No
erro
r40
25.2
%26
.235
.415
.6N
AN
A19
69Pl
aint
iffer
ror
7949
.7%
3.0
21.6
4.8
1.8
0.9
1969
Def
enda
nter
ror
4025
.2%
62.2
34.9
9.9
27.3
6.9
1974
No
erro
r48
14.7
%32
.452
.112
.9N
AN
A19
74Pl
aint
iffer
ror
214
65.4
%1.
727
.87.
45.
73.
719
74D
efen
dant
erro
r65
19.9
%13
2.4
89.8
16.3
42.6
8.5
1979
No
erro
r39
19.3
%20
.551
.89.
8N
AN
A19
79Pl
aint
iffer
ror
117
57.9
%1.
879
.28.
46.
63.
819
79D
efen
dant
erro
r46
22.8
%13
2.7
65.0
23.0
67.7
15.4
1984
No
erro
r25
11.3
%75
.114
2.6
18.4
NA
NA
1984
Plai
ntiff
erro
r13
862
.4%
2.7
199.
521
.018
.411
.519
84D
efen
dant
erro
r58
26.2
%85
1.2
222.
730
.862
8.4
164.
919
89N
oer
ror
2615
.0%
878.
71,
552.
816
5.8
NA
NA
1989
Plai
ntiff
erro
r10
963
.0%
4.6
296.
043
.038
.424
.219
89D
efen
dant
erro
r38
22.0
%1,
006.
746
0.2
79.3
546.
512
0.0
1994
No
erro
r20
10.2
%31
4.4
493.
812
3.9
NA
NA
1994
Plai
ntiff
erro
r13
367
.9%
4.0
366.
226
.422
.415
.219
94D
efen
dant
erro
r43
21.9
%1,
550.
643
0.0
95.3
1,12
0.6
245.
819
99N
oer
ror
6417
.5%
219.
045
4.6
43.1
NA
NA
1999
Plai
ntiff
erro
r22
060
.1%
34.2
668.
379
.945
.727
.419
99D
efen
dant
erro
r82
22.4
%2,
798.
753
9.0
146.
62,
259.
850
6.3
2004
No
erro
r25
14.0
%22
1.1
502.
379
.5N
AN
A20
04Pl
aint
iffer
ror
117
65.7
%12
.960
1.1
53.7
40.8
26.8
2004
Def
enda
nter
ror
3620
.2%
1,51
9.4
870.
365
1.0
649.
113
1.3
Decision Making in Unsuccessful Settlement Negotiations 569

B. Decision Error and its Costs—Results from the Multivariate Analysis
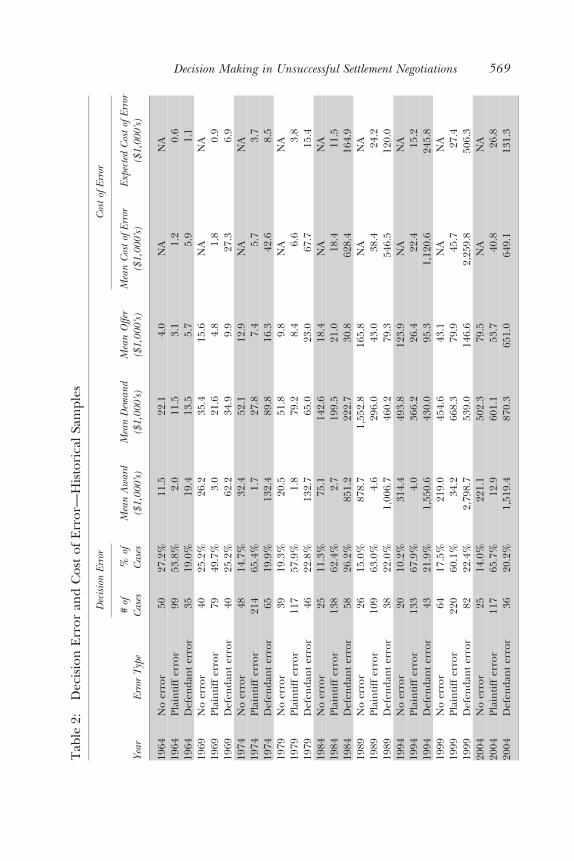
Table 436 gives the estimated effect of a given variable on the log odds ofplaintiff decision error (defendant decision error) relative to no decisionerror. Though we will not focus on it at length, there are a few points worthnoting. Examination of individual p values is not appropriate since themodel presented here was selected by searching over the model space; thatsaid, the coefficients appear to be statistically significant. In addition, we notethat the coefficients imply changes in the predicted probability of anoutcome (i.e., plaintiff decision error, defendant decision error, or no error)that comport well with legal intuition. This can be seen by completing somesimple numerical calculations to back out the implied probabilities from thelog odds.
Before proceeding with the more illuminating univariate and bivariatetables, it is worthwhile to discuss the variables briefly. The predictor variablestend to fall into two types of categories that can be thought of as “actor” and“context” related. Actor variables describe the type of plaintiff or defendant(e.g., corporation, individual, unincorporated business entity) and the attor-neys (e.g., gender, law firm size, law school ranking, experience). Contextvariables, on the other hand, are the conditions under which the actors—attorneys and parties—make settlement decisions, for example, whether 998offers were served, the forum in which a case is being tried, the type of case,
36This table is for the model selected by BIC. As mentioned in the text, the models selected bysignificance tests were largely similar so it would be redundant to present them all.
Table 3: Cost of Error in Constant 1964 Dollars
Period Type of ErrorMean Cost of
Error ($1,000s)Expected Cost ofError ($1,000s)
1964, 1969, 1974Plaintiff error 2.6 1.5Defendant error 20.5 4.3
1979, 1984, 1989Plaintiff error 5.9 3.6Defendant error 122.5 29.2
1994, 1999, 2004Plaintiff error 7.0 4.4Defendant error 300.6 65.4
570 Kiser et al.
or the nature of alleged damages. Our final models selected only contextvariables, no actor variables having been selected by the statistical proce-dures previously described.
By far the most important variables were those indicating whether theplaintiff or the defendant had served 998 offers. All the variable selectionmethodologies identified these variables as very strong predictors. In addi-tion, some of the case type variables were identified as being important.Particularly, medical malpractice cases, contract cases, and personal injurycases were important factors for predicting whether one of the parties madea decision error. Other variables that were useful for predicting the inci-dence of decision error were the types of damages alleged as well as theforum in which the case was resolved.
The results shown below in the tabular format are qualitatively quitesimilar to the regression results. We will focus on 998 offers and case typesince they are the most interesting and dramatic, though we will also discussthe forum and nature of damages variables. In particular, the results on 998offers will be compared to Rachlinski’s results for “loser pays” legislation.Though loser pay schemes and 998 offers differ in structure, they are con-ceptually similar in imposing financial penalties dependent on the case
Table 4: Decision Error Multinomial Logistic Regression Results
Variable: Effect on Party’s DE Value s.e. t Value
Intercept: P -0.538 0.341 -1.578Intercept: D -0.067 0.310 -0.215P 998 offer: P -0.503 0.175 -2.870P 998 offer: D 1.091 0.183 5.956D 998 offer: P 0.930 0.175 5.303D 998 offer: D -0.374 0.201 -1.856Forum—bench: P 1.528 0.445 3.436Forum—bench: D 0.574 0.417 1.376Forum—jury: P 2.123 0.328 6.474Forum—jury: D 0.276 0.292 0.945Case type—med mal: P 1.932 0.323 5.974Case type—med mal: D 0.733 0.351 2.088Case Type—contract: P -0.030 0.286 -0.105Case Type—contract: D 0.922 0.293 3.151Case type—personal injury: P -0.752 0.157 -4.794Case type—personal injury: D -0.272 0.179 -1.522Damages—punitive: P -0.437 0.293 -1.494Damages—punitive: D 0.458 0.304 1.503Residual deviance: 3319.733 on 4,016 degrees of freedomLog-likelihood: -1659.867 on 4,016 degrees of freedom
Decision Making in Unsuccessful Settlement Negotiations 571
outcome. In addition, the results on type of case will be compared to the casetype analysis performed by Gross and Syverud. However, as we will indicate,one must be careful comparing the results by case type because case codingmethods are not identical and this study includes bench trials and arbitra-tion awards, while prior studies were limited to jury trials.
1. Effects of 998 Offers
California Code of Civil Procedure Section 998 is a statutory cost-shiftingmechanism designed to encourage settlement and penalize unreasonablesettlement positions. Any party can serve a written “998 offer” on the otherparty while a case is pending, up to 10 days before trial commences.37 A partywho does not accept an adverse party’s 998 offer and obtains a worse resultat trial may be liable for the adverse party’s court costs, expert witness fees,and, in personal injury cases, interest from the date of the offer. “Thepurpose of section 998,” the court held in Taing v. Johnson Scaffolding Co.,38 “isto encourage the settlement of lawsuits before trial by penalizing a party whofails to accept a reasonable offer from the other party.”39
The multivariate analysis indicated the importance of 998 offers inexplaining decision error for both parties. The results of the four possible998 conditions (no 998 offer, plaintiff only 998 offer, defendant only 998offer, and dual plaintiff/defendant 998 offers) are shown in the followingfour related tables. Table 5, Panel 5a summarizes the results for those casesin which no 998 offers were served. Representing 1,196 cases, or 59 percentof the entire sample, this panel indicates that the incidence of decision errorby both plaintiffs and defendants in the “no 998 offer” condition is notsubstantially different from the overall study results presented in Table 1.
We compare the results for those cases in which one or both partiessubmitted a 998 offer with the “no 998 offers” in Table 5, Panel 5a. Therewere 847 cases (41 percent of the sample) in which one or both parties
37The “offer of compromise” under Section 998 must expressly refer to the statute or otherwisenotify the offeree that costs otherwise allowed to a prevailing party may be reduced or aug-mented if the offer is not accepted. See Stell v. Jay Hales Dev. Co., 11 Cal. App. 4th 1214, 1231,1232 (1992). An oral offer purportedly made under Section 998, even if placed on the recordduring a deposition, does not satisfy the statutory requirements. Saba v. Crater, 62 Cal. App. 4th150, 153 (1998).
389 Cal. App. 4th 579, 583 (1992).
39Taing was distinguished in Bihun v. AT&T Info. Sys., 13 Cal. App. 4th 976 (1993).
572 Kiser et al.

Tab
le5:
Dec
isio
nEr
ror
and
Cos
tof
Erro
r—T
heEf
fect
sof
998
Off
ers
Erro
rT
ype
Dec
ision
Erro
r
Mea
nA
war
d($
1,00
0s)
Mea
nD
eman
d($
1,00
0s)
Mea
nO
ffer
($1,
000s
)
Cost
ofEr
ror
#of
Case
s%
ofCa
ses
Mea
nCo
stof
Erro
r($
1,00
0s)
Expe
cted
Cost
ofEr
ror
($1,
000s
)
Pane
l5a:
No
998
Off
ers
No
erro
r19
516
.3%
573.
81,
173.
824
9.4
NA
NA
Plai
ntiff
erro
r73
361
.3%
8.6
647.
253
.344
.727
.4D
efen
dant
erro
r26
822
.4%
2,11
5.1
815.
717
4.5
1,29
9.4
291.
2
Pane
l5b:
998
Off
ers
byPl
aint
iffs
Onl
yN
oer
ror
3412
.5%
246.
245
7.5
67.7
NA
NA
Plai
ntiff
erro
r11
241
.2%
15.9
450.
735
.119
.27.
9D
efen
dant
erro
r12
646
.3%
2,35
8.1
988.
040
0.3
1,37
0.1
634.
7
Pane
l5c:
998
Off
ers
byD
efen
dant
sO
nly
No
erro
r29
10.2
%26
5.5
407.
410
8.6
NA
NA
Plai
ntiff
erro
r23
683
.1%
(0.3
)56
2.2
39.2
39.5
32.8
Def
enda
nter
ror
196.
7%2,
192.
51,
088.
743
7.3
1,10
3.9
73.9
Pane
l5d:
998
Off
ers
byB
oth
Plai
ntif
fsan
dD
efen
dant
sN
oer
ror
3813
.1%
276.
241
1.5
66.8
NA
NA
Plai
ntiff
erro
r16
958
.1%
(5.5
)29
4.4
51.4
57.0
33.1
Def
enda
nter
ror
8428
.9%
525.
123
0.6
59.5
294.
585
.0
Decision Making in Unsuccessful Settlement Negotiations 573
served 998 offers: 272 by plaintiffs only, 284 by defendants only, and 291 byboth parties. The results for those subsamples are contained in Panels 5b, 5c,and 5d, respectively. Jointly, the table supports the notion that, other thingsbeing equal (or at the margin), serving a 998 offer reduces both decisionerror and mean cost of error for the serving party, though it increasesdecision errors and expected cost of error for the recipient party. Interest-ingly, total decision error always increases in the presence of a 998 offer (i.e.,“no error” is always a lower percent when 998 offers are served). This is dueto the fact that the reduction in the serving party’s decision error is morethan offset by the rise in the recipient party’s decision error. The effect onoverall cost of error depends on who is serving and receiving the 998 offer—this owing to the fact that the magnitudes of change in cost of error fordefendants are substantial both when making and receiving 998 offers, andrelatively more so when receiving a 998 offer.
As is evident from Table 5, Panel 5b, a plaintiff 998 offer reduces bothdecision error and cost of error for plaintiffs, but raises both types of errorsfor defendants (i.e., more risk-taking behavior by defendants).40 Similarly,Panel 5c demonstrates that a defendant 998 offer reduces both decisionerror and cost of error for the defendant. The presence of a defendant 998offer, however, sharply increases plaintiffs’ decision error rates. Althoughthere is a slight reduction in plaintiffs’ mean cost of error when defendantsserve a 998 offer, the expected cost of error rises because of the much higherdegree of plaintiff decision error (i.e., a somewhat lower mean multiplied bya much higher decision error percentage).41
When both parties serve 998 offers, theory cannot predict the finalresult; the result is an empirical issue. Table 5, Panel 5d provides the resultsfor the dual 998 offer condition. For plaintiffs in the dual 998 offer condi-
40Except for defendant mean cost of error ($1,299,400 vs. $1,370,100), all differences arestatistically significant. That is, the reduction in decision error in cases where the plaintiffs made998 offers relative to those cases in which no 998 offers were made (41.2 percent vs. 61.3percent), and the rise in decision error among defendants in those same cases (46.3 percent vs.22.4 percent) are both significant at the 0.01 level. The reductions in plaintiffs’ mean cost oferror and expected mean cost of error ($44,700 vs. $19,200 and $27,400 v. $7.900) as well as therise in defendants’ expected cost of error ($291,200 vs. $634,700) are all significant at the 0.02level or lower.
41The reduction in defendants’ decision error (6.7 percent vs. 22.4 percent) as well as the risein plaintiffs’ decision error (83.1 percent vs. 61.3 percent) are significant at the 0.01 level.However, other than the value of defendants’ expected cost of error, the differences in othervalues of mean cost and expected mean cost are not significant at the 0.05 level.
574 Kiser et al.

tion, there is a slight reduction in decision error compared with the “no 998offer” condition (58.1 percent vs. 61.3 percent) and a slight increase in themean cost of error ($57,000 vs. $44,700) and expected cost of error ($33,100vs. $27,400). For defendants in the dual 998 offer condition, there is anincrease in the defendants’ decision error compared with the “no 998 offer”condition (28.9 percent vs. 22.4 percent) and a more substantial decrease inthe mean cost of error ($294,500 vs. $1,299,400) and expected cost of error($85,000 vs. $291,200).42
The purpose of 998 offers is to encourage settlements by imposingfinancial penalties on parties who take unreasonable settlement positions.Cost-shifting statutory schemes like the 998 offer to compromise and itsfederal counterpart, Rule 68, however, may actually induce risk takingby the parties and may provoke the gambling mentality they are intendedto curb. Rachlinski’s study of “loser pays” systems, enacted to deter merit-less lawsuits and increase settlements, found that “by raising the stakes attrial, the loser-pays system makes litigation itself more valuable and candiscourage settlement.”43 In this study, the 998 offer procedure mayproduce that unintended consequence as well. (This observation, ofcourse, is limited to this study of adjudicated cases; 998 offers may beeffective in inducing reasonable conduct in settled cases.) Higher decisionerror rates in this study were correlated with the receipt of a 998 offer; thisraises the question of whether the 998 statutory scheme actually heightensrisk-seeking behavior by the recipient party, contrary to the legislativeintent.44
42None of the differences for plaintiffs (decision error, mean cost of error, or expected meancost of error) is significant at the 0.05 level, though all the differences for defendants aresignificant at the 0.05 level.
43Rachlinski, supra, at 161.
44The reduction in the “no decision error” rate (i.e., the increase in overall decision error) inthe presence of defendant offers relative to no 998 offers (10.2 percent vs. 16.3 percent) issignificant at the 0.01 level. Though the changes in “no decision error” rates under plaintiff 998offers (12.5 percent vs. 16.3 percent) and joint 998 offers (13.1 percent vs. 16.3 percent) are notstatistically significant at the 0.05 level (with a two-sided test), they are lower rather than higher,meaning that the point estimates indicate greater decision error rather than reduced decisionerror as intended by the legislature (a one-sided test would imply a p value of zero for all threecomparisons).
Decision Making in Unsuccessful Settlement Negotiations 575

One may argue that a 998 offer does not cause the risk-taking behav-ior but, rather, is propounded to curb or penalize extreme settlement posi-tions after an adverse party has manifested unreasonable settlementbehavior. Under this argument, a 998 offer may be a reaction to, not acause of, an adverse party’s risk-taking behavior. The weakness in this argu-ment is that it overlooks the underlying intent of the 998 statutory proce-dure: to promote reasonable settlement behavior by imposing a financialpenalty on unreasonable settlement positions, whether the recipient partyis a reckless or a rational decision maker. Although 998 offers may have asalutary effect on those cases that settle, in this sample of adjudicated casesthe service of a 998 offer was correlated with significantly higher decisionerror by the recipient party.
2. Effects of Case Type
Under the Priest and Klein “fifty percent implication,” one expects win ratesand decision error rates to be balanced between the parties and unaffectedby the case type. Plaintiffs would win 50 percent of their cases, regardless ofcase types and, with respect to decision error, plaintiffs and defendantswould be “equally successful at predicting the outcomes of the cases.”45 Priestand Klein note that “the most important assumption of the model is thatpotential litigants form rational estimates of the likely decision, whether it isbased on applicable legal precedent or judicial or jury bias.”46 Their 50percent implication further assumes that litigation costs are relatively highcompared to settlement costs, the application of legal standards is predict-able, both parties can predict outcomes with “equal precision,” and thestakes are “symmetrical” to the parties, that is, gains and losses from litigation“are equal to both parties.”47 The assumptions and predictive capacity of thePriest and Klein model, however, are challenged by the study data showingthat both win rates and error rates vary widely with different types of cases, asshown in Tables 6 and 7.
45Gross and Syverud, supra, at 325.
46Priest & Klein (1984), supra, at 4.
47Priest & Klein (1984), supra, at 5, 12, 14, 19, 20, 24.
576 Kiser et al.

In general, high plaintiff error rates are associated with cases inwhich contingency fee arrangements are common, for example, personalinjury (53 percent error rate) and medical malpractice (81 percent errorrate), while low error rates are associated with cases in which contingencyfee arrangements are uncommon, for example, contracts (44 percent errorrate) and eminent domain (42 percent error rate).48 On the defense side,high error rates are noted in cases where insurance coverage is generallyunavailable, for example, contracts (44 percent) and fraud (40 percent),while low error rates are associated with cases in which insurers are morelikely to represent defendants, for example, premises liability (17.5 percenterror rate) and personal injury (26.3 percent error rate).
48The higher error rates attendant to plaintiff contingency fee cases may reflect optimisticoverconfidence. In one study, lawyers retained on a contingency basis showed the same level ofconfidence about case outcomes as other lawyers, although the contingency basis attorneys wononly 42 percent of their cases compared with an overall 56 percent win rate. In general, thatstudy found that lawyers’ predictions regarding whether they would win their case “showed nopredictive validity” and were “hardly above chance.” They exhibited a marked “overextremitybias (underprediction of success for low probabilities and overprediction of success for highprobabilities).” J. Goodman-Delahunty, P.A. Granhag & E.F. Loftus, How Well Can LawyersPredict Their Chances of Success? Unpublished manuscript (University of Washington 1998),cited in Derek J. Koehler, Lyle Brenner & Dale Griffin, The Calibration of Expert Judgment:Heuristics and Biases Beyond the Laboratory, in Heuristics and Biases: The Psychology ofIntuitive Judgment 705, 706 (Thomas Gilovich, Dale Griffin & Daniel Kahneman, eds., PressSyndicate of the University of Cambridge 2002). For other results regarding attorneys’ predic-tive capabilities, see Elizabeth F. Loftus & Willem A. Wagenaar, Lawyers’ Predictions of Success,28 Jurimetrics 437 (1988).
Table 6: Win Rates, Mean Awards, and Mean Offers by Type of Case
Case Type Win Rate # of CasesMean Award
($1,000s)Mean Demand
($1,000s)Mean Offer($1,000s)
Eminent domain 100.0% 12 5,231.35 5,249.75 3,588.78Contract 62.6% 174 1,356.15 1,323.05 98.41Fraud 61.4% 57 2,731.81 1,473.90 132.04Personal injury 60.9% 834 345.60 368.45 101.64Employment 51.1% 139 703.74 900.48 86.88Other 42.9% 28 275.86 807.57 65.64Negligence (non-PI) 42.6% 94 823.84 1,072.11 93.23Premises liability 36.9% 268 627.77 742.83 134.06Intentional tort 35.2% 179 315.35 737.16 50.65Products liability 30.2% 53 494.69 1,174.06 131.90Medical malpractice 19.5% 364 234.80 505.68 31.28
Decision Making in Unsuccessful Settlement Negotiations 577

Tab
le7:
Dec
isio
nEr
ror
and
Cos
tof
Erro
r—B
yC
ase
Typ
e
Case
Typ
eEr
ror
Typ
e
Dec
ision
Erro
r
Mea
nA
war
d($
1,00
0s)
Mea
nD
eman
d($
1,00
0s)
Mea
nO
ffer
($1,
000s
)
Cost
ofEr
ror
#of
Case
s%
ofCa
ses
Mea
nCo
stof
Erro
r($
1,00
0s)
Expe
cted
Cost
ofEr
ror
($1,
000s
)
Emin
ent
dom
ain
No
erro
r3
25.0
%14
,946
.715
,087
.39,
806.
0N
AN
APl
aint
iffer
ror
541
.7%
1,13
8.4
1,51
7.0
1,21
0.5
72.1
30.0
Def
enda
nter
ror
433
.3%
3,06
1.1
2,53
7.5
1,89
8.8
523.
617
4.5
Con
trac
tN
oer
ror
2011
.5%
1,02
2.1
2,13
8.9
60.1
NA
NA
Plai
ntiff
erro
r77
44.3
%(5
8.3)
1,10
5.5
86.6
144.
964
.1D
efen
dant
erro
r77
44.3
%2,
857.
31,
328.
612
0.1
1,52
8.7
676.
5Fr
aud
No
erro
r7
12.3
%32
9.9
501.
468
.1N
AN
APl
aint
iffer
ror
2747
.4%
(14.
5)76
6.3
119.
913
4.4
63.7
Def
enda
nter
ror
2340
.4%
6,68
6.8
2,60
0.6
165.
84,
086.
21,
648.
8Pe
rson
alin
jury
No
erro
r17
120
.5%
167.
632
6.3
67.7
NA
NA
Plai
ntiff
erro
r44
453
.2%
13.8
302.
346
.032
.217
.2D
efen
dant
erro
r21
926
.3%
1,15
7.4
535.
424
0.9
622.
016
3.3
Empl
oym
ent
No
erro
r23
16.5
%49
9.3
1,74
4.9
207.
0N
AN
APl
aint
iffer
ror
7151
.1%
(1.3
)87
8.9
63.4
64.8
33.1
Def
enda
nter
ror
4532
.4%
1,92
0.7
503.
062
.51,
417.
745
9.0
Oth
erN
oer
ror
27.
1%91
.013
7.5
17.4
NA
NA
Plai
ntiff
erro
r18
64.3
%1.
997
8.4
31.6
29.6
19.0
Def
enda
nter
ror
828
.6%
938.
459
0.7
154.
434
7.7
99.3
Neg
ligen
ce(n
on-P
I)N
oer
ror
1414
.9%
1,53
7.8
2,18
4.6
114.
2N
AN
APl
aint
iffer
ror
6266
.0%
(7.2
)68
6.8
74.9
82.1
54.2
Def
enda
nter
ror
1819
.1%
3,13
1.1
1,53
4.1
140.
11,
597.
030
5.8
Prem
ises
liabi
lity
No
erro
r37
13.8
%33
3.9
1,20
2.1
175.
3N
AN
APl
aint
iffer
ror
184
68.7
%3.
060
3.4
49.1
46.1
31.7
Def
enda
nter
ror
4717
.5%
3,30
5.0
927.
043
4.0
2,37
8.0
417.
0In
tent
iona
ltor
tN
oer
ror
179.
5%27
4.7
1,37
5.9
28.6
NA
NA
Plai
ntiff
erro
r12
469
.3%
(6.1
)71
5.2
37.4
43.4
30.1
Def
enda
nter
ror
3821
.2%
1,38
2.4
522.
910
3.9
859.
418
2.4
Prod
ucts
liabi
lity
No
erro
r6
11.3
%95
9.8
1,15
8.3
51.0
NA
NA
Plai
ntiff
erro
r38
71.7
%(8
.1)
1,22
2.4
64.5
72.6
52.0
Def
enda
nter
ror
917
.0%
2,30
7.7
980.
347
0.6
1,32
7.3
225.
4M
edic
alm
alpr
actic
eN
oer
ror
154.
1%32
9.5
448.
988
.0N
AN
APl
aint
iffer
ror
294
80.8
%(0
.6)
513.
114
.615
.212
.3D
efen
dant
erro
r55
15.1
%1,
467.
648
1.4
105.
298
6.2
149.
0
578 Kiser et al.
In general, an inverse relationship exists between plaintiff decisionerror rates and win rates. Plaintiff decision error is lowest in cases with highwin rates and highest in cases with low win rates. Contract cases, for instance,have a 44.3 percent decision error rate and a 62.6 percent win rate, whilemedical malpractice cases have an 80.8 percent plaintiff decision error rateand a 19.5 percent win rate. For defendants, the pattern generally isreversed; high decision error rates are evident in high win rate cases.
The decision error rates, when classified by identical case types, appearto be roughly consistent with Gross and Syverud’s data for 1985–1986 and1990–1991 cases. In Gross and Syverud’s study, for instance, plaintiffs inmedical malpractice cases were “clear losers” in 71 percent and 78 percent,respectively, of the cases, compared with a 80.8 percent decision error rate inour study. Defendants’ decision error rate in Gross and Syverud’s study was17 percent and 16 percent, respectively, compared with 15.1 percent in ourstudy. The results in products liability cases are more disparate, but reflectsimilar qualitative differences between plaintiff and defendant decisionerror. Gross and Syverud’s data show plaintiffs in products liability caseseither recovered nothing or less than the defendants’ offer in 64 percent and61 percent of the cases, compared to plaintiffs’ decision error rate of 68.7percent in our study. Defendants, on the other hand, committed decisionerror in 25 percent and 32 percent of the Gross and Syverud cases, con-trasted with 17 percent in our study.
3. Effects of Forum
The forum variables are jury trials, bench trials, and arbitration. Underthe Priest and Klein model, one would expect decision error rates to bebalanced between the parties regardless of the forum; the forum itselfwould not appear to affect the hypothesis or its premises. The multivariateanalysis, however, indicates that forum affects decision error rates. Theeffect of forum on decision error rates and cost of error is presented inTable 8.
Most cases (90 percent) were tried to juries, while the remaining caseswere divided about evenly between bench trials and arbitrations. Due to theprevalence of jury trials, the outcomes for jury trials are similar to the overallresults presented in Table 1.
Both plaintiffs and defendants displayed remarkably different decisionerror rates in different forums. Defendants committed substantially lessdecision error in jury trials relative to bench trials (22.1 percent vs. 42.6
Decision Making in Unsuccessful Settlement Negotiations 579

Tab
le8:
Dec
isio
nEr
ror
and
Cos
tof
Erro
r—B
yFo
rum
Erro
rT
ype
Dec
ision
Erro
r
Mea
nA
war
d($
1,00
0s)
Mea
nD
eman
d($
1,00
0s)
Mea
nO
ffer
($1,
000s
)
Cost
ofEr
ror
#of
Case
s%
ofCa
ses
Mea
nCo
stof
Erro
r($
1,00
0s)
Expe
cted
Cost
ofEr
ror
($1,
000s
)
Pane
l8a:
Arb
itrat
ion
No
erro
r25
25.8
%24
9.4
424.
066
.3N
AN
APl
aint
iffer
ror
2828
.9%
(1.1
)1,
099.
55.
66.
71.
9D
efen
dant
erro
r44
45.4
%74
8.8
359.
871
.138
9.0
176.
4
Pane
l8b:
Ben
chT
rial
sN
oer
ror
1614
.8%
199.
251
3.4
30.3
NA
NA
Plai
ntiff
erro
r46
42.6
%(7
.4)
287.
816
.223
.610
.1D
efen
dant
erro
r46
42.6
%2,
427.
91,
302.
551
9.0
1,12
5.3
479.
3
Pane
l8c:
Jury
Tri
als
No
erro
r25
513
.9%
506.
099
2.5
213.
7N
AN
APl
aint
iffer
ror
1176
64.0
%6.
356
4.0
51.0
44.7
28.6
Def
enda
nter
ror
407
22.1
%1,
978.
175
5.3
205.
21,
222.
827
0.8
580 Kiser et al.
percent). By contrast, plaintiff decision error was considerably higher in jurytrials relative to bench trials (64.0 percent vs. 42.6 percent).49
In arbitration cases, decision error rates for both plaintiffs and defen-dants differed substantially from their rates in jury cases. Defendants’ deci-sion error rate (45.4 percent) was similar to their error rate in bench trials(42.6 percent) but considerably more than in jury trials (22.1 percent).50
Plaintiffs’ decision error in arbitration cases (28.9 percent) was notably lowerthan in either bench trials (42.6 percent) or jury trials (64.0 percent).51 Thetotal amount of decision error, moreover, is much lower in arbitration thanin either bench or jury trials, with “no error” being 25.8 percent in arbitra-tion relative to 14.8 percent in bench trials and 13.9 percent in jury trials.52
4. Effects of Damages Claim
Damages are characterized in the database as (1) “current” damages, repre-senting injuries and damages already sustained, (2) “future” damages, rep-resenting prospective losses not yet paid or sustained, and (3) punitive orexemplary damages. A plaintiff in a personal injury suit against an intoxi-
49Both differences in decision error rates are significant at the 0.01 level. Defendants’ mean costof error was roughly the same in jury and bench trials, and while the expected cost of error wasestimated to be much lower in jury trials than bench trials (due to the drop in decision error forjury trials), the difference is not significant at the 0.05 level. Though the difference in plaintiffs’mean cost of error between jury and bench trials ($44,700 vs. $23,600) is not significant at the0.05 level, the difference in the expected cost of error between them is significant at the 0.01level ($28,600 in jury trials vs. $10,100 in bench trials).
50Defendants’ decision error rate of 45.4 percent in arbitration cases was significantly differentfrom their 22.1 percent decision error rate in jury trials (at the 0.01 level), while not beingsignificantly different from the decision error rate of 42.6 percent in bench trials (even at the0.05 level). Though defendants’ estimated mean cost of error ($389,000) in arbitration caseswas substantially less than in either bench trials ($1,125,300) or jury trials ($1,222,800), neitherdifference is significant at the 0.05 level. Defendants’ expected cost of error was also smallest incases decided by arbitrators.
51Plaintiffs’ decision error rate of 28.9 percent in arbitration cases was significantly differentfrom their 42.6 percent decision error rate in jury trials (at the 0.05 level) and from theirdecision error rate of 64.0 percent in bench trials (at the 0.01 level). Though neither thedifference between plaintiffs’ mean cost of error in arbitration versus bench trials ($6,700 vs.$23,600) nor their expected cost of error in those forums ($1,900 vs. $10,100) was significant atthe 0.05 level, the differences between arbitration and jury trials were significant at the 0.01 level($6,700 vs. $44,700 for mean cost of error and $1,900 vs. $28,600 for expected cost).
52“No decision error” of 25.8 percent in arbitration cases is significantly different at the 0.01 levelfrom “no decision error” in both bench trials (14.8 percent) and jury trials (13.9 percent).
Decision Making in Unsuccessful Settlement Negotiations 581

cated driver, for example, may seek compensation for medical expensesalready incurred and pain and suffering previously suffered (currentdamages); the cost of future surgery anticipated by her physician and pro-spective pain and suffering (future damages); and punitive damages basedon the defendant’s reckless behavior while driving intoxicated. The damagescode is based on plaintiffs’ damages allegations, not the type of damagesultimately recovered by plaintiffs. Awards generally are not sufficientlyallocated by Verdict Search California and the adjudicator to consistentlydetermine the type of damages ultimately awarded.
Behavioral economics theory posits that a party is more likely to recoveractual losses already sustained (“current” damages) than lost future profits orother relatively remote damages (“future” damages), even when a party isentitled to recover both types of damages.53 In a breach of contract actionagainst a contractor who abandoned a house construction project, forexample, the plaintiff is more likely to recover its advance payment to thecontractor than the rental income lost between the original contract comple-tion date and the actual completion date.54 Although a nonbreaching party isentitled to “the amount which will compensate the party aggrieved for all thedetriment proximately caused thereby,” that is, the equivalent of the benefitsof contract performance,55 studies show that jurors and judges are reluctant toaward both damages actually incurred and damages yet to be sustained.56
The study does not appear to substantiate the existence of a cognitivedistinction between “current” damages awards and “future” damages awards.As indicated in Table 9, plaintiffs seeking only future damages fared poorly,recovering a net award in only 32.4 percent of the cases. Plaintiffs allegingonly current damages prevailed in 45.2 percent of their cases. Plaintiffsseeking both current and future damages recovered a net reward in 47.9percent of the cases. Although cases alleging current damages claims areassociated with higher win rates, the differences between those win rates and
53See Jonathan Baron, Thinking and Deciding 409–31 (Cambridge University Press 2000).
54Facts based on Henderson v. Oakes-Waterman Builders, 44 Cal. App. 2d 615 (1941), reversing trialcourt’s determination of damages and holding owner was entitled to recover advance payment,cost of demolition and reconstruction, and loss of rental value.
55California Civil Code § 3300.
56David Cohen & Jack L. Knetsch. Judicial Choice and Disparities Between Measures of Eco-nomic Value, in Choices, Values and Frames, supra, 436–39.
582 Kiser et al.
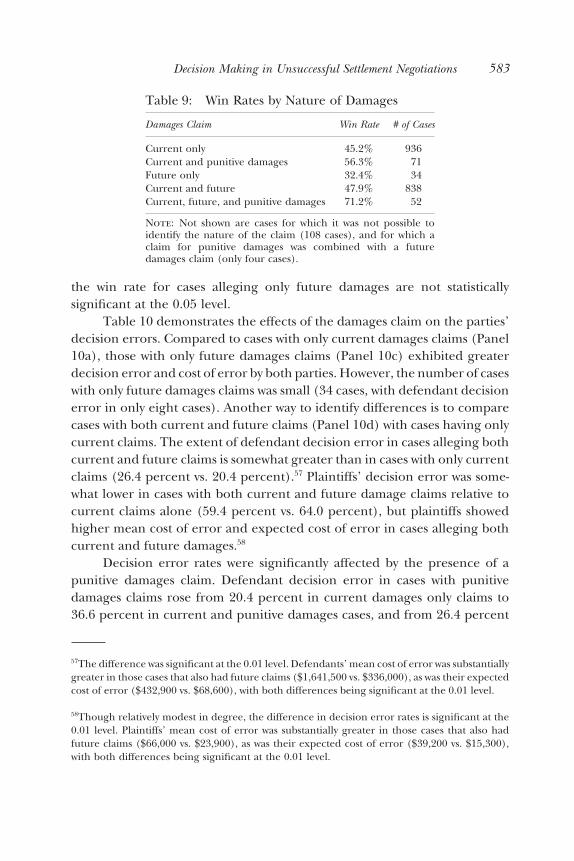
the win rate for cases alleging only future damages are not statisticallysignificant at the 0.05 level.
Table 10 demonstrates the effects of the damages claim on the parties’decision errors. Compared to cases with only current damages claims (Panel10a), those with only future damages claims (Panel 10c) exhibited greaterdecision error and cost of error by both parties. However, the number of caseswith only future damages claims was small (34 cases, with defendant decisionerror in only eight cases). Another way to identify differences is to comparecases with both current and future claims (Panel 10d) with cases having onlycurrent claims. The extent of defendant decision error in cases alleging bothcurrent and future claims is somewhat greater than in cases with only currentclaims (26.4 percent vs. 20.4 percent).57 Plaintiffs’ decision error was some-what lower in cases with both current and future damage claims relative tocurrent claims alone (59.4 percent vs. 64.0 percent), but plaintiffs showedhigher mean cost of error and expected cost of error in cases alleging bothcurrent and future damages.58
Decision error rates were significantly affected by the presence of apunitive damages claim. Defendant decision error in cases with punitivedamages claims rose from 20.4 percent in current damages only claims to36.6 percent in current and punitive damages cases, and from 26.4 percent
57The difference was significant at the 0.01 level. Defendants’ mean cost of error was substantiallygreater in those cases that also had future claims ($1,641,500 vs. $336,000), as was their expectedcost of error ($432,900 vs. $68,600), with both differences being significant at the 0.01 level.
58Though relatively modest in degree, the difference in decision error rates is significant at the0.01 level. Plaintiffs’ mean cost of error was substantially greater in those cases that also hadfuture claims ($66,000 vs. $23,900), as was their expected cost of error ($39,200 vs. $15,300),with both differences being significant at the 0.01 level.
Table 9: Win Rates by Nature of Damages
Damages Claim Win Rate # of Cases
Current only 45.2% 936Current and punitive damages 56.3% 71Future only 32.4% 34Current and future 47.9% 838Current, future, and punitive damages 71.2% 52
Note: Not shown are cases for which it was not possible toidentify the nature of the claim (108 cases), and for which aclaim for punitive damages was combined with a futuredamages claim (only four cases).
Decision Making in Unsuccessful Settlement Negotiations 583
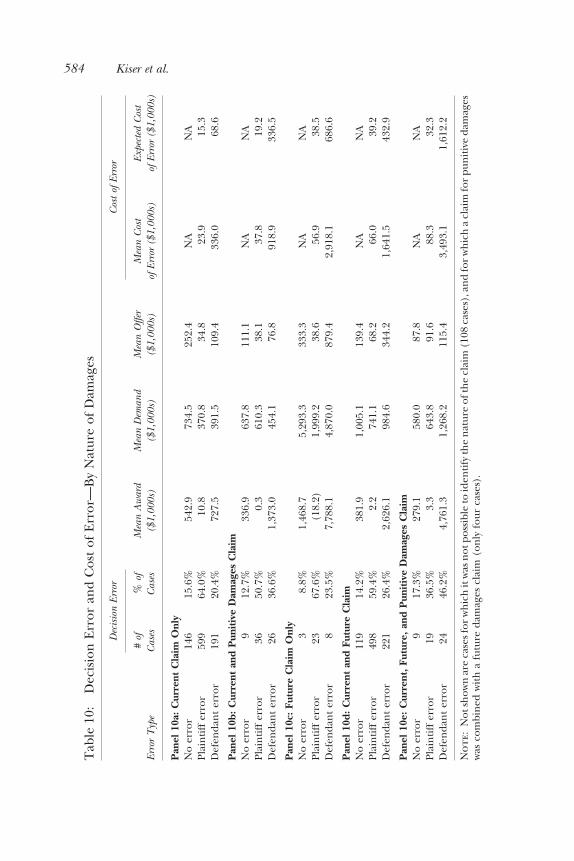
Tab
le10
:D
ecis
ion
Erro
ran
dC
ost
ofEr
ror—
By
Nat
ure
ofD
amag
es
Erro
rT
ype
Dec
ision
Erro
r
Mea
nA
war
d($
1,00
0s)
Mea
nD
eman
d($
1,00
0s)
Mea
nO
ffer
($1,
000s
)
Cost
ofEr
ror
#of
Case
s%
ofCa
ses
Mea
nCo
stof
Erro
r($
1,00
0s)
Expe
cted
Cost
ofEr
ror
($1,
000s
)
Pane
l10a
:Cur
rent
Cla
imO
nly
No
erro
r14
615
.6%
542.
973
4.5
252.
4N
AN
APl
aint
iffer
ror
599
64.0
%10
.837
0.8
34.8
23.9
15.3
Def
enda
nter
ror
191
20.4
%72
7.5
391.
510
9.4
336.
068
.6
Pane
l10b
:Cur
rent
and
Puni
tive
Dam
ages
Cla
imN
oer
ror
912
.7%
336.
963
7.8
111.
1N
AN
APl
aint
iffer
ror
3650
.7%
0.3
610.
338
.137
.819
.2D
efen
dant
erro
r26
36.6
%1,
373.
045
4.1
76.8
918.
933
6.5
Pane
l10c
:Fut
ure
Cla
imO
nly
No
erro
r3
8.8%
1,46
8.7
5,29
3.3
333.
3N
AN
APl
aint
iffer
ror
2367
.6%
(18.
2)1,
999.
238
.656
.938
.5D
efen
dant
erro
r8
23.5
%7,
788.
14,
870.
087
9.4
2,91
8.1
686.
6
Pane
l10d
:Cur
rent
and
Futu
reC
laim
No
erro
r11
914
.2%
381.
91,
005.
113
9.4
NA
NA
Plai
ntiff
erro
r49
859
.4%
2.2
741.
168
.266
.039
.2D
efen
dant
erro
r22
126
.4%
2,62
6.1
984.
634
4.2
1,64
1.5
432.
9
Pane
l10e
:Cur
rent
,Fut
ure,
and
Puni
tive
Dam
ages
Cla
imN
oer
ror
917
.3%
279.
158
0.0
87.8
NA
NA
Plai
ntiff
erro
r19
36.5
%3.
364
3.8
91.6
88.3
32.3
Def
enda
nter
ror
2446
.2%
4,76
1.3
1,26
8.2
115.
43,
493.
11,
612.
2
Not
e:N
otsh
own
are
case
sfor
whi
chit
was
notp
ossi
ble
toid
entif
yth
ena
ture
ofth
ecl
aim
(108
case
s),a
ndfo
rwhi
cha
clai
mfo
rpun
itive
dam
ages
was
com
bine
dw
itha
futu
reda
mag
escl
aim
(onl
yfo
urca
ses)
.
584 Kiser et al.
in current and future damages claims to 46.2 percent in current, future, andpunitive damages claims.59 By contrast, plaintiffs’ decision error was lower incases alleging punitive damages. When a punitive damages claim was joinedwith a current damages claim, plaintiffs’ decision error decreased from 64percent (current damages only) to 50.7 percent (current and punitivedamages). In cases where a punitive damages claim was joined with a currentand future damages claim, decision error decreased from 59.4 percent(current and future damages only) to 36.5 percent (current, future, andpunitive damages).60
The substantially higher defendant error rates in punitive damageclaims may be attributable to the difficulty of predicting the amount ofpunitive damage awards and the defendants’ inadequate evaluative adjust-ments for non-paradigmatic claims. Experimental studies show thatindividual differences in punitive damage awards “produce severe unpredict-ability and highly erratic outcomes”; study participants show strong agree-ment in finding punitive intent, but “there is no consensus about how muchin the way of dollars is necessary to produce appropriate suffering in adefendant.”61 (That punitive damages awards are unpredictable is challengedby Theodore Eisenberg’s recent empirical study, finding, inter alia, “minimal,though observable, variation in the dispersion of the punitive and compen-satory damage ratio over the years [1992–2001] and between trial modes.”62)
59Both defendant decision error rate differences are significant at the 0.01 level. Thoughdefendants’ cost of error also substantially increased in cases with punitive damages claims—with mean cost of error rising from $336,000 (current damages only) to $918,900 (current andpunitive damages) and from $1,641,500 (current and future damages only) to $3,493,100(current, future, and punitive damages claims)—these differences are not significant at the 0.05level. There were similar dramatic differences in defendants’ expected cost of error: $68,600 vs.$336,500 (current vs. current and punitive damages) and $432,900 vs. $1,612,200 (current andfuture vs. current, future, and punitive damages), with the first not being significant at the 0.05level but the second being significant at the 0.01 level.
60Both plaintiff decision error rate differences are significant (at the 0.05 and 0.01 levels,respectively). None of the differences in mean cost or expected cost of error values in cases withpunitive damages cases were significantly different at the 0.05 level from their counterpart caseslacking punitive damages claims.
61Cass Sunstein et al., Assessing Punitive Damages (With Notes on Cognition and Valuation inLaw), in Sunstein, supra, at 232, 240.
62Theodore Eisenberg et al., Juries, Judges, and Punitive Damages: Empirical Analysis Using theCivil Justice Survey of State Courts 1992, 1996, and 2001, 3 J. Empirical Legal Studies 276 (2006).
Decision Making in Unsuccessful Settlement Negotiations 585

Whether the amount of punitive damages is predictable or unpredict-able, the defendants in our study displayed seriously diminished predictivecapacity in punitive damage claims. The defendants’ relatively poor out-comes suggest that they either ignore the non-paradigmatic variable (puni-tive damage claim) or erroneously draw problem-solving analogies betweenthe unexceptional cases (no punitive damage claim) and the exceptionalcase (punitive damage claims). The risk of this type of decision-making error(“negative problem solving transfer”) is high when cases appear superficiallysimilar: surface similarity in story line, causes, context, and phrasing fre-quently leads decision makers to “retrieve and apply a solution to a nonan-alogous problem (negative transfer) and thereby waste their cognitiveresources or arrive at an erroneous solution.”63
C. Decision Error and its Costs—Analysis of Attorney-Mediator Sample
Although the primary data set includes 5,116 attorneys—about 20 percent ofall California litigation attorneys—and the decision error rates are remark-ably consistent with other study results, one may question whether the attor-neys in the data set have singular risk-taking propensities that impeded anegotiated settlement and ultimately resulted in significant decision errors.This question cannot be resolved empirically because we will never be able tocompare the study decision error rates with decision error rates for cases thatwere settled; the settled cases do not yield a benchmark trial or arbitrationaward against which we could compare the negotiated settlement amount.However, we can very roughly probe for selection bias, that is, whether ourarguably overconfident study attorneys exhibit higher decision error ratesthan attorneys with substantial, publicly recognized skills and experience insettling cases.
To identify attorneys with substantial settlement experience anddispute resolution skills, we reviewed lists of 939 California mediators eitherserving on Superior Court mediator panels, affiliated with private disputeresolution companies, or currently a member of the Southern CaliforniaMediation Association. We then searched each mediator’s name in VerdictSearch, limiting the search to California cases reported between 1985 and2006, to determine whether the mediator had represented a plaintiff ordefendant in a case tried through verdict or arbitration award. (Not all the
63M. Bassok, Analogical Transfer in Problem Solving, in The Psychology of Problem Solving 343(J.E. Davidson & R.J. Sternberg, eds., Cambridge University Press 2003).
586 Kiser et al.

939 mediators were necessarily litigation attorneys at any time during thatperiod, since the courts’ lists include some non-attorneys, former judges, andnon-litigation attorneys.) The search yielded 672 cases reported during the1985–2006 period, of which 369 met the case-selection criteria used for theprimary study data set; of the remaining 303 cases, 150 were settled and 153did not meet the selection criteria for other reasons.64
The presence of an attorney-mediator generally was associated with areduced decision error rate.65 Table 11, Panel 11a summarizes the experi-ence for 369 cases in which one of the parties was represented by an attorney-mediator. Total decision error in this sample is less relative to the primarysample presented in Table 1; “no error” in attorney-mediator cases is 21.1percent relative to 14.5 percent in the primary sample.66
In cases where plaintiffs were represented by an attorney-mediator,summarized in Table 11, Panel 11b, plaintiffs’ decision error is lower thanthe primary sample (48.5 percent relative to 61.2 percent), although defen-dants’ decision error is higher (32.0 percent relative to 24.3 percent).67
Nonetheless, the total amount of decision error is lower for the plaintiffattorney/mediator sample than the primary sample; “no error” is 19.5percent relative to 14.5 percent.68
Similarly, in cases where defendants were represented by an attorney-mediator, summarized in Table 11, Panel 11c, defendants’ decision error islower than the primary sample (21.5 percent relative to 24.3 percent).
64The attorney-mediator data set spans a 21-year period (1985–2006), whereas the primary studydata set covers a 38-month period (November 2002–December 2005). Whether a party isrepresented by an attorney who also serves as a mediator is not a fact separately reported inVerdictSearch and hence was not a variable coded in the primary study data set.
65Rachlinski suggested that framing effects might be mitigated by the intervention of attorneyswho were more understanding of framing biases: “The framing theory suggests another positiveinfluence attorneys may have in reducing the costs of litigation. An attorney may have somepower to reframe a settlement offer, sparing the client the most costly aspects offraming . . . Thus, the framing model of litigation poses a powerful role for the attorney. Theattorney can control the client’s frame, thereby influencing settlement decisions in eitherdirection.” Rachlinski (1996), supra, at 171–72. See Russell Korobkin & Chris Guthrie, Psychol-ogy, Economics and Settlement: A New Look at the Role of the Lawyer, 76 Tex. L. Rev. 77(1997).
66The difference is significant at the 0.01 level.
67The two differences are significant at the 0.01 level and 0.05 level, respectively.
68This difference is not significant at the 0.05 level, having a p value of 0.11.
Decision Making in Unsuccessful Settlement Negotiations 587

Tab
le11
:D
ecis
ion
Erro
ran
dC
ost
ofEr
ror—
Att
orne
y-M
edia
tor
Sam
ple
Erro
rT
ype
Dec
ision
Erro
r
Mea
nA
war
d($
1,00
0s)
Mea
nD
eman
d($
1,00
0s)
Mea
nO
ffer
($1,
000s
)
Cost
ofEr
ror
#of
Case
s%
ofCa
ses
Mea
nCo
stof
Erro
r($
1,00
0s)
Expe
cted
Cost
ofEr
ror
($1,
000s
)
Pane
l11a
:All
Cas
esN
oer
ror
7821
.1%
348.
756
7.9
90.4
NA
NA
Plai
ntiff
erro
r19
452
.6%
12.8
558.
861
.248
.425
.5D
efen
dant
erro
r97
26.3
%1,
570.
867
0.8
217.
490
0.0
236.
6Pa
nel1
1b:A
ttor
ney-
Med
iato
rR
epre
sent
sPl
aint
iff
No
erro
r33
19.5
%51
2.4
702.
414
3.0
NA
NA
Plai
ntiff
erro
r82
48.5
%18
.482
0.6
86.7
68.4
33.2
Def
enda
nter
ror
5432
.0%
1,61
5.2
706.
621
8.3
908.
629
0.3
Pane
l11c
:Att
orne
y-M
edia
tor
Rep
rese
nts
Def
enda
ntN
oer
ror
4522
.5%
228.
746
9.2
51.9
NA
NA
Plai
ntiff
erro
r11
256
.0%
8.7
367.
142
.533
.818
.9D
efen
dant
erro
r43
21.5
%1,
515.
062
5.8
216.
288
9.2
191.
2
588 Kiser et al.

Interestingly, in these attorney-mediator cases, plaintiffs’ decision error isalso lower (56.0 percent relative to 61.2 percent). Thus for both conditionsof reduced error, total decision error is lower in these cases; “no error” is22.5 percent relative to 14.5 percent in the primary sample.69
Regardless of which party is represented by an attorney-mediator, thetotal amount of error is modestly lower. Much less can be concluded from anexamination of the mean cost of error due to the construction of theattorney-mediator sample. That sample covers a much longer time periodthan the primary data set (21 years vs. 38 months), rendering many of thevalues non-comparable with the primary sample used in Table 1. This is anarea worthy of continued research.
We also examined specific case types to assess the incidence of decisionerror in the attorney-mediator cases. Because the sample of attorney-mediator cases, when classified by case type and whether the mediatorrepresented a plaintiff or a defendant, was small compared to the primarydata set, we focused on personal injury cases, the most common type of casesin the primary sample. Consistent with the overall findings of reduceddecision error in attorney-mediator cases, we found that personal injurycases in which the parties were represented by attorney-mediators showed alower decision error rate than those in the primary sample. Plaintiffs’ deci-sion error rate in personal injury cases was 45.2 percent in the attorney-mediator sample and 53.2 percent in the primary sample. Defendants’decision error rate in personal injury cases showed a similar pattern—16.8percent in the attorney-mediator sample and 26.3 percent in the primarysample.
V. Conclusion
Because each case in the study requires a settlement decision by both aplaintiff and a defendant, this study tests 9,064 decisions—2,054 cases and4,108 decisions in the 2002–2005 primary set, 1,806 cases and 3,612 decisionsin the 1964–2004 historical set, and 672 cases and 1,344 decisions in the1985–2006 attorney/mediator set. Plaintiffs erroneously concluded that trialwas a superior option in 61.2 percent of the primary set cases, while defen-
69Though the changes in defendants’ and plaintiffs’ decision error are not significant at the 0.05level, the difference in “no decision error” (22.5 percent vs. 14.5 percent) is significant at the0.01 level.
Decision Making in Unsuccessful Settlement Negotiations 589

dants made an erroneous assessment in 24.3 percent of those cases. Themagnitude of defendants’ errors, however, vastly exceeded that of plaintiffs’errors. The historical review of attorney/litigant decision making indicatesthat the incidence of decision error increased moderately, while the magni-tude of decision error increased dramatically. The attorney/mediator casesshow comparatively low decision error rates that nevertheless would beunacceptable in other high-skill domains like medicine, aeronautics, orstructural engineering. If Gross and Syverud are correct in asserting the “realquestion for any party is whether it would have been better off if it had notgone to trial,” the answer for a clear majority of plaintiffs and one-quarter ofdefendants is “Yes.”70
From the remarkably consistent decision error rates shown in this studyand three prior studies, a renewed emphasis on reducing attorney/litigantdecision-making error could emerge. Further research can identify andperhaps eliminate conditions and framing biases associated with high deci-sion error rates while identifying and replicating the conditions anddecision-making practices associated with low decision error rates. The lowerdecision error rates correlated with a party’s service of a 998 offer, forinstance, may indicate that a party serving a 998 offer undergoes a beneficialevaluative process that results in improved decision making. The attorney-mediator data, moreover, suggest that attorneys trained and experienced indispute resolution, and perhaps more cognizant of framing biases, mayhave a salutary effect on attorney/litigant decision making. An attorney-mediator’s representation of a plaintiff is associated with a 21 percent reduc-tion in plaintiff decision error, and the presence of an attorney-mediatorrepresenting any party is correlated with a dramatic reduction in the overallincidence of decision error, the percentage of “no error” cases rising from14.5 percent in the primary sample to 21.1 percent in the attorney-mediatorsample.
In his recent book, Expert Political Judgment, Philip Tetlock tests politicalpredictions by 284 experts, finding that their probability assessments fre-quently are inaccurate. Explaining the motivation for the study, he states:“We can draw cumulative lessons from experience only if we are aware ofgaps between what we expected and what happened, acknowledge the pos-sibility that those gaps signal shortcomings in our understanding, and testalternative interpretations of those gaps in an evenhanded fashion.” This
70Gross & Syverud (1996), supra, at 41.
590 Kiser et al.
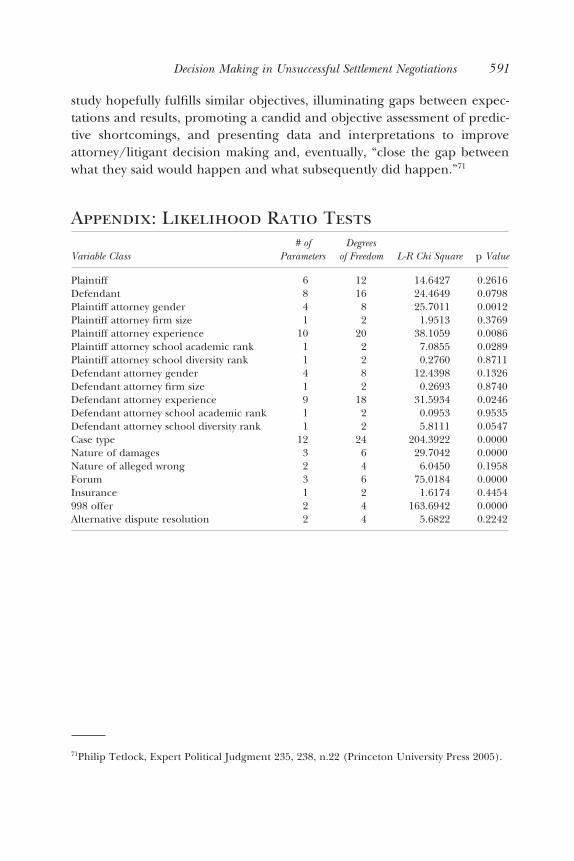
study hopefully fulfills similar objectives, illuminating gaps between expec-tations and results, promoting a candid and objective assessment of predic-tive shortcomings, and presenting data and interpretations to improveattorney/litigant decision making and, eventually, “close the gap betweenwhat they said would happen and what subsequently did happen.”71
Appendix: Likelihood Ratio Tests
Variable Class# of
ParametersDegrees
of Freedom L-R Chi Square p Value
Plaintiff 6 12 14.6427 0.2616Defendant 8 16 24.4649 0.0798Plaintiff attorney gender 4 8 25.7011 0.0012Plaintiff attorney firm size 1 2 1.9513 0.3769Plaintiff attorney experience 10 20 38.1059 0.0086Plaintiff attorney school academic rank 1 2 7.0855 0.0289Plaintiff attorney school diversity rank 1 2 0.2760 0.8711Defendant attorney gender 4 8 12.4398 0.1326Defendant attorney firm size 1 2 0.2693 0.8740Defendant attorney experience 9 18 31.5934 0.0246Defendant attorney school academic rank 1 2 0.0953 0.9535Defendant attorney school diversity rank 1 2 5.8111 0.0547Case type 12 24 204.3922 0.0000Nature of damages 3 6 29.7042 0.0000Nature of alleged wrong 2 4 6.0450 0.1958Forum 3 6 75.0184 0.0000Insurance 1 2 1.6174 0.4454998 offer 2 4 163.6942 0.0000Alternative dispute resolution 2 4 5.6822 0.2242
71Philip Tetlock, Expert Political Judgment 235, 238, n.22 (Princeton University Press 2005).
Decision Making in Unsuccessful Settlement Negotiations 591