Embed Size (px)
Citation preview

Making Data-Based Decisions
Let’s flip a coin

Making Data-Based DecisionsWe’re going to flip a coin 10 times.
What results do you think we will get?
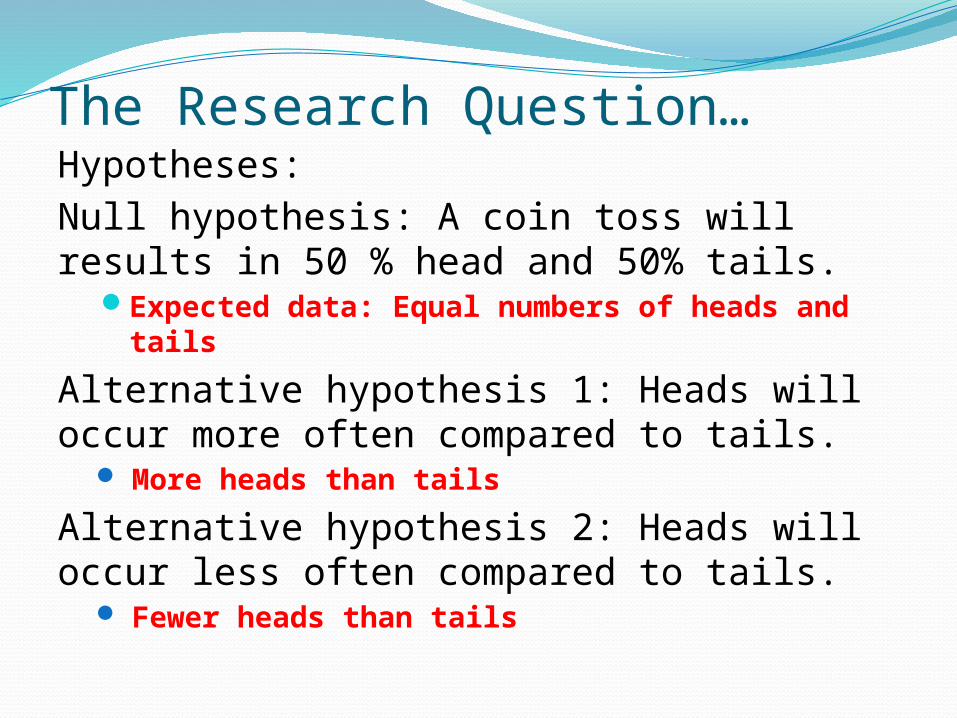
The Research Question…Hypotheses:Null hypothesis: A coin toss will results in 50 % head and 50% tails.
Expected data: Equal numbers of heads and tails
Alternative hypothesis 1: Heads will occur more often compared to tails.
More heads than tails
Alternative hypothesis 2: Heads will occur less often compared to tails.
Fewer heads than tails

Testing:Flip coin 10 times

Results - out of 10 flipsWhat is the minimum number of heads that you would expect if:the null hypothesis is correct? Why?
(A coin toss will results in 50 % head and 50% tails.)
alternative hypothesis 1 is correct? Why?(Heads will occur more often compared to tails.)
alternative hypothesis 2 is correct? Why?(Heads will occur less often compared to tails.)

Results, coin flipped 10 times8 or 80% of the flips were heads
Which hypothesis does this support?null hypothesis: A coin toss will results in 50 % head
and 50% tails.alternative hypothesis 1: Heads will occur more
often compared to tails.alternative hypothesis 2: Heads will occur less often
compared to tails.

Results - out of 10 flips8 or 80% of the flips were heads.
Is it possible that we could have gotten 8 heads if the other hypotheses were correct, too?

What if we could actually calculate the likelihood of getting at least 8 heads?
For instanceIf null hypothesis fails to be rejected – what is
the probability that we could have actually gotten 8?
If alternative hypothesis 1 is supported, what is the probability that we could have actually gotten 8?
Testing the null hypothesis is the easiest…why?

The problem is….Null hypothesis – equal numbers of predicted
flipsAlternative 1 – how many more heads would
we expect?
WE KNOW EXACTLY WHAT TO EXPECT FOR THE NULL, BUT HAVE NO IDEA WHAT VALUES TO EXPECT FOR THE ALTERNATIVE

Let’s set up a simulation….Let’s flip a coin 10 times as one sample
• How many heads would you expect to get? Explain
TO DETERMINE PROBABILITY REPEAT A LOT OF TIMES AND SEE HOW OFTEN WE GET AT LEAST 8 HEADS

Simulation – 20 samplesCount of Samples
X
X X
X X X X
X X X X X
X X X X X X X X
0 1 2 3 4 5 6 7 8 9 10
Number of “correct flips”
Number Heads 0 1 2 3 4 5 6 7 8 9 10
Chance of getting this many heads
0.0 0.05 0.0 0.15 0.15 0.25 0.2 0.1 0.05 0.05 0

Question…
Why don’t we get 5 heads every time we flip a coin 10 times?
Why are some values not represented? We didn’t get any samples with 0, 2, or 10 heads?

The Impact of SamplingWe are samplingWe don’t expect every sample to look exactly
like the population.There is going to be variability because of
chance

Simulation – 10000 samplesNumber Heads
0 1 2 3 4 5 6 7 8 9 10
Total Times occurred
5 92 461 1154 1981 2537 2063 1117 479 101 6
Probability of Occurring
0.0005 0.009 0.046 0.115 0.198 0.245 0.206 0.117 0.048 0.010 0.0006
Simulation – 20 samplesNumber Heads
0 1 2 3 4 5 6 7 8 9 10Total Times occurred
0 1 0 3 3 5 4 2 1 1 0
Probability of Occurring
0.0 0.05 0.0 0.15 0.15 0.25 0.2 0.1 0.05 0.05 0

The Big Question…What is the likelihood (probability) of having
AT LEAST 8 heads in our sample (getting 8, 9, or 10 heads)?
My simulation – 10000 samplesNumber Heads
0 1 2 3 4 5 6 7 8 9 10
Total Times occurred
5 92 461 1154 1981 2537 2063 1117 479 101 6
Probability of Occurring
0.0005 0.009 0.046 0.115 0.198 0.245 0.206 0.117 0.048 0.010 0.0006
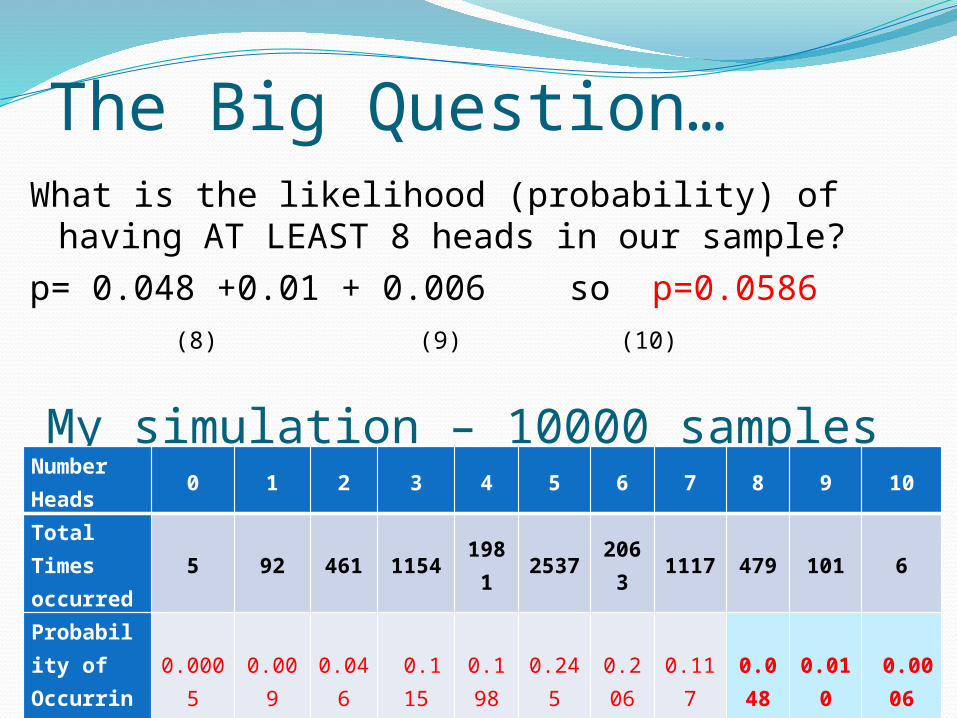
The Big Question…What is the likelihood (probability) of having AT
LEAST 8 heads in our sample?
p= 0.048 +0.01 + 0.006 so p=0.0586 (8) (9) (10)
My simulation – 10000 samplesNumber Heads
0 1 2 3 4 5 6 7 8 9 10
Total Times occurred
5 92 461 1154 1981 2537 2063 1117 479 101 6
Probability of Occurring
0.0005 0.009 0.046 0.115 0.198 0.245 0.206 0.117 0.048 0.010 0.0006
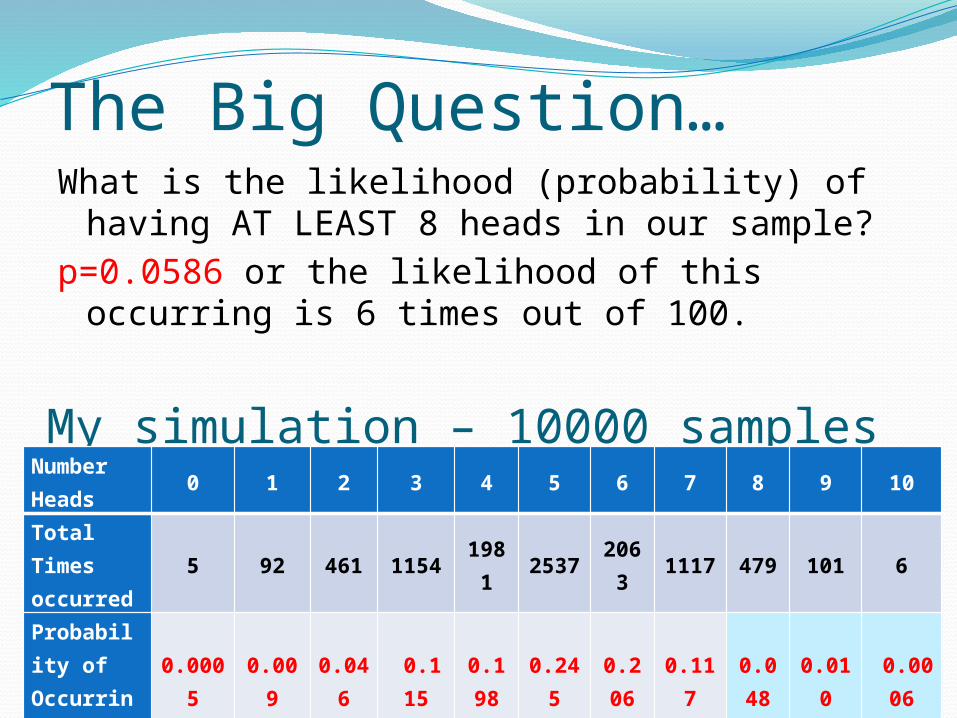
The Big Question…What is the likelihood (probability) of having
AT LEAST 8 heads in our sample?p=0.0586 or the likelihood of this occurring is
6 times out of 100.
My simulation – 10000 samplesNumber Heads
0 1 2 3 4 5 6 7 8 9 10
Total Times occurred
5 92 461 1154 1981 2537 2063 1117 479 101 6
Probability of Occurring
0.0005 0.009 0.046 0.115 0.198 0.245 0.206 0.117 0.048 0.010 0.0006
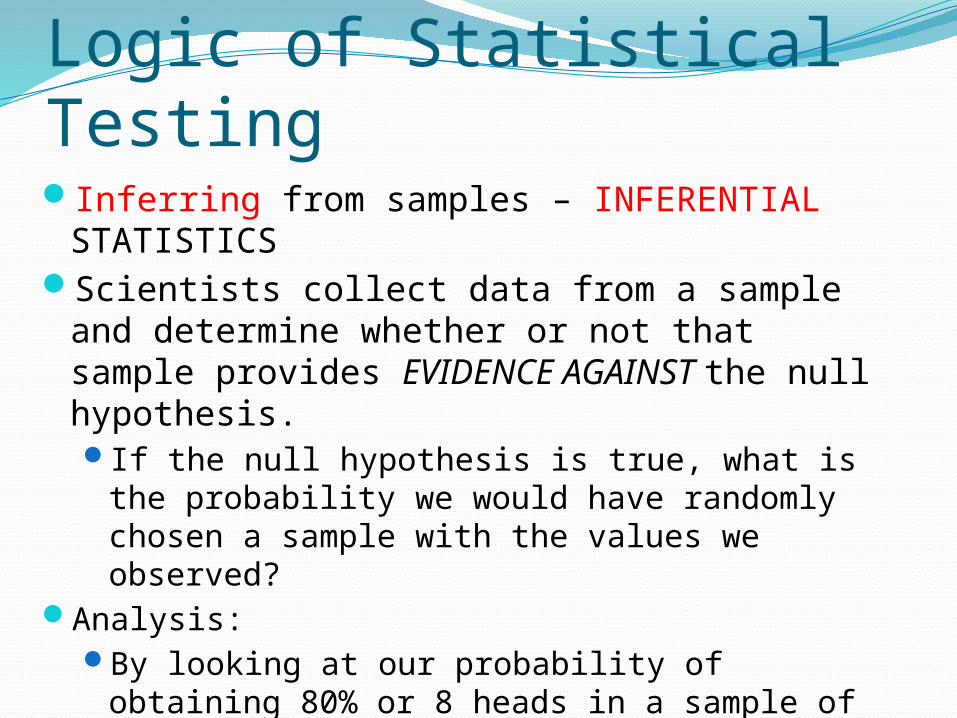
Logic of Statistical TestingInferring from samples – INFERENTIAL
STATISTICSScientists collect data from a sample and
determine whether or not that sample provides EVIDENCE AGAINST the null hypothesis.If the null hypothesis is true, what is the
probability we would have randomly chosen a sample with the values we observed?
Analysis:By looking at our probability of obtaining 80%
or 8 heads in a sample of 10 flips, we can make a decision.PROBABILITY IS OFTEN CALLED THE P
value
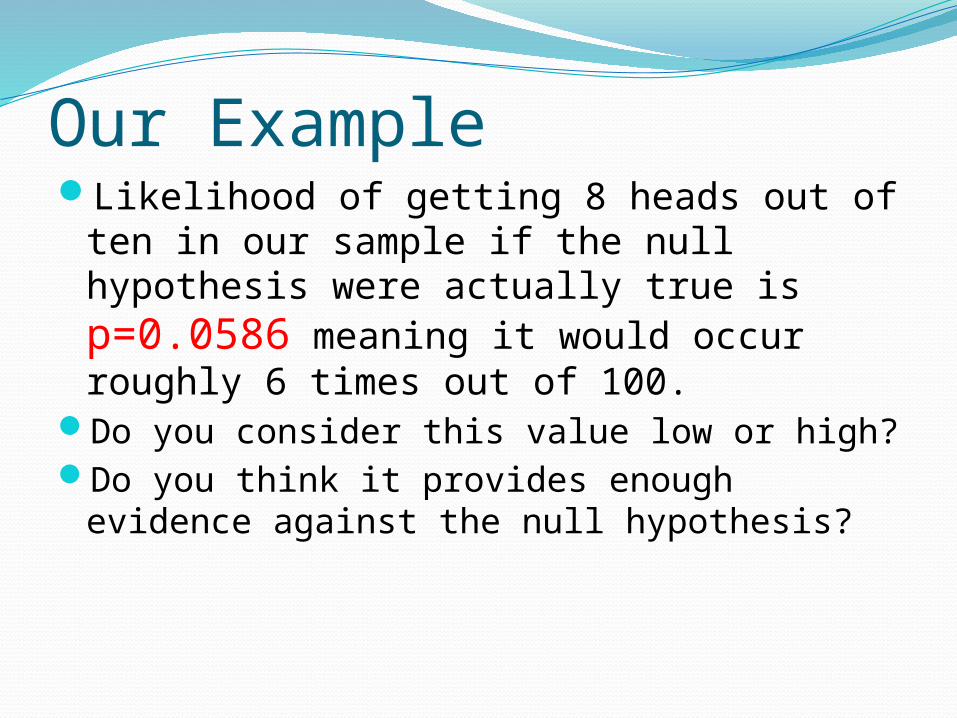
Our ExampleLikelihood of getting 8 heads out of ten in
our sample if the null hypothesis were actually true is p=0.0586 meaning it would occur roughly 6 times out of 100.
Do you consider this value low or high?Do you think it provides enough evidence
against the null hypothesis?

Statistical SignificanceNeed a cut point for the p-value
Common “cut points”: 0.05, 0.01, .001If P value < 0.05,
• you say the result is “statistically significant” and you reject the null hypothesis.
• If the null hypothesis is true, the probability of randomly getting the observed sample is unlikely.
• This provides evidence against the null hypothesis and we would REJECT the null hypothesis, suggesting one of the alternative hypotheses were correct.
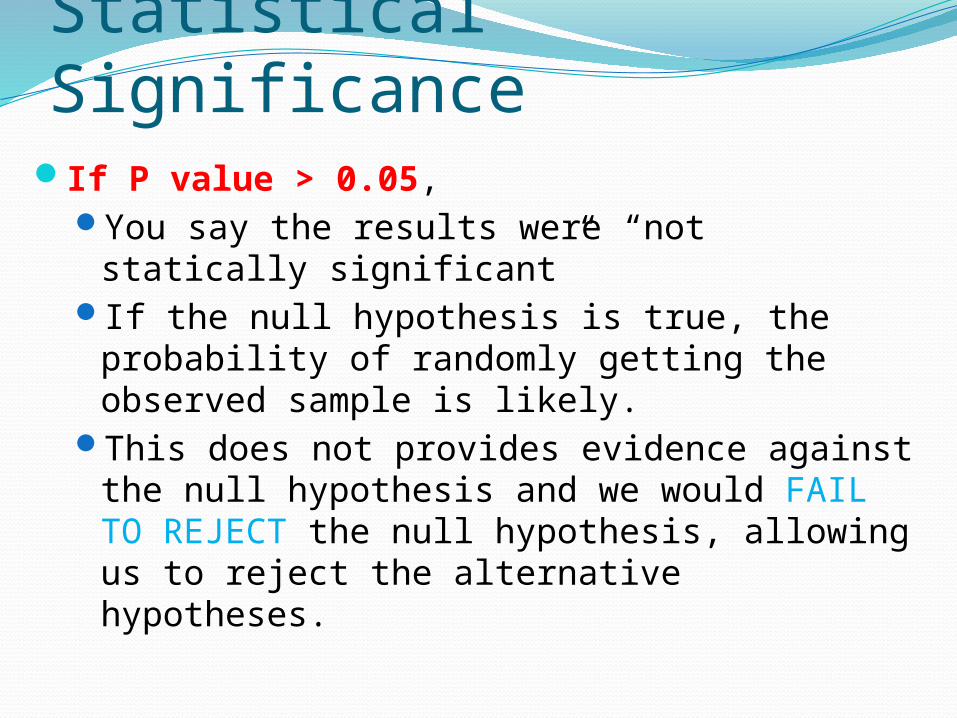
Statistical SignificanceIf P value > 0.05,
You say the results were “not statically significant”
If the null hypothesis is true, the probability of randomly getting the observed sample is likely.
This does not provides evidence against the null hypothesis and we would FAIL TO REJECT the null hypothesis, allowing us to reject the alternative hypotheses.

Statistical Tests/Hypothesis Testing/Inferential Test:All statistical tests provide a P-value that is
the probability that your results would have occurred if the null hypothesis were true.
They use information from your data (mean, standard deviation, etc.) to figure out a probability based upon a population that meets the null hypothesis (much like our coin simulation).
You use the p-value to make a data-driven decision

Question:What do you think would happen to the
probability of getting 80% heads if we had flipped more:16 heads out of 20? p = 0.0140 heads out of 50? p<0.0001
Increasing your sample size decreases the chance that your results will be impacted by errors or chance factors that might mask differences.
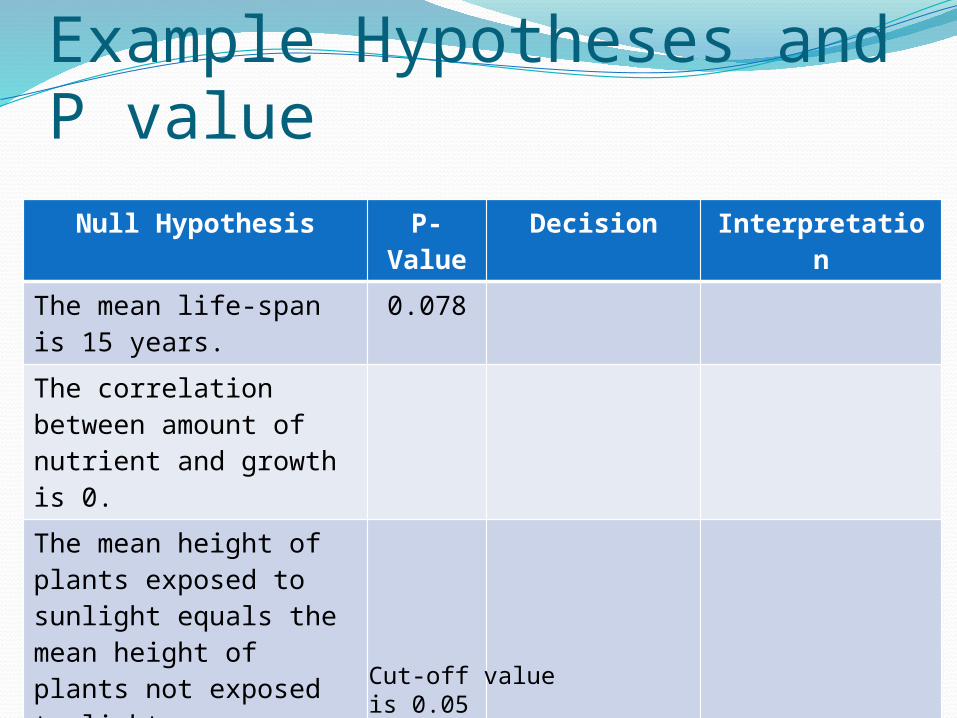
Example Hypotheses and P valueNull Hypothesis P-
ValueDecision Interpretation
The mean life-span is 15 years.
0.078
The correlation between amount of nutrient and growth is 0.
The mean height of plants exposed to sunlight equals the mean height of plants not exposed to light.
Cut-off value is 0.05

Example Hypotheses and p-valueNull Hypothesis P-
ValueDecision Interpretation
The mean life-span is 15 years.
0.078 Do not reject the null hypothesis
There is no evidence to suggest the mean life-span is not 15 years.
The correlation between amount of nutrient and growth is 0.
0.010
The mean height of plants exposed to sunlight equals the mean height of plants not exposed to light.
Cut-off value is 0.05

Example Hypotheses and p-valueNull Hypothesis P-
ValueDecision Interpretation
The mean life-span is 15 years.
0.078 Do not reject the null hypothesis
There is no evidence to suggest the mean life-span is not 15 years.
The correlation between amount of nutrient and growth is 0.
0.010 Reject the null hypothesis (P < 0.05)
There is evidence to suggest the correlation is not zero.
The mean height of plants exposed to sunlight equals the mean height of plants not exposed to light.
Cut-off value is 0.05

Example Hypotheses and p-valueNull Hypothesis P-
ValueDecision Interpretation
The mean life-span is 15 years.
0.078 Do not reject the null hypothesis
There is no evidence to suggest the mean life-span is not 15 years.
The correlation between amount of nutrient and growth is 0.
0.010 Reject the null hypothesis (at sig level of 0.05)
There is evidence to suggest the correlation is not zero.
The mean height of plants exposed to sunlight equals the mean height of plants not exposed to light.
0.0001
Cut-off value is 0.05

Example Hypotheses and p-valueNull Hypothesis P-
ValueDecision Interpretation
The mean life-span is 15 years.
0.078 Do not reject the null hypothesis
There is no evidence to suggest the mean life-span is not 15 years.
The correlation between amount of nutrient and growth is 0.
0.010 Reject the null hypothesis (at sig level of 0.05)
There is evidence to suggest the correlation is not zero.
The mean height of plants exposed to sunlight equals the mean height of plants not exposed to light.
0.0001 Reject the null hypothesis
There is evidence to suggest light makes a difference on plan growth.
Cut-off value is 0.05


![Functions arising by coin flippingwastlund/coinFlip.pdf · described in [6]: Flip the coin twice. If the outcome is heads-tails, we answer “heads”. If the outcome is tails-heads,](https://img.dokumen.tips/doc/110x75/5f2f736d0320f36ca47671b4/functions-arising-by-coin-i-wastlundcoinflippdf-described-in-6-flip-the.jpg)