Embed Size (px)
Citation preview

Planning Practice & research, 2015http://dx.doi.org/10.1080/02697459.2015.1104203
© 2015 taylor & Francis
Let the Citizens Map—Public Participation GIS as a Planning Support System in the Helsinki Master Plan Process
Maarit Kahila-Tani, Anna Broberg , Marketta Kyttä and Taylor Tyger
Department of real estate, Planning and geoinformatics, aalto University, espoo, Finland
Introduction
The arrangement of public participation has become an elementary part of urban planning practices in Western democracies (e.g. Friedmann, 1992; Healey, 1992). In decision making participation is important for several reasons while it can strive to achieve a variety of goals (Laurian & Shaw, 2009). In addition to the more general social goals and the ‘value added’ for society, in urban planning public participation aims to improve the planning outcomes, support policy decisions and strengthen the planning profession by increasing the visibility and value of planning in the public’s eye (Beierle & Cayford, 2002; Laurian, 2004). From the communicative planning theory perspective, participatory planning strives to integrate into the planning practices the differing voices of the plural society by supporting mutually
ABSTRACTCurrent public participation methods are laborious, reach few participants and are ineffective at gathering usable information for planning. This situation leads often to mistrust and dissatisfaction in the process and outcome. This article identifies the critical conditions for meaningful use of public participation GIS (PPGIS) tools to support the making of master plan in Helsinki. With PPGIS tools, residents’ insight of their living environment can be reached and utilized along the planning process. The results are divided to conceptual and empirical points. Whereas the conceptual points emphasize better understanding of the locus of the PPGIS tools in planning process, the empirical findings reveal new ways to study how residents’ perceptions align with the plan proposal. Though new tools, data and analysis can support representativeness, independence, early involvement, influence and transparency, planners and residents need more understanding of the benefits of these tools. The study indicates that though planners found the collected data and the analysis valuable, they still lacked the skills and institutional motivation to use the data effectively. The results point out that when PPGIS tools can be integrated to the mainstream planning practices, the tools have the ability to evolve to a more comprehensive participatory planning support system.
KEYWORDSPublic participation; PPgis; Pss; PPss; master plan; helsinki
ARTICLE HISTORYreceived 2 april 2015 accepted 2 October 2015
CONTACT Maarit Kahila-tani [email protected]
Dow
nloa
ded
by [
UQ
Lib
rary
] at
11:
37 2
4 D
ecem
ber
2015

2 M. KAHIlA-TAnI eT Al.
active discourse (e.g. Healey 1997; Forester, 1999). Horelli’s (2002, p. 620) definition of par-ticipatory planning practice structures the versatility of participation in detail: ‘Participatory planning is a social, ethical, and political practice in which individuals or group, assisted by set of tools, take part in varying degrees at the overlapping phases of the planning and decision making cycle that may bring forth outcomes congruent with the participants’ needs and interests.’
Although participation has been justified through democratic rights and procedural justice, the influence of participation on decision-making and actual outcomes has remained slender (Irvin & Stansbury, 2004; Beresford & Hoban, 2005; Bäcklund & Mäntysalo, 2010) or at least varying (Beierle & Cayford, 2002). Among the reasons are the inadequate and inconvenient participation methods, such as public hearings and written statements that are still often used as official methods in many cities (Healey, 1997; Halvorsen, 2001; Innes & Booher, 2004; Kingston, 2007). Though many cities also use an extensive range of methods like workshops, charrettes, open houses and public meetings in addition to more formal hearings, these methods do not attract wide groups of participants (Laurian, 2004; Brown, 2014). These methods are undoubtedly valuable, especially during certain phases of the planning process. Nevertheless, the face-to-face character and the place and time com-mitment of these methods narrow down the number of the participants and highlight the exclusivity and reacting and commenting nature of participation. This observation suggests that merely providing opportunities for public participation is still too often in many countries the endgame that fulfills participation requirements. Focusing solely on the realization of participation process neglects the quality of the end results and the effec-tiveness of participation. And further, participation is seldom evaluated formally among planning processes (Laurian & Shaw, 2009). Therefore planning literature should address better the more systematic evaluation process for planning practices (Brown & Chin, 2013).
We argue that instead of focusing too generally and solely theoretically on the aims of participation, research should still communicate better the advances and disadvantages that varying ICT-based methods like public participation GIS (PPGIS) and planning support systems (PSS) have reached. Different kinds of crowdsourcing tools allow more residents to be heard (Brown, 2014), and the gathered input enables the production of high-quality information. More profound research on the effectiveness and usability of these kinds of tools in planning processes is needed, to evaluate whether this kind of information actually enhances the planning outputs or leads to environmental and social outcomes (Koontz & Thomas, 2006).
This article considers the public participation process through the initial phases of a master plan project in Helsinki by concentrating on the development of a PPGIS tool, the use of the tool and different analysis tools during this process. The aim is to reflect upon and discuss the effectiveness of early phase participation and the information flow from the participants to the planners through a set of PPGIS tools and analysis possibilities. This paper brings forth conceptual and empirical notions regarding the use of PPGIS tools as a participatory planning support system (PPSS).
Toward Knowledge-informed Planning
In public participation practices, the knowledge received from the lay people is often con-sidered to be opinions or beliefs, and is therefore dismissed, even though direct community
Dow
nloa
ded
by [
UQ
Lib
rary
] at
11:
37 2
4 D
ecem
ber
2015

PlAnnInG PrACTICe & reSeArCH 3
insight has been found to make planning decisions more efficient and effective (Corburn, 2003), strengthen the recognition of the differing values of various actors (Healey, 1997), and support learning and knowledge-building (Friedmann, 1998). For our purposes, it is essential to select a participation method that provides usable, diverse and broad-scale information from the residents, and is potentially influential on the actual output of the process, or at least allows the study of the congruence between the view of participants and the proposed plan. Different methodological approaches produce varying results, as was noted by Brown et al. (2014), who compared information produced by focus groups and PPGIS online surveys and found that in workshop settings the participants identified landscape value locations that were significantly different from the PPGIS survey results.
PPGIS tools have been developed increasingly during the last decade (Brown & Raymond, 2014). These tools have become one of the most efficient knowledge-based methods for gathering accurate, new and non-existing place-based information for public participation practices (Brown, 2012; Brown & Kyttä, 2014). Yet the effective use of these tools in plan-ning and decision processes lags behind due to several social and institutional constraints (Brown, 2012). Tulloch (2008) describes PPGIS as a field within geographic information science that focuses on the ways the public uses various forms of geospatial technologies to participate in different processes. Both PPGIS and volunteered geographic information (VGI) are related terms that define a process for gathering and using non-expert spatial information (Brown & Kyttä, 2014). PPGIS and VGI tools are web-based tools originating from the hands of technical experts to be used by residents, activists or other non-experts. Whereas the PPGIS studies mainly target to collect data to some research question, as these are mostly used in research projects, the VGI tools are developed to create, assemble and disseminate voluntarily produced geographic data on any topic public finds relevant (Goodchild, 2007; Hall et al., 2010). VGI has led to the ‘crowdsourcing’ of spatial informa-tion, where the user-generated content is produced by large group of people through an online community (Sui et al., 2013). In both PPGIS and VGI, the dimensions of purpose, geographic context, data quality, sampling approaches, data collection, data ownership and dominant mapping technology vary depending on the project (Brown & Kyttä, 2014).
PPGIS and VGI are often implemented as sporadic data collection interventions, and hence do not have a large role in urban planning projects nor provide lasting support for planning processes. In contrast, PSS are designed and more systematically utilized geo- information technology-based tools that support those who are involved in planning at some particular spatial scale and in some specific planning context (Geertman & Stillwell, 2004; Geertman, 2006). Traditionally, geographical modeling has been the main focus of PSS (Klosterman, 1999). This narrow definition of PSS has since matured into ‘frameworks of integrated systems of information and software that synthesize the three components of traditional decision support systems—information, models and visualization—and deliver them into the public realm’ (Brail & Klosterman, 2001; Geertman & Stillwell, 2004). Although the adaptation of PSS has remained low (Vonk et al. 2005), some of the designed PSS have matured to become more widely used in planning practice. Hence, research on PSS has lately evolved from concentrating on the development to include the evaluation of the use and application of PSS (e.g. te Brömmelstroet, 2013; Pelzer et al., 2014).
We argue that the participatory planning paradigm shift calls for yet another extension of the traditional PSS definition. The extended conceptualization of PSS rests also on the availability of PPGIS tools to be integrated into the planning processes. Whereas the scholars
Dow
nloa
ded
by [
UQ
Lib
rary
] at
11:
37 2
4 D
ecem
ber
2015

4 M. KAHIlA-TAnI eT Al.
in the field of PSS have made cautious and novel studies related to the analysis, visualization and modeling of systematized ‘hard’ knowledge, the scholars in the field of PPGIS have concentrated to a concept that allows ways to collect broad data bases of experience-based knowledge and to analyze and disseminate this knowledge among research, but also in planning practices. In PPSS these two fields emerge to one by emphasizing the need to have various data sources, multiple sets of tools to gather, analyze and model the knowl-edge and understanding of the way to embed the tools and knowledge more profoundly to the different phases of the planning project. In the end, to plan cities wisely, existing pro-cesses should include a broader group of actors but above all enhance knowledge-informed planning that adapts and interprets diverse and plural information more comprehensively. Finally the central question is not who organizes participation but instead how the different participation practices can be linked together and the information produced adapted more specifically to the planning process.
Components of Effective Participation
Despite the strong development work of new participation methods during the last dec-ades, more evidence is needed regarding the influence of participation on the planning process and outcome. Future development work on new participation methods should be more effectively supported by the insight of the advantages and disadvantages of the existing and already tested participation methods. Understandably, the outputs and out-comes of participation have received less attention because they are not easy to measure (Rowe & Fewer, 2004). Social outcomes have been studied more often than environmental ones, such as the increase in social trust or social capital as a result of collaborative efforts (Koontz & Thomas, 2006). Problems related to data availability, long time horizons and the difficulties in measuring social and environmental outcomes are among the challenges included in attempts to evaluate outputs or outcomes. In the field of PSS, the existence of implementation gap that indicates the mismatch between the supply of and the demand for planning support tools (Schrijnen, 2010) has led scholars to study the performance of PSSs (te Brömmelstroet, 2012, 2013). This relevant work is still in its early stages and needs more coherent and consistent work among the scholars to structure a systematic performance framework that enables to study the influence of PSS on planning process and outcome (te Brömmelstroet, 2012, 2013). Unfortunately, the actual outcomes of the PPGIS tools presented in this article cannot be studied because the master plan process in Helsinki is still ongoing until 2016. Therefore our focus spans from the early steps of the process until the first output, i.e. the master plan proposal was devised. In this paper, we first describe the PPGIS methods used in planning. After this procedural viewpoint, we will study through a small survey, observations and expert discussions, how the tools and data were used among planners and in participation workshops. At the end we will draw out as an example a compatibility study on how the insight from the residents can be studied in conjunction with the master plan proposal.
Participation processes should be evaluated to determine their success. Therefore, we discuss our results using a procedural and normative framework proposed by Rowe and Fewer (2000) for evaluation to make judgments about how well certain participation tech-niques function. This framework consists of acceptance and process criteria, and focuses on measuring the quality of the desirable aspects of the process. The acceptance criteria are
Dow
nloa
ded
by [
UQ
Lib
rary
] at
11:
37 2
4 D
ecem
ber
2015

PlAnnInG PrACTICe & reSeArCH 5
essential for our purposes because they emphasize the effective construction of participation procedures. Acceptance criteria include five criteria: (1) representativeness, (2) independ-ence, (3) early involvement, (4) influence and (5) transparency. (Rowe & Fewer, 2000). The criterion of representativeness emphasizes a representative sample of affected public. In the field of urban planning, participants should not present only some self-selected subset or unrepresentative elite group. Current participation methods become easily too elitist and enable strong individuals to make their voice heard, while not everyone is ready to speak out in public meetings (Staffans, 2004). For this reason, the criterion of independence is important in emphasizing the two-way meaning of both managers and facilitators and public representatives who should be independent of any affiliation. Even though earlier studies have pointed out that planners do not value early stage engagement since it implies unnecessary delay in getting the plans ready in time (Monno & Khakee, 2011), several stud-ies have verified that early involvement as third criterion builds consensus especially when taken into consideration during the phase where value judgments are formed. The crite-rion of influence highlights the effectiveness of participation to the outcome. This criterion can be considered as (at least partly) fulfilled along the way, when there is the beforehand agreement to use the gathered input to inform the planning process. Finally, the criterion of transparency means that public should be able to see what is going on, i.e. how the decisions are made and how the process moves on.
The framework proposed by Rowe and Fewer (2000) is relevant for our use, as it concen-trates on the procedural matters of participation methods. More comprehensive evaluation frameworks have been introduced by Brown and Chin (2013), who used a thorough set of criteria to evaluate participation in neighborhood planning. The evaluation framework of Rowe and Fewer has been applied, e.g. by Brown (2014), who evaluated a set of methods aiming to reach numerous participants, or the crowd potential. Brown even suggests that adding the place component, the geographic coordinates, to the information produced by participants, in itself can make the gathered insight more usable and influential in plan-ning practices. We agree with Brown, but argue that to gain full benefit of the PPGIS methods, planners need support in devising good content and multifaceted visualizations and analyses of the gathered data. Furthermore, planners need more strategic support in designing the participation process and more information on the variety of the tools. In the end, planners also need more possibilities to learn through best practices (cf. Menzel et al., 2012; Kahila, 2013).
Research Strategy
Case Description—Making City of Helsinki More Compact
Traditionally, urban infill projects have been among the topics that accelerate suspicion and mistrust among participants, and cause conflicts (Zhang & Fung, 2013). According to the existing research literature, the social acceptance of urban density is not straightforward. For example, McCrea and Walters (2012) noticed that, depending on the context, inhabit-ants associated densification with both positive and negative effects. Arguably, when well-planned and carefully realized, urban density can meet both the ecological goals for efficient urban structure and support social equity by providing accessibility to everyday services, resulting in positive experiential and well-being outcomes for residents (Kyttä et al., 2015).
Dow
nloa
ded
by [
UQ
Lib
rary
] at
11:
37 2
4 D
ecem
ber
2015

6 M. KAHIlA-TAnI eT Al.
In Helsinki, where the main focus of the new master plan is infill development of the existing urban structure, planners and policy-makers have shared a concern about the residents’ attitudes toward densification. The City of Helsinki began the planning process for a new master plan in 2013. The new plan, which is currently being drafted into a legal proposal for approval in 2016, will replace the 2002 master plan and address population growth, affordable housing shortages, transportation connections and economic develop-ment, among other themes.1
Tool Description—Using PPGIS to Reach Resident Insight
To involve residents and stakeholders in the early phase of this planning process, City of Helsinki used a variety of public participation methods, such as seminars, workshops, displays at the City Planning Fair, surveys and meetings. The authors worked as consult-ants to the City by developing the online PPGIS survey at the beginning of the process. This article looks through this process from the perspective of how the PPGIS tools were utilized during the different phases of the process. Figure 1 describes the steps taken in the planning process where the PPGIS tools or the results of the data collection were utilized.
The PPGIS method used originates from Aalto University, where the development of the SoftGIS methodology has been ongoing since 2005 in close cooperation with planners. The SoftGIS methodology is an example of an Internet-based PPGIS methodology that allows residents to communicate localized experiential knowledge (Kyttä et al., 2011). SoftGIS methods have been used in more than 20 research projects in Finland and abroad (Brown & Kyttä, 2014). Involvement of the planners has ensured the relevance of the produced, ‘soft’ geocoded information to the planning sector. The first generation SoftGIS tools were specially developed and tailored for each project by researchers and IT specialists. Later, a ‘do it yourself ’ SoftGIS service, Maptionnaire, was developed in a spin-off company. Maptionnaire is a cloud service that allows anyone to create, publish and analyze map-based questionnaires with an editor tool. Allowing the planners to design their own PPGIS methods has been essential in order to build a bridge between PPGIS methodology and PSS (cf. Kahila & Kyttä, 2009).
The content of the survey in Helsinki was developed in close cooperation with urban planners. In the PPGIS survey the participants were instructed to consider the future of the city and locate different places and routes on the maps, prompted by questions that were
Figure 1. the process of integrating the PPgis tool into the master plan process of helsinki.
Dow
nloa
ded
by [
UQ
Lib
rary
] at
11:
37 2
4 D
ecem
ber
2015

PlAnnInG PrACTICe & reSeArCH 7
divided into six themes (see Table 1). These themes were selected through the development process based on the previous projects of City Planning Department and the topical con-cerns of the planners. Especially the planners wanted to reflect the outcome of the previous strategic vision project that emphasized, e.g. the question of the street sides that could be built up. Respondents were able to freely locate places on the map and share also completely new ideas. The survey included two full-page interactive maps with related prompts and spatial markers, questions regarding the participants’ background, and questions about the participants’ attitudes toward urban development (see Figure 2).
The online map-based survey was open from 4th November to 9th December 2013 (Figure 2). The City of Helsinki was responsible for advertising the survey, primarily through social media (Twitter and Facebook) and local newspapers. Residents were able to access the survey through the website links provided in the advertisements. The survey was dissem-inated in three languages: 82% of the respondents used the Finnish version of the survey, 17% used English, and 1% used Swedish. It should be noted that the online community was very active in sharing information about the survey, and thus the respondents are not fully representative of the wider population of Helsinki (see Figure 4 in results).
Methodology and Data
During the development process of the PPGIS method and various analysis tools, the authors took part to the process as action researchers. Action research tries to achieve practical benefits and generate practical information (Heikkinen, Rovio, & Syrjälä, 2006). This phase of the process produced data as memos of the meetings and emails that were analyzed by using content analysis. After the data collection, the authors conducted various spatial analyses (see following spatial analysis chapter). Furthermore the authors took part as researchers to the development process of the different visualization tools (see Figure 3).
Table 1. themes explored in the PPgis survey and the related questions for marking points on the map.
no of theme Theme of the question Map based questions1 according to forecasts, the population
of helsinki will grow by up to 250,000 residents in the coming decades
• a place for residential building• a place for offices, services or business premises
2 how can helsinki grow in a smart way? • a street side that could be built up• a plaza or square that is too large, whose surroundings
could be built up• a poorly managed/undefined area that should be
improved3 Densifying helsinki needs both broad,
continuous green areas and high-quality city parks
• the area is not necessary for recreation, it could be built up
• recreationally important, but could be of better quality• this area is unique city nature just as it is
4 it is easy to get around in the helsinki of the future, and transverse transport also flows smoothly
• Public transport• cycling connection• Walking connection• car transport connection
5 Pedestrians have a special status in the helsinki of the future and streets are common spaces for city dwellers
• there should be a pedestrian street here• there should be more shops and services here on the
street-level floors of the buildings• the environment around here looks dreary and should
be improved by planting trees, for example6 Wake up your inner urban planner! • My completely new idea
Dow
nloa
ded
by [
UQ
Lib
rary
] at
11:
37 2
4 D
ecem
ber
2015

8 M. KAHIlA-TAnI eT Al.
The interactive analysis tools allowed the urban planners to study the locations marked by the participants and explore the details provided in the open-ended responses. A special data visualization tool for public use summarized the point-based data and highlighted identified clusters.2 Different visualization tools where designed to facilitate the face-to-face discussions in workshops and at the exhibition (cf. Al-Kodmany, 1999). The main results of the survey were also published as an online report. To understand better the influence and use of the tool in the process authors participated in the arranged workshops and interviewed the city planners. The authors collected data from the ‘Moment as a planner’ workshops by observing the use of the PPGIS data at the workshops. The data from these workshops is based on the authors’ notes. Planners who took part to the process were queried later through an online survey that concentrated on the planners’ experiences of the PPGIS tool and the usability of the data. This survey was implemented five months after the data collection took place. This article studies the effectiveness of the PPGIS process mid-term, even though the actual planning process is ongoing until spring 2016.
Figure 2. PPgis mapping pages of the survey for helsinki 2050 city plan explored various themes for future development of the city.
Figure 3. to help disseminating the results of the PPgis survey, we developed an online analysis tool for urban planners and a visualization tool that was accessible for the general public.
Dow
nloa
ded
by [
UQ
Lib
rary
] at
11:
37 2
4 D
ecem
ber
2015
PlAnnInG PrACTICe & reSeArCH 9
Spatial Analysis
After the first plan proposal was drafted, we analyzed and compared the plan proposal material to the data gathered earlier from the residents. We calculated the point densities using 100-m grid cells, which is the same grid size used in the city plan proposal. We cal-culated the number of points in each grid per theme, and used the highest 10% to identify the most significant clusters of participant input.
Next, we studied the areas with conflicting inputs to understand the level of residents’ agreement or disagreement using the compatibility analysis approach proposed by Brown and Raymond (2013). To define input in support of infill, the following markers were used: A place for residential building; A place for offices, services or business premises; A street side that could be built up; A plaza or square that is too large, whose surroundings could be built up; and The area is not necessary for recreation, it could be built up. Two markers were used to define the input opposed to infill: This area is unique city nature just as it is and Recreationally important, but could be of better quality. The compatibility analysis recognizes the areas where many participants have located markers and where the numbers of opposing markers are relatively equal, thus creating a high potential for conflict.
Then, we interpreted the areas with high conflict potential visually, and selected three different types of conflict. Finally, the fit between the City plan proposal and residents’ marked places was analyzed by calculating the amount of points left inside and outside the densification areas.
Results
In the results section, we reflect our findings within the framework of acceptance criteria by Rowe and Fewer (2000). Our observations focus on the development and use of the PPGIS tools in Helsinki master plan process.
Extensive and Independent Participation in an Early Planning Phase
The use of PPGIS survey supported the criterion of independent participation, as the respondents were allowed to react to the questions on their own when time was suitable for them. Respondents are maybe never completely independent, in the sense that they are affiliated to their neighborhood and other interest groups. Nevertheless, using PPGIS as a participation method grants the respondents independence outside the immediate influence of other respondents present in a group work setting. The criterion of early involvement was emphasized in Helsinki, as the PPGIS tool was used in the early steps of the process. Actually, the public participation process could have started even earlier, because the master plan phase was preceded by vision work that outlined the desired land use solutions for the next decades.
Whether the criterion of representativeness was satisfactory fulfilled, is debatable. The par-ticipation was a lot more extensive than generally found in planning processes in Helsinki. A total of 3,7453 residents were willing to share their opinions, marking 32,989 locations on the map. Though this means less than 1% of the total population of Helsinki, it broad-ens the number of participants reached through the meetings and workshops. In terms of respondent demographics, the working aged respondents were overrepresented, while
Dow
nloa
ded
by [
UQ
Lib
rary
] at
11:
37 2
4 D
ecem
ber
2015

10 M. KAHIlA-TAnI eT Al.
the oldest age groups (those over 60-years-old) were underrepresented (see Figure 4). It is important to notice that PPGIS can act as a tool that reaches better the usually unreached silent voices of young and working aged people who rarely are present, e.g. at the workshops.
Figure 5 represents the numbers of different markers located by the respondents. The most popular category marked 8,911 times (51% of all marked locations), was A place or area for residential building. Potential sites for new buildings were mainly found close to the
Figure 4. the respondent demographics compared to the population of helsinki.
Figure 5. respondents found nearly 9,000 places for new residential buildings.
Dow
nloa
ded
by [
UQ
Lib
rary
] at
11:
37 2
4 D
ecem
ber
2015

PlAnnInG PrACTICe & reSeArCH 11
railway stations and along the arterial streets, and often within the neighborhood where the respondent lived. These locations were primarily areas that are already planned to be built or are under construction, but there were also locations that are currently in other use. The second most popular category marked on the map was This area is unique city nature just as it is (4,816 points). These places were located mainly in seaside areas. The third most common was A street side that could be built up (2,910 points) (see Figure 5). Only 2% of the total points were locations representing new ideas that did not fall into the pre-defined categories. Figure 6 visualizes the point data and the clusters of the new building sites and important green areas.
Transparency of the Process and the Public Input
We analyze the criterion of transparency both chronologically through the different phases of the process, and contextually by emphasizing the analysis that allows new ways for public to see what happens. First, we study the survey results and how respondents’ views clash with each other. Second, we highlight the transparency through the observations from the workshops where the survey data was further elaborated by the participants. Third, we fur-ther elaborate the transparency through an analysis where the resident input is compared to the plan proposal.
First, we used spatial compatibility analysis to identify the areas where residents’ sup-porting (new building sites) and opposing (important green areas to be protected) views spatially clash. In Figure 7, red and orange grid cells indicate where suggestions for new building sites dominate, whereas light and dark blue cells indicate areas where important green areas dominate. Some of these places have been recognized as areas of conflict even in the local media, but have mostly been described as conflicts between residents and urban planners, instead of conflicts between different resident groups.
Figure 6. Markers for new building sites (left) and important green areas (right) suggested by the PPgis respondents, and the clusters identifying the densest 10% of marked locations (grids highlighted on top of the point data).
Dow
nloa
ded
by [
UQ
Lib
rary
] at
11:
37 2
4 D
ecem
ber
2015

12 M. KAHIlA-TAnI eT Al.
To have a closer look at the conflict areas, we identified locations where new building sites dominate the mapped values (Figure 8). One example is Malmi airport, where the surroundings are experiencing suburban development, and discussions of developing the airport into a new neighborhood are ongoing. Here, more respondents suggested new building sites rather than important green values, but both opinions were many. We also found areas where important green values dominate. One example of this kind of area is the seaside of Vuosaari, where residents mapped important green values more often than new building sites. The largest potential for conflict arises from situation, where a significant amount of both supporting and opposing views are marked. These are highly contradictory areas that include nearly equal amounts of values for new building sites and green areas to be protected. One example is Kivinokka, a place already known as a very conflicting area through discussions in media.
Second, to support the transparency during the process the results of the PPGIS study were presented and used as an input in the workshops. The divergent views among residents’ came up in these arranged ‘Moment as a planner’ workshops. In the workshops, some par-ticipants had not heard about the PPGIS survey, and some also ignored the results of the survey. The critique toward the survey concentrated on the implementation of the survey and on the way it had been advertised. Some participants claimed that the whole survey was
Figure 7. the value compatibility analysis revealed areas with conflicting values.
Dow
nloa
ded
by [
UQ
Lib
rary
] at
11:
37 2
4 D
ecem
ber
2015

PlAnnInG PrACTICe & reSeArCH 13
useless, and that urban planners should not lean on the findings of this study in the future. The critique targeted also the way the questions were designed, how the advertising channels were chosen and to the necessity of the study. Possibly, the respondents of the survey and the residents who participated the workshops represented different groups. This became clear for example in the critique against the age profile of the survey. Some participants saw a problem in so many young people having a possibility to say their opinion via PPGIS survey.
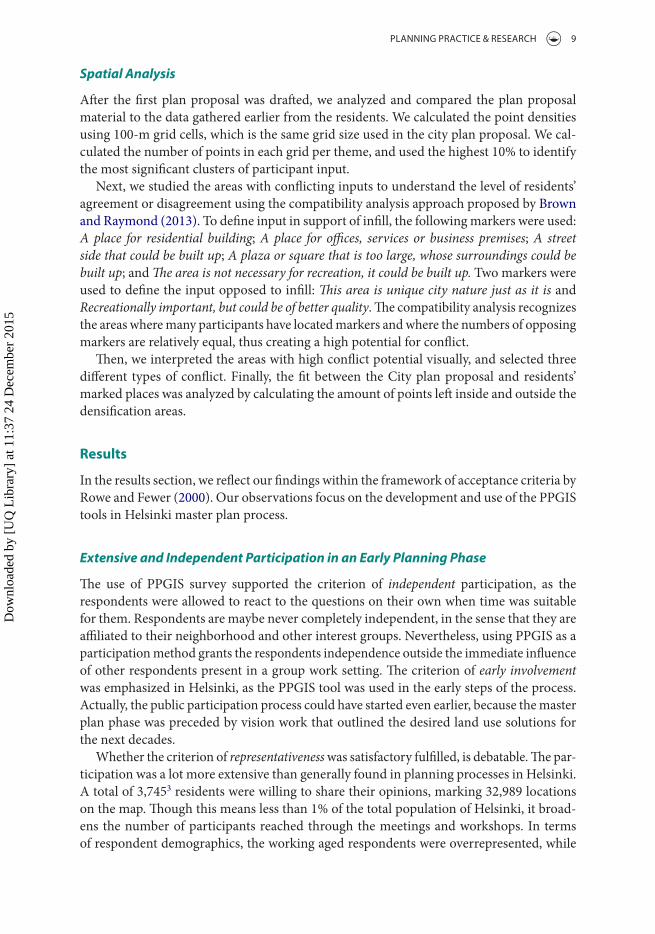
Third, the transparency was examined through analyzing how the input from the resi-dents aligned with the master plan proposal drafted by the planners. In the plan proposal, the City of Helsinki identifies places for future densification. The proposal is composed of 100 m grid cells that indicate the land use functionalities and the building efficiency for each cell. Our comparison reveals how the values the residents have marked align with the densification proposals. In general, most of the important green areas for residents are located outside the densification areas, whereas the majority of suggested new building sites are within densification areas (see Figure 9). This indicates rather strong fit between the master plan proposal and residents’ impressions while for the important green places, a total
Figure 8. identified types of contradictory places: new building sites dominate the Malmi airport area (top), important green values dominate in Vuosaari (middle), and values for and against new buildings and important green areas are present in Kivinokka (bottom).
Dow
nloa
ded
by [
UQ
Lib
rary
] at
11:
37 2
4 D
ecem
ber
2015
14 M. KAHIlA-TAnI eT Al.
of 25% of the residents’ proposals are inside areas proposed for densification and a total of 61% of new building sites proposed by the residents are inside densification areas (Table 2).
But is it influential?To assess the influence of the participation, we asked planners how they perceived the influ-ence of the PPGIS tools and data (see Table 3). In the online survey for planners, the planners were able to share their thoughts regarding the PPGIS method and on the usability of the
Figure 9. important green values (turquoise grids) and recommended building sites (red grids) marked by residents superimposed on the densification areas of the master plan proposal.
Table 2. residents’ input for important green areas and for new building sites that are located inside and outside the densification areas defined in the master plan proposal.
Within densification areas of the plan
proposal (%)
Outside densification areas of the plan
proposal (%) Total (%) resident inputimportant green areas 1,515 (25%) 4,476 (75%) 5,991 (100%)suggestions for new building places
9,580 (61%) 6,138 (39%) 15,718 (100%)
Dow
nloa
ded
by [
UQ
Lib
rary
] at
11:
37 2
4 D
ecem
ber
2015

PlAnnInG PrACTICe & reSeArCH 15
collected data. Obviously, a comprehensive analysis on the impact of the PPGIS process is not possible, due to the complex and still ongoing planning process. Planners who took part in the project yielded insights on the usability of the data. Planners generally found the tools and the collected data useful, but the actual utilization of the data was still rather low:
The biggest advantage so far has been the ‘image’ benefit of implementing this kind of survey. To be able to use the content of the survey we have to deepen the analysis. (Planner 1)
The markers on the map emphasize well the insight from the residents, for example the city boulevards and the conflict areas emerge clearly. (Planner 2)
The planners highlighted various themes in their comments. One mentioned that the role of the survey was to support the planning process, whereas another told in detail how the data was actually utilized in the planning purposes of one area:
I have taken into account all the ideas from the residents and other actors in … neighborhood. Additionally I have mentioned to residents that I as an expert of this area have a right to introduce other inputs residents have not noticed. I think these surveys are very relevant in master planning. (Planner 3)
A few mentioned the importance of the possibility to get more residents’ views with the help of the survey. Planners were also pleased in the way the tool provided an opportunity for younger people to participate:
It is essential that we have been able to offer a participation channel also for those residents who would be otherwise difficult to persuade to other participation venues or workshops. Now the challenge is to prove the influence of the survey. (Planner 4)
Even though the planners seem to be generally satisfied with the tool, especially with the data and main results, they often found it difficult to utilize the information in their planning practices. When asked which of the developed tools they had used, nearly all had read the report of the results, utilized the online analysis tool and studied the online visualizations of the data. Contrastingly, only few had downloaded the data onto their own computer.
Conclusions
The participation process in Helsinki master plan that was supported with PPGIS tools during the early stages, fulfilled the acceptance criteria presented by Rowe and Fewer (2000) rather well. In Helsinki, the criterion of early timing was emphasized by the planners. Early timing of the participation not only enables the effective use of knowledge, but also supports the acceptability of the plans by fostering trust among participants (Innes & Booher, 2004).
Table 3. Planners views about the use of the PPgis tool and the data according to the online survey for planners.
StatementMean value (likert score 1 = totally disagree,
5 = totally agree)the utilization of map-based survey was interesting and useful for my work tasks.
4, 3
i got useful information through the survey. 4, 1i think that the collected data has been utilized enough in the master plan process.
2, 9
survey tool offered a functional way for the arrangement of the public participation.
4, 4
Dow
nloa
ded
by [
UQ
Lib
rary
] at
11:
37 2
4 D
ecem
ber
2015

16 M. KAHIlA-TAnI eT Al.
Actually, the public participation process in Helsinki could have started even earlier, as the master plan phase was preceded by vision work that outlined the desired land use solutions for the next decades. When interpreting our results, it is important to notice the situation in which the data collection took place. Neither the planners nor the residents were with-out prior understanding of the general aims of the future planning direction. The vision work that preceded the master planning project had already laid out the guidelines for the forthcoming planning. These main visions were also publicly debated, and many residents were likely aware of them. Because urban planning is by nature a continuous process, where different projects and planning levels overlap, the planners undeniably knew where they wanted to direct the questions of the survey. Nevertheless, the planners had not sketched the plan prior to the data collection, and their aim was to integrate resident input into the plan proposal.
The criterion of independent participation was fulfilled relatively well, for individuals were allowed to contribute their own understanding on the infill development before the public discussion of master plan proposal started. Evidently PPGIS survey can bring along a new group of participants who are not reached when using more traditional tools. In Helsinki, the respondents of the survey were generally more positive toward infill development than participants in the other participation events. According to our understanding, the partici-pant profile of the workshops differed from those responding to the PPGIS survey. Despite of the slight disagreement, the different participation methods should be understood as complementary ways granting more comprehensive input for the planners. Additionally, the PPGIS respondents were not like-minded when the suggested new building sites and important green values were compared geographically. Clearly the diverging views that are usually thought to exist between planners and residents, are also conflicts between resi-dents. Through the analysis of respondents’ most valued places and places for infill, several contradictory places were found in Helsinki.
Compared to the number of residents typically reached via traditional participation methods, the amount of participation input gathered during one month via online platform is significantly higher. The traditional methods seem to reach especially active and skillful participants that value mutual discourse. In public participation, small group processes like workshops are vulnerable to be too conscious of the opinions of others (Brown, 2014). In Finland, the resident unions and single active residents have traditionally taken a strong role in participation and used their voice over the others by reducing the independence. This supports the finding from Leino (2006), who found two corresponding groups of active participants in Finland, one of which had strong orientation toward publicity, while the other was conversationally inclined.
The fulfillment of the criterion of transparency was supported in a number of ways throughout the official process. After the initial data collection, the resident input was pub-lished online, both in its original form as well as analyzed and generalized. The data was used online and printed out in the public meetings and workshops to foster public discussion and debate on the results. All this furthers transparency of the gathered input and the process. The diverging views of the residents were also visible in the workshops where the data was used to foster the group discussions. As agonistic planning debate highlights, striving to hear the plural voices of society entails the emergence of divergent and conflicting views as well (Bäcklund & Mäntysalo, 2010).
Dow
nloa
ded
by [
UQ
Lib
rary
] at
11:
37 2
4 D
ecem
ber
2015

PlAnnInG PrACTICe & reSeArCH 17
Outside the participation process organized by the city, we performed analysis on the compatibility of residents’ values, and compared the resident input with the plan proposal. These kind of analyses should be brought to the official process to further promote transpar-ency by showing how the resident input affects the planning output. This could be achieved efficiently through the use of online visualization and analysis tools, which would also allow public discussion regarding these results. Although transparency can be supported by new tools to gain more effective impact on the process, the planners should be more eager to use this input and to design the process in a way that allows the public discussion.
The criterion of representativeness brings along demanding considerations, because in public participation even one single voice counts. In Helsinki, the PPGIS was not performed using random sampling of the population, as the planners wanted the tool to be open for everyone. This volunteer aspect reduces easily the diversity of opinions (cf. Brown, 2014), but when understood as an additional tool to the repertoire of participation tools, PPGIS with a VGI component can complement the information reached with other methods. Still, the representativeness of PPGIS could be supported also with a random sample along the open data collection, which would allow the comparison between the randomly sampled and openly collected input. Using random sampling alongside the open method of data collection could lower the criticism toward unrepresentative data-set, especially when the case is sensitive like urban infill development.
The influence of the depicted process remains slender. Obviously analyzing the influence of the gathered input on planning output and outcome remains complicated, due to the long time span of master plan process. Nevertheless, already at this state of the process, the planners admitted that the input had not been used sufficiently, even though it was valued. In future research, the degree of perceived influence should be questioned also from the residents them-selves (cf. Brown & Chin, 2013). Moreover, the type of data that PPGIS methods produce have great potential to influence the planning process due to the place-based and digital character of the data. The information produced by more traditional participation methods is more difficult to mold into tangible ideas that could be made visible in realized planning documents.
Development work carried out in PPGIS and PSS fields strives to benefit the planning practice, but integrating these ICT-based tools to the practice remains a challenge (Vonk, Geertman, & Schot, 2005; te Brömmelstroet & Bertolini, 2008; Schrijnen, 2010; Pelzer et al., 2014). Whereas the scholars in the field of PPGIS are used to collecting and handling large data-sets based on the residents experiences, scholars from the field of PSS are specialized to give support through analysis and modeling to various planning tasks. Combining the expertise from both fields would be elementary to develop comprehensive PPSS. Further, evaluation studies on the use and impact of these tools are needed to provide strategic understanding for the planners, of the possibilities varying participation tools and methods provide. To be able to compare the use and influence of different methods and tools, still a more comprehensive evaluation framework concentrating on the effectiveness is needed. The explorers of new public participation methods should put more emphasis on the eval-uation of the success and effectiveness of the process and outcomes to validate the use of these new participation methods.
In this paper, we presented a case study where first steps were taken to combine the elements of both these systems. The analyzed case illustrates how PPGIS data collection, analysis and visualization tools can turn into more tangible support system that support the combination of PSS and PPGIS, and evolve to more durable PPSS. Ideally, data collection
Dow
nloa
ded
by [
UQ
Lib
rary
] at
11:
37 2
4 D
ecem
ber
2015

18 M. KAHIlA-TAnI eT Al.
interventions should be supported by integration of the data to the geographic information systems used in the city, and further elaborated by other visualization and analysis tools open to the public. This integration would make the gathered data easier for the planners to utilize and for residents to explore and communicate. To reach this ideal, the planning organization and individual planners need to be committed to utilize comprehensively the input gathered. Alongside the commitment, future technology development to ease the combination of different tools and data-sets is needed.
Notes
1. Official information on the Helsinki 2050 city plan is available on http://www.yleiskaava.fi/en/.2. The developed tools are available online in http://yleiskaava.maptionnaire.com/ and https://
helsinki.asiatkartalle.fi/geoforms/2/feedback.3. Altogether 4,681 respondents visited the survey, but 938 did not answer to any of the questions
or make any mappings. It is likely that many of these respondents scanned the survey first through without answering. The application did take this possibility into account and provided a ‘Try without saving the answers’ option, but perhaps many respondents did not notice this option.
ORCID
Anna Broberg http://orcid.org/0000-0003-4189-0364
References
Al-Kodmany, K. (1999) Using visualization techniques for enhancing public participation in planning and design: process, implementation, and evaluation, Landscape and Urban Planning, 45, pp. 37–45.
Bäcklund, P. & Mäntysalo, R. (2010) Agonism and institutional ambiquity: ideas on democracy and the role of participation in the development of planning theory and practice – the case of Finland, Planning Theory, 9(4), pp. 333–350. doi:10.1177/1473095210373684.
Beierle, T. C. & Cayford, J. (2002) Democracy in Practice. Public Participation in Environmental Decisions. (Washington, DC: Resources for the Future).
Beresford, P. & Hoban, M. (2005) Participation in Anti-poverty and Regeneration Work and Research. Overcoming Barriers and Creating Opportunities (New York: Joseph Rowntree Foundation). Available at http://www.jrf.org.uk/bookshop/eBooks/1859353738.pdf (accessed 10 January 2015).
Brail, R. K. & Klosterman, R. E. (2001) Planning Support Systems: Integrating Geographic Information Systems, Models, and Visualization Tools (Redlands, CA: Esri Press).
te Brömmelstroet, M. (2012) Transparency, flexibility, simplicity: from buzzwords to strategies for real PSS improvement, Computers, Environment and Urban Systems, 36(1), pp. 96–104.
te Brömmelstroet, M. (2013) Performance of planning support systems: What is it, and how do we report on it? Computers, Environment and Urban Systems, 41, pp. 299–308.
te Brömmelstroet, M. & Bertolini, L. (2008) Developing land use and transport PSS: Meaningful information through a dialogue between modelers and planners, Transport Policy, 15(4), pp. 251–259.
Brown, G. (2012) Public participation GIS (PPGIS) for regional and environmental planning: reflections on a decade of empirical research. URISA Journal, 25, p. 7–18.
Brown, G. (2014) Engaging the wisdom of crowds and public judgment for land use planning using public participation GIS (PPGIS), Australian Planner (Manuscript accepted for publication (10 November 2014)).
Brown, G. & Chin, S. Y. W. (2013) Assessing the effectiveness of public participation in neighbourhood planning, Planning Practice and Research, 28(5), pp. 563–588.
Dow
nloa
ded
by [
UQ
Lib
rary
] at
11:
37 2
4 D
ecem
ber
2015

PlAnnInG PrACTICe & reSeArCH 19
Brown, G. & Kyttä, M. (2014) Key issues and research priorities for public participation GIS (PPGIS): a synthesis based on empirical research, Applied Geography, 46, pp. 122–136. doi:10.1016/j.apgeog.2013.11.004.
Brown, G. & Raymond, C. M. (2014) Methods for identifying land use conflict potential using participatory mapping. Landscape and Urban Planning, 122, pp. 196–208. doi:10.1016/j.landurbplan.2013.11.007.
Brown, G., Donovan, S., Pullar, D., Pocewicz, A., Toohey, R. & Ballesteros-Lopez, R. (2014) An empirical evaluation of workshop versus survey PPGIS methods, Applied Geography, 48, pp. 42–51. doi:10.1016/j.apgeog.2014.01.008.
Corburn, J. (2003) Bringing local knowledge into environmental decision making: improving urban planning for communities at risk, Journal of Planning Education and Research, 22(4), pp. 420–433. doi:10.1177/0739456X03022004008.
Forester, J. (1999) The logistics of public participation in environmental assessment, International Journal of Environment and Pollution, 11(3), pp. 316–330.
Friedmann, J. (1992) Empowerment: The Politics of Alternative Development (Oxford: Blackwell).Friedmann, J. (1998) The new political economy of planning: the rise of the civil society, in: M.
Douglass & J. Friedmann (Eds) Cities for Citizens, pp. 19–38 (Chichester: Wiley).Geertman, S. (2006) Potentials for planning support: a planning-conceptual approach, Environment
and Planning B: Planning and Design, 33(6), pp. 863–880.Geertman, S. & Stillwell, J. (2004) Planning support systems: an inventory of current practice,
Computers, Environment and Urban Systems, 28(4), pp. 291–310. doi:10.1016/S0198-9715(03)00024-3.
Goodchild, M. F. (2007) Citizens as sensors: the world of volunteered geography, GeoJournal, 69(4), pp. 211–221. doi:10.1007/s10708-007-9111-y.
Hall, G. B., Chipeniuk, R., Feick, R. D., Leahy, M. G. & Deparday, V. (2010) Community-based production of geographic information using open source software and Web 2.0, International Journal of Geographical Information Science, 24(5), pp. 761–781. doi:10.1080/13658810903213288.
Halvorsen, K. E. (2001) Assessing public participation techniques for comfort, convenience, satisfaction, and deliberation, Environmental Management, 28(2), pp. 179–186. doi:10.1007/s002670010216.
Healey, P. (1992) Planning through debate, Town Planning Review, 63(2), pp. 143–162.Healey, P. (1997) Collaborative Planning. Shaping Places in Fragmented Societies (Hampshire: McMillan
Press Limited).Heikkinen, H. L., Rovio, E. & Syrjälä, L. (2006) Toiminnasta tietoon: Toimintatutkimuksen Menetelmät
Ja Lähestymistavat [From action to knowledge]. pp. 144–162. (Helsinki: Kansanvalistusseura).Horelli, L. (2002) A Methodology of Participatory Planning. Handbook of environmental psychology,
pp. 607–628 (New York: Wiley).Innes, J. & Booher, D. E. (2004) Reframing public participation: strategies for the 21st century,
Planning Theory & Practice, 5(4), pp. 419–436. doi:10.1080/1464935042000293170.Irvin, R. A. & Stansbury, J. (2004) Citizen participation in decision making: Is it worth the effort?
Public Administration Review, 64(1), pp. 55–65. doi:10.1111/j.1540-6210.2004.00346.x.Kahila, M. (2013) SoftGIS development process as a trading zone: challenges in implementing a
participatory planning support system, in: A. Balducci & R. Mäntysalo (Eds), Urban Planning as a Trading Zone, pp. 75–94 (Dordrecht: Springer).
Kahila, M. & Kyttä, M. (2009) SoftGIS as a bridge builder in collaborative urban planning, in: S. Geertman & J. Stillwell (Eds) Planning Support Systems: Best Practices and New Methods, pp. 389–411 (Dordrecht: Springer Science+Business Media B.V.).
Kingston, R. (2007) Public participation in local policy decision-making: the role of web-based mapping, The Cartographic Journal, 44(2), pp. 138–144. doi:10.1179/000870407X213459.
Klosterman, R. E. (1999) The what if? Collaborative planning support system, Environment and Planning B: Planning and Design, 26(3), pp. 393–408. doi:10.1068/b260393.
Koontz, T. M., Thomas, C. W. (2006) What do we know and need to know about the environmental outcomes of collaborative management? Public Administration Review, 66(s1), pp. 111–121. doi:10.1111/j.1540-6210.2006.00671.x.
Dow
nloa
ded
by [
UQ
Lib
rary
] at
11:
37 2
4 D
ecem
ber
2015

20 M. KAHIlA-TAnI eT Al.
Kyttä, M., Kahila, M. & Broberg, A. (2011) Perceived environmental quality as an input to urban infill policy-making, Urban Design International, 16(1), pp. 19–35. doi:10.1057/udi.2010.19.
Kyttä, M., Broberg, A., Haybatollahi, M. & Schmidt-Thomé, K. (2015) Urban happiness – context-sensitive study of the social sustainability of urban settings, Environment and Planning B 2015, 47, pp. 1–24. doi:10.1177/0265813515600121
Laurian, L. (2004) Public participation in environmental decision making: findings from communities facing toxic waste cleanup, Journal of the American Planning Association, 70(1), pp. 53–65. doi:10.1080/01944360408976338.
Laurian, L. & Shaw, M. (2009) Evaluation of public participation: the practices of certified planners, Journal of Planning Education and Research, 28, pp. 293–309.
Leino, H. (2006) Kansalaisosallistuminen ja kaupunkisuunnittelun dynamiikka: Tutkimus tampereen vuoreksesta [Public participation and the dynamics of the urban planning: Study on Tampere, Vuores]. (Tampere: Tampere University Press).
McCrea, R. & Walters, P. (2012) Impacts of urban consolidation on urban liveability: comparing an inner and outer suburb in Brisbane, Australia, Housing, Theory and Society, 29(2), pp. 190–206. doi:10.1080/14036096.2011.641261.
Menzel, S., Nordström, E.-M., Buchecker, M., Marques, A., Saarikoski, H. & Kangas, A. (2012) Decision support systems in forest management: requirements from a participatory planning perspective, European Journal of Forest Research, 131(5), pp. 1367–1379. doi:10.1007/s10342-012-0604-y.
Monno, V. & Khakee, A. (2011) More of the same or just right and robust? Evaluating participatory planning, in: A. Hull, E. R. Alexander, A. Khakee & J. Woltjer (Eds), Evaluation for Participation and Sustainability in Planning, pp. 297–314 (Abingdon: Routledge).
Pelzer, P. Geertman, S., Heijden, R., van der Rouwette, E. (2014) The added value of planning support systems: a practitioner’s perspective, Computers, Environment and Urban Systems, 48, pp. 16–27.
Rowe, G. & Frewer, L. J. (2004) Evaluating public-participation exercises: a research agenda, Science, Technology, & Human Values, 29(4), pp. 512–555. doi:10.1177/0162243903259197.
Rowe, G. & Frewer, L. J. (2000) Public participation methods: a framework for evaluation, Science Technology Human Values, 25(1), pp. 3–29. doi:10.1177/016224390002500101.
Schrijnen, P. M. (2010) From planning support systems to mediated planning support: a structured dialogue to overcome the implementation gap, Environment and Planning B: Planning and Design, 37(1), pp. 3–20.
Staffans, A. (2004) Vaikuttavat asukkaat. Vuorovaikutus ja paikallinen tieto kaupunkisuunnittelun haasteina. Yhdyskuntasuunnittelun tutkimus- ja koultuskeskuksen julkaisuja A 29. (Espoo: Teknillinen korkeakoulu, Yhdyskuntasuunnittelun tutkimus- ja koulutuskeskus).
Sui, D., Elwood, S. & Goodchild, M. (Eds) (2013) Volunteered Geographic Information, the Exaflood, and the Growing Digital Divide. Crowdsourcing Geographic Knowledge: Volunteered Geographic Information (VGI) in Theory and Practice (Netherlands: Springer). doi: 10.1007/978-94-007-4587-2_1
Tulloch, D. (2008) Public participation GIS (PPGIS), in: K. Kemp (ed.), Encyclopedia of geographic information science, pp. 352–355 (Thousand Oaks, CA: Sage).
Vonk, G., Geertman, S. & Schot, P. (2005) Bottlenecks blocking widespread usage of planning support systems. Environment and Planning A, 37(5), pp. 909–924.
Zhang, Y. & Fung, T. (2013) A model of conflict resolution in public participation GIS for land-use planning, Environment and Planning B: Planning and Design, 40, pp. 550–568. doi:10.1068/b37033.
Dow
nloa
ded
by [
UQ
Lib
rary
] at
11:
37 2
4 D
ecem
ber
2015