Embed Size (px)
Citation preview
Lessons learned in water accountingThe fisheries and aquaculture perspective in the System of Environmental-Economic Accounting (SEEA) framework
599
FAOFISHERIES ANDAQUACULTURE
TECHNICALPAPER
ISSN 2070-7010
metetre pescatori non mondo

Cover photo credits: Free creative commons (top left, bottom left), © FAO (top right, bottom right)
Lessons learned in water accounting The fisheries and aquaculture perspective in the System of Environmental-Economic Accounting (SEEA) framework
by
Daniela OttavianiFAO ConsultantFAO Fisheries and Aquaculture DepartmentRome, Italy
Sachiko TsujiSenior Fishery StatisticianFAO Fisheries and Aquaculture DepartmentRome, Italy
and
Cassandra De YoungFishery Planning Analyst FAO Fisheries and Aquaculture DepartmentRome, Italy
FOOD AND AGRICULTURE ORGANIZATION OF THE UNITED NATIONSRome, 2016
FAOFISHERIES ANDAQUACULTURE
TECHNICALPAPER
599

The designations employed and the presentation of material in this information product do not imply the expression of any opinion whatsoever on the part of the Food and Agriculture Organization of the United Nations (FAO) concerning the legal or development status of any country, territory, city or area or of its authorities, or concerning the delimitation of its frontiers or boundaries. The mention of specific companies or products of manufacturers, whether or not these have been patented, does not imply that these have been endorsed or recommended by FAO in preference to others of a similar nature that are not mentioned.
The views expressed in this information product are those of the author(s) and do not necessarily reflect the views or policies of FAO.
ISBN 978-92-5-109319-1
© FAO, 2016
FAO encourages the use, reproduction and dissemination of material in this information product. Except where otherwise indicated, material may be copied, downloaded and printed for private study, research and teaching purposes, or for use in non-commercial products or services, provided that appropriate acknowledgement of FAO as the source and copyright holder is given and that FAO’s endorsement of users’ views, products or services is not implied in any way.
All requests for translation and adaptation rights, and for resale and other commercial use rights should be made via www.fao.org/contact-us/licence-request or addressed to [email protected].
FAO information products are available on the FAO website (www.fao.org/publications) and can be purchased through [email protected].

iii
Preparation of this document
This Technical Paper has been prepared under the auspices of the “Climate Change, Fisheries and Aquaculture: testing a suite of methods for understanding vulnerability, improving adaptability and enabling mitigation (GCP/GLO/322/NOR)” project, supported by the Government of Norway. The report has received inputs from colleagues in the water and statistical sectors as well as of experts of the international System of Environmental and Economic Accounting within the Food and Agriculture Organization of the United Nations (the FAO) and beyond.
iv
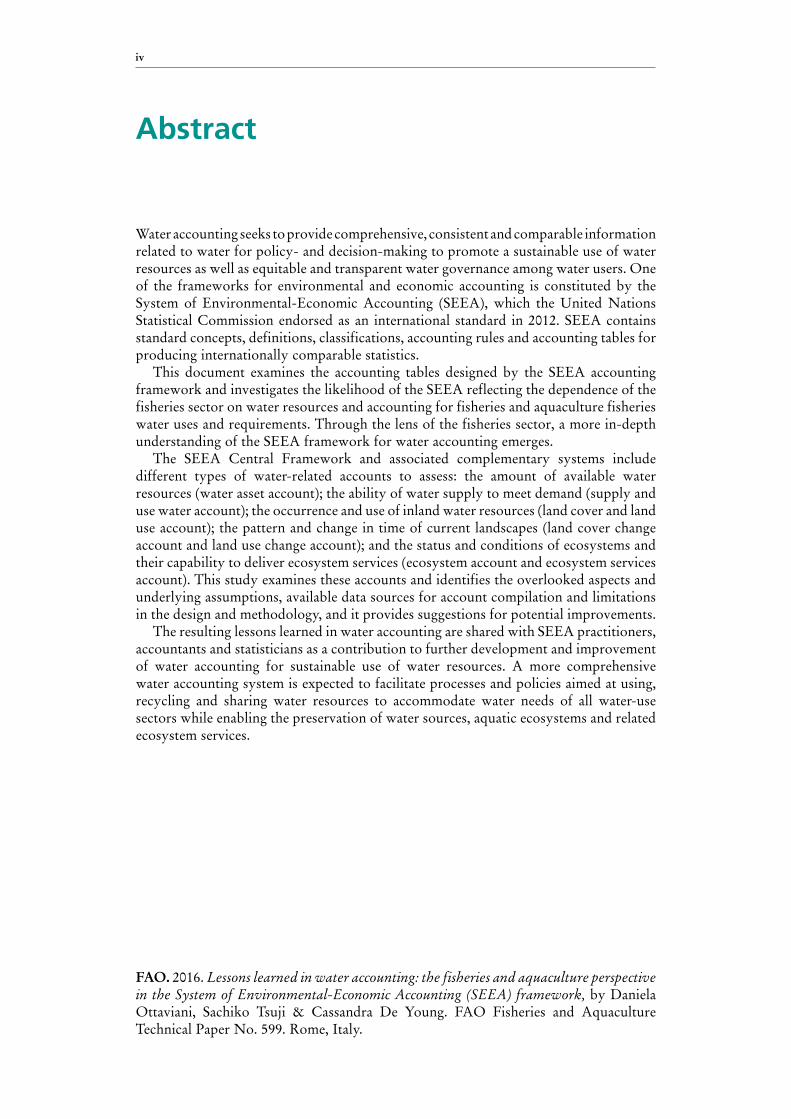
Abstract
Water accounting seeks to provide comprehensive, consistent and comparable information related to water for policy- and decision-making to promote a sustainable use of water resources as well as equitable and transparent water governance among water users. One of the frameworks for environmental and economic accounting is constituted by the System of Environmental-Economic Accounting (SEEA), which the United Nations Statistical Commission endorsed as an international standard in 2012. SEEA contains standard concepts, definitions, classifications, accounting rules and accounting tables for producing internationally comparable statistics.
This document examines the accounting tables designed by the SEEA accounting framework and investigates the likelihood of the SEEA reflecting the dependence of the fisheries sector on water resources and accounting for fisheries and aquaculture fisheries water uses and requirements. Through the lens of the fisheries sector, a more in-depth understanding of the SEEA framework for water accounting emerges.
The SEEA Central Framework and associated complementary systems include different types of water-related accounts to assess: the amount of available water resources (water asset account); the ability of water supply to meet demand (supply and use water account); the occurrence and use of inland water resources (land cover and land use account); the pattern and change in time of current landscapes (land cover change account and land use change account); and the status and conditions of ecosystems and their capability to deliver ecosystem services (ecosystem account and ecosystem services account). This study examines these accounts and identifies the overlooked aspects and underlying assumptions, available data sources for account compilation and limitations in the design and methodology, and it provides suggestions for potential improvements.
The resulting lessons learned in water accounting are shared with SEEA practitioners, accountants and statisticians as a contribution to further development and improvement of water accounting for sustainable use of water resources. A more comprehensive water accounting system is expected to facilitate processes and policies aimed at using, recycling and sharing water resources to accommodate water needs of all water-use sectors while enabling the preservation of water sources, aquatic ecosystems and related ecosystem services.
FAO. 2016. Lessons learned in water accounting: the fisheries and aquaculture perspective in the System of Environmental-Economic Accounting (SEEA) framework, by Daniela Ottaviani, Sachiko Tsuji & Cassandra De Young. FAO Fisheries and Aquaculture Technical Paper No. 599. Rome, Italy.
v
Contents
Preparation of this document iiiAbstract ivAcknowledgements viiAbbreviations and acronyms viiiList of tables/figures ixExecutive summary x
1. Introduction 1
2. SEEA accounting framework 3Why environmental-economic accounting? 3Scope of the System of National Accounts (SNA) 4Process towards an environmental-economic accounting framework 4Overview of the system of environmental-economic accounting (SEEA) 6
3. Water use by the fisheries sector 15Water as a vital resource for the fisheries sector 15In-stream and off-stream water use by the fisheries sector 16Water consumption by the fisheries sector 17From water consumption to water footprint 18Water volume and water area as measures for water accounting 21
4. SEEA accounting for water areas 23SEEA accounting for occurrence of surface water 23SEEA land cover classification 23SEEA land cover account 25Globally available data for account compilation 26Additional considerations and suggestions 26SEEA accounting for the use of surface water 29SEEA land use account 29Globally available data for account compilation 30Additional considerations and suggestions 30
5. SEEA water accounting for water volumes 35Water asset account for water stocks and water flows 35Required data 36Globally available data for account compilation 38Additional considerations and suggestions 42Water supply and use account for water allocation and water consumption 44Required data 46Additional considerations and suggestions 46

vi
6. SEEA accounting for ecosystems 51SEEA-EEA accounting approach 51SEEA-EEA account for ecosystems and ecosystem services 51SEEA-EEA account for ecosystem services 53Required data 54Globally available data for account compilation 55Additional considerations and suggestions 56
7. Conclusions 59
vii
Acknowledgements
This document stems from a reflection on several discussions held at the FAO between 2012 and 2015 during the development of FAO SEEA-Agriculture initiative, which also includes a component related to the fisheries sector.
All enriching and stimulating discussions on the SEEA framework held with FAO colleagues, including Silvia Cerilli, Giulia Conchedda, Giorgia De Santis, Karen Frenken, Hippe Hoogeveen, Sergei Khomenko, Robert Mayo, Livia Peiser, Valentina Ramaschiello, Ilaria Rosati and Francesco Tubiello, are gratefully acknowledged.
A special thanks goes to Carl Obst for his insights and useful contributions in the discussions of SEEA accounting and for valuable detailed comments on the initial draft of this paper, and to Jürgen Forster (Eurostat) for his prompt feedback on the initial version of the document.
Finally, acknowledgement is made to Jennifer Gee for her edits and encouragement.
viii
Abbreviations and acronyms
AQUASTAT FAO’s information system on water and agricultureBSU basic spatial unitBOD biological oxygen demandCICES Common International Classification for Ecosystem ServicesCOD chemical oxygen demandCPC Central Product ClassificationEAU Ecosystem Accounting UnitEEZ exclusive economic zoneERWR external renewable water resourcesEU European Union (Member Organization)FAO Food and Agriculture Organization of the United NationsGIS Geographic Information SystemGHG greenhouse gasGLC-SHARE Global Land Cover-SHAREGlobWat GIS-based global water balance modelIGBP International Global Biosphere ProgrammeIMF International Monetary FundIRWR internal renewable water resourcesISIC International Standard Industrial Classifications of
All Economic ActivitiesIWRM integrated water resources managementJRC Joint Research CentreLCCS Land Cover Classification SystemLCEU Land Cover Ecosystem functional UnitLCML Land Cover Meta LanguageLondon Group London Group on Environmental AccountingLUISA Land Use-based Integrated Sustainability impact AssessmentMAES Mapping and Assessment of Ecosystems and their ServicesMODIS Moderate Resolution Imaging SpectroradiometerOECD Organisation for Economic Co-operation and DevelopmentRAS recirculation aquaculture systemSEEA System of Environmental-Economic AccountingSEEA-Agriculture System of Environmental Economic Accounting for AgricultureSEEA-CF System of Environmental-Economic Accounting Central
FrameworkSEEA-EEA System of Environmental-Economic Accounting for
Experimental Ecosystem AccountingSEEA-Water System of Environmental-Economic Accounting for WaterSNA System of National AccountsTRWR total renewable water resourcesUN United NationsUNCEEA UN Committee of Experts in Environmental–Economic
Accounting UNECE United Nations Economic Commission for EuropeUNEP United Nations Environment ProgrammeUNSCUNSD
United Nations Statistics CommissionUnited Nations Sustainable Development

ix
List of tables
Table 1 Elements constituting the structure of the SEEA-CF 7Table 2 Comparison in the logic of asset accounts used in SEEA and SNA 8Table 3 Comparison in the logic of supply and use accounts used in SEEA and SNA 8Table 4 In-stream and off-stream water use within the fisheries sector 16Table 5 Direct and indirect water consumption within the fisheries sector 17Table 6 Preferential use of water from certain water compartments for different purposes 20Table 7 Occurrence of water in the SEEA land cover classification 23Table 8 Structure of SEEA land cover account 25Table 9 SEAA land use classification 29Table 10 Structure of SEEA land use account for water 30Table 11 Structure of the SEEA water asset account 35Table 12 AQUASTAT statistics and SEEA water asset account 40Table 13 Structure of the SEEA supply and use water account 44Table 14 Matrix of flows of water within the economy 47Table 15 Structure of SEEA-EEA account to assess ecosystem extent and conditions 52Table 16 Structure of SEEA-EEA account to assess changes in ecosystem conditions 53Table 17 Structure of SEEA-EEA account to measure ecosystem services by type of LCEU 54
List of figures
Figure 1 Bidirectional interaction between economy and environment 6Figure 2 Major water flows accounted for in the water asset account 9Figure 3 Major water flows accounted for in the supply and use water account 10

x
Executive summary
Environmental-economic accounting is an essential framework in which the environment and economy are jointly assessed. National economies depend upon natural resources but, at the same time, economic activities often deplete natural resources and cause environmental degradation. Policies and economic instruments have an important role in determining the conditions for ensuring the conservation and sustainable use of natural resources and ecosystems.
The environmental-economic accounting approach arises from the need to expand the scope and analytical capacity of the System of National Accounts (SNA), whose original intent was only to monitor trends in national economic growth. Since the 1950s, the SNA has been used worldwide as an international standard accounting framework and constituted the basis for many national decision-making processes and policies. The major flaw is that the SNA covers exclusively the economic domain and does not convey any information on the status and use of natural resources on which economic activities depend. After a long process that started in the 1990s, an integrated Systems of Environmental-Economic Accounting (SEEA) was established and endorsed by United Nations Statistics Commission in 2012 as an international standard of accounting. Currently, the SEEA accounting framework is composed of the SEEA Central Framework (SEEA-CF), a central core with complementary accounting systems including the SEEA-Water and the SEEA for Experimental Ecosystem Accounting (SEEA-EEA).
This report aims to analyse water accounting within the SEEA framework and to investigate how well this framework is able to reflect the dependence of the fisheries sector on water resources and to describe its water needs and requirements.
Water use in the fisheries sector is highly diversified according to its subcomponents.The fisheries sector is comprised of capture fisheries and aquaculture activities, which can take place in inland, coastal and marine environments. The common characteristic of the fisheries sector regarding the use of water resources is that the sector is dependent on the availability of and access to surface waters. Fresh, brackish and saline surface waters provide fish habitats and are used for capture fishery, for cage and pen aquaculture as well as for the collection of fish fry or juveniles to be raised in aquaculture. Thus, the fisheries sector makes use of surface waters because they are also fish habitats. While other sectors can use other water resources such as groundwater and rainwater, the fisheries sector is mostly constrained to the availability of surface waters. This implies that the water use by fisheries sector is inextricably linked to the protection and maintenance of aquatic ecosystems. Therefore, accounting for how much water is available is often not enough. Equally critical features include where water resources are placed, their flow dynamics, temporal availability, water quality conditions and salinity levels, and the impacts of drivers of change and anthropogenic pressures.
Water use by the fisheries sector can be grouped in two categories: in-stream / on-site water use and off-stream / off-site water use. Fishing, cage and pen aquaculture, and vertical raceways have in-stream water use as water is not removed from its source (or is immediately returned with little or no alteration). In-stream water use is attributed as null water consumption, as water consumption is considered as the proportion of water that is incorporated into products or lost by evaporation. The amount of water accumulated into fish biomass is negligible and the amount of water lost by evaporation is also considered null as it is not additional to the amount of evaporation occurring in natural waters as part of the water cycle.
xi
The fact that the in-stream water use of the fisheries sector does not consume water does not imply its activities do not need water. Indeed, they need water on site. The amount of water needed is the amount of water able to sustain aquatic ecosystems and thus preserve fish habitats (i.e. environmental water flow).
Pond, recirculating aquaculture systems, and horizontal raceways have an off-stream water use. Pond aquaculture is carried out in artificially excavated ponds; recirculating systems use indoor tanks in which water circulates in a closed loop; and horizontal raceways use artificial structures to mimic a river runoff. Unless rainfed, pond aquaculture as these other aquaculture systems usually requires an initial water withdrawal to fill the pond and continuing water withdrawal for maintenance of oxygenation, temperature and dissolved waste removal. Therefore, these aquaculture methods have an off-site water use as water is removed from its source with consequent reduction of the amount of available water left on site.
The assessment of water use of the fisheries sector must take into account both in-stream and off-stream water use, which implies considering both water areas and water volumes. In fact, off-stream water use is usually measured in terms of the water volumes abstracted and consumed and returned to the environment. In-stream water use is usually measured in terms of the water area required for a given purpose, as by definition in-stream water use has no water withdrawal, no water consumption and no water return.
In general, the water use of the fisheries sector is considered to better associate with water areas for several reasons. The activities of the fisheries sector are strictly related to the availability and access to surface waters, providing fish habitats. Fish habitats are frequently described better by water areas than water volumes. For example, tropical finfish are often adapted to live in shallow waters, and even in deep lakes they rarely colonize waters below the photic zone. Water areas can measure the extent of seasonally flooded areas that are often quite shallow in depth but are important breeding and nursery sites for many fish species. Water areas are useful to delineate brackish environments such as lagoons, deltas and estuaries. Therefore, water areas are considered able to represent the in-stream use of capture fisheries and cage aquaculture, and also to be used to define the area occupied by off-stream aquaculture facilities such as ponds and tanks, horizontal raceways. Therefore, water areas is the metric that applies to most of the diversity of activities recorded within the fisheries sector.
In the water arena and in the course of policy discussions among sectors on water use, the fisheries sector stands in a quite vulnerable and isolated position.The fisheries sector can represent its in-stream water use in terms of water areas. However, this metric is not directly comparable with the water use by other primary uses such as crop production, livestock production, industrial production, municipal use and sanitation. These water uses are characterized exclusively by off-stream water uses and consequently measure water volumes associated to water withdrawal, water volumes transported and used in other locations, and water volumes lost by water consumption.
Alternatively, the fisheries sector can represent its water use in terms of water volumes used by pond aquaculture, horizontal raceways and recirculating aquaculture systems, and compare these water use by the other sectors. However, this comparison will not include the in-stream water uses of the fisheries sector. This indicates that to fully represent the water use of the fisheries sector in an environmental-economic accounting framework, some methodological gaps need to be resolved.
The SEEA accounting framework has water-related accounts designed for water areas and water volumes.Accounts related to water areas describe the landscape composition and specifically measure areas occupied by different water resources (i.e. the land cover account) as well

xii
as distinguishes among main existing uses of surface resources (i.e. the land use account). Both types of account can describe land cover and land use changes in time.
Accounts related to water volumes assess the amount of water resources available in a country (i.e. water asset account) and the ability of water supply to meet water demand (i.e. supply and use water account). The SEEA accounts that refer to water areas can be considered as still in a testing stage as there are few indications for their implementation. Guidelines and recommendations are generally focused on SEEA accounts referred to water volumes rather than water areas, reflecting the needs of information on water volume to support policy objectives in water management such as: improving water supply and sanitation services; managing water supply and demand among municipal irrigation and industrial water users; developing a rationale for water allocation permits; mitigating the risk of flooding; monitoring climate variability and related hydrometeorological patterns; and understanding of existing water supply in relation to climate trends or extreme climatic events.
The SEEA land cover account provides information on the area of existing surface waters. An adequate number of categories is needed to represent the diversity of aquatic ecosystems. In particular, a distinction between permanent and seasonal water resources is highly recommended. While permanent inland waters constitute fish habitats for most of the life cycle of fish species, seasonal flooded areas often provide specific breeding sites and nurseries. Moreover, seasonally flooded areas usually contain high nutrient concentrations, which leads to their high fish-water productivity.
The SEEA land use account provides information on the use and the share of existing surface waters. Water use assessment requires the distinction between single-purpose and multipurpose water uses. Single-purpose water use can be associated to cage and pen aquaculture, areas designed for conservation purpose to artificial irrigation reservoirs, and artificial ponds used for cooling water from power plant or industrial facilities. The bulk of surface waters is likely to be subject to multiple water uses, and an additional methodology to describe multipurpose water use in space and time needs to be devel-oped with the SEEA framework.
The SEEA water asset account provides information on the availability and variation of water volumes recorded at the beginning and then at the end of the accounting period. The water asset account includes both stocks and flows corresponding respectively to an assessment of water resources (stocks) recorded in different compartments (surface water, groundwater and soil water) and their additions and reductions (flows) over an accounting period. A GIS hydrological model would be needed to link dynamically the variation of water flows and to the consequent variation of water stocks, which would be essential from the fisheries and aquaculture perspective. Such dynamic linkages could make explicit the effects that variations on water flows can produce on fish habitats, and consequently on the activities of the fisheries sector.
An integrated approach of data collection and data modelling in the implementation of water asset accounts in physical units would be very valuable. In particular, from the fisheries and aquaculture perspective it would be highly recommended to apply this integrated approach at the watershed level and then subsequently scale up the output to the national level.
The temporal scale of the water asset account needs also to be assessed with caution. Usually, the length of the accounting period is considered to be one year. This is because economic assessments provided by national accounts are also carried out in this time frame. However, if the length of one year is considered as the calendar year (1 January – 31 December), then adequate monitoring of the accumulation of precipitations in form of snow and glaciers should be carefully assessed.
xiii
Moreover, in order to design precautionary measurement and policies, a conservative water accounting should compile water asset accounts of the available water resources in different years that represent a range of different situations from “very dry” to “very wet” years. Nevertheless, annual accounts may hide seasonal variability that would be particular relevant for the fisheries sector. Implementing water asset account seasonally will provide information of seasonal water peaks and droughts, which can be more critical values than annual averages.
The SEEA supply and use water account links the major water suppliers and major water users in order to have an understanding in accounting terms of the origin and des-tination of water flow within the economy. This accounts represents water use in terms of water volumes abstracted by each sector, lost as a consequence of water consumption, and released back into the environment. Therefore, this account is designed for an off-stream water use. Pond aquaculture, horizontal raceways and recirculating aquaculture systems can be represented in this account structure. In addition, this account could be adjusted to include also in-stream water use of the fisheries sector once the environment is also included as one water supplier together with other economic units in charge of water supply, treatment and distribution. In particular, for accounting purposes, the in-stream water use of the fisheries sector could be described as a system having water withdrawals equal to return with no water consumption. The volumes of water accounted under withdrawals and returns of the fisheries sector should be equal to the environmental water flow that supports the life cycle of fish species and the migration and reproduction of many fish species.
Potential conflicts arising from multiple water use by different sectors could be better accounted for by collecting information not only about withdrawals but also about returns. It would be informative to distinguish where water is returned to surface water, to the soil or to the sea, and to account for changes in water quality of water return. By combining information from the supply and use water account with information from the water emission account, it would be possible to compare abstraction and returns of different economic units where returns are accounted as: (i) the sum of real volumes returned to the environment; and (ii) estimated volumes of water needed to dilute pollutant concentration of returns of water to agreed water quality standards.
The SEEA-EEA offers a real opportunity to represent more in depth the perspective of the fisheries sector. This accounting focuses on ecosystems by considering both their extent and conditions as well as their capacity to deliver provisioning, regulating and cultural services. Such an accounting framework would better fit ecosystem-based fisheries management. The accounts suggested under the SEEA-EEA are still experimental in design and require further development and testing. However, the SEEA-EEA approach promotes a spatial-explicit accounting approach in which the watershed, not the national scale, becomes the key unit for water accounting. In future, the further development of SEEA-EEA will move water accounting beyond the assessment of a single individual environmental asset towards the accounting of multifunctionality of aquatic ecosystems.


1
1. Introduction
Water accounting is a powerful tool for monitoring and evaluating the use of water resources. It provides a measure of the availability of water resources within a country’s territory and also a measure of the pressures on these water resources by different economy activities and overlapping or conflicting uses among different water users. This information can then be used to improve resource management and inform decision-making processes by identifying whether a country is using its water resources in an efficient, equitable and sustainable way.
The fisheries sector provides vital benefits to society and is also an important water user. The activities of the fisheries sector would be significantly affected by any alteration of aquatic ecosystems and changes in water quantity and quality. In particular, the activities of fisheries will be affected by any reduction in the availability of or access to surface waters caused by increased climate variability and climate change, increased competition and water conflicts due to ineffective multipurpose water uses, and imbalanced water allocation and overall deterioration of aquatic ecosystems.
The System of Economic-Environmental Accounting (SEEA) was endorsed by the United Nations Statistics Commission (UNSC) as an international standard. The SEEA accounting framework includes water accounting and different types of standard water accounts to describe the occurrence and use of water resources in terms of both water volumes and areas.
This document aims to investigate whether, and to what extent, the accounts of the SEEA framework are able to account for fisheries and aquaculture water uses, and describes the requirements and the dependence of the fisheries sector on water resources.
Chapter 2 illustrates how an environmental-economic accounting was developed from the need to expand the scope of the System of National Accounts (SNA) in order to include both the economic and environmental domains in an integrated accounting framework. The chapter describes the main concepts and accounting principles of the SEEA Central Framework (SEEA-CF) and the two complementary systems (SEEA-Water and SEEA-EEA), which contain specificities for water accounting.
Chapter 3 describes the importance of water resources for the fisheries sector. The fisheries sector includes both capture fisheries and aquaculture activities that take place in inland, coastal and marine environments. This section explores the difference between in-stream and off-stream water uses and how they apply to the fisheries sector. The specificities and similarities in water use of the fisheries sector are compared with those of other sectors. The comparison shows how off-stream water use carried out by aquaculture is similar to water use of other sectors, while the in-stream water use of fishing, cage, pen and vertical raceways aquaculture differs from that of most other sectors. Water accounting needs to reflect both in-stream and off-stream water use of the fisheries sector and allow comparisons with water uses of other sectors.
Chapter 4 examines the SEEA frameworks in relation to accounts designed for water areas. First, the SEEA land cover classification and the related SEEA land cover account are considered, and then the SEEA land use classification and SEEA land use account are examined. The investigation addresses the following aspects: Is the SEEA land cover classification flexible and comprehensive enough to describe the diversity of existing water resources? Can the SEEA land cover classification identify water resources important for the fisheries sector? What are the limitations of using land cover maps to derive the area occupied by surface waters? Is the land use classification able

Lessons learned in water accounting: the fisheries and aquaculture perspective in the SEEA framework2
to assess in-stream water uses? How can multiple in-stream water uses be measured?Chapter 5 focuses on the investigation of the SEEA frameworks in relation to
accounts designed for water volumes. It contains the description of the SEEA water asset account (which assesses the amount of water resources available in a country) along with the SEEA supply and use water account (which describes the ability of the water supply to meet existing water demand). The chapter identifies limitations imposed by the design and methodology of the accounts from the perspective of the fisheries sector; some suggestions for account compilation and for improvement of their current design are provided. The investigation addresses the following aspects: What is the usefulness of data collection and data modelling in water-related account compilation? How can FAO AQUASTAT and GlobWat data be used in the SEEA water account? What are the drawbacks of the spatial and temporal scales of the SEEA water account? How can the fisheries sector be represented in the SEEA supply and use water account as an important water user? Can both in-stream water use and off-stream water use of the fisheries sector be accounted for in the SEEA supply and use water account?
The final chapter concludes the investigation of the SEEA framework by looking at experimental accounts for ecosystems. The unique approach of ecosystem accounting is highlighted along with its potential to move accounting frameworks beyond the accounting of single asset accounts to the consideration of the multifunctionality of ecosystems. The description includes both SEEA-EEA accounts for extent and conditions of ecosystems and for ecosystem services. The complexity of ecosystem accounting poses some methodological challenges, while several aspects of ecosystem accounting can enrich the water accounting approach developed by the SEEA-CF and SEEA-Water. Finally, initial thoughts are provided on what could be the potential of the ecosystem accounting and its future developments to provide a comprehensive assessment of the water uses and needs of the fisheries sector.
3
2. SEEA accounting framework
WHY ENVIRONMENTAL-ECONOMIC ACCOUNTING?Environmental accounting can provide useful information to improve resource management and inform decision-making processes. The assessment of the status of depletion and degradation of natural resources and environment is at the core of monitoring for natural resource management.
However, the importance and novelty of environmental-economic accounting is that it accounts for the interaction between the economy and the environment. Environment and economy are not considered in isolation anymore but as two interacting systems, which for the most part can be measured in comparative units, and thus can be compared and jointly assessed in physical and monetary terms.
Environmental-economic accounting can show the influence of the status of the environment on the economy and the effect of economic activities on the environment. In particular, environmental-economic accounting places considerable importance on assessing the economic value of natural resources as well as the cost of environmental degradation. This can highlight the dependence of the economy on natural resources and perhaps lead towards a more sustainable path of development. Environmental-economic accounting aims to include both the economic and environmental domains in an accounting framework. This encourages the development of a comprehensive, consistent and interdisciplinary data set, whose internal consistency is provided by the accounting framework design. Outcomes are presented in a simple accounting format (i.e. accounts), and in simple units of measurement such as quantity and value to which decision-makers are often accustomed. Therefore, environmental accounting has the advantage of bringing straight to the table of decision-makers evidence of the dependence of economic activities on natural resources, the economic consequences of natural resource depletion and environmental degradation, and the role and impacts of different economic activities and existing policies.
The environmental-economic accounting framework was created to expand the scope and the analytical capacity of current national accounts, which cover only the economic domain, and until now, have constituted the standard accounting reference on which national decisions and policies are based.
KEY MESSAGEEnvironmental-economic accounting
• Accounts for the interaction between the economy and the environment. • Conveys an estimate of the economic value of natural resources as well as the
cost of environmental degradation.• Encourages the development of a comprehensive interdisciplinary data set with
internal consistency.• Uses a simple accounting format to which decision-makers are often accustomed.• Brings to the attention of decision-makers: dependence of economic activities
on natural resources, economic consequences of natural resource depletion and environmental degradation, and role and impacts of different economic activities and existing policies.
Lessons learned in water accounting: the fisheries and aquaculture perspective in the SEEA framework4
SCOPE OF THE SYSTEM OF NATIONAL ACCOUNTS (SNA)National accounts started to be compiled following the Second World War, when governments were interested in monitoring progresses in their economic recovery and in comparing their economic trend with that of other countries. Therefore, in the 1950s, a debate started on the creation of an international standard system of national accounts. The Organisation for Economic Co-operation and Development (OECD) joined this development and the Statistical Commission of the United Nations endorsed this process by publishing the first international standard of the United Nations System of National Accounts (often abbreviated as SNA or UNSNA) in 1953. Revisions were published in 1968, 1993 and 2008.
The SNA is based on three main categories of accounts: supply and use accounts; accumulation accounts; and balance sheets. Supply and use accounts are designed to show production trends, income and use of income. Accumulation accounts describe changes in assets and liabilities and changes in net worth. Balance sheets present stock of assets and liabilities and net worth.
The SNA was originally designed to provide to ministries of finance and policy-makers information on monitoring trends of economic growth; therefore, it was conceived to describe annual variations in economic variables.
PROCESS TOWARDS AN ENVIRONMENTAL-ECONOMIC ACCOUNTING FRAMEWORK Efforts to build a system of environmental accounting analogous to the SNA started in the 1980s with discussions promoted by the World Bank and the United Nations Environment Programme (UNEP). In 1992, Agenda 21, a voluntarily implemented action plan of the United Nations (UN) with regard to sustainable development, was issued during the UN Conference on Environment and Development, and advocated for the establishment of “systems for integrated environmental and economic accounting in all member States at the earliest date”(UNSD, 1992) Accordingly, in 1993 the United Nations Statistical Division published the first version of the SEEA (i.e. SEEA-1993), as a complementary accounting system to the SNA (United Nations, 1993). Reflecting the lack consensus on how to modify the existing SNA, SEEA-1993 presented five different approaches for countries to choose the best approach to their policy needs.
Several countries attempted a first compilation of SEEA-1993, which resulted too conceptual and difficult to implement. At the same time the London Group on Environmental Accounting, commonly referred as the London Group, was created to gather together practitioners in environmental accounting to share informally their understanding and experiences in environmental accounting. The London Group, created by voluntary participation of experts from national statistical agencies and international organizations, met for the first time in 1994. Subsequently, annual meetings were organized for discussion, review and comparison among different ongoing initiatives and efforts.
The ongoing debate on the creation and implementation of a standardized System of Environmental-Economic Accounting led to major revision and the publication of SEEA-2003. In 2005, the UNSC established the UN Committee of Experts in Environmental-Economic Accounting (UNCEEA) to address issues still unresolved in
KEY MESSAGE
The System of National Accounts (SNA) is an international standard accounting framework to describe the economy of a country in a comprehensive, consistent and comparable manner.

5SEEA accounting framework
SEEA-2003. In 2012, a further version of SEEA-CF became an international statistical standard when adopted by the UNSC and jointly published by the UN, European Commission, FAO, International Monetary Fund (IMF), OECD and World Bank in 2014 (United Nations et al., 2014).
While the elaboration of the SEEA-CF was under way, a parallel process led to a further investigation on how to apply the SEEA for water resource accounting. Water in fact had been identified as a priority area in environmental accounting. This led to the publication of the SEEA-Water in 2007 and International Recommendations for Water Statistics in 2010. The SEEA-Water is a subsystem of the SEEA-CF and it is fully coherent with it (United Nations, 2012). The SEEA-Water, prepared in collaboration with the London Group, provides guidance in the implementation of water accounting in order to assess the contribution of water to the economy and the impact of the economy on water resources.
Another line of research of the United Nations Statistics Division, still ongoing, streamed from this process and investigates how to assess the linkage between ecosystems as a whole to the economy and other human activities. The debate of four meetings held between 2011 and 2012 and an international seminar held in New York in 2012 brought to the publication of a first document entitled SEEA-Experimental Ecosystem Accounting (SEEA-EEA). SEEA-EEA provides a complementary accounting system to that of SEEA-CF. It follows the same accounting principles, classifications, accounting structure both in physical and monetary terms, but has a larger focus (UN et al., 2013). Differently from the SEEA-CF, the SEEA-EEA is meant to be implemented at national and subnational level. The UNSC has encouraged the testing and implementation of the SEEA-EEA even though there is currently no status as an international statistical standard and no requirement for its implementation.
In parallel, FAO has developed a specific set of accounts of the SEEA-CF to cover agricultural, forestry and fisheries activity. The resulting System of Environmental-Economic Accounting for Agriculture, Forestry and Fisheries (SEEA-Agriculture) is a national-level statistical framework to describe and analyse the relationship between the environment and the economic activities of agriculture, forestry and fisheries, highlighting the dependencies of these activities on natural resources and the impacts caused to the environment (FAO, 2015a). After two rounds of global consultations a final document on the SEEA-Agriculture was submitted to the UNSC meeting in March 20161.
1 http://unstats.un.org/unsd/statcom/47th-session/documents/BG-2016-8-SEEA-Agriculture-E.pdf
KEY MESSAGESEEA was conceived as an extension of the
System of National Accounts (SNA)
• SEEA-Central Framework (SEEA-CF) is the core of SEEA system, and became an international statistical standard in 2012.
• SEEA-Water is a subsystem of the SEEA-CF for water accounting, and became an international statistical standard in 2007.
• SEEA-Experimental Ecosystem Accounting (SEEA-EEA) system is a complementary accounting to SEEA-CF and it is still in a testing phase.

Lessons learned in water accounting: the fisheries and aquaculture perspective in the SEEA framework6
OVERVIEW OF THE SYSTEM OF ENVIRONMENTAL-ECONOMIC ACCOUNTING (SEEA)SEEA Central Framework – principlesThe SEEA Central Framework (SEEA-CF) is an accounting framework containing international standards, concepts, definitions, classifications, accounting rules and accounts for describing the interactions between the economy and the environment. Many of these interactions are considered in terms of stocks and flows. A stock is a quantity measured at a specific point in time, and a flow is measured over an interval of time.
According to the SNA approach, the economy consists of consumption, production and accumulation activities (Figure 1):
• consumption refers to use by humans of goods and services to satisfy their needs and wants.
• production refers to creation of the goods and services having economic value through a production process and thus made available for consumption. Production requires several kinds of inputs such as: raw materials and resources extracted from the ecosystem, labour and energy.
• accumulation of goods and services (produced and non-produced) occurs when production and consumption are spread over the period longer than one accounting period. Then, goods and services are accumulated and added to the capital stock rather than immediately consumed within the accounting period.
The rational of economic accounting is to measure these three activities over an accounting period and within a production boundary. The SEEA-CF extends the accounting approach of the SNA to include also the environment.
• natural inputs are flows of natural resources, energy and other natural inputs from the environment to the economy that support the economic production process.
• residuals are flows of solid, liquid and gaseous materials, and energy that are discarded, discharged or emitted to the environment.
Therefore, in the SEEA accounting framework the interactions between economy and environment are described as flows of materials and energy from the environment into the economy, flows within the economy, and flows from the economy to the environment (Figure 1). In particular, the accounting of natural resources considers the flows of material and energy and the variations in available stocks that take place as a consequence of economic activities and/or of natural processes.
FIGURE 1Bidirectional interaction between economy and environment
ECONOMY
ENVIRONMENTConsumption
Inputs
Residuals
Production
Accumulation

7SEEA accounting framework
SEEA Central Framework – structureThe SEEA-CF has four modules, which cover four main areas:
• asset accounts measure the status and changes of stocks. • supply and use accounts measure the flows occurring among different economic
units. • economic accounts measure the monetary flow from production account to
capital account. • functional accounts measure the financial transactions that take place to support
environmental protections and management.2
While asset accounts and supply and use accounts are designed to describe the interactions between economy and environment in both physical and monetary terms, economic and functional accounts are designed to be compiled only in monetary terms and are more closely related to the economic information traditionally covered by the SNA (Table 1).
TABLE 1Elements constituting the structure of the SEEA-CF
Module Unit of measurement
Asset account Physical and/or monetary Supply and use account Physical and/or monetary Economic account Monetary Functional account Monetary Combined account presentation Physical and/or monetary
The accounting structure of the SEEA-CF is designed to put together different modules into combined accounts. Combined accounts are compiled to show together information of different accounts. For example, combining an asset account with a supply and use account will explain how the condition of a given natural resource has changed during the period (asset account) and how this natural resource has been supplied and used within the economy, and by whom (supply and use account).
Asset accountThe SEEA-CF defines all natural resources as environmental assets including cultivated biological resources and land within a jurisdiction area of country of reference (including resources within a country’s exclusive economic zone (SEEA-CF § 30). The SEEA-CF includes asset accounts for water, land, soil, mineral and energy use, timber, aquatic biological resources and other biological resources.
The SEEA-CF does not consider oceans and the atmosphere as part of the analysed environmental assets, as their stocks are too large to be meaningful for analytical purposes (SEEA-CF § 30).
In both the SNA and SEEA-CF, the asset account requires recording a measure at the beginning of the accounting period and both positive and negative variations occurring during the accounting period, which results in a closing balance at the end of the accounting period (Table 2). However, in the SNA, asset accounts are compiled only in monetary terms, while in SEEA asset accounts are designed to be compiled in both physical and monetary terms.
However the valuation of natural assets and changes in their flow in monetary terms can be challenging. Therefore, accounts of non-market environmental assets, such as water, are usually not compiled in monetary terms.
2 Functional accounts record, for example, payments of rent for the extraction of natural resources, payments of environmental taxes, and payments of environmental subsidies and grants from government units to other economic units to support environmental protection activity for environmental purposes.

Lessons learned in water accounting: the fisheries and aquaculture perspective in the SEEA framework8
TABLE 2Comparison in the logic of asset accounts used in SEEA and SNA
Information flow SEEAin physical and monetary units
SNAonly in monetary units
Opening balances Opening stocks Opening balance sheetsAre altered by Human activities and natural processes Transactions and other flowsResulting in Change in state Change in balance sheetsLeading to new closing balances Closing stocks Closing balance sheets
Supply and use accountIn the SNA, the supply and use account considers only the flows of products and their trade among the different economic units. In the SEEA-CF, the supply and use account considers not only products but also natural inputs and residuals as flows occurring, respectively, from the environment to the economy and vice versa. In fact, the SEEA the supply and use account describes how inputs from the environment are used by the different sectors within the economy and transformed into products, and how residuals are released back into the environment.
TABLE 3Comparison in the logic of supply and use accounts used in SEEA and SNA
The logic of supply and use accountSEEA
in physical and monetary units
SNAonly in monetary units
SUPPLY
The supply and use account shows how different economic units:
have access to Natural inputs n.a.in order to produce Products Productsor acquire products through Imports Imports
and consequently return to the environment Residuals n.a.
USE
use and consume Natural inputs n.a.have intermediate consumption, final consumption or accumulation of
Products Products
or release products through Exports Exports
and are able to collect and treat Residuals n.a.
Note: n.a. = not accounted
The SEEA-CF adopts the International Standard Industrial Classification of All Economic Activities (ISIC) released in 2006 for economic units and the Central Product Classification (CPC) released in 2008 for products.
SEEA-Water – principlesThe SEEA-Water covers in more detail all aspects related to water accounts contained in the SEEA-CF. To account for water quantity, there are two fundamental accounts that are complementary to each other. The SEEA water asset account assesses the quantity of water in terms of stocks and flows that are available in the environment. The supply and use water account assesses the quantity of waters that are used and exchanged by different economic units within the economy.
Water asset account The SEEA water asset account measures water resources in terms of volumes. The water asset account indicates whether the volume of available water resources in a given country is increasing or decreasing under the current patterns of human activities and natural processes within an accounting period (i.e. usually 12 months).
9SEEA accounting framework
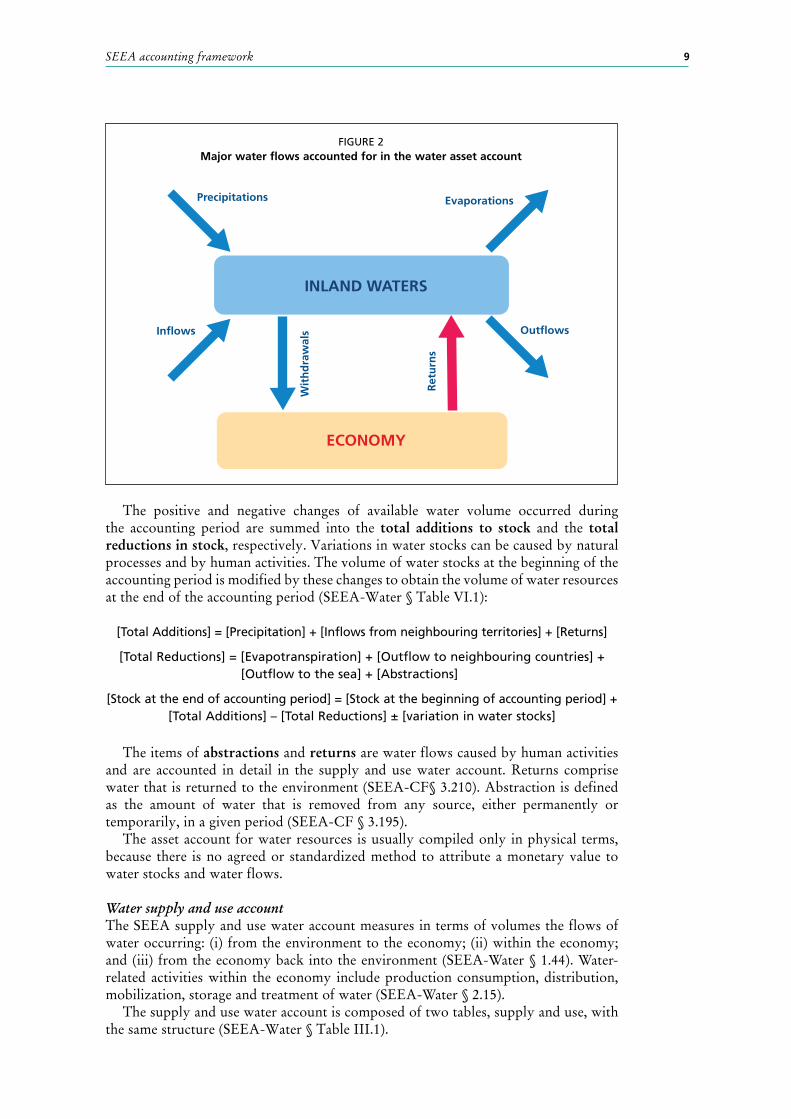
The positive and negative changes of available water volume occurred during
the accounting period are summed into the total additions to stock and the total reductions in stock, respectively. Variations in water stocks can be caused by natural processes and by human activities. The volume of water stocks at the beginning of the accounting period is modified by these changes to obtain the volume of water resources at the end of the accounting period (SEEA-Water § Table VI.1):
[Total Additions] = [Precipitation] + [Inflows from neighbouring territories] + [Returns]
[Total Reductions] = [Evapotranspiration] + [Outflow to neighbouring countries] + [Outflow to the sea] + [Abstractions]
[Stock at the end of accounting period] = [Stock at the beginning of accounting period] + [Total Additions] – [Total Reductions] ± [variation in water stocks]
The items of abstractions and returns are water flows caused by human activities and are accounted in detail in the supply and use water account. Returns comprise water that is returned to the environment (SEEA-CF§ 3.210). Abstraction is defined as the amount of water that is removed from any source, either permanently or temporarily, in a given period (SEEA-CF § 3.195).
The asset account for water resources is usually compiled only in physical terms, because there is no agreed or standardized method to attribute a monetary value to water stocks and water flows.
Water supply and use account The SEEA supply and use water account measures in terms of volumes the flows of water occurring: (i) from the environment to the economy; (ii) within the economy; and (iii) from the economy back into the environment (SEEA-Water § 1.44). Water-related activities within the economy include production consumption, distribution, mobilization, storage and treatment of water (SEEA-Water § 2.15).
The supply and use water account is composed of two tables, supply and use, with the same structure (SEEA-Water § Table III.1).
FIGURE 2Major water flows accounted for in the water asset account
INLAND WATERS
ECONOMY
Inflows
Precipitations Evaporations
Outflows
Retu
rns
Wit
hdra
wal
s

Lessons learned in water accounting: the fisheries and aquaculture perspective in the SEEA framework10
the water supply table describes the types and the sources of water recorded in the country. It shows the water quantities provided by the environment as surface water, groundwater or soil water, and the water quantities that are returned from the economy to the environment;
the water use table shows the water quantities that are abstracted for different economic activities directly from the environment as surface water, groundwater or soil water, and the withdrawal of water that has been treated and is suitable for further use (i.e. reuse).
[Abstraction] = [Return to environment] + [Net addition to the stock in the economy]
[Net addition to the stock in the economy] = [Supply and use balance among economic units] – [Water consumption] + [Accumulation]
The supply and use water account can be compiled in both physical and monetary terms. Water accounting, in monetary terms can be challenging as it needs to describe in monetary terms the use and supply of water-related products, and identify the costs associated with the production of these products, the income generated by them, the investments in hydraulic infrastructure and the cost of maintaining it (SEEA-Water § 1.49).
KEY MESSAGESEEA water asset account and SEEA supply and use water account
• SEEA water asset account describes water flows mainly within the environment and among surface water, groundwater and soil water (i.e. water hydrological cycle).
• SEEA supply and use water account describes water flows mainly within the economy and among different economic units.
FIGURE 3Major water flows accounted for in the supply and use water account
INLAND WATERS
ECONOMYWATER SUPPLY
HOUSEHOLD
SEWERAGE
OTHER INDUSTRIES
Retu
rns
Wit
hdra
wal
s

11SEEA accounting framework
SEEA Experimental Ecosystem Accounting – principlesThe SEEA Experimental Ecosystem Accounting (SEEA-EEA) is a complementary system of the SEEA-CF, aiming to describe a broader role of the environment for human survival, health and well-being. The SEEA-EEA uses the same accounting principles, structures and classification as the SEEA-CF, but aims to provide an assessment of multifunctionality of ecosystems moving beyond the accounting of individual environmental assets. Similarly to the SEEA-CF, the SEEA-EEA considers stocks (ecosystem assets) flows (ecosystem services). Ecosystem assets are first assessed in terms of extent and conditions. Then, ecosystem assets are analysed in their capacity to deliver ecosystem services at a point in time (i.e. expected ecosystem service flows).
The SEEA-EEA promotes a spatial-explicit accounting approach in which the analysis is carried out at multiple nested spatial scales in which the final level of aggregation is eventually the national scale.3
Aquatic ecosystems and ecosystem servicesEcosystems are defined as dynamic complex of plant, animal and micro-organism communities (biotic component) and their non-living environment (abiotic component) interacting as a functional unit (United Nations, 1992). By considering their functional aspect, ecosystems are also defined as the network of interactions among organisms, and between organisms and their environment (Hagen et al., 2012).
Aquatic ecosystems are divided into inland, coastal and marine ecosystems. Inland freshwater ecosystems include river, lakes, wetlands; coastal brackish ecosystems include deltas and estuaries; marine ecosystems include salt marshes, intertidal zones, oceans, coral reefs, seagrass beds, the deep sea, and the sea floor. All these aquatic ecosystems are habitats when considering the species level, but are ecosystems when considering the communities of species that live and interact in these habitats.
Ecosystems vary in size and the boundaries4 of an ecosystem are not always clearly delineated especially among marine ecosystems. In fact, in freshwater ecosystems the demarcation between terrestrial and aquatic ecosystems can help in delineating the boundary of inland ecosystems. The shoreline or the river banks can help to spatially define the boundary of, respectively, a lake or a river. In estuaries and deltas, the boundaries towards the land interior will be more clearly identified than the boundaries towards the sea. In the sea, some benthic structures such as coral reefs or seagrass beds
3 Depending on the size of the country there may be a hierarchy of ecosystem accounting units (EAUs), building from smaller reporting units to the national level. For example, starting from a local administrative unit a hierarchy of EAUs may build to the provincial and then national level. In all cases, a country’s total area will represent the single highest level in a hierarchical EAU structure (SEEA-EEA § 2.66).
4 Boundaries of specific ecosystems are generally drawn on the basis of relative homogeneity of ecosystem characteristics and in terms of having stronger internal functional relations than external ones (SEEA-EEA § 2.47).
KEY MESSAGEWhat are ecosystems?
Ecosystems are ecological systems constituted by a community of living organisms such as plants, animals and microorganism (biotic component) and their environment (abiotic component).
Aquatic ecosystems are divided into:• inland ecosystems (lakes, rivers, wetlands);• coastal ecosystems (deltas, estuaries);• marine ecosystems (salt marshes, intertidal zones, oceans, coral reefs, seagrass
beds, the deep sea, and the sea floor).
Lessons learned in water accounting: the fisheries and aquaculture perspective in the SEEA framework12
can help identify the corresponding ecosystem extent. In these cases, the ecosystem boundaries are likely to be larger than the area covered by coral reefs or seagrass beds alone. In fact, the ecosystem should include the area where all organisms of the community live and where all interactions within the community occur. Therefore, the spatial demarcation of the ecosystem boundary should be large enough to include also the distribution of mobile species. The delineation of ecosystem boundaries, in the less obvious cases, requires the definition of some ad hoc criteria.
Ecosystem services are the contributions of ecosystems to benefits used in economic and other human activity. The SEEA-EEA adopts the classification of ecosystem services provided by the Common International Classification for Ecosystem Services (CICES) in three broad categories:
• Provisioning ecosystem services reflect contributions to the benefits produced by or in the ecosystem, which include food, water, raw materials, pharmaceuticals and traditional medicines, fuel and other types of energy extracted from ecosystems.5
• Regulating ecosystem services result from the capacity of ecosystems to regulate climate, hydrological and biochemical cycles, earth surface processes, and a variety of biological processes.6
• Cultural ecosystem services relate to the intellectual and symbolic benefits that people obtain from ecosystems through recreation, knowledge development, relaxation and spiritual reflection.7
When considering the role of water for human well-being, water constitutes a provisioning ecosystem service supplying drinking-water, water for domestic use, for sanitation and hygiene but also water necessary for other provisioning ecosystem services such as crops, fibre, non-timber products, timber, and livestock, energy supplied by hydropower generation as well as fish and other aquatic organisms. Water is part of several regulating ecosystem services related to water flow regulation, flood control, water purification, waste treatment and maintenance of the water cycle (Sukhdev et al., 2010).
Water also provides many cultural ecosystem services related not only to water-based recreational activities, but also to the fact that water supports traditional activities such as fisheries and lifestyles. Water is an important feature of the landscape
5 SEEA-EEA § 3.4, i.6 SEEA-EEA § 3.4, ii.7 SEEA-EEA § 3.4, iii.
KEY MESSAGEWhat are ecosystem services?
Ecosystem services are the contributions of ecosystems to benefits used in economic and other human activities. They can be divided into three categories:
• Provisioning ecosystem services reflect contributions to the benefits produced by or in the ecosystem, which include food, water, raw materials, pharmaceuticals and traditional medicines, fuel and other types of energy extracted from ecosystems.
• Regulating ecosystem services result from the capacity of ecosystems to regulate climate, hydrological and biochemical cycles, earth surface processes, and a variety of biological processes.
• Cultural ecosystem services relate to the intellectual and symbolic benefits that people obtain from ecosystems through recreation, knowledge development, relaxation and spiritual reflection.

13SEEA accounting framework
that contributes to aesthetic enjoyment, cognitive and spiritual reflection. Water can have a symbolic importance, and in many societies has spiritual and religious values. Water played a role in human evolution and has shaped part of the world cultural heritage (Willems and van Schaik, 2015).

15
3. Water use by the fisheries sector
WATER AS A VITAL RESOURCE FOR THE FISHERIES SECTORWater is critical and intimately linked with socio-economic development. Water is essential for meeting human needs, to support the activities of all economic sectors and to ensure the integrity and functioning of ecosystems.
Within the hydrological cycle, water circulates in different compartments (air, soil, water) and has different water residence times in the each of them. Water evaporating mainly from ocean surfaces creates clouds, and later returns to the ground through precipitation. Once water reaches the ground, it returns to the atmosphere through transpiration and evaporation, or slowly penetrates the ground and accumulates, becoming groundwater. Water that is accumulated on the earth’s surface is the runoff that, together with groundwater, feeds lakes, rivers and streams that carry water back to the ocean. The water that accumulates on the surface of the earth is usually stable enough to create fish habitats.
This dual value of surface water, as water reservoir and fish habitat, is key to understanding the perspective of the fisheries sector in water accounting. The fisheries sector is strictly dependent on the availability and access to surface waters, (such as lakes, rivers reservoirs and coastal lagoons) as well as to the ocean itself. For a great part, surface waters constitute fish habitats and are used as fishing areas, they can be directly used for cage and pen aquaculture, and they are sites where wild seed (i.e. fry or juveniles) can be collected for raising in aquaculture systems.
Moreover, the fisheries sector is significantly affected by the seasonal variation (enlargement or contraction) in the area occupied by surface waters. Intense seasonal precipitations (rainy season) can cause an enlargement of the area occupied by surface waters (rivers, lakes, swamps or water holdings). Overflowing of water from river banks creates seasonally flooded areas adjacent to the river network (i.e. seasonally flooded areas). These seasonally flooded areas are highly productive, as the flooding usually accelerates decomposition of biomass and organic materials that lead to nutrient enrichment of water. Seasonally flooded areas also serve as spawning and nursery grounds for many species, essential for reproduction of fish stocks. Therefore, seasonally flooded areas are often fishing areas with high yields.
However, prolonged droughts can cause increased evaporation of shallow lakes and swamps with consequent contraction of their area. In fact, the reduction in the area of inland waters often alters different parameters of fish habitats with negative potential impacts on fish stocks. In addition, the decreased water depths of inland waterbodies may hamper fishing vessel operations and increase competition among fishers in fishing areas of reduced area.
KEY MESSAGEImportance of surface water for the fisheries sector
• The inland fisheries sector is dependent on the availability of and access to surface water.
• The areas of surface water (and their seasonal variation) have a significant impact on the inland fisheries sector.

Lessons learned in water accounting: the fisheries and aquaculture perspective in the SEEA framework16
IN-STREAM AND OFF-STREAM WATER USE BY THE FISHERIES SECTORWater use is a general non-specific term that describes any action through which water provides a service (Kohli, Frenken and Spottorno, 2010). Water use can be classed as off-stream and in-stream:
• Off-stream water use takes the water out of the water source, reducing the amount of available water left on-site.
• In-stream water use / on-site water use either does not remove water from its source or water is immediately returned with little or no alteration.
Some activities, such as navigation, hydroelectric power generation, and recreational activities on water, have an in-stream water use as they occur on-site. Other types of activities such as crop production, municipal water use and sanitation, and industrial water use, have an off-stream / off-site water uses, because they need to abstract water and use it in other locations:
• Off-stream water use is usually measured in terms of the water volumes abstracted and consumed and returned to the environment.
• In-stream water use is usually measured in terms of the water area required for a given purpose. By definition, in-stream water use has no water withdrawal, no water consumption and no water return.
The fisheries sector is comprised of capture fisheries and aquaculture activities and is characterized by both in-stream and off-stream water use. Capture fisheries have an in-stream water use as fishing uses water on-site. Fishing does not abstract and does not consume water but is indissolubly dependent on the availability and access to surface waters as fish habitats. Fishing activities are also significantly affected by the seasonal variation of inland waters.
TABLE 4In-stream and off-stream water use within the fisheries sector
Characteristics Fisheries sector
ACTIVITY Capture fisheries Aquaculture
WATER USE In-stream In-stream Off-stream
METHOD Any types of fishing
Cage (including on-bottom and off-bottom) Pond
Pen Indoor tank
Recirculating aquaculture systems
Vertical raceways Horizontal raceways
Aquaculture can have both in-stream and off-stream water use according to the aquaculture methods. Cages and pens are considered to have an in-stream water use, while ponds, tanks and recirculating systems have an off-stream water use. For pond culture, water is abstracted to fill the pond, to maintain the water level and compensate evaporation and seepage losses, and to maintain suitable values of temperature and other water parameters. Water is used in the same way for indoor tanks but the amount of water needed to replace evaporation is usually lower than for outdoor pond. Recirculating aquaculture systems (RAS) use indoor tanks in which water circulates in a closed loop so that water is (partially) reused after undergoing treatment. Thus, an initial water withdrawal is needed as well as limited water addition during the production cycle.
In raceways, water flows through artificial tanks. In horizontal raceways, water flows in one end of the device and out at the other. In vertical raceways, water flows in at the top and out at the bottom. Raceways can be built as flotation frames and, therefore, they have an in-stream water use or can be artificial structures where water is diverted and a flow is created to mimic a river runoff. In this way, raceways are considered to have an off-stream water use.

17Water use by the fisheries sector
Although the in-stream water use of the fisheries sector does not require any abstraction or cause any reduction of available water when used, this does not mean that these activities of the fisheries sector do not need water. In the fisheries sector the amount of water needed by in-stream water use activities can be identified by the water flow, often called environmental water flow that ensures the conservation of suitable fish habitats.
Environmental water flow is the water regime provided within a river, wetland or coastal zone to maintain ecosystems and their benefits where there are competing water uses and where flows are regulated (Dyson et al., 2003).
The environmental water flow should be adequate to maintain both existing surface waters and groundwater aquifers. The amount required for this is watershed-specific and often differs among different locations within the same watershed. Moreover, the amount of water needed to sustain freshwater ecosystems will be different between high-flow and low-flow periods; therefore, the environmental water flow for the fisheries sector should be the flow that ensure the survival and reproduction of fish species and maintenance of aquatic ecosystems (see also Chapter 5).
WATER CONSUMPTION BY THE FISHERIES SECTORIn-stream water use does not consume water, while off-stream water use does:
Water consumption is defined as the proportion of freshwater water withdrawal that is no longer available because it has evaporated, been transpired by plants, been incorporated into products or crops, been consumed by people or livestock, or otherwise removed from the immediate water environment (Vickers, 2001).
From a hydrological perspective, the amount of water that evaporates or evapotranspirates is considered as water “consumed” because the amount of evaporated water can precipitate outside the watershed from which it has evaporated. Water consumption has direct and indirect components. In the fisheries sector, direct water consumption is related to water that evaporates during fish production and water accumulated in fish biomass. Indirect water consumption is water that is consumed in supplementary processes such as feed production (Table 5).
TABLE 5Direct and indirect water consumption within the fisheries sector
Water is Direct water consumption Indirect water consumption
Accumulated inFish biomass
[*]Input materials, e.g. feed, wild seed
[*]
Lost throughEvaporation occurring during
aquaculture [**]
Production of inputs materials[***]
Notes: Amount of water consumption is considered:
* negligible; ** variable according to the aquaculture method, location and area of aquaculture facilities; *** variable according to the use and feed formulation and area of required crop fields for plant ingredients.
The definition of water consumption is strictly related to the use of water for human needs and activities. For this reason, the water that evaporates from inland waters or from the sea is not considered as water consumed but as part of the natural water cycle. However, if an artificial pond is built for aquaculture purposes, the water that evaporates through such human-made surface water is considered consumed because it is additional to the occurring natural processes.
Similarly, a hydroelectric plant that uses the river rapids to produce electricity has a water in-stream use and has no water consumption. However, if the hydroelectric plant requires a dam for the storage of large quantities of water to create the water drop
Lessons learned in water accounting: the fisheries and aquaculture perspective in the SEEA framework18
suitable for power generation, the amount of water that evaporates from the artificial reservoir is accounted as water consumed.
Fishing activities have no water consumption due to evaporation as they do not cause additional evaporation to that would occur in the natural water cycle. The water that is accumulated in fish biomass is considered negligible (Zimmer and Renault, 2003; Brummett, 2006). The water lost by evaporation is considered zero in cage and pen aquaculture, while the rate of evaporation in other aquaculture systems varies according to culture methods, climatic conditions and climate-smart measures to reduce evaporation. Evaporation is usually high in outdoor open ponds, especially in tropical and in desert areas. It decreases substantially if outdoor ponds have a cover. Evaporation is much less in indoor tanks and can be almost zero for RAS.
Indirect water consumption refers to water accumulated in input materials and water lost through the production of input materials. Aquaculture feed formulation varies to meet the protein and essential amino acids requirements of the farmed species and can include ingredients of plant and animal origin in different proportions. For example, filter-feeding finfish such as silver carp, bighead carp, catla and rohu do not usually require aquaculture feeds; herbivorous/omnivorous finfish such as grass carp, common carp, other cyprinids, tilapias, milkfish require about 5 percent of fishmeal in their feeds; omnivorous/scavenging crustaceans such as freshwater prawns, crabs and crayfish require between 15 and 20 percent of fishmeal in their feeds; while carnivorous finfish such as seabass, seabream, eels, amberjack require between 20 and 40 percent of fishmeal in their feeds (Huntington and Hasan, 2009). The water that is accumulated into the fish biomass of fishmeal and plant ingredients is considered negligible, while the water that evaporates from irrigated fields where crops used in aquaculture feeds are grown is an additional component of water consumption. In the same climatic conditions and geographic site, the coefficient of evapotranspiration of shallow standing waters is similar that of an irrigated crop field with water surplus (Allen et al., 1998). However, the area of outdoor aquaculture facilities is usually very small compared with the area of irrigated crop fields where plant ingredients are grown. In conclusion, aquaculture can record different levels of water consumption according to the aquaculture method, location and area of the culture facilities, as well as use aquaculture feeds formulation and, consequently, the extent of crop fields required for the production of plant ingredients in aquaculture feeds.
FROM WATER CONSUMPTION TO WATER FOOTPRINTIt is important to clarify the differences between water consumption and water footprint (Hoekstra, 2003).
Water footprint includes four components: (i) water that evaporates; (ii) water that is incorporated into product; (iii) water that is not returned to the same area where it
KEY MESSAGEWater consumption
Water consumption refers to the proportion of freshwater withdrawal that is not returned to surface waters after use, becomes unavailable locally in the short term as it is lost in evaporation, or is incorporated into the finished product, by-products or solid waste.
• Capture fisheries has no or not significant water consumption.• Aquaculture has different levels of water consumption according to the
aquaculture method, location of facilities, use and formulation of aquaculture feeds, and corresponding area of cultivated crop fields.
19Water use by the fisheries sector
was withdrawn; and (iv) water that is needed to dilute pollutant concentration to water quality standards.
Water consumption covers only the first two components of water footprint (i and ii).
When assessing the volume of water that is not returned to the same area, water footprint goes beyond hydrological water accounting including also the trade of “virtual water”:
Virtual water is the volume of water embedded or exogenous water consumed in the production of a product and is considered to gain or lose according to international trade of that product (Hoekstra, 2003).
This is an important but often a hidden dimension in national water budgets. In the other words, the water footprint assesses the amount of waters utilized to produce whole products consumed within the country, including the water use within the country (internal water footprint) and water use in other countries (external water footprint).
Water footprint also looks into the difference in quality between abstracted water and returned water. Even if exactly the same volume of water is returned to the environment, its quality is likely to be altered in some key physical-chemical parameters, such as temperature, dissolved oxygen concentration and other dissolved materials (e.g. pollutants). The water footprint seeks to express such changes in water quality in quantitative terms by assessing the amount of water needed to dilute pollutant concentration to water quality standards.
Another important concept advocated by the water footprint approach is the distinction of the water sources among blue water (surface and groundwater), green water (rainwater) and grey water (polluted water). Types and extents of water conflicts among sectors vary according to the different water sources used. Therefore, the distinction among different water sources remains crucial for water accounting purposes. Comparison of water use among different sectorsWater use differs greatly among sectors. Each sector tends to have a preferential use of water from certain compartments such as surface water, seawater, rainwater and groundwater. In water shortage situations, water required for activities of a sector and usually supplied from a preferential water compartment can be integrated or replaced by water available in less preferable compartments (Table 6).
For example, irrigated crop production is significantly affected by the moisture of soil water. The soil is a compartment in which water is retained for a relatively short time. Crop production can supply the water requirement by abstracting water from different compartments (e.g. surface water, rainwater, groundwater or desalinated seawater). The same applies for livestock production, water for domestic use, and water for industrial use, as water that supports all these sectors can be abstracted from several
KEY MESSAGEWhy water footprint differs from water consumption
Water footprint:• Considers the decrease in water quantity (consumption) and in water quality
(pollution).• Assesses both water use within the country (internal water footprint) and
water use in other countries (external water footprint) connected to national production and consumption patterns.
• Distinguishes three types of freshwater consumption: blue water (surface and groundwater), green water (rainwater) and grey water (polluted water).
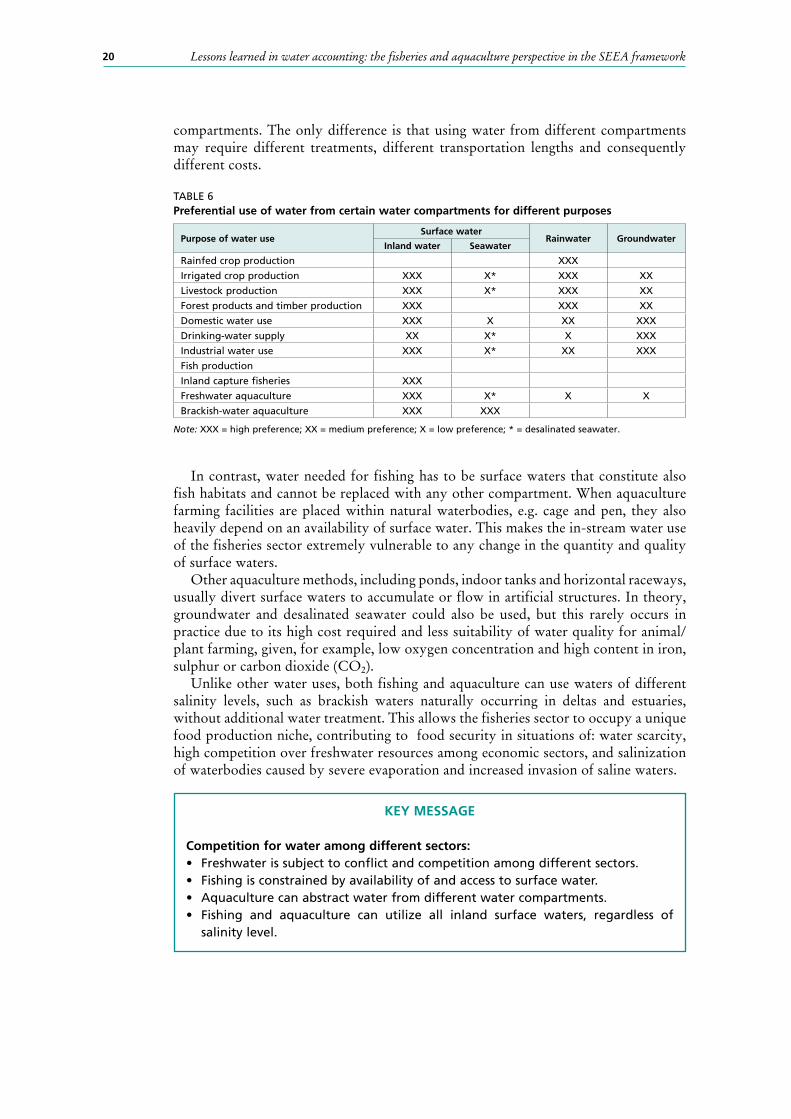
Lessons learned in water accounting: the fisheries and aquaculture perspective in the SEEA framework20
compartments. The only difference is that using water from different compartments may require different treatments, different transportation lengths and consequently different costs.
TABLE 6Preferential use of water from certain water compartments for different purposes
Purpose of water useSurface water
Rainwater GroundwaterInland water Seawater
Rainfed crop production XXXIrrigated crop production XXX X* XXX XXLivestock production XXX X* XXX XXForest products and timber production XXX XXX XXDomestic water use XXX X XX XXXDrinking-water supply XX X* X XXXIndustrial water use XXX X* XX XXXFish productionInland capture fisheries XXXFreshwater aquaculture XXX X* X XBrackish-water aquaculture XXX XXX
Note: XXX = high preference; XX = medium preference; X = low preference; * = desalinated seawater.
In contrast, water needed for fishing has to be surface waters that constitute also fish habitats and cannot be replaced with any other compartment. When aquaculture farming facilities are placed within natural waterbodies, e.g. cage and pen, they also heavily depend on an availability of surface water. This makes the in-stream water use of the fisheries sector extremely vulnerable to any change in the quantity and quality of surface waters.
Other aquaculture methods, including ponds, indoor tanks and horizontal raceways, usually divert surface waters to accumulate or flow in artificial structures. In theory, groundwater and desalinated seawater could also be used, but this rarely occurs in practice due to its high cost required and less suitability of water quality for animal/plant farming, given, for example, low oxygen concentration and high content in iron, sulphur or carbon dioxide (CO2).
Unlike other water uses, both fishing and aquaculture can use waters of different salinity levels, such as brackish waters naturally occurring in deltas and estuaries, without additional water treatment. This allows the fisheries sector to occupy a unique food production niche, contributing to food security in situations of: water scarcity, high competition over freshwater resources among economic sectors, and salinization of waterbodies caused by severe evaporation and increased invasion of saline waters.
KEY MESSAGE
Competition for water among different sectors:• Freshwater is subject to conflict and competition among different sectors.• Fishing is constrained by availability of and access to surface water.• Aquaculture can abstract water from different water compartments.• Fishing and aquaculture can utilize all inland surface waters, regardless of
salinity level.
21Water use by the fisheries sector
WATER VOLUME AND WATER AREA AS MEASURES FOR WATER ACCOUNTING In water accounting, two types of measure are generally used: water area and water volume, measuring respectively the extent of still water and water flows. These two measures are different in scope and provide a slightly different perspective on water accounting. Water area can measure only the extent of water stocks, while water volume can measure both water stocks and water flow. Usually, water volume is used for the assessment of freshwater resources or for freshwater and brackish-water resources (without distinction), while water area is used for the assessment of freshwater, brackish-water and saline-water resources.
Water volume is used to describe the movement of water among compartments (e.g. precipitation, evaporation, runoff), the volume of water abstracted and later returned to the environment as well as the amount of water in terms of stocks that accumulates on the surface (i.e. inland waters) or underground (i.e. aquifers). Due to the high level of complexity of water movements, hydrological models tend to restrict their scope to the analysis of water flows and do not link dynamically the movement of water (i.e. water flows) to the accumulation of water on land (i.e. water stock). As a result, hydrological models do not usually assess the seasonal variation (enlargement and contraction) in the extent of surface waters caused by variations in water flows.
Water area is actually a simplified measure of existing water volume, but has an advantage of unequivocally identifying water that accumulates on the surface of earth. Water areas can be easily used to assess the extent of permanent inland waters (lakes, rivers, reservoirs, lagoons, etc.) and seasonally flooded areas.
There are several reasons why water area is a measure commonly used by the fisheries sector. Fish habitats are often described better by water area than water volume. In fact, tropical finfish are often adapted to live in shallow waters, and even in deep lakes they rarely colonize waters below the photic zone (Kapetsky and Barg, undated). Seasonally flooded areas that are often quite shallow in depth can be well represented by water areas. Different brackish- and coastal-water environments, such as lagoons, deltas, estuaries, which represent important water resources for the fisheries sector, can be easily distinguished by water area. In summary, water area is usually more effective than water volume in identifying those sites that provide important fish habitats and, consequently, areas targeted by the fisheries sector.
Information on the extent and use of “water areas” is often collected as part of land cover and land use assessments. Therefore, water area can be a useful measure in landscape management with multiple sectors involved, management of terrestrial and aquatic ecosystems and their interactions.

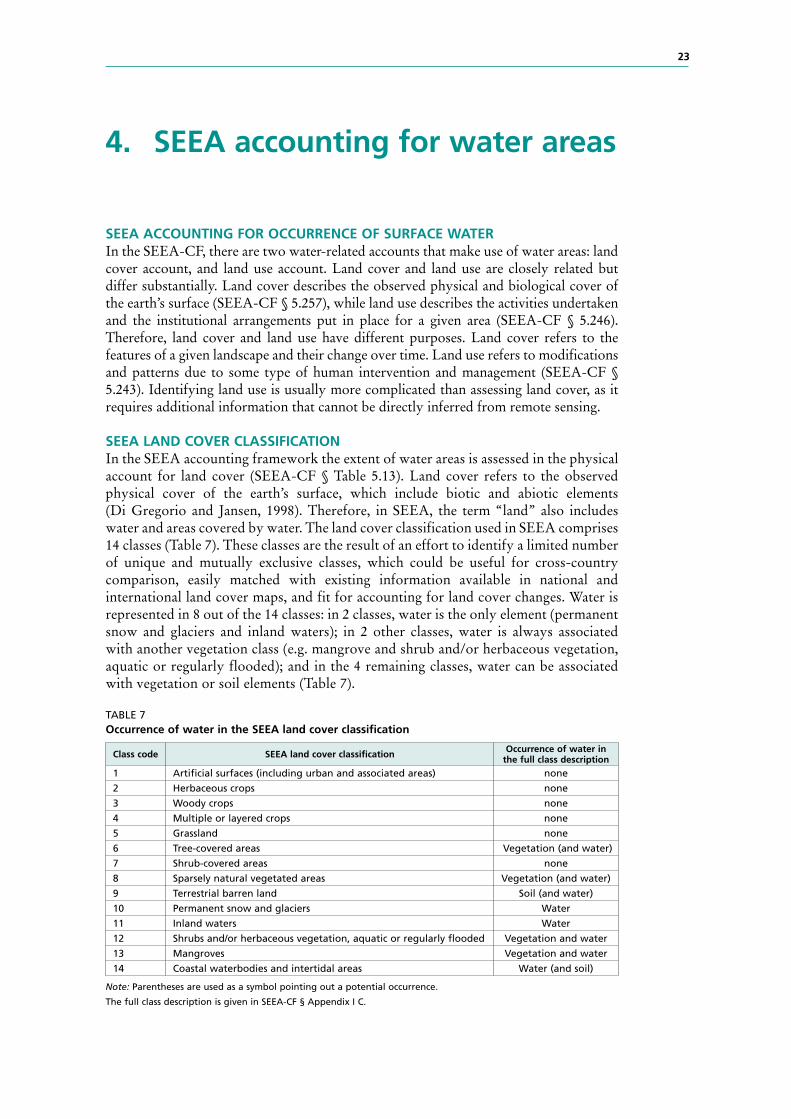
23
4. SEEA accounting for water areas
SEEA ACCOUNTING FOR OCCURRENCE OF SURFACE WATERIn the SEEA-CF, there are two water-related accounts that make use of water areas: land cover account, and land use account. Land cover and land use are closely related but differ substantially. Land cover describes the observed physical and biological cover of the earth’s surface (SEEA-CF § 5.257), while land use describes the activities undertaken and the institutional arrangements put in place for a given area (SEEA-CF § 5.246). Therefore, land cover and land use have different purposes. Land cover refers to the features of a given landscape and their change over time. Land use refers to modifications and patterns due to some type of human intervention and management (SEEA-CF § 5.243). Identifying land use is usually more complicated than assessing land cover, as it requires additional information that cannot be directly inferred from remote sensing.
SEEA LAND COVER CLASSIFICATIONIn the SEEA accounting framework the extent of water areas is assessed in the physical account for land cover (SEEA-CF § Table 5.13). Land cover refers to the observed physical cover of the earth’s surface, which include biotic and abiotic elements (Di Gregorio and Jansen, 1998). Therefore, in SEEA, the term “land” also includes water and areas covered by water. The land cover classification used in SEEA comprises 14 classes (Table 7). These classes are the result of an effort to identify a limited number of unique and mutually exclusive classes, which could be useful for cross-country comparison, easily matched with existing information available in national and international land cover maps, and fit for accounting for land cover changes. Water is represented in 8 out of the 14 classes: in 2 classes, water is the only element (permanent snow and glaciers and inland waters); in 2 other classes, water is always associated with another vegetation class (e.g. mangrove and shrub and/or herbaceous vegetation, aquatic or regularly flooded); and in the 4 remaining classes, water can be associated with vegetation or soil elements (Table 7).
TABLE 7Occurrence of water in the SEEA land cover classification
Class code SEEA land cover classification Occurrence of water in the full class description
1 Artificial surfaces (including urban and associated areas) none2 Herbaceous crops none3 Woody crops none4 Multiple or layered crops none5 Grassland none6 Tree-covered areas Vegetation (and water)7 Shrub-covered areas none8 Sparsely natural vegetated areas Vegetation (and water)9 Terrestrial barren land Soil (and water)10 Permanent snow and glaciers Water11 Inland waters Water12 Shrubs and/or herbaceous vegetation, aquatic or regularly flooded Vegetation and water13 Mangroves Vegetation and water14 Coastal waterbodies and intertidal areas Water (and soil)
Note: Parentheses are used as a symbol pointing out a potential occurrence.
The full class description is given in SEEA-CF § Appendix I C.

Lessons learned in water accounting: the fisheries and aquaculture perspective in the SEEA framework24
In fact, the SEEA classification is designed according to the Land Cover Classification System (LCCS), based on the Land Cover Meta Language (LCML), an International Organization for Standardization ISO standard (Di Gregorio, 2005, forthcoming). The use of LCML ensures that the classes are identified by standardized elements.
Although the SEEA land cover classification consists of a limited number of aggregated classes, the user is given the possibility to break down further these major 14 classes into subclasses. The internal standardized composition of each class based on LCML allows for the systematic definition of lower-level categories.
The class “Inland waters” is constituted exclusively by water.8 However, within this LCCS class, there is the possibility to identify characteristics such as whether inland waters are “natural” or “artificial”, and within each subgroup of natural or artificial waters, there are other classifiers that specify other properties such as:
• physical status of water if the water is constituted by water, snow or ice;• water dynamic if the water is flowing (such as for rivers and streams) or standing
(such as ponds, reservoirs and lakes);• water depth if the water is shallow, medium or deep; • water salinity9 if the water is fresh, slightly saline, moderately saline, very saline,
brine.Therefore, the LCML can be used as a complementary tool and provide useful
guidance on different land cover types contained in each class, which allows for consistent breakdown into different subclasses. In particular, a breakdown of the class “Inland waters” into of lakes, rivers and reservoirs would allow information on water areas to be matched with information on their corresponding water flows reported in the SEEA water asset account (SEEA-CF § Table 5.25).
“Permanent snow and glaciers” is another class constituted exclusively by water.10 The properties that characterize this class are the “physical status” of water and the “persistence” of the snow and ice. This class is useful for monitoring reductions in the extent of glaciers as an effect of climate change.
The classes “Terrestrial barren soil”11 and “Coastal waterbodies and intertidal areas”,12 both of which are constituted by areas that can be flooded respectively by freshwater and brackish water, can be used to identify lakes shores and river banks versus coastal flats and beaches along the coast of an ocean or sea.
8 According to the criteria of LCCS, in this type of class, water should cover at least 80 percent of the surface of the total area considered (FAO, 2005a).
9 Water salinity is described according to the concentration of total dissolved solids (TDS), expressed in parts per million (ppm), giving the following classification of Cowardin et al. (1979):
- fresh: less than 1 000 ppm TDS;- slightly saline: 1 000 – 3 000 ppm TDS;- moderately saline: 3 000 – 10 000 ppm TDS;- very saline: 10 000 – 35 000 ppm TDS;- brine: more than 35 000 ppm TDS (= water saturated or almost so with salt).
10 Permanent snow and glaciers: this class includes any geographical area covered by snow or glaciers persistently for ten months or more (SEEA-CF § Appendix I C).
11 Terrestrial barren soil: this class includes any geographical area dominated by natural abiotic surfaces (bare soil, sand, rocks, etc.) where the natural vegetation is absent or almost absent (covers less than 2 percent). The class includes areas regularly flooded by inland water (lake shores, river banks, salt flats, etc.) (SEEA-CF § Appendix I C).
12 Coastal waterbodies and intertidal areas: this class is defined on the basis of geographical features of the land in relation to the sea (coastal waterbodies, i.e. lagoons and estuaries) and abiotic surfaces subject to water persistence (intertidal areas, i.e. coastal flats and coral reefs) (SEEA-CF § Appendix I C).
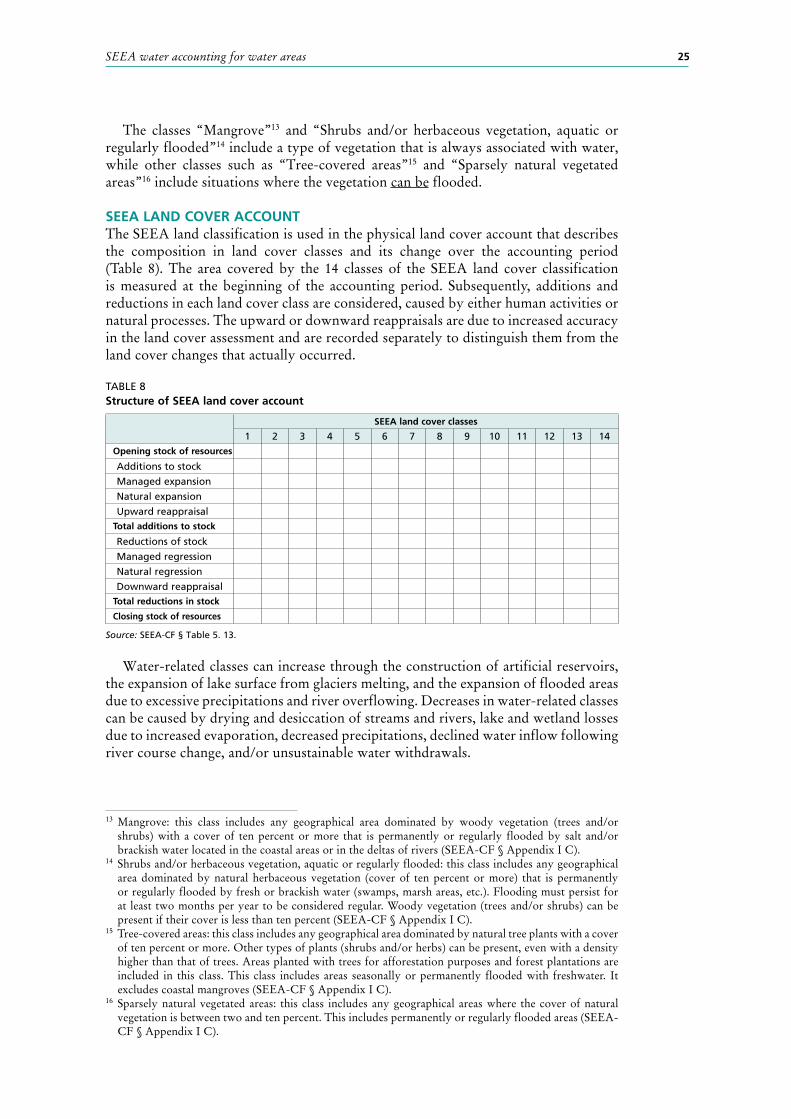
25SEEA water accounting for water areas
The classes “Mangrove”13 and “Shrubs and/or herbaceous vegetation, aquatic or regularly flooded”14 include a type of vegetation that is always associated with water, while other classes such as “Tree-covered areas”15 and “Sparsely natural vegetated areas”16 include situations where the vegetation can be flooded.
SEEA LAND COVER ACCOUNTThe SEEA land classification is used in the physical land cover account that describes the composition in land cover classes and its change over the accounting period (Table 8). The area covered by the 14 classes of the SEEA land cover classification is measured at the beginning of the accounting period. Subsequently, additions and reductions in each land cover class are considered, caused by either human activities or natural processes. The upward or downward reappraisals are due to increased accuracy in the land cover assessment and are recorded separately to distinguish them from the land cover changes that actually occurred.
TABLE 8Structure of SEEA land cover account
SEEA land cover classes
1 2 3 4 5 6 7 8 9 10 11 12 13 14Opening stock of resources
Additions to stockManaged expansionNatural expansionUpward reappraisal
Total additions to stock
Reductions of stockManaged regressionNatural regressionDownward reappraisal
Total reductions in stock
Closing stock of resources
Source: SEEA-CF § Table 5. 13.
Water-related classes can increase through the construction of artificial reservoirs, the expansion of lake surface from glaciers melting, and the expansion of flooded areas due to excessive precipitations and river overflowing. Decreases in water-related classes can be caused by drying and desiccation of streams and rivers, lake and wetland losses due to increased evaporation, decreased precipitations, declined water inflow following river course change, and/or unsustainable water withdrawals.
13 Mangrove: this class includes any geographical area dominated by woody vegetation (trees and/or shrubs) with a cover of ten percent or more that is permanently or regularly flooded by salt and/or brackish water located in the coastal areas or in the deltas of rivers (SEEA-CF § Appendix I C).
14 Shrubs and/or herbaceous vegetation, aquatic or regularly flooded: this class includes any geographical area dominated by natural herbaceous vegetation (cover of ten percent or more) that is permanently or regularly flooded by fresh or brackish water (swamps, marsh areas, etc.). Flooding must persist for at least two months per year to be considered regular. Woody vegetation (trees and/or shrubs) can be present if their cover is less than ten percent (SEEA-CF § Appendix I C).
15 Tree-covered areas: this class includes any geographical area dominated by natural tree plants with a cover of ten percent or more. Other types of plants (shrubs and/or herbs) can be present, even with a density higher than that of trees. Areas planted with trees for afforestation purposes and forest plantations are included in this class. This class includes areas seasonally or permanently flooded with freshwater. It excludes coastal mangroves (SEEA-CF § Appendix I C).
16 Sparsely natural vegetated areas: this class includes any geographical areas where the cover of natural vegetation is between two and ten percent. This includes permanently or regularly flooded areas (SEEA-CF § Appendix I C).
Lessons learned in water accounting: the fisheries and aquaculture perspective in the SEEA framework26
GLOBALLY AVAILABLE DATA FOR ACCOUNT COMPILATIONThe SEEA land cover classification was recently implemented in the FAO Global Land Cover-SHARE (GLC-SHARE) of 2014. The GLC-SHARE integrates the best available land cover data at subnational, national, and regional and global level into one single harmonized database based on international standards (Latham et al., 2014). GLC-SHARE uses 11 classes of the SEEA land cover legend as it aggregates herbaceous, woody and multiple or layered crops into one class and excludes the class of “Coastal waterbodies and inter-tidal areas”. A land cover map with the SEEA land cover classification is available17 for the entire globe with a resolution of 30 arc-second (about 1 × 1 km).
The FAO initiative of SEEA-Agriculture is currently analysing for all countries worldwide the temporal series (2001–2012) of the land cover derived from remote sensing using the Global Mosaics of the standard Moderate Resolution Imaging Spectroradiometer (MODIS) (Channan, Collins and Emanuel, 2014; Friedl et al., 2010). The land cover derived from MODIS uses legend of the International Global Biosphere Programme (IGBP). However, the SEEA-Agriculture plans to reconcile the IGBP legend with the SEEA legend in order to obtain a temporal series of the physical land cover account and land cover changes.
In addition, a joint initiative of the Joint Research Centre (JRC) and Google Earth Engine team will shortly release global maps on depicting the extent of surface waters and their seasonality. The database has been assembled by photointerpretation of Landsat images from 1985 and 2015, and maps will have a resolution of 30 m (Pekel et al., 2015).
ADDITIONAL CONSIDERATIONS AND SUGGESTIONSExtent of water areas in land cover mapObtaining a fair representation of the extent of water to be used in a physical land cover account is not straightforward. The identification of water areas is dependent on the land cover legend used, on the interpretation and acquisition of information from satellite images, and on the resolution of the land cover map. Some of key challenges are explained below.
Land cover legendLand cover maps aim to depict the landscape features and type of vegetation. Although water is part of the landscape, most land cover maps focus on physical terrestrial characteristics. Therefore, it is quite common to have all types of surface waters aggregated into one single land cover class named “inland waters” or “waterbodies”, which unless built using the LCML cannot be split into subclasses.
From a fisheries perspective, the separation between permanently flooded areas and regularly flooded areas is crucial to distinguishing water areas that can be permanent or seasonal fishing grounds. Moreover, the seasonally flooded areas are crucial for the reproduction of many migratory fish species and the regeneration of fish stocks. Therefore, the identification and the assessment of the extent of seasonally flooded areas are important for integrated spatial planning, which includes also the water requirements of the fisheries sector.
In principle, the SEEA classification allows for further breakdown of classes that have a water element into subclasses with distinction of “water persistence”. SEEA provides a good coverage of freshwater and brackish-water environments and also of environments that can be permanently or regularly flooded. By using the identified 14 classes, the SEEA classification does not always separate permanently flooded areas (water persistence =
17 GLC-SHARE is available at www.glcn.org/databases/lc_glcshare_en.jsp

27SEEA water accounting for water areas
12 months) from regularly flooded areas18 (2 months ≤ water persistence < 12 months). In fact, the classes “Tree-covered areas”, “Shrubs and/or herbaceous vegetation, aquatic or regularly flooded”, and “Sparsely natural vegetated areas” include areas both regularly and permanently flooded. However, the distinction between seasonally versus permanently flooded areas in a land cover map can be labour intensive as it requires the photointerpretation of satellite images at different points in time.
Interpretation of satellite imagesEdge between water and wet vegetated areasIn land cover mapping, a critical issue in the interpretation of satellite images regards the delineation of the edge between water and land. When using the near-infrared radiation region of the electromagnetic spectrum, land appears much brighter than water because water strongly absorbs this radiation, whereas vegetated areas appear bright due to their relatively high reflectance. For this reason, in the case of shallow waters and marshes covered by vegetation or floating vegetation, it is not easy to delineate the edge between water and wet vegetated areas.
Linear feature of the river networkObtaining the extent of surface areas for rivers is particularly challenging because of their linear features and the fact that river width changes throughout its course from an initially small stream through connections to other rivers and finally into a delta/estuary. In land cover maps, the river network is usually very fragmented as rivers tend to be represented only where they have the major width. In fact, river networks are usually mapped using linear feature and are rarely integrated in land cover maps.
In order to purposely integrate rivers into an assessment of the extent of inland waters, a high resolution map depicting the river network is necessary. Then, the map with linear features of rivers is transformed into a grid. If the river network has associated information on the order of rivers – defined according to their increasing position in the hierarchy of tributaries (Horton, 1947), then different widths can be attributed to different river orders, so that a river with rank 1 will have a width minor than rivers of rank 2, and so on. An appropriate cell size must be chosen to allow a good representation and continuity of the river network in a grid format. The river grid can be overlaid on the existing land cover map, and the area occupied by rivers, lakes, coastal waterbodies and other terrestrial land cover classes can be computed from such integrated GIS layers.
If the integration of the river network on the land cover map is carried out at the watershed level, then the calibration of the average width of different orders of rivers can be based on the characteristics of the river network within the watershed. Where the integration of the river network is carried out at the national level, the approximation caused by using average river widths increases.
However, this integration of rivers into a land cover map will only be useful to provide a rough modelled estimates of the extent of rivers to be added to the SEEA class of “Inland waters”. Such a modelled estimate of river extent is static, and does not describe an eventual natural or managed expansion/regression of river beds, and therefore can only be used to assess water stocks but not their enlargement or contractions.
The sparse occurrence or large extent of inland waterbodies and artificial reservoirsInland waterbodies and artificial reservoirs often occur in a rather scattered spatial pattern and are embedded in other more continuous land cover types, such as grassland, forest and agricultural land. Therefore, their detection requires adequate map resolution; otherwise, their occurrence will not be reported in the land cover map.
18 Flooding must persist for at least two months per year to be considered regular (SEEA-CF § Appendix I C).
Lessons learned in water accounting: the fisheries and aquaculture perspective in the SEEA framework28
For this reason, global land cover maps often do not provide a good representation of small scattered waterbodies.
Inland waterbodies can be totally omitted from land cover maps, when the extent of inland waterbodies largely exceeds the extent of other terrestrial land types. For example, large transboundary lakes such as Lake Victoria and Lake Malawi are often not included in land cover maps but are treated geographically as internal seas not inland waterbodies.
Furthermore, in spatial analysis at watershed level, large inland waterbodies are often excluded from land cover maps. Geographically a watershed is defined as an area that collects water and drains water in a single outlet. Thus, the contour line of the watershed includes all the area upstream of the outlet point but does not go beyond the outlet point. Multiple rivers are often found around large lakes, and being lake tributaries their outlet points are located on the lake edge. As a result, watersheds defined at the edge of the lake are distributed all around the lake but do not include any portion of the lake itself.
These issues should be considered when the area of inland waterbodies is extracted from land cover maps.
If countries do not have major lakes, then a fine-resolution land cover map can be used to estimate the surface of existing water resources. If countries have large transboundary lakes and their extents are not reported within land cover maps, other ancillary information should be used in addition to the fine-resolution land cover maps.
Accounting for all occurred land cover changes against net land cover changeThe SEEA physical land cover account is designed to display, during an accounted period, land cover changes resulting from additions and reductions measured for each of the 14 SEEA land cover classes. In the land cover change matrix (SEEA-CF § 5.14), these land cover changes are further detailed to show the conversion of a class into others.
The land cover change matrix represents net land cover changes at the national scale. A positive change of class A into class B is mirrored by a corresponding negative change of class B into class A. The land cover change matrix will not report conversions of class A into class B in a certain location if there is a compensation by an equivalent conversion of class B into class A in another location.
This issue could be overcome by:
Complementing the physical account of land cover change with a map depicting the major areas of change;
Assessing the physical account of land cover change both at national and at lower spatial scale (e.g. the watershed level).
Enlarging the scope of SEEA land cover classification to coastal marine areasThe SEEA land cover classification includes land, inland waters and coastal waters but excludes marine waters. Therefore, it represents water resources relevant for inland capture fisheries and aquaculture but only partially includes aquatic environment relevant for marine capture fisheries and aquaculture. However, the SEEA account for aquatic biological resources recommends compilation of an asset account for marine aquatic resources within a country’s exclusive economic zone (EEZ)19 over which a country has ownership rights (SEEA-CF § 5.419).
19 The exclusive economic zone (EEZ) is defined by article 55 of the United Nations Convention on the Law of the Sea of 10 December 1982 (United Nations, 1998). It is the sea area over which a State has special rights over the exploration and use of marine resources, including fishing, and production of energy from water and wind (SEEA-CF § Annex I C).

29SEEA water accounting for water areas
The SEEA-CF suggests that the land use account could be extended to include areas of coastal marine waters within the country’s EEZ (SEEA-CF § 5.240).
The current SEEA class of “Coastal waterbodies and intertidal areas” includes estuaries, deltas, intertidal areas, and internal seas.
Where considering water resources relevant to marine capture and aquaculture, the land cover account can be extended to include coastal waters encompassed by the EEZ.
Enlarging the scope of the SEEA land cover to include also coastal marine areas may not be relevant for the SEEA land cover account but rather functional for the assessment of ecosystem services (provisioning, regulating, and cultural services) offered by coastal marine areas (see also Chapter 6).
SEEA ACCOUNTING FOR THE USE OF SURFACE WATERSEEA land use classificationLand use is referred to modifications and patterns due to some type of human intervention and management (SEEA-CF§ 5.243). In the more aggregated form, the SEEA land use classification includes 11 classes, 7 dedicated to land use and 4 to water use (Table 9). A further breakdown of this classification is described in SEEA-CF § Annex I B.
TABLE 9SEEA land use classification
1 Land
1.1 Agriculture1.2 Forestry1.3 Land used for aquaculture1.4 Use of built-up and related areas1.5 Land used for maintenance and restoration of environmental functions1.6 Other uses of land n.e.c.1.7 Land not in use2 Inland waters
2.1 Inland waters used for aquaculture or holding facilities2.2 Inland waters used for maintenance and restoration of environmental functions2.3 Other uses of inland waters n.e.c.2.4 Inland waters not in use
Source: SEEA-CF § Table 5.11.
n.e.c. = not elsewhere classified
The four classes referred to inland waters can also be applied to coastal water and marine waters within the EEZ if the scope of the analysis of water use is extended.
SEEA LAND USE ACCOUNTThe SEEA land use classification is used in the SEEA land use account, which describes how different land use classes are allocated over the accounting period (Table 10).
In Table 10, the four classes of water use identified by the SEEA land use classification are reported as columns, and any additions or reductions of each type of use are reported in rows. This account allows monitoring of the construction or abandonment of aquaculture facilities, the increase and decrease of inland waters not in use, the expansion of reduction of protected areas and, consequently, the variation of inland waters allocated to all other uses.
However, the SEEA water use classification does not currently allow the analysis of the allocation of surface waters among different sectors for different purposes. The
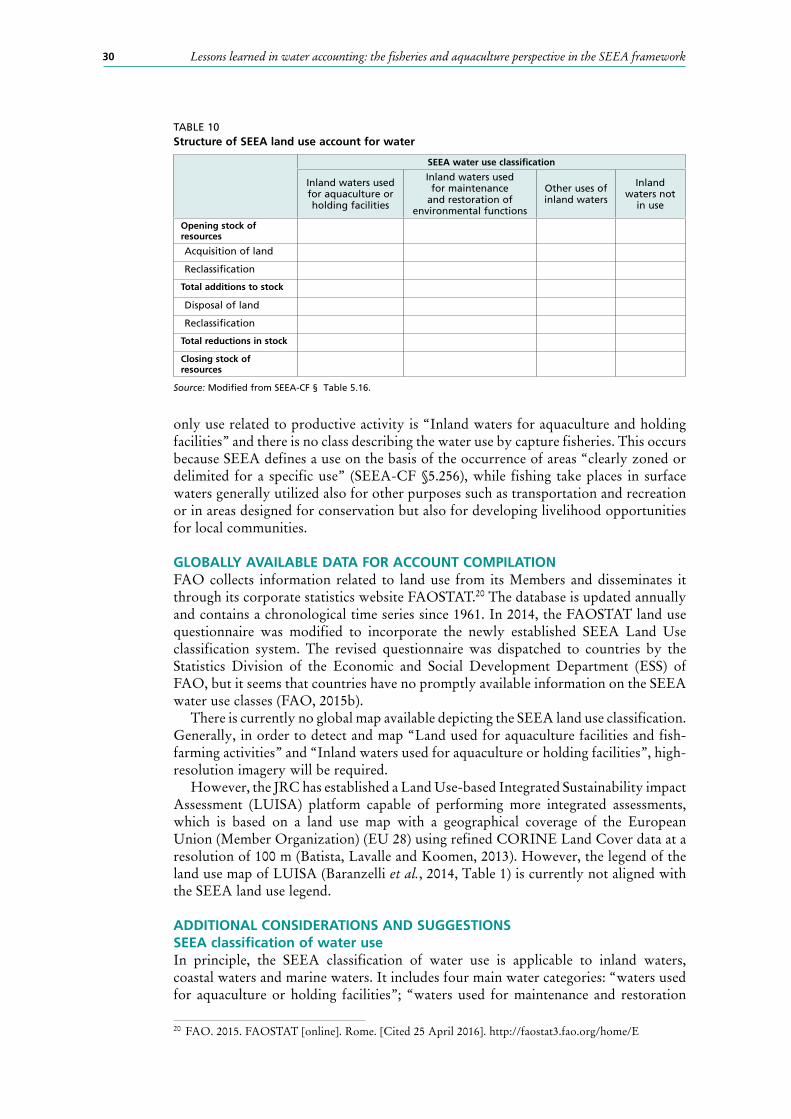
Lessons learned in water accounting: the fisheries and aquaculture perspective in the SEEA framework30
only use related to productive activity is “Inland waters for aquaculture and holding facilities” and there is no class describing the water use by capture fisheries. This occurs because SEEA defines a use on the basis of the occurrence of areas “clearly zoned or delimited for a specific use” (SEEA-CF §5.256), while fishing take places in surface waters generally utilized also for other purposes such as transportation and recreation or in areas designed for conservation but also for developing livelihood opportunities for local communities.
GLOBALLY AVAILABLE DATA FOR ACCOUNT COMPILATIONFAO collects information related to land use from its Members and disseminates it through its corporate statistics website FAOSTAT.20 The database is updated annually and contains a chronological time series since 1961. In 2014, the FAOSTAT land use questionnaire was modified to incorporate the newly established SEEA Land Use classification system. The revised questionnaire was dispatched to countries by the Statistics Division of the Economic and Social Development Department (ESS) of FAO, but it seems that countries have no promptly available information on the SEEA water use classes (FAO, 2015b).
There is currently no global map available depicting the SEEA land use classification. Generally, in order to detect and map “Land used for aquaculture facilities and fish-farming activities” and “Inland waters used for aquaculture or holding facilities”, high-resolution imagery will be required.
However, the JRC has established a Land Use-based Integrated Sustainability impact Assessment (LUISA) platform capable of performing more integrated assessments, which is based on a land use map with a geographical coverage of the European Union (Member Organization) (EU 28) using refined CORINE Land Cover data at a resolution of 100 m (Batista, Lavalle and Koomen, 2013). However, the legend of the land use map of LUISA (Baranzelli et al., 2014, Table 1) is currently not aligned with the SEEA land use legend.
ADDITIONAL CONSIDERATIONS AND SUGGESTIONSSEEA classification of water use In principle, the SEEA classification of water use is applicable to inland waters, coastal waters and marine waters. It includes four main water categories: “waters used for aquaculture or holding facilities”; “waters used for maintenance and restoration
20 FAO. 2015. FAOSTAT [online]. Rome. [Cited 25 April 2016]. http://faostat3.fao.org/home/E
TABLE 10Structure of SEEA land use account for water
SEEA water use classification
Inland waters used for aquaculture or holding facilities
Inland waters used for maintenance
and restoration of environmental functions
Other uses of inland waters
Inland waters not
in use
Opening stock of resources
Acquisition of land
Reclassification
Total additions to stock
Disposal of land
Reclassification
Total reductions in stock
Closing stock of resources
Source: Modified from SEEA-CF § Table 5.16.

31SEEA water accounting for water areas
of environmental functions”; “other uses of waters”; and “waters not in use”. The distinction among these classes is crucial.
Waters used for aquaculture or holding facilities is a rather narrow and well-defined class. An inventory of aquaculture farms, administrative data such as registration, and identification of aquaculture farms from remote sensing can help to supplement this information.
Waters not in use is also a very limited class, which applies to waters where no evidence of use is available, often situated in remote and unpopulated areas or due to their specific physical and chemical characteristics.
However, surface waters that have no direct human use still have the delivery and maintenance of environmental functions. Therefore, the distinction between “waters used for the maintenance and restoration of environmental functions” and “waters not in use” in SEEA is made as follows:
Waters used for the maintenance and restoration of environmental functions21 include all surface waters that are found within protected areas and under other legal bonds that prevent any other use.
Waters not in use22 should include all surface waters that are currently not in use and are not subject to any type of legal bond that forbids their eventual use.
Other uses of waters is a very broad class, covering everything that does not fall in the previous three classes. This class includes much heterogeneity, in particular the case of “inland waters” that contain different type of waterbodies built and reserved for particular uses. Uses can be distinguished into multipurpose uses and single-purpose uses. Some single-purpose water uses, which are currently part of the “Other uses of waters”, could be distinguished into separated classes referred to:
• inland waters exclusively used for irrigation;• inland waters exclusively used for cooling water to a nearby power plant or
industrial facility.The next paragraph discusses the challenges and possible suggestions to describe the
rest of the heterogeneity included in the class of “Other uses of waters”.
Assessment of in-stream water use in the SEEA water use accountThe quantitative assessment of different types of water use made by different economic sectors is crucial for allocation and management of available water resources.
A key consideration that should be pointed out is that the SEEA water use classification and related water use account have the potential to assess in-stream/on-site water use. Therefore, the accounting of the water use in terms of water areas through the SEEA land use account can be complementary to the accounting for SEEA water use in terms of water volume through the SEEA supply and use water account. Currently, in-stream water uses are not included in the supply and use water account because in-stream water use does not abstract/return water and does not consume any water.
21 This class includes protected areas as defined by the International Union for Conservation of Nature, i.e. clearly defined geographical spaces, recognized, dedicated and managed, through legal or other effective means, to achieve the long-term conservation of nature with associated ecosystem services and cultural values (SEEA-CF § Appendix I B).
22 This class includes areas where there are no clearly visible indications of human activities or institutional arrangements put in place for the purpose of economic production or the maintenance and restoration of environmental functions and where ecological processes are not significantly disturbed (SEEA-CF § Appendix I B).
Lessons learned in water accounting: the fisheries and aquaculture perspective in the SEEA framework32
The criterion applied to the SEEA land use classification is that areas of water are be considered “used” only where they have been clearly zoned or delimited for a specific use. Because of this criteria, the SEEA classification of water use considers only single-purpose water use (class 2.1 and 2.2 of Table 9), and groups many water uses into one large category “Other water use” (class 2.3 Table 9).
As a consequence, the SEEA land use account does not show overlaps or competition for water resources among different economic units. In fact, most of the in-stream water uses occur as multipurpose water use. Multiple water use can occur at the same time on the same water area or can occur in the same water area but at a different time; hence, the need to identify a methodology for the quantitative assessment in these types of situations.
Criterion of dominance applied to land useIn order to assess multiple uses, the SEEA-CF suggests applying the criterion of dominant or primary use (SEEA-CF § 254) but does not provides further specification on how dominant use should be measured.
The criterion of dominance is usually applied in land cover mapping. In fact, where there are mixed classes, the LCCS identifies which is the dominant/primary land cover class (covering more than the 50 percent of the analysed unit)23 and which are the subsidiary land cover classes (covering more than 20 percent of the analysed unit) (Di Gregorio, 2005). In land cover mapping, the criterion of dominance is easily applied as land cover classes are “mutually exclusive” and the space they occupy can be clearly measured; therefore, land cover components are additive.
Instead, in accounting for land use, if multiple uses are assessed separately for the different uses, the resulting sum of water areas used might be larger than the existing inland water area. This can occur because in-stream water uses are not always “mutually exclusive” but rather simultaneous uses can overlay in space and time and/or uses differed in time can overlay in space by targeting the same area. It follows that the criterion of dominance applied to land use should be developed to consider both space and time.
Assessing multipurpose water use considering space and timeMultipurpose water use assessment should consider for each use both the area of surface water used (space) and the continuity with which surface waters are used (time). This exercise might be helpful to disaggregate the SEEA land use class of “Other uses of inland water” in subclasses that express situations of overlapping water use in space and time.
23 The analysed unit can be a cell or a polygon.
KEY MESSAGE
SEEA water use account:• Describes in-stream water use.• Uses water areas.• Measures the extent of clearly zoned or delimited for a given use.
SEEA supply and use water account:• Describes off-stream water use.• Uses water volumes.• Measures abstraction, consumption and returns of water by a given use.

33SEEA water accounting for water areas
All occurring in-stream water uses should be made spatially explicit.
All occurring in-stream water uses in a given area should be associated to information on the temporal continuity (e.g. yearly, seasonally, monthly, daily) with which the area is used.
In order to account for multipurpose water use a GIS-based approach is suggested. The GIS organizes and analyses information into overlapping layers and is therefore able to deal with the multidimensionality of different water uses. The map of surface water to be analysed is divided into a grid. Each water use of a given economic unit constitutes a separate layer of information mapping the grid cells where that use takes place. Each water use records the temporal continuity with which the grid cells are used. Within the same surface water in-stream waters are identified by one continuous area or several disjoint areas.
On the basis of a criterion of continuous use in time, each grid cell can have a primary use of a given economic unit and one or few secondary use of other economic units. The outcome will be the creation of mixed subclasses composed of different in-stream water uses such as hydroelectric power generation, cage and pen aquaculture and fishing, navigation, recreation and tourism.

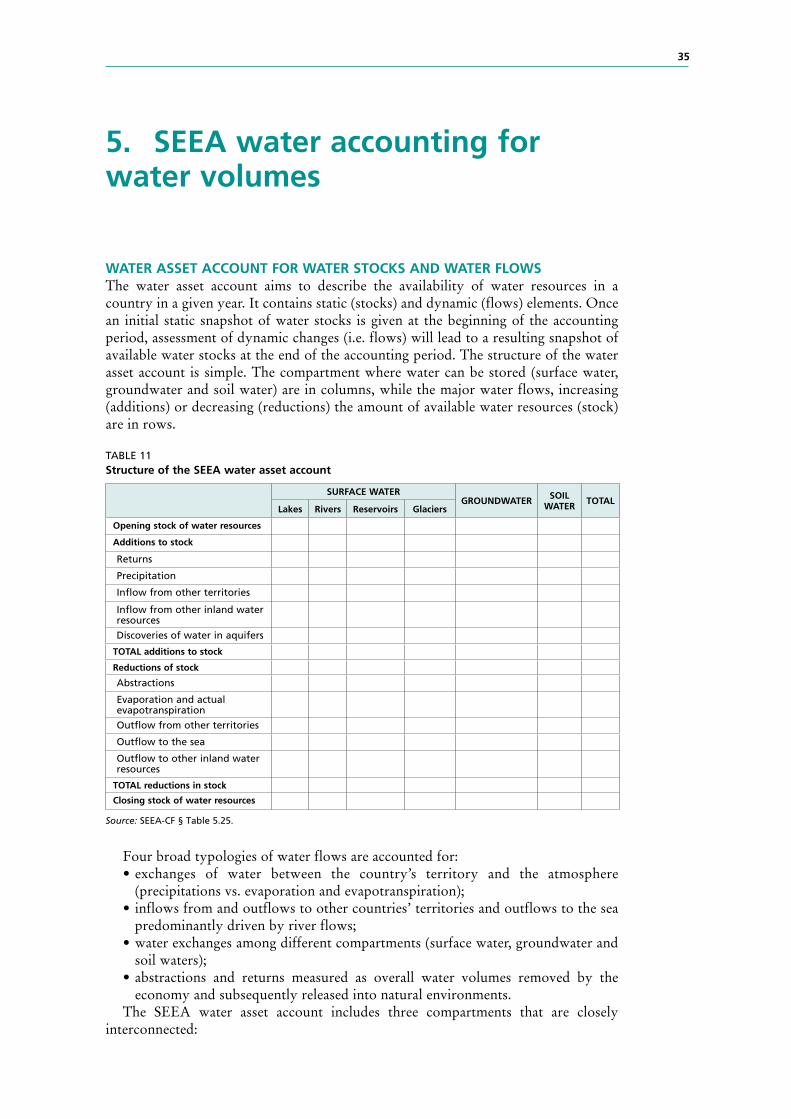
35
5. SEEA water accounting for water volumes
WATER ASSET ACCOUNT FOR WATER STOCKS AND WATER FLOWSThe water asset account aims to describe the availability of water resources in a country in a given year. It contains static (stocks) and dynamic (flows) elements. Once an initial static snapshot of water stocks is given at the beginning of the accounting period, assessment of dynamic changes (i.e. flows) will lead to a resulting snapshot of available water stocks at the end of the accounting period. The structure of the water asset account is simple. The compartment where water can be stored (surface water, groundwater and soil water) are in columns, while the major water flows, increasing (additions) or decreasing (reductions) the amount of available water resources (stock) are in rows.
TABLE 11Structure of the SEEA water asset account
SURFACE WATER GROUNDWATER SOIL
WATER TOTALLakes Rivers Reservoirs Glaciers
Opening stock of water resources Additions to stock Returns Precipitation Inflow from other territories Inflow from other inland water resources Discoveries of water in aquifers
TOTAL additions to stock Reductions of stock Abstractions Evaporation and actual evapotranspiration Outflow from other territories Outflow to the sea Outflow to other inland water resources
TOTAL reductions in stock Closing stock of water resources
Source: SEEA-CF § Table 5.25.
Four broad typologies of water flows are accounted for: • exchanges of water between the country’s territory and the atmosphere
(precipitations vs. evaporation and evapotranspiration); • inflows from and outflows to other countries’ territories and outflows to the sea
predominantly driven by river flows; • water exchanges among different compartments (surface water, groundwater and
soil waters); • abstractions and returns measured as overall water volumes removed by the
economy and subsequently released into natural environments. The SEEA water asset account includes three compartments that are closely
interconnected:

Lessons learned in water accounting: the fisheries and aquaculture perspective in the SEEA framework36
• surface water comprises all water that flows over or is stored on the ground surface regardless of its salinity levels;24
• groundwater comprises water that is collected in porous layers of underground formations known as aquifers;25
• soil water comprises water suspended in the uppermost belt of soil, or in the zone of aeration near the ground surface.26
Soil water, water retained in the soil, is often considered as an intermediate compartment between surface water and groundwater, as water is stored in soil for a relatively short period. The amount of soil water may show a high level of variability in space and time, primarily according to soil type and soil characteristics and also due to vegetation types and meteo-climatic factors. At the national level, the amount of soil water is quite difficult to estimate and requires GIS-based modelling.
The SEEA water asset account also describes changes in water availability caused by both natural processes and human activities. Abstractions and returns as well as discoveries of water in aquifers are closely linked to human activities. In reality, all water flows of the water cycle are directly or indirectly affected by human activities that influence ecosystems. Treaties and agreements may regulate and modify the water exchanges among countries through inflow and outflow between borders. Human activities modifying land use, land cover and natural habitats directly influence evaporation and actual evapotranspiration. Impacts of human activities in terms of climate change include local change in the amount and seasonal pattern of precipitations and increases in evaporation and evapotranspiration rates due to increased air temperatures. It is important to understand that the abstractions and returns are only part of human impacts on water resources and do not truly reflect all anthropogenic pressure on the water cycle.
REQUIRED DATACompilation of the SEEA water asset account requires data collection and data modelling. The fluid and dynamic nature of water and the exchanges among different compartments make this task more challenging than for other types of natural resources.
Required data for the compilation of water asset account can be retrieved in part using national statistics, complementary information, survey, censuses, administrative records and existing literature, and in part by modelling.
• Water stocks (volume of lakes, rivers and reservoirs) are obtained from an inventory of inland waters in the country and measurement of their volumes. Often, volumes of artificial reservoirs and lakes are also derived from topographic maps and elevation profiles. The volume of groundwater can be obtained from an inventory of existing and new discovered aquifers. Piezometric measurements at
24 SEEA-CF § 5.477.25 SEEA-CF § 5.479.26 SEEA-CF § 5.480.
KEY MESSAGESEEA water asset account
• Includes static (stocks) and dynamic (flows) elements.• Assesses changes in water flow to review available water stocks.• Includes soil water as an intermediate compartment between surface water and
groundwater.• Distinguishes changes in water availability caused by natural processes and direct
utilization by human economic activities.

37SEEA water accounting for water volumes
different points provide baseline data for estimating the volume of groundwater and their change over time. In addition the volumes of lakes, rivers and reservoirs can be derived by modelling topographic data associated to a detailed land cover.
• Precipitations are collected by meteorological stations. To obtain representative and robust average at the national level, good coverage of measurements in space and time and quite intensive data processing are required. Observations taken by meteorological stations can be modelled with a spatial–temporal interpolation.
• Inflows/outflows from other territories and other inland waters are usually monitored by commissions and/or water management agencies. The river discharge from/to other countries’ territories as well as to the sea is usually recorded by stream gauges. Alternatively, the inflows/outflows from other territories can be estimated by a GIS-based model that considers the surface runoffs of the watersheds at the country’s borders. The transboundary water movement of groundwater is often difficult to measure and is generally estimated or modelled.
• Evaporation and evapotranspiration are difficult to measure due to their high variability in both space and time. They can be estimated through remote sensing, taking into consideration the different evaporation and evapotranspiration rates by land cover type (Nouri et al., 2013; Karimi et al., 2015). However, often, evaporation and evapotranspiration are estimated as the difference between precipitations and surface runoffs.
• Abstractions are the volumes of water temporarily removed from surface waters and groundwaters by economic units. Supply and use water accounts record abstractions by different economic units. Abstractions of water for irrigation can be modelled with a GIS-based approach (Hoogeveen et al., 2015). However, abstractions for municipal and industrial use are not necessarily dependent on climatic, topography and land cover features and, therefore, require additional non-GIS information to be modelled.
• Returns are the volumes of water returned to the environment. For accounting purposes, returns are often derived as the difference between abstractions and evaporation/evapotranspiration, usually without modelling.
The compilation of an asset account requires: collection of data at the local level, aggregation of data at the national level, data evaluation, and data processing to ensure consistency within and between accounts. In the asset account, the total of additions should be equal to the sum of the total of all reductions and eventual changes in stock.
A GIS-based model is an essential tool to support the compilation of SEEA water asset accounts in filling data gaps and in processing and aggregating data with a high spatial heterogeneity to regional and national scales. The analytical capacity of a GIS-based model provides an output estimate for variables affected by climatic factors and spatially related drivers. For example, water used in irrigated agriculture is dependent on many interacting factors (such as water requirements of different crops and precipitations, temperature and other climatic features, soil characteristics) that vary in time and space and need to be assessed jointly and dynamically. Another example
KEY MESSAGE
The compilation of a physical asset account requires:• Collection of data at the local level.• Aggregation of data at the national level.• Evaluation of the input data. • Data processing to ensure consistency within and between accounts.
Lessons learned in water accounting: the fisheries and aquaculture perspective in the SEEA framework38
is water flows such as infiltration and seepage, which are influenced by precipitation patterns, soil types, moisture level, soil storage capacity, aquifers locations, etc.
The analytical capacity of a GIS-based model can also be useful for estimating variables that are difficult to measure directly but that are expected to change corresponding to climatic factors or spatially related drivers. An example is evaporation/evapotranspiration, which varies according to land cover characteristics and climatic features (such as precipitation, temperature, humidity and wind).
At the same time, a GIS-based model cannot be calibrated and validated without data collected through field surveys, meteorological stations, river gauges, and inventories of surface waters and aquifers. Moreover, a GIS-based model is not effective for variables whose changes are not related to biophysical spatially related processes, such as abstraction and returns, water consumption by industrial or municipal uses, amount of desalinated marine water and rainwater, and reused water. Those variables can only be retrieved through data collection.
GLOBALLY AVAILABLE DATA FOR ACCOUNT COMPILATIONFAO AQUASTAT databaseThe FAO AQUASTAT country database27 contains some information required in the SEEA water asset account. AQUASTAT is a global water information system that includes standardized tables of key statistics for about 175 countries (developing and in transition). Statistics are compiled and updated every five years based on literature reviews and data and information collected through country questionnaires. The information collected is critically reviewed, analysed, and processed into the standardized country profiles and tables that go through an approval process by national authorities before being disseminated (Margat, Frenken and Faurès, 2005).
AQUASTAT assembles the same statistics as the SEEA water asset account in a more aggregated way. The AQUASTAT database compiles the: “internal renewable water resources” (IRWR), the amount water produced internally in a country; “external renewable water resources” (ERWR), the amount of water generated outside the country but which flows into the country; and “total renewable water resources” (TRWR) available in a country, the sum of IRWR and ERWR. This accounting principle is the same than that utilized in SEEA water asset accounts.
27 FAO. 2016. AQUASTAT [online]. Rome. [Cited 25 April 2016]. www.fao.org/nr/water/aquastat/main/index.stm
KEY MESSAGEThe compilation of water asset account requires
Data modeling to:• Fill data gaps in data coverage.• Aggregate and process data with high spatial heterogeneity.• Provide an output for variables affected by climatic factors or spatially related
drivers.
Data collection to:• Provide time series of meteorological data. • Record data of river flow at key locations, including water flow regulated by
treaties. • Collect information on abstraction, returns and reuse of water after treatment.• Account for utilization of other sources of water (rainwater, desalinated water).

39SEEA water accounting for water volumes
TRWR = IRWR + ERWR
The IRWR include the amount of renewable water resources generated by precipitation within the country sustaining surface water and groundwater resources. Surface water and groundwater resources are often computed separately but are in fact interlinked and in continuous exchange within the hydrological cycle. Simple addition of surface water and groundwater would often lead to an overestimation of the existing renewable water resources. Therefore, the IRWR exclude the amount of renewable freshwater resources that is common to both surface water and groundwater (i.e. overlap).28 Overlap is equal to the difference between groundwater drainage into rivers and seepage from rivers into aquifers (Margat, Frenken and Faurès, 2005).
The value for ERWR considers the amount of renewable water resources that are not generated in the country but that enter a country from neighbouring countries. The ERWR is constituted by inflows of surface water and groundwater from neighbouring countries and by volumes of surface water shared at the country’s borders. Until 2015, when assessing ERWR, AQUASTAT distinguished between incoming water flow under natural conditions (i.e. ERWR natural) and actual water flow the occurred under established treaties and agreements (i.e. ERWR actual). However, given the difficulty in obtaining reliable statistics and the intent to simplify the data acquisition process, AQUASTAT now contains statistics only on actual ERWR (Kohli and Frenken, 2015).
Differences between AQUASTAT statistics and data required for SEEA water asset accountThere are few differences between AQUASTAT statistics and the data required for the compilation of the SEEA water asset account. The major difference is that SEEA considers both water stocks and water flows, while AQUASTAT only includes statistics related to water flows.
Within the assessment of water flows, both SEEA and AQUASTAT are interested in accounting for the water flows from/to different compartments such as surface waters and groundwaters. However, AQUASTAT excludes deep aquifers29 from the assessment of groundwaters, while in the SEEA water asset account the distinction between renewable and non-renewable aquifers is not made. AQUASTAT considers
28 Overlap between surface water and groundwater: part of the renewable freshwater resources that is common to both surface water and groundwater. It is equal to groundwater drainage into rivers (typically, base flow of rivers) minus seepage from rivers into aquifers (AQUASTAT § Glossary).
29 Non-renewable water resources are groundwater bodies (deep aquifers) that have a negligible rate of recharge on the human time scale and thus can be considered non-renewable.
KEY MESSAGEDifferences between SEEA water asset account and AQUASTAT statistics
• SEEA considers water stocks and water flows, AQUASTAT only water flows.• AQUASTAT considers surface water, groundwater, while SEEA also considers soil
water.• AQUASTAT accounts separately for surface waters and internal groundwater
recharges but subtracts their overlap; in SEEA the accounting overlap is not distinguished.
• Both SEEA and AQUASTAT consider the natural flow of water from/to neighboring countries, but in addition AQUASTAT assesses the actual flow due to water treaties.
• AQUASTAT statistics consider water flows referred to five-year averages, while SEEA water flows refer to one year.
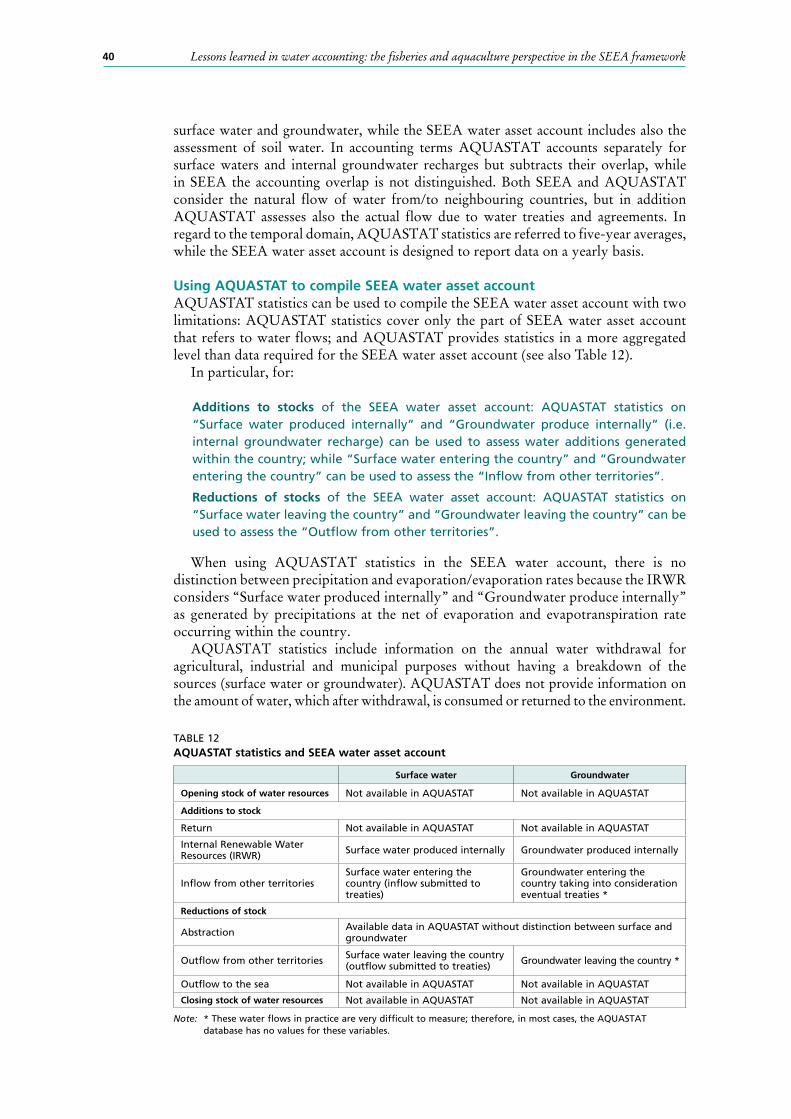
Lessons learned in water accounting: the fisheries and aquaculture perspective in the SEEA framework40
surface water and groundwater, while the SEEA water asset account includes also the assessment of soil water. In accounting terms AQUASTAT accounts separately for surface waters and internal groundwater recharges but subtracts their overlap, while in SEEA the accounting overlap is not distinguished. Both SEEA and AQUASTAT consider the natural flow of water from/to neighbouring countries, but in addition AQUASTAT assesses also the actual flow due to water treaties and agreements. In regard to the temporal domain, AQUASTAT statistics are referred to five-year averages, while the SEEA water asset account is designed to report data on a yearly basis.
Using AQUASTAT to compile SEEA water asset accountAQUASTAT statistics can be used to compile the SEEA water asset account with two limitations: AQUASTAT statistics cover only the part of SEEA water asset account that refers to water flows; and AQUASTAT provides statistics in a more aggregated level than data required for the SEEA water asset account (see also Table 12).
In particular, for:
Additions to stocks of the SEEA water asset account: AQUASTAT statistics on “Surface water produced internally” and “Groundwater produce internally” (i.e. internal groundwater recharge) can be used to assess water additions generated within the country; while “Surface water entering the country” and “Groundwater entering the country” can be used to assess the “Inflow from other territories”.
Reductions of stocks of the SEEA water asset account: AQUASTAT statistics on “Surface water leaving the country” and “Groundwater leaving the country” can be used to assess the “Outflow from other territories”.
When using AQUASTAT statistics in the SEEA water account, there is no distinction between precipitation and evaporation/evaporation rates because the IRWR considers “Surface water produced internally” and “Groundwater produce internally” as generated by precipitations at the net of evaporation and evapotranspiration rate occurring within the country.
AQUASTAT statistics include information on the annual water withdrawal for agricultural, industrial and municipal purposes without having a breakdown of the sources (surface water or groundwater). AQUASTAT does not provide information on the amount of water, which after withdrawal, is consumed or returned to the environment.
TABLE 12AQUASTAT statistics and SEEA water asset account
Surface water Groundwater
Opening stock of water resources Not available in AQUASTAT Not available in AQUASTAT
Additions to stock
Return Not available in AQUASTAT Not available in AQUASTAT
Internal Renewable Water Resources (IRWR) Surface water produced internally Groundwater produced internally
Inflow from other territoriesSurface water entering the country (inflow submitted to treaties)
Groundwater entering the country taking into consideration eventual treaties *
Reductions of stock
Abstraction Available data in AQUASTAT without distinction between surface and groundwater
Outflow from other territories Surface water leaving the country (outflow submitted to treaties) Groundwater leaving the country *
Outflow to the sea Not available in AQUASTAT Not available in AQUASTAT
Closing stock of water resources Not available in AQUASTAT Not available in AQUASTAT
Note: * These water flows in practice are very difficult to measure; therefore, in most cases, the AQUASTAT database has no values for these variables.

41SEEA water accounting for water volumes
In summary, AQUASTAT statistics can provides an aggregated measure of the net surface runoff in the country as the sum of IRWR and ERWR. This net surface runoff does not take into account water use by economic activities (abstractions/returns). AQUASTAT could be used as a data source for the SEEA water asset account to monitor the trend of major water flows in the country. However, as AQUASTAT statistics are five-year averages, they are not suitable to assess yearly variations in water flows.
FAO hydrological modelFAO has built a GIS-based global water balance model (GlobWat) based on a high-resolution dataset to depict natural hydrological water flows at the national and subnational level, integrated with the assessment of water used and consumed by irrigated agriculture. The model combines available datasets related to climatic variables (resolution 10 arc minutes) and terrain and land cover dataset (resolution 5 arc minutes). This model aggregates the spatial variability of different environmental conditions recorded in the country by aggregating information from the spatial unit used in the model (cell) to the water basin and finally to the country level (Hoogeveen et al., 2015).
The global water balance is calculated in two steps: vertical water balance; and horizontal water balance. In the vertical water balance, the model records the amount of water received by rainfall, the amounts of water that evaporates and evapotranspirates, and the amount of water that percolates in the soil and returns to the groundwater aquifers according to the soil type recorded, for each cell. In the horizontal water balance, the model calculates the additional amount of water that evaporates from inland waterbodies, evapotranspirates from natural and cultivated vegetation, and the water that evaporates from irrigated crops. The output of the horizontal water balance is the discharge (runoff) generated from each watershed. The national amount of surface water actually available for a country is estimated as the sum of discharges of the different watersheds in the country and by accounting also for the inflow of water from neighbouring countries and the outflow to neighbouring countries and to the sea (Hoogeveen et al., 2015). GlobWat takes into consideration the occurrence of surface waters but does not include the real volume of existing surface waters, as it considers all mapped water areas as having a depth of 1 m.
This GIS model was particularly designed to estimate the water that is consumed for irrigation in response to precipitations patterns and climatic features, soil characteristics and water requirements of different crops. Therefore, it can provide information on abstraction and returns of water used for crop production.
The model was calibrated with the country data on total IRWR and groundwater resources in AQUASTAT. It was also validated with discharge data from major river
KEY MESSAGEUse of AQUASTAT statistics for SEEA water asset accounts
For additions to stock:• Internal Renewable Water Resources (IRWR) to assess water flow produced
internally within a country.
For reductions of stock:• External Renewable Water Resources (ERWR) to assess water flows exchanged
with neighboring countries.• Total amount of water abstracted within the country.
Aquastat statistics can be used to provide an initial core-data set for the compilation of a simplified SEEA water asset account, which considers only water flows as long-term averages (five years).
Lessons learned in water accounting: the fisheries and aquaculture perspective in the SEEA framework42
basins recorded in the Global River Discharge Database (Center for Sustainability and the Global Environment, 2014) (Hoogeveen et al., 2015).
ADDITIONAL CONSIDERATIONS AND SUGGESTIONSThe main purpose of the SEEA water asset account is to evaluate whether the current pattern of economic activities is depleting or degrading existing stocks of water resources (SEEA-CF § 2.49). As all water flows must be balanced within the account, some variables are often assessed in a way to make this balance. For example, the amount of water reduced through evaporation and evapotranspiration is an output that requires data-intensive computation, but is often assessed as the difference of precipitation less surface runoffs and less the water flow that recharges aquifers. While this approach is considered practical, such shortcuts do not allow the verification and comparison of data from different sources, and may slow critical review on data quality in the account.
The compilation of the SEEA water asset account requires nationally representative values, which necessitate the representativeness of the data coverage both in space and time, and the use of a robust methodology for data aggregation and up-scaling of the data to the national level.
Compilation of SEEA water account with globally available data sourcesThe compilation of the SEEA water asset account with FAO AQUASTAT and GlobWat is hampered by these data sources as most hydrological models consider only water flows and do not include water stocks. It is not possible to simply add an estimate of the opening stock of water resources to the SEEA water asset account, because water stocks and water flows are dynamically linked, and water stock value will influence also the water flows.
A model of the dynamic interactions between water stocks and water flows will assist in describing the impacts of climate change and effect of withdrawals on surface water, which are vital resources for the fisheries sector (see also Chapter 3).
Distinction between non-renewable aquifers and renewable aquifers The distinction between non-renewable (deep) aquifers and renewable (shallow) aquifers is extremely important for accounting purposes. Deep aquifers are not replenished on human time scales by the runoffs generated by endogenous precipitations. It would be helpful if this distinction was made explicit in SEEA:
SEEA water asset account should be compiled by including only renewable aquifers that can be replenished on human time scales and are affected in the short term by the water cycle.
SEEA supply and use water account should be compiled by distinguishing within groundwater resources abstractions from non-renewable and renewable aquifers.
KEY MESSAGE
SEEA water accounts are best when information is: • Updated.• Representative at the national level.• Measured rather than derived from accounting frameworks.• Consistent within and among other accounts.

43SEEA water accounting for water volumes
Temporal dimension of the SEEA water asset account.National economic accounts are usually assessed for a fiscal year30 or financial year. For most countries, the fiscal year is concurrent with the calendar year (1 January – 31 December), while for 39 countries the fiscal year does not coincide with the calendar year (World Bank, 2013).
The water cycle itself should be assessed on a hydrological year basis, which is defined as a continuous 12-month period selected in such a way that overall changes in storage are minimal, so that carryover is reduced to a minimum (UNESCO and WMO, 1993). The hydrological year varies geographically according to the climatic conditions and often does not coincide with the calendar year. When the calendar year ends on 31 December, in temperate and continental climate there can be significant amount of precipitation that has accumulated as snow or ice. As the SEEA water asset account is assessed on a calendar year (1 January – 31 December), for countries with temperate or continental climates, the compilation of the account requires information on glaciers, snow and ice.
Annual accounts may hide seasonal variability, which might be critical in water management. If water accounting is assessed only on an annual basis, then in order to assess the implications of potential water shortages or risk of flooding, it is advisable to compare water asset accounts compiled for “very dry”, “dry”, “wet” and “very wet” years.
It is advisable to compile the SEEA water asset account also seasonally, especially in climatic conditions affected by strong seasonal variability.
It would be beneficial to maintain a temporal alignment between information on available water resources and information on economic variables both on a yearly basis and on a seasonal basis.
Applying SEEA water asset account at the watershed levelAvailability of water resources can vary broadly according to geographical location. A water asset account compiled at the national level can hide water surpluses and shortages at subnational levels, such as subregions, watersheds and watershed subunits.
The SEEA-Water clarifies that water asset accounts at the national level are useful mainly for building public awareness, while water management requires assessments with different spatial and temporal resolutions (SEEA-Water § 9.32).
The watershed is the internationally recognized unit of reference for integrated water resources management (IWRM). Water management can in fact be pursued more effectively at the river basin level as all water resources within a river basin are interlinked in terms of both quantity and quality. In this way, managers are able to gain a better understanding of overall conditions in an area and the factors that affect the availability of water resources (SEEA-Water § 2.87).
SEEA water asset account compiled also at the watershed level could be very useful for water management purposes.
The SEEA-Water advises reconciling hydrological and economic information with the definition of an accounting catchment area, an area whose borders do not coincide precisely with an hydrographical watershed delineation but include also administrative units where most economic data are usually recorded (SEEA-Water § 9.55).
30 The fiscal year is usually defined in relation to tax and income reporting processes.
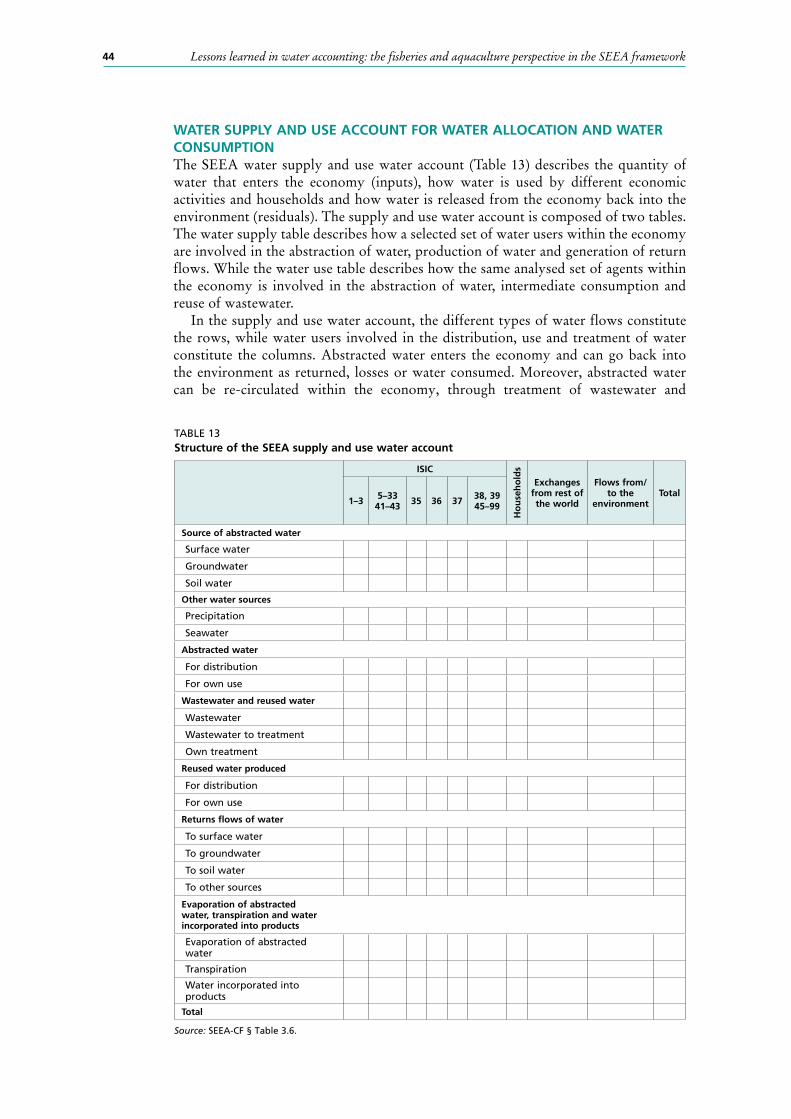
Lessons learned in water accounting: the fisheries and aquaculture perspective in the SEEA framework44
WATER SUPPLY AND USE ACCOUNT FOR WATER ALLOCATION AND WATER CONSUMPTIONThe SEEA water supply and use water account (Table 13) describes the quantity of water that enters the economy (inputs), how water is used by different economic activities and households and how water is released from the economy back into the environment (residuals). The supply and use water account is composed of two tables. The water supply table describes how a selected set of water users within the economy are involved in the abstraction of water, production of water and generation of return flows. While the water use table describes how the same analysed set of agents within the economy is involved in the abstraction of water, intermediate consumption and reuse of wastewater.
In the supply and use water account, the different types of water flows constitute the rows, while water users involved in the distribution, use and treatment of water constitute the columns. Abstracted water enters the economy and can go back into the environment as returned, losses or water consumed. Moreover, abstracted water can be re-circulated within the economy, through treatment of wastewater and
TABLE 13Structure of the SEEA supply and use water account
ISIC
Hou
seho
lds
Exchanges from rest of the world
Flows from/to the
environmentTotal
1–3 5–33 41–43 35 36 37 38, 39
45–99
Source of abstracted water Surface water
Groundwater
Soil water Other water sources Precipitation
Seawater Abstracted water
For distribution
For own use Wastewater and reused water
Wastewater
Wastewater to treatment
Own treatment Reused water produced
For distribution
For own use Returns flows of water
To surface water
To groundwater
To soil water
To other sources
Evaporation of abstracted water, transpiration and water incorporated into products
Evaporation of abstracted water
Transpiration Water incorporated into products
Total
Source: SEEA-CF § Table 3.6.
45SEEA water accounting for water volumes
production of reused water. In order to account for such different water flows, the SEEA supply and use water account distinguishes five sections: (i) abstraction of water from the environment; (ii) distribution and use of abstracted water across enterprises and households; (iii) flows of wastewater and reused water (between households and enterprises); (iv) return flows of water to the environment; and (v) evaporation, transpiration and water incorporated into products (SEEA-CF § 3.189).
The major agents considered in the SEEA supply and use water account are: industries, households and the government. Economic activities (i.e. industries) are classified according to ISIC, and different levels of detail can be selected according to the need. Usually, the account includes at the least primary sector, i.e. agriculture, forestry, and fishing (ISIC 01–03); mining and quarrying (ISIC 05–09); manufacturing (ISIC 10–33); and electricity, gas, steam and air conditioning supply (ISIC 35). In addition, an inflow and outflow from/to the rest of the world is also considered, but the focus of the account is the economic activities within the country.
Some economic activities abstract water directly (i.e. direct access to water), while others receive water from an agent that is in charge of water distribution (i.e. mediated access to water). In particular, economic activities for water collection treatment and supply (ISIC 36) are a critical node at the interface from the environment to the economy. In a parallel way, economic activities relating in collection and treatment of wastewater (ISIC 37 and ISIC 39) are a critical node at the interface from the economy to the environment.
The SEEA supply and use account has the same logic and structure as the SNA (see Chapter 2), which enables the table to capture the main water flows within the economy. Several characteristics of the SEEA supply and use water account should be noted as possible limitations in identifying conflicts in water use. First, it would be advisable to assess separately the water requirement for each primary sector. Agriculture, forestry and fishing are often aggregated into one single category (see SEEA-CF § Table 3.6 and SEEA-Water § Table III 1). A disaggregation of agriculture into its diversified components can provide further information on water use related to different activities. The problem of aggregation of water use of different activities has been also pointed out for activities aggregated under “Electricity, gas, steam and air conditioning supply” (ISIC 35). In fact, the enormous quantities of water used for generating hydroelectric power outweigh that of any other industry within ISIC 35 (SEEA-Water § 3.24). Second, the supply and use water accounts are designed to present off-stream water uses, not in-stream water uses. This is evident from the fact that water abstraction is the starting point for water accounting and it is considered the “most relevant piece of information” as other data can be estimated if not available on the basis of water abstraction. There are many in-stream water uses, such as hydroelectrical power generation (ISIC 3510), operation of waterway locks for navigation (ISIC 5222), fishing (ISIC 0312), water transport (ISIC 50) and recreational activities (ISIC 93), that are not included in the supply and use water account. The only exception is related to hydroelectric power plants (ISIC 35), which are often included in the supply and use water table with the methodological assumption that water used for the generation of hydroelectric power is also considered to be abstraction (SEEA-Water § 3.26).
In the end, in the supply and use water account, returns of freshwater to the sea are combined with returns to soil water. This might be particularly relevant in water-scarce situations as returns to surface water or soil water might still have additional users, while returns to the sea can be considered as the quantity of freshwater water that definitely leaves the economic system and for most uses can be available again only through desalinization (see also Chapter 3).

Lessons learned in water accounting: the fisheries and aquaculture perspective in the SEEA framework46
REQUIRED DATA As for the water asset account, the compilation of the supply and use water account requires: collection of data at the local level; aggregation of data at the national level; evaluation of the input data; and data processing to ensure consistency of the data within and between accounts. However, unlike the water asset account, the supply and use water account uses mainly data collected by various ministries and agencies within the country. Examples of information to be collected or estimated for each economic unit is reported below.
• Water withdrawal31 – data are usually collected by different authorities for different economic units:
- water supply industries: inventory of drinking-water utilities and companies; non-drinking-water suppliers; inventory on collected rainwater, desalination plants industries and relative amount of treated seawater;
- other industries: inventory and survey of industries and associated records on water permits;
- irrigated agriculture: inventory of irrigation schemes and farmers associations together with invoicing data of water received, area of irrigation and amount of water required for irrigated crops.
• Distribution and use of abstracted water across enterprises and households: - water supply industries: inventory of water supply industries and water supply
association together with invoices of water supply; - households: data on municipal and rural population and housing census
combined with water bills; record of rainwater collected; estimates of water use through water use factors.
• Flows of wastewater and reused water: - wastewater treatment industries: inventory of wastewater treatment industries
together with volumes of treated water; - households: population and housing census and household survey together
with administrative records of water and wastewater facilities size; estimates of wastewater based on type of toilet and sewage disposal used.
• Evaporation, transpiration and water incorporated into products: - other industries: inventory of manufacturing food and beverages industries
together with volumes of produced products and factors of incorporated water; - irrigated agriculture: irrigated area combined with water requirement of irrigated
crops, climate and soil conditions. Estimates can be based on water use factors or GIS-based modelling.
• Water return – often estimated as the difference between abstracted water and consumed water:
- returns to the sea can be estimated from location of discharges.
31 Water withdrawals are defined as the gross volume of water abstracted from streams, aquifers or lakes for any purpose (irrigation, industrial, domestic, commercial) (FAO, 2012).
KEY MESSAGE
SEEA supply and use water account may be unable to show water shortages and potential water conflict because:• Often accounts together agriculture, forestry and fishing.• Focuses only on off-stream water use.• Does not include in-stream water use.• Does not specifically separate returns of freshwater to the sea.
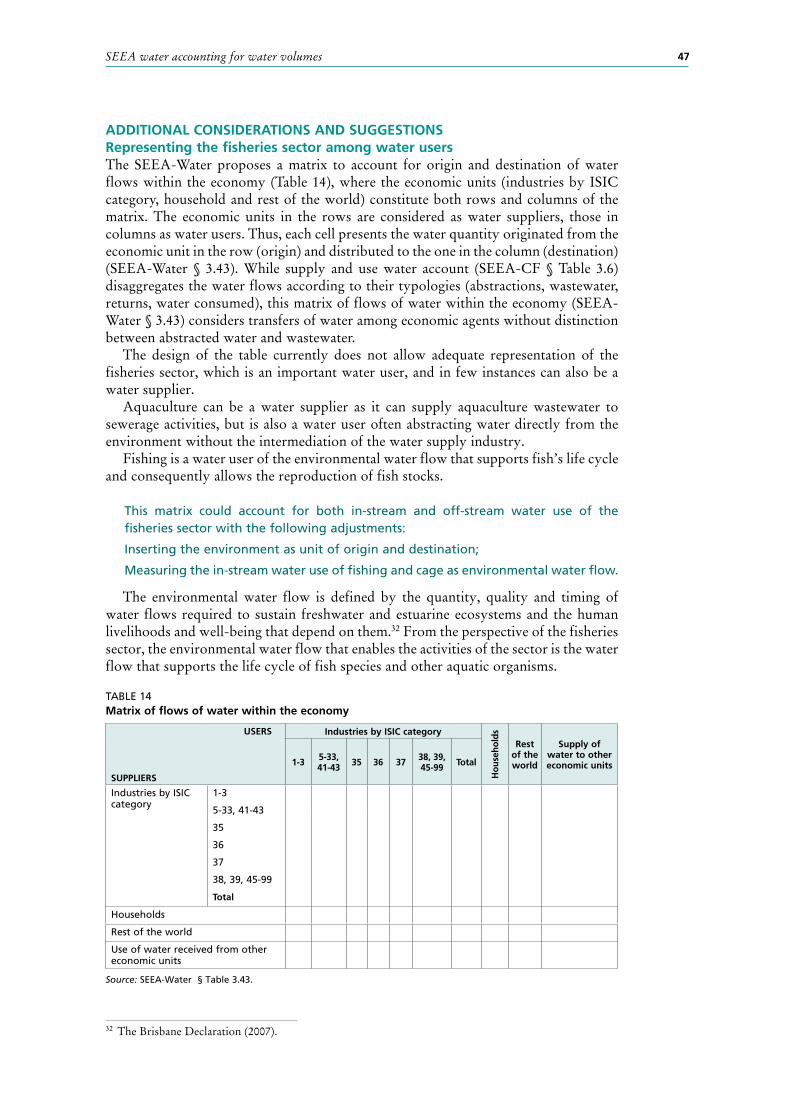
47SEEA water accounting for water volumes
ADDITIONAL CONSIDERATIONS AND SUGGESTIONSRepresenting the fisheries sector among water usersThe SEEA-Water proposes a matrix to account for origin and destination of water flows within the economy (Table 14), where the economic units (industries by ISIC category, household and rest of the world) constitute both rows and columns of the matrix. The economic units in the rows are considered as water suppliers, those in columns as water users. Thus, each cell presents the water quantity originated from the economic unit in the row (origin) and distributed to the one in the column (destination) (SEEA-Water § 3.43). While supply and use water account (SEEA-CF § Table 3.6) disaggregates the water flows according to their typologies (abstractions, wastewater, returns, water consumed), this matrix of flows of water within the economy (SEEA-Water § 3.43) considers transfers of water among economic agents without distinction between abstracted water and wastewater.
The design of the table currently does not allow adequate representation of the fisheries sector, which is an important water user, and in few instances can also be a water supplier.
Aquaculture can be a water supplier as it can supply aquaculture wastewater to sewerage activities, but is also a water user often abstracting water directly from the environment without the intermediation of the water supply industry.
Fishing is a water user of the environmental water flow that supports fish’s life cycle and consequently allows the reproduction of fish stocks.
This matrix could account for both in-stream and off-stream water use of the fisheries sector with the following adjustments:
Inserting the environment as unit of origin and destination;
Measuring the in-stream water use of fishing and cage as environmental water flow.
The environmental water flow is defined by the quantity, quality and timing of water flows required to sustain freshwater and estuarine ecosystems and the human livelihoods and well-being that depend on them.32 From the perspective of the fisheries sector, the environmental water flow that enables the activities of the sector is the water flow that supports the life cycle of fish species and other aquatic organisms.
32 The Brisbane Declaration (2007).
TABLE 14Matrix of flows of water within the economy
USERS Industries by ISIC category
Hou
seho
lds
Rest of the world
Supply of water to other economic units
SUPPLIERS
1-3 5-33, 41-43 35 36 37 38, 39,
45-99 Total
Industries by ISIC category
1-3
5-33, 41-43
35
36
37
38, 39, 45-99
Total
Households
Rest of the world
Use of water received from other economic units
Source: SEEA-Water § Table 3.43.

Lessons learned in water accounting: the fisheries and aquaculture perspective in the SEEA framework48
There are several methods to estimate the environmental water flow. Hydrology-based methods are the most simple to implement as they primarily use time series of monthly or daily flow records (Tharme, 2003). Within river hydrology different water flows enable different ecological processes (Postel and Ritcher, 2003):
Low (base) environmental water flow can maintain suitable water temperatures, dissolved oxygen and water chemistry, and consequently provide adequate habitat for aquatic organisms. A low base water regime can enable fish to move to feeding and spawning areas within the surface water. However, when the low base flow decreases from the normal level to the drought level, this can hamper fish reproduction as well as fish survival.
High (flooding) environmental water flow enables fish not only to reproduce within to surface water but also to spawn on floodplains, which also represent nursery areas for fish juveniles.
Therefore, the environmental water flow suitable for the fisheries sector would be constituted by the high (flooding) environmental water flow, which is key for the migration and reproduction of many fish species.
The difference occurring between the low (base) environmental water flow and the high (flooding) environmental water flow implies that the assessment of the environmental water flow derived as the long-term mean annual runoff reserved for environmental purposes may not suffice, as interannual as well as seasonal variations can play a major role in the maintenance of aquatic ecosystems. Therefore, the environmental water flow33 can be used to account for the water regime that sustains freshwater and estuarine ecosystems, preserving fish habitats and reproduction, and consequently account for the in-stream water use of the fisheries sector, considering the following:
For accounting purposes, the in-stream water use of the fisheries sector should be quantified as abstractions = returns = environmental water flow.
As environmental water flow is different according to watershed, an assessment at the watershed level or units subunits would be highly recommended.
As the environmental water flow can vary seasonally, it is advisable to represent the in-stream water requirements of the fisheries sector as the high flooding environmental water flow.
As the high flooding environmental flow can vary annually, a time-series analysis associated to fish catch and fish catch effort can provide an indication on the minimum threshold that enables fish migration and reproduction and, with due time lag, an increase in fish-water productivity.
Accounting for the water flow of aquaculture activities will differ depending culture methods:
Off-stream water use (pond aquaculture, RAS) can be described by abstractions and returns due to the aquaculture operations.
In-stream water use (cage and pen aquaculture) can be described by the environmental water flow supporting the freshwater and estuarine ecosystems where aquaculture facilities are placed.
33 Environmental water flow is the water regime provided within a river, wetland or coastal zone to maintain ecosystems and their benefits where there are competing water uses and where flows are regulated (Dyson et al., 2003).

49SEEA water accounting for water volumes
Importance of water returns for water management and sustainable useThe supply and use water account places more emphasis on water abstractions than water returns. In fact, water returns are often estimated as the difference between abstracted and consumed water. However, it is important to distinguish whether water is returned to either surface water, to soil water or to the sea. If water abstracted from surface waters is returned to the sea, even there is no water consumption, the total amount of freshwater available for human needs, economic activities and freshwater ecosystems is actually reduced. Water abstracted from surface waters and returned to soil will ultimately return to surface water and/or groundwater, unless it does evaporate and is transported in other locations, thus is lost by the catchment basin. In any case, the water withdrawal can cause a decrease in the environmental water flow that sustains surface waters, which may have a direct impact on activities of the fisheries sector.
Returns to the environment could be disaggregated into returns to surface water, returns to the soil and returns to the aquifers and explicitly distinguish returns to the sea.
Another point to consider is that the supply and use water account considers water quantity but not changes in water quality.
Within the SEEA framework, there is also a water emission account, which records the quantity in terms of mass (kilograms or tonnes) of substances (i.e. emissions) released to water resources as a result of production, consumption and accumulation processes during an accounting period (SEEA-CF § 3.270). In the water emission account, emissions such as suspended solids, nitrogen, phosphorus, heavy metals and organic matter are generated by households and industries and are collected by the sewerage industry for treatment and subsequent release to the environment (SEEA- CF § Table 3.8).
Information from the supply and use water account could be combined with information from the water emission account.
It would be interesting to have a supplementary table that compares the abstraction and returns of different economic units, where returns are accounted as the sum of real volumes returned to the environment and estimated volumes of water needed to dilute pollutant concentration of returns water to agreed water quality standards (i.e. grey water).

51
6. SEEA accounting for ecosystems
SEEA-EEA ACCOUNTING APPROACHThe SEEA-EEA is a complementary system to the SEEA-CF that aims to describe a broader role of the environment for human survival, health and well-being. The SEEA-EEA goes beyond the accounting of individual environmental assets and seeks to provide an assessment of the multifunctionality of ecosystems.
Ecosystems provide an array of diversified benefits to society in terms of provisioning, regulating and cultural services. The SEEA-EEA considers ecosystem assets (i.e. stocks) and ecosystem services (i.e. flows) and suggests three types of ecosystem accounts: (i) to evaluate the extent and conditions of an ecosystem; (ii) to assess eventual changes in the ecosystem conditions; and (iii) to measure the flows of ecosystem services.
In order to account for ecosystem and ecosystem services, the SEEA-EEA uses a spatial-explicit accounting approach. The landscape is first divided into basic spatial units (BSUs), usually cells of a grid overlaid on the territory’s map. The BSUs are aggregated into Land Cover Ecosystem functional Units (LCEUs), which are the functional unit of the Ecosystem Accounting Unit (EAU). The extent and type of the EAU is usually defined based on the scope of the analysis, and is generally an area of interest in assessing change of conditions over time. Hierarchy of different EAUs (e.g. watershed, provincial administrative unit, regional administrative unit, national country area, etc.) can also be used in SEEA-EEA accounting. A GIS platform is essential to support SEEA-EEA accounting and integrate information across the nested spatial scales (BSU, LCEU, EAU, national level).
SEEA-EEA ACCOUNT FOR ECOSYSTEMS AND ECOSYSTEM SERVICESThe first account of the SEEA-EEA is designed to estimate the size and conditions of the ecosystem (Table 15). Ecosystem extent refers to the surface area covered by an ecosystem. Depending on the ecosystem, there is great variation in size and in the degree of complexity. Some ecosystems are only related to one land cover class, while others may contain multiple different land cover classes. The SEEA-EEA considers land cover classes as (LCEUs) and compiles their size and conditions separately.
KEY MESSAGESEEA Experimental Ecosystem Accounting (SEEA-EEA)
The SEEA-EEA has a unique approach as it:• Goes beyond accounting for individual environmental assets. • Provides evidence of multifunctionality of ecosystems.• Uses a spatial-explicit accounting approach, which considers a nested hierarchy
among: basic spatial units (BSUs), Land Cover Ecosystem functional Units (LCEUs), Ecosystem Accounting Unit (EAU), and the national level.
SEEA-EEA accounts for ecosystem assets (i.e. stocks) and ecosystem services (i.e. flows):• Ecosystem assets are assessed in terms of their extent and conditions.• Ecosystem services are assessed in terms of provisioning, regulating, cultural
ecosystem services.

Lessons learned in water accounting: the fisheries and aquaculture perspective in the SEEA framework52
The extent of each land cover class can be obtained by land cover mapping. When an ecosystem is composed of several LCEUs, the ecosystem extent becomes the sum of the LCEU areas (Table 15).
Ecosystem conditions are described in terms of quantity and quality of key characteristics of the ecosystem. The SEEA-EEA suggests considering five main characteristics: vegetation, biodiversity, soil, water and carbon. These five characteristics correspond also to environmental asset accounts in the SEEA-CF. However, in the SEEA-CF, these environmental assets are considered in isolation and are assessed at the national level. In the SEEA-EEA, vegetation, biodiversity, soil, water and carbon are considered together as characteristics of a system and assessed first at the level of LCEUs and then of ecosystems.
In the structure of this account there are two points to note: first, water has dual role, one as a part of LCEUs and the other as one of the five characteristics to assess ecosystem conditions. Second, the SEEA-EEA considers biodiversity34 as characteristics to describe a condition of ecosystem, not as a supporting ecosystem service as suggested by the Millennium Ecosystem Assessment (MEA, 2005).
The account is based on three assumptions. First, all ecosystems are associated to specific land cover classes. Second, ecosystem conditions can be properly assessed through their descriptive attributes. Third, conditions of LCEUs can be aggregated within the same EAU. The first two assumptions are related to the design of the account, while the third assumption is related to how the account is operationalized. In fact, the account of ecosystem extent and conditions should include not only a representative value but also a measure the heterogeneity (variability) of ecosystem conditions found within the EAU. For example, if the EAU is set at the watershed level, the ecosystem account reports aggregated values by LCEU types of selected indicators measuring vegetation, soil, biodiversity, carbon and water characteristics.
This type of aggregation requires a robust sampling design, which should measure conditions in different patches/units of the EAU composed, for example, by forest patches within the EAU or several lakes and rivers within the EAU. If a mean value is computed to represent a water characteristic, such as the amount of suspended sediments in lakes and rivers, at the EAU level, then the standard deviation can be computed to reflect the variety of conditions found within the EAU.
The second type of account of the SEEA-EEA describes the changes in ecosystem conditions within an accounting period (Table 16), through assessing change in conditions of each single LCEU constituting the ecosystem. Conditions are measured
34 Biodiversity is defined by the Convention on Biological Diversity as “the variability among living organisms from all sources including, inter alia , terrestrial, marine and other aquatic ecosystems and the ecological complexes of which they are part; this includes diversity within species, between species and of ecosystems” (United Nations, 1992, Article 2).
TABLE 15Structure of SEEA-EEA account to assess ecosystem extent and conditions
LCEU1 classes Ecosystem extent
Characteristics
Vegetation Biodiversity Soil Water Carbon
Forest tree cover
Agricultural land
Urban and associated developed areas
Open wetlands
(etc.)
Note: 1 Land Cover Ecosystem functional Unit (LCEU).
Source: SEEA-EEA § Table 2.3.
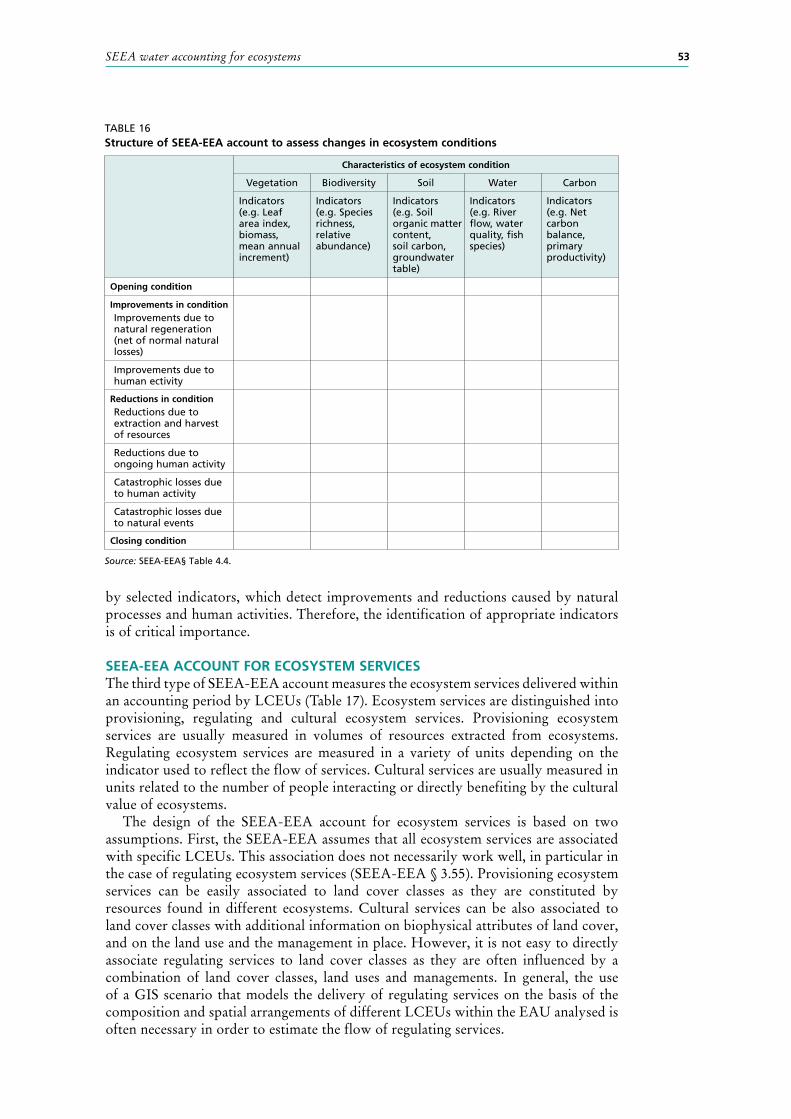
53SEEA water accounting for ecosystems
by selected indicators, which detect improvements and reductions caused by natural processes and human activities. Therefore, the identification of appropriate indicators is of critical importance.
SEEA-EEA ACCOUNT FOR ECOSYSTEM SERVICESThe third type of SEEA-EEA account measures the ecosystem services delivered within an accounting period by LCEUs (Table 17). Ecosystem services are distinguished into provisioning, regulating and cultural ecosystem services. Provisioning ecosystem services are usually measured in volumes of resources extracted from ecosystems. Regulating ecosystem services are measured in a variety of units depending on the indicator used to reflect the flow of services. Cultural services are usually measured in units related to the number of people interacting or directly benefiting by the cultural value of ecosystems.
The design of the SEEA-EEA account for ecosystem services is based on two assumptions. First, the SEEA-EEA assumes that all ecosystem services are associated with specific LCEUs. This association does not necessarily work well, in particular in the case of regulating ecosystem services (SEEA-EEA § 3.55). Provisioning ecosystem services can be easily associated to land cover classes as they are constituted by resources found in different ecosystems. Cultural services can be also associated to land cover classes with additional information on biophysical attributes of land cover, and on the land use and the management in place. However, it is not easy to directly associate regulating services to land cover classes as they are often influenced by a combination of land cover classes, land uses and managements. In general, the use of a GIS scenario that models the delivery of regulating services on the basis of the composition and spatial arrangements of different LCEUs within the EAU analysed is often necessary in order to estimate the flow of regulating services.
TABLE 16Structure of SEEA-EEA account to assess changes in ecosystem conditions
Characteristics of ecosystem condition
Vegetation Biodiversity Soil Water Carbon
Indicators (e.g. Leaf area index, biomass, mean annual increment)
Indicators (e.g. Species richness, relative abundance)
Indicators (e.g. Soil organic matter content, soil carbon, groundwater table)
Indicators (e.g. River flow, water quality, fish species)
Indicators (e.g. Net carbon balance, primary productivity)
Opening condition
Improvements in conditionImprovements due to natural regeneration (net of normal natural losses)
Improvements due to human ectivity
Reductions in conditionReductions due to extraction and harvest of resources
Reductions due to ongoing human activity
Catastrophic losses due to human activity
Catastrophic losses due to natural events
Closing condition
Source: SEEA-EEA§ Table 4.4.
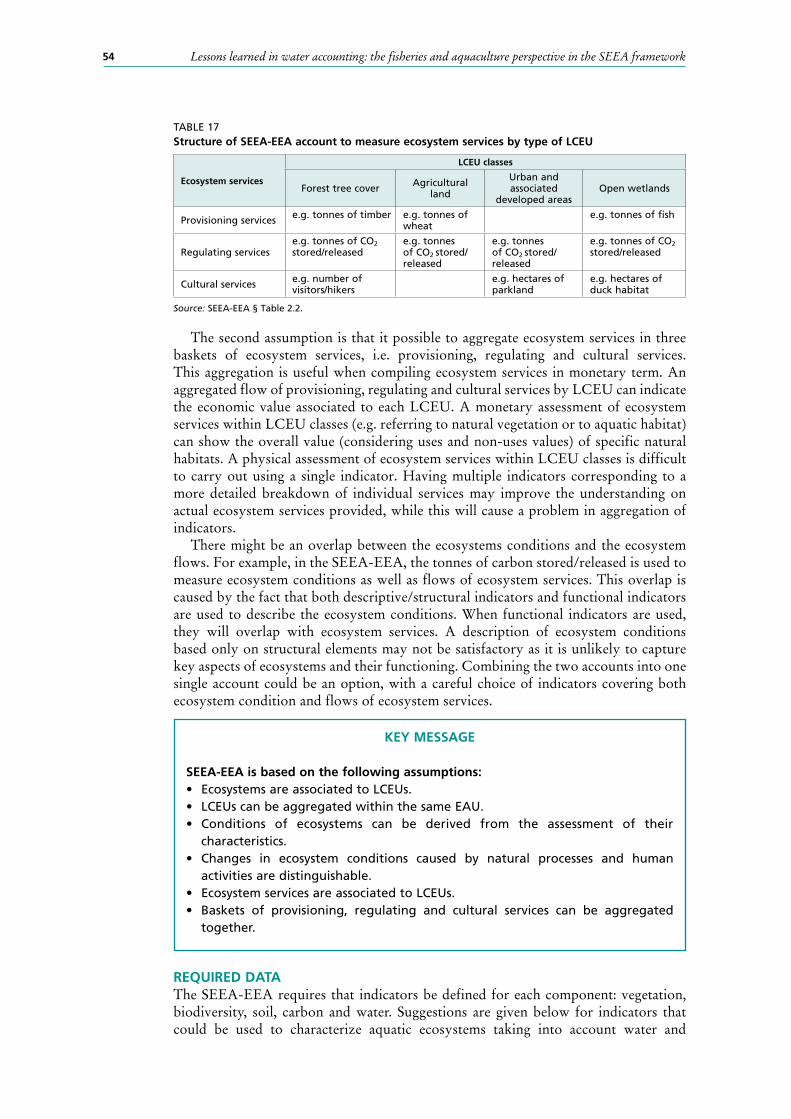
Lessons learned in water accounting: the fisheries and aquaculture perspective in the SEEA framework54
The second assumption is that it possible to aggregate ecosystem services in three baskets of ecosystem services, i.e. provisioning, regulating and cultural services. This aggregation is useful when compiling ecosystem services in monetary term. An aggregated flow of provisioning, regulating and cultural services by LCEU can indicate the economic value associated to each LCEU. A monetary assessment of ecosystem services within LCEU classes (e.g. referring to natural vegetation or to aquatic habitat) can show the overall value (considering uses and non-uses values) of specific natural habitats. A physical assessment of ecosystem services within LCEU classes is difficult to carry out using a single indicator. Having multiple indicators corresponding to a more detailed breakdown of individual services may improve the understanding on actual ecosystem services provided, while this will cause a problem in aggregation of indicators.
There might be an overlap between the ecosystems conditions and the ecosystem flows. For example, in the SEEA-EEA, the tonnes of carbon stored/released is used to measure ecosystem conditions as well as flows of ecosystem services. This overlap is caused by the fact that both descriptive/structural indicators and functional indicators are used to describe the ecosystem conditions. When functional indicators are used, they will overlap with ecosystem services. A description of ecosystem conditions based only on structural elements may not be satisfactory as it is unlikely to capture key aspects of ecosystems and their functioning. Combining the two accounts into one single account could be an option, with a careful choice of indicators covering both ecosystem condition and flows of ecosystem services.
REQUIRED DATAThe SEEA-EEA requires that indicators be defined for each component: vegetation, biodiversity, soil, carbon and water. Suggestions are given below for indicators that could be used to characterize aquatic ecosystems taking into account water and
KEY MESSAGE
SEEA-EEA is based on the following assumptions:• Ecosystems are associated to LCEUs.• LCEUs can be aggregated within the same EAU.• Conditions of ecosystems can be derived from the assessment of their
characteristics.• Changes in ecosystem conditions caused by natural processes and human
activities are distinguishable.• Ecosystem services are associated to LCEUs.• Baskets of provisioning, regulating and cultural services can be aggregated
together.
TABLE 17Structure of SEEA-EEA account to measure ecosystem services by type of LCEU
Ecosystem services
LCEU classes
Forest tree cover Agricultural land
Urban and associated
developed areasOpen wetlands
Provisioning services e.g. tonnes of timber e.g. tonnes of wheat
e.g. tonnes of fish
Regulating servicese.g. tonnes of CO2 stored/released
e.g. tonnes of CO2 stored/released
e.g. tonnes of CO2 stored/released
e.g. tonnes of CO2 stored/released
Cultural services e.g. number of visitors/hikers
e.g. hectares of parkland
e.g. hectares of duck habitat
Source: SEEA-EEA § Table 2.2.
55SEEA water accounting for ecosystems
non-water components. In particular, these indicators are suggested for evaluating conditions of aquatic ecosystems as fish habitats, which are key for the fisheries sector.
• Water component: - Indicator assessing the water runoff generated by endogenous precipitations and
eventually inflowing from neighbouring countries. - Indicator assessing water depth recorded during the dry season. - Indicator assessing the area of seasonal flooding recorded during the wet season. - Indicator assessing some chemical properties of water (e.g. nitrogen, phosphorus,
heavy metals, BOD/COD35).• Biodiversity: considers indicators on the status of fish stocks and the maintenance
of trophic webs in the aquatic ecosystem. - Indicator assessing the occurrence and/or abundance of sentinel aquatic species. - Indicator assessing the occurrence and/or abundance of fish species and aquatic
organisms targeted by fishing activities. - Indicator assessing the complexity of trophic webs of aquatic ecosystems,
including the occurrence of large predatory fish species that are often targeted by fishing.
• Soil: - Indicator assessing the soil composition of the aquatic ecosystems. - Indicator assessing the sediment load in water.
• Carbon: - Indicator assessing the amount of chlorophyll produced in aquatic ecosystems. - Indicator assessing the amount of soil organic carbon. - Indicator assessing the emissions associated to the clearance of forest standing
stock - Indicator assessing greenhouse gas (GHG) emissions associated to the clearance
of forest standing stock. - Indicator assessing GHG emissions associated with conversion and drainage of
coastal wetland soils.• Vegetation: both for aquatic vegetation and for riparian vegetation surrounding
the aquatic ecosystems need to be considered. - Indicator assessing the cover of riparian vegetation on river banks and edge of
waterbodies. - Indicator assessing the cover of aquatic floating vegetation. - Indicators assessing the cover of mangrove forest.
Indicators can be chosen to highlight aspects that will be important for water and fishery management. Some indicators could be used to provide a proxy of water-related regulating ecosystem services such as carbon sequestration, water purification, and sediment control.
GLOBALLY AVAILABLE DATA FOR ACCOUNT COMPILATIONIn 2011, the European Union (Member Organization) (EU) adopted the Biodiversity Strategy to 2020, which aims to halting the loss of biodiversity and the degradation of ecosystem services in the EU by 2020 (European Commission, 2011). This required EU Member States with the assistance of the EU to map ecosystems and ecosystem services.
Under this directive, the Mapping and Assessment of Ecosystems and their Services (MAES) initiative produced a mapping of eight types of ecosystems36 with a geographical coverage of the EU 28 at a scale of 1:100 000 based on the 44 classes of the Corine Land
35 BOD (biological oxygen demand) and COD (chemical oxygen demand) are measures of substances that have an unfavourable influence on the oxygen balance.
36 The ecosystems mapped by MAES include: urban, croplands, grassland, woodland and forest, heathland and shrub, sparsely vegetated land, wetlands, rivers and lakes.

Lessons learned in water accounting: the fisheries and aquaculture perspective in the SEEA framework56
Cover (Maes et al., 2013; Maes et al, 2015). In parallel, the mapping and modelling of ecosystem services at European scale has been implemented in ESTIMAP to represent some cultural and regulating ecosystem services such as outdoor recreation (Maes et al., 2011; Paracchini et al., 2014), crop pollination (Zulian, Maes and Paracchini, 2013), coastal protection (Liquete et al., 2013) and air quality regulation (Zulian, Polce and Maes, 2014). In addition, under the MAES initiative, 30 different indicators were mapped at a resolution of 10 km to represent the trend in conditions of 12 groups of ecosystem services identified by the CICES (Maes et al, 2015).
ADDITIONAL CONSIDERATIONS AND SUGGESTIONSThe SEEA-EEA is in an experimental phase and exploring the proper design and methodological approach. However, some advances already made in water accounting of the SEEA-EEA framework can enrich the water accounting approach in the SEEA-CF and SEEA-Water
Interactions and feedbacks loops among ecosystem servicesIn the SEEA-EEA, three types of ecosystem services – provisioning, regulatory and cultural – are considered as independent, and interactions among them are not highlighted. Ecosystem services are highly interconnected and interdependent. Provisioning and cultural ecosystem services are directly dependent on the delivery of regulating ecosystem services. When regulating ecosystem services are disrupted, the condition and functioning of the ecosystem will deteriorate and direct repercussions occur in provisioning and cultural ecosystem services (Balvanera et al., 2006; Bennett, Peterson and Gordon, 2009; Ottaviani and El Hage Scialabba, 2011).
A GIS–based model analysing and displaying the interactions among ecosystem services will be useful as a supporting tool of the ecosystem services accounts.
There are several GIS-based tools to model ecosystem services and their interactions, for example: Invest37 (Tallis et al., 2010), ARIES38 (Villa, Athanasiadis and Rizzoli 2009; Villa, 2010; Villa et al., 2014), SWAT39 2000 (Arnold and Fohrer, 2005), KINEROS240/AGWA41 (Goodrich et al., 2012).
Management as a fundamental element between land cover and ecosystem deliveryThe SEEA-EEA links land cover classes, conditions and ecosystem services. However, the same land cover class can deliver different ecosystem services according to the different management in place. Management and management practices are associated to areas within land cover classes, and management practices cannot always be detected with land cover mapping. For example, a land cover class constituted by “Medium to large fields rainfed herbaceous cropland” (SEEA-EEA § Table 2.1), according to the management practice in place, aimed at minimizing raindrop impact, enhancing water infiltration rate in the soil, or minimizing water runoffs, will provide a different flow of ecosystem services related to prevention of soil erosion and sediment control.
Ecosystem services accounts should be considered as a function of both land cover class and types of management in place in different locations within the EAU.
37 Integrated Valuation of Ecosystem Services and Tradeoffs.38 Artificial Intelligence for Ecosystem Services modelling.39 Soil and Water Assessment Tool.40 KINematic runoff and EROSion.41 ArcGIS-based Automated Geospatial Watershed Assessment tool.
57SEEA water accounting for ecosystems
Uncertainty in the measurement and prediction of ecosystem services deliveryEcosystems are complex systems, and the assessment of ecosystem services is subject to high degrees of uncertainty that are not usually considered in the SEEA accounting framework. The high level of complexity in assessing ecosystem services and their interactions and feedback loops raises the need for:
a GIS-based modelling of ecosystem services – useful for producing scenarios in the face of existing high uncertainty;
precautionary principle accounting – should depict scenarios for unexpected and adverse outcomes of ecosystem services delivery.
The precautionary principle states that if an action or policy has a suspected risk of causing harm to the public or to the environment, in the absence of scientific consensus that the action or policy is harmful, the burden of proof that it is not harmful falls on those taking an action. According to the Rio Declaration, in order to protect the environment, the precautionary approach shall be widely applied by States according to their capabilities. Where there are threats of serious or irreversible damage, lack of full scientific certainty shall not be used as a reason for postponing cost-effective measures to prevent environmental degradation (UNECE, 1992).
Use the watershed level as a fundamental accounting unit In the SEEA-EEA, the watershed is one of the suggested EAUs. In fact, the watershed is not only a fundamental accounting unit in water management (SEEA-Water § 2.87) but it is also often appropriate for the assessment of ecosystems and ecosystem services. Many water-related ecosystem services such as water provision, groundwater recharge, water purification and flood regulation are based on ecosystem structures and processes that occur at the watershed scale (Nedkov, Boyanova and Burkhard, 2015). Moreover, ecosystem services related to erosion processes and sedimentation control as well as nutrient regulation are driven by processes occurring at the watershed scale. In addition, depending on the species-specific scale of habitat use, the watershed scale can be appropriate for measuring some characteristics of biodiversity such as habitat fragmentation and associated viability of aquatic and terrestrial animal populations.
The watershed scale can also be suitable for measuring water-related provisioning services and cultural services (such as recreation and tourism, natural heritage and biodiversity, religion and cultural identity, landscape aesthetic amenity and inspiration) as upstream and downstream areas, land and water management, water quantity and water quality are interconnected within the same watershed, and ecosystem conditions will strongly influence the delivery of ecosystem services.
Using ecosystem accounting to move beyond simple water budgetThe SEEA-EEA offers a great opportunity to enlarge the scope of water accounting into an integrating ecosystem-based framework. The water accounting of the SEEA-CF and SEEA-Water is based on water budgets, resulting from existing water stocks and flows exchanged between the environment and economy. Moreover, there is no
KEY MESSAGE
Further research areas include:• Interactions and feedbacks loops among ecosystem services.• Uncertainty in the unexpected and adverse outcomes of ecosystem services
delivery.
Lessons learned in water accounting: the fisheries and aquaculture perspective in the SEEA framework58
methodology in place to combine the accounts related to water areas and accounts related to water volumes into one unique account.
As the SEEA-EEA considers the watershed as a main ecosystem accounting unit and endorses the use of a GIS-based approach for account compilation, the SEEA-EEA offers the opportunity to combine water accounting related to water areas with water accounting related to water volume within the SEEA account of ecosystem extent and conditions.
In order to make this possible:
The EAU can be set at the watershed level, defined by an appropriate scale of analysis.
The LCEUs can be described using the SEEA-CF land cover classification42 given the full description of the land cover classes and the inclusion of a higher number of aquatic land cover classes. The breakdown of “Inland waters” into its subclasses (such as lakes and rivers) is recommended as suggested in Chapter 4.
The LCEUs can be used to measure the areas occupied by “Inland waters” and “Seasonally flooded areas”.
Indicators depicting water characteristics (within the SEEA-EEA account of ecosystem extent and conditions) can be selected to measure the water runoff generated by endogenous precipitations and eventually inflowing from neighbouring countries (i.e. renewable surface water).
Indicators depicting vegetation, carbon, soil and biodiversity characteristics (within the SEEA-EEA account of ecosystem extent and conditions) can be selected to measure positive and negative impacts on water resources in an integrated terrestrial–aquatic system.
42 Currently, the SEEA-EEA land cover classification (SEEA-EEA § Table 2.1) is different from the SEEA land cover classification (SEEA-CF § Appendix I C), and a harmonization is needed.
KEY MESSAGE
SEEA-EEA approach can improve water accounting by:• Using the watershed level as a fundamental accounting unit.• Combining water accounting of water areas and water volumes into one single
account.• Measuring positive and negative impacts on water resources using an integrated
terrestrial–aquatic system.

59
7. Conclusions
The fisheries sector uses water resources in two different ways. Fishing and cage aquaculture have an in-stream water use as they use water on-site. They do not abstract and do not consume water but they are indissolubly dependent on the availability of surface waters as fish habitats. Pond, tank aquaculture, RAS and horizontal raceways have an off-stream water use, as water is initially abstracted from the natural environment to create a culture environment, which according to the aquaculture method used can require different amounts of water additions during the production cycle.
This document has analysed the SEEA accounting framework to explore its suitability for describing water use by the fisheries sector. The investigation has revealed that the SEEA accounting framework has been mainly developed for monitoring off-stream water uses in terms of water volumes abstracted and consumed.
The current limited capacity of the SEEA accounting framework to measure in-stream water use raises some concerns in the way in which the water requirements and needs of economic activities with an in-stream water use can be represented in national water accounting. Several economic activities, including fishing and cage culture, have an in-stream water uses, and, due to their nature, in-stream water uses tend to overlap with one another as well as with off-stream water uses. In the SEEA water accounting system, it is important to develop methodologies and indicators to evaluate water resource needs for in-stream water use and to compare those with off-stream water use. Some suggestions toward this direction, relating to the fisheries sector, are shown below as possible methodological approaches.
A first approach is to further develop the methodology of SEEA accounts for water areas. All in-stream water uses are dependent on the availability of surface waters. In the SEEA framework, the availability of surface waters is currently assessed in the SEEA land cover account, while the use of surface waters is assessed in the SEEA land use account. Currently, the SEEA accounting framework measures in-stream water use as the water area clearly delimited for a specific use such as aquaculture cages and areas for conservation purpose (i.e. single-purpose water use) while it gathers together all in-stream water uses that tend to overlap in space and time. The criterion of “exclusive use” used in SEEA is not adequate to describe all in-stream water use as many in-stream water uses tend to overlap as multipurpose water uses. A specific methodology needs to be developed to account for not only single-purpose but also multipurpose in-stream water uses. This would require making each in-stream water use spatially explicit and the use of a GIS-based approach to assess overlaps in space and time. In such an accounting framework, the in-stream water use of fishing and cage or pen aquaculture could be compared with other in-stream water uses and the degree of compatibility or competition assessed.
A second approach is to define a way to measure the water volume required for the in-stream water use in a comparable way to the off-stream use. One possible suggestion is to quantify the amount of water needed by in-stream activities of the fisheries sector as the “environmental water flow” required for the maintenance of aquatic ecosystems where activities of the sector take place. The environmental flows describes the quantity, quality and timing of water flows required to sustain freshwater and estuarine ecosystems and the human livelihoods and well-being that depend on them. From the perspective of the fisheries sector, the environmental water flow that enables the activities of the sector is the water flow that supports the life cycle of fish
Lessons learned in water accounting: the fisheries and aquaculture perspective in the SEEA framework60
species and other aquatic organisms. Therefore, the environmental water flow suitable for the fisheries sector is the water regime that feeds surface waters but enables also seasonal flooding, which is for the migration and reproduction of many fish species. For accounting purposes, the environmental water flow could be “virtually” abstracted and returned by capture fisheries and cage aquaculture with, consequently, no water consumption.
The assessment of the environmental water flow requires water accounting at the watershed level, and with attention to possible seasonality of availability of water resources. A third approach is to further develop the SEEA-EEA related to ecosystem accounting. In-stream and off-stream water uses by economic activities will cause changes in both the quantity and quality of ecosystem conditions and their capacity to deliver ecosystem services. The assessment of conditions influencing the availability of water resources and their quality is a major gap in water accounting.
The main benefit of developing SEEA-EEA is to move from simple water budgets to integrated evaluation of various aspects of the aquatic ecosystem and interactions surrounding it. In the perspective of the fisheries sector, ecosystem accounting can be used to describe the occurrence of fish species, the environmental water flow needed to support aquatic ecosystems, and chemical and physical characteristic of water and surrounding land areas. All of them can be linked with associated fishing and aquaculture activities, other economic activities that have access to the ecosystem, and impacts of terrestrial and aquatic management actions. Ecosystem accounting has great potential to account for the multifunctionality of aquatic ecosystems and support integrated water management among different economic sectors.
REFERENCESAllen, R.G., Pereira, L.S., Raes, D. & Smith, M. 1998. Crop evapotranspiration. Guidelines
for computing crop water requirements. FAO Irrigation and Drainage Paper No. 56. Rome, FAO. (also available at www.fao.org/docrep/x0490e/x0490e00.htm#Contents).
Arnold, J.G. & Fohrer, N. 2005. SWAT2000: current capabilities and research opportunities in applied watershed modeling. Hydrological processes, 19: 563–572.
Baranzelli, C., Perpiña Castillo, C., Lavalle, C., Pilli, R. & Fiorese, G. 2014. Evaluation of the land demands for the production of food, feed and energy in the updated Reference Configuration 2014 of the LUISA modelling platform. JRC Technical Paper. Luxembourg, European Union.
Batista e Silva, F., Lavalle, C. & Koomen, E. 2013. A procedure to obtain a refined European land use/cover map. Journal of Land Use Science, 8: 255–283.
Balvanera, P., Pfisterer, A.B., Buchmann, N., Jing-Shen He, Nakashizuka, T., Raffaelli, D. & Schmid, B. 2006. Quantifying the evidence for biodiversity effects on ecosystem functioning and services. Ecology Letters, 9: 1146–1156.
Bennett, E.M., Peterson, G.D. & Gordon, L.J. 2009. Understanding relationships amongst multiple ecosystem services. Ecology Letters, 12: 1394–1404.
Brummett, R.E. 2006. Role of Aquaculture in Increasing Water Productivity. Challenge Program on Water and Food - Aquatic Ecosystems and Fisheries Review Series 4. Theme 3 of CPWF. Cairo, Worldfish Center. 23 pp.
Center for Sustainability and the Global Environment (SAGE). 2014. Global River Discharge Database. www.sage.wisc.edu/riverdata/last access: 12 March 2014.
Channan, S., Collins, K. & Emanuel, W.R. 2014. Global mosaics of the standard MODIS land cover type data. College Park, USA, University of Maryland and the Pacific Northwest National Laboratory.
Cowardin, L.M., Carter, V., Golet, F.C. & LaRoe, E.T. 1979. Classification of wetlands and deepwater habitats of the United States. Washington, DC, Office of Biological Services, Fish and Wildlife Services, U.S. Department of the Interior.
61Conclusions
Di Gregorio A. 2005. Land cover classification system: classification concepts and user manual: LCCS Software version 2. Environment and Natural Resource Series No. 8. Rome, FAO.
Di Gregorio A. (forthcoming). Land cover classification system: classification concepts and user manual: LCCS Software version 3. Rome, FAO.
Di Gregorio, A. & Jansen, L.J. 1998. Land Cover Classification System (LCCS): classification concepts and user manual. Rome, East Africa Project and Soil Resources, Management and Conservation Service FAO.
Dyson M., Bergkamp G., Scanlon J. (eds). 2003. Flow. The essential of environmental flows. IUCN, Gland, Swizerland and Cambridge, UK. Xiv +118 pp
European Commission. 2011. Our life insurance, our natural capital: an EU biodiversity strategy to 2020. Communication from the commission to the European parliament, the council, the economic and social committee and the committee of the regions. COM(2011) 244 final. Brussels.
European Commission, Organisation for Economic Co-operation and Development, United Nations & World Bank, 2013. System of Environmental-Economic Accounting 2012. Experimental Ecosystem Accounting.
FAO. 2015a. Towards a System of Environmental-Economic Accounting 2015: Agriculture, Forestry and Fisheries. Rome, FAO. 137 pp (available at www.gsars.org/system-of-environmental-economic-accounting-2015).
FAO. 2015b. Efforts towards improving aquaculture data, information and statistics: the past, present and future: for discussion and decision [online]. Sub-Committee on Aquaculture, Brazil, 5–9 October 2015. [Cited 28 April 2016]. www.fao.org/cofi/43580-0bc01f6e07004979f217e2d1b82e52e50.pdf
Friedl, M.A., Sulla-Menashe, D., Tan, B., Schneider, A., Ramankutty, N., Sibley, A. & Huang, X. 2010. MODIS Collection 5 global land cover: Algorithm refinements and characterization of new datasets, 2001-2012. Collection 5.1 IGBP Land Cover. Boston, USA, Boston University.
Goodrich, D.C., Bums, I.S., Unkrich, C.L., Semmens, D.J., Guertin, D.P., Hernandez, M., Yatheendradas, S., Kennedy, J.R. & Levick, L.R. 2012. KINEROS2/AGWA: Model use, calibration, and validation. Transactions of the ASABE 55, 4: 1561–1574.
Hagen, M., Kissling, W.D., Rasmussen, C., Carstensen, D.W., Dupont, Y.L., Kaiser-Bunbury, C.N., Ledger, M.E., Maia, K.P., Darcie Marquitti, F.M., Mclaughlin, O., Morellato, L.P.C., O’Gorman, E.J., Trøjelsgaard, K., Tylianakis, J.M., Morais Vidal, M., Woodward, G. & Olesen, J.M. 2012. Biodiversity, species interactions and ecological networks in a fragmented world. Advances in Ecological Research, 46: 89–120.
Hoekstra, A.Y., ed. 2003. Virtual water trade. Proceedings of the international expert meeting on virtual water trade, February 2003. Delft, Netherlands, IHE.
Hoogeveen, J., Faurès, J.-M., Peiser, L., Burke, J. & van de Giesen, N. 2015. GlobWat – a global water balance model to assess water use in irrigated agriculture. Hydrol. Earth Syst. Sci. Discuss., 12: 801–838.
Horton, R.E. 1947. Erosional development of streams and their drainage basins: hydrophysical approach to quantitative morphology. Geological Society of America Bulletin, 56: 275–370.
Huntington, T.C. & Hasan, M.R. 2009. Fish as feed inputs for aquaculture – practices, sustainability and implications: a global synthesis. In M.R. Hasan & M. Halwart, eds. Fish as feed inputs for aquaculture: practices, sustainability and implications, pp. 1–6. FAO Fisheries and Aquaculture Technical Paper No. 518. Rome, FAO. 407 pp. (also available at www.fao.org/3/a-i1140e.pdf).
Karimi, P., Bastiaanssen, W.G.M., Sood, A., Hoogeveen, J., Peiser, L., Bastidas-Obando, E. & Dos, R.J. 2015. Spatial evapotranspiration, rainfall and land use data in water accounting – Part 2: Reliability of water accounting results for policy decisions in the Awash Basin. Hydrological Earth System Science, 19: 533–550.

Lessons learned in water accounting: the fisheries and aquaculture perspective in the SEEA framework62
Kapetsky, J.M. & Barg, U. no date. Land quality indicators from the viewpoint of inland fisheries and aquaculture. Rome, FAO. (also available at www.fao.org/docrep/W4745E/w4745e0e.htm).
Kohli, A. & Frenken, K. 2015. Renewable Water Resources Assessment – 2015 AQUASTAT methodology review Elimination of ‘actual’ versus ‘natural’ flow distinction and simplification of border flow accounting. FAO Aquastat Report. Rome, FAO. 8 pp. (also available at www.fao.org/nr/water/aquastat/catalogues/AQ_WR_methodology_review_2015_eng.pdf).
Kohli, A., Frenken, K. & Spottorno, C. 2010. Disambiguation of water use statistics. FAO Aquastat Report. Rome, FAO. 7 pp. (also available at www.fao.org/nr/water/aquastat/catalogues/Water_Terminology_20120523.pdf).
Latham, J., Cumani, R., Rosati, I. & Bloise, M. 2014. Global Land Cover SHARE (GLC-SHARE) database Beta-Release Version 1.0 – 2014. (also available at www.fao.org/uploads/media/glc-share-doc.pdf).
Liquete, C., Zulian, G., Delgado, I., Stips, A. & Maes, J. 2013. Assessment of coastal protection as an ecosystem service in Europe. Ecological Indicators, 30: 205–217.
Maes, J., Braat, L., Jax, K., Hutchins, M., Furman, E., Termansen, M., Lucque, S., Paracchini, M.L., Chauvin, C. & Williams, R. 2011. A spatial assessment of ecosystem services in Europe: methods, case studies and policy analysis-phase 1. Italys, Partnership for European Environmental Research, Ispra.
Maes, J., Fabrega, N., Zulian, G., Barbosa, A., Vizcaino, Ivits, E., Polce, C., Vandecasteele, I., Marí Rivero, I., Guerra, C., Perpiña Castillo, C., Vallecillo, S., Baranzelli, C., Barranco, R., Batista e Silva, F., Jacobs-Crisoni, C., Trombetti, M., & Lavalle, C. 2015. Mapping and Assessment of Ecosystems and their Services (MAES). Trends in ecosystems and ecosystem services in the European Union between 2000 and 2010. Luxembourg, Publications Office of the European Union.
Maes, J., Teller, A., Erhard, M., Liquete, C., Braat, L., Berry, P., Egoh, B., Puydarrieux, P., Fiorina, C., Santos, F., Paracchini, M.L., Keune, H., Wittmer, H., Hauck, J., Fiala, I., Verburg, P.H., Condé, S., Schägner, J.P., San Miguel, J., Estreguil, C., Ostermann, O., Barredo, J.I., Pereira, H.M., Stott, A., Laporte, V., Meiner, A., Olah, B., Royo Gelabert, E., Spyropoulou, R., Petersen, J.E., Maguire, C., Zal, N., Achilleos, E., Rubin, A., Ledoux, L., Brown, C., Raes, C., Jacobs, S., Vandewalle, M., Connor, D. & Bidoglio, G. 2013. Mapping and Assessment of Ecosystems and their Services. An analytical framework for ecosystem assessments under action 5 of the EU biodiversity strategy to 2020. Luxembourg, Publications Office of the European Union.
Margat, J., Frenken, K. & Faurès, J., 2005. Key water resource statistics in AQUASTAT. IWG-Env, International Work Session on Water Statistics, Vienna, June 20–22 2005. (also available at ftp://ftp.fao.org/agl/aglw/docs/PaperVienna2005.pdf).
MEA. 2005. Millennium ecosystem assessment. Our human planet: Summary for decision-makers. Washington, DC, Island Press.
Nedkov, S., Boyanova, K. & Burkhard, B. 2015. Quantifying, modelling and mapping ecosystem services in watersheds. In: L. Chicharo, F. Müller & N. Fohrer, eds. Ecosystem services and river basin ecohydrology, pp. 133–149. Netherlands, Springer.
Nouri, H., Beecham, S., Kazemi, F., Hassanli, A.M. & Anderson, S. 2013. Remote sensing techniques for predicting evapotranspiration from mixed vegetated surfaces. Hydrology and Earth System Sciences, 10: 3897–3925.
Ottaviani, D. & El Hage Scialabba, N. 2011. Payment for ecosystem services and food security. Rome, FAO. pp. 281.
Paracchini, M.L., Zulian, G., Kopperoinen, L., Maes, J., Schaegner, P., Termansen, M., Zandersen, M., Scholefield, P.A., Perez-Sobac, M. & Bidoglio, G. 2014. Mapping cultural ecosystem services: A frame to assess EU potential for the case of outdoor recreation. Ecological Indicators, 45: 371–385.
63Conclusions
Pekel, J., Cottam, A. Gorelick, N. & Belward, A. 2015. 30 years’ global scale mapping of surface water dynamics at 30 m resolution. In: MWBS Mapping Water Bodies from Space 2015 Conference.18-19 March 2015. ESA-ESRIN, Frascati, Italy.(also available at http://elib.dlr.de/95764/1/MWBS_2015_Abstract%20BookV3.pdf).
Postel, S. & Richter, B.D. 2003. Rivers for life: managing water for people and nature. Washington, DC, Island Press.
Sukhdev, P., Wittmer, H., Schröter-Schlaak, C., Nesshöver, C., Bishop, J., ten Brink, P., Gundimeda, P. & Simmons, B. 2010. The economics of ecosystems and biodiversity: mainstreaming the economics of nature: a synthesis of the approach. Conclusions and recommendations of The Economics of Ecosystems and Biodiversity.
Tallis, H.T., Ricketts, T., Nelson, E., Ennaanay, D., Wolny, S., Olwero, N., Vigerstol, K., Pennington, D., Mendoza, G., Aukema, J., Foster, J., Forrest, J., Cameron, D., Arkema, K., Lonsdorf, E. & Kennedy, C. 2010. InVEST 1.004 beta user’s guide. The Natural Capital Project. USA, Stanford University.
Tharme, R.E. 2003. A global perspective on environmental flow assessment: emerging trends in the development and application of environmental flow methodologies for rivers. River Research and applications, 19: 397–441.
The Brisbane Declaration. 2007. Environmental flows are essential for freshwater ecosystems health and human well-being. 10th International River Symposium and International Environmental Flows Conference. 3-6 September. Brisbane, Australia. 7 pp.
United Nations. 1992. Convention on Biological Diversity. (also available at www.cbd.int/doc/legal/cbd-en.pdf).
United Nations. 1993. Handbook of National Accounting: Integrated Environmental and EconomicAccounting, Interim version. Studies in Methods, Series F, No. 61. No. E.93.XVII.12. 182 pp. (also available from http://unstats.un.org/unsd/publication/SeriesF/SeriesF_61E.pdf).
United Nations. 2003. Handbook of national accounting: integrated environmental and economic accounting: an operational manual. Series F, No. 78, Rev. 1.
United Nations. 1998. United Nations convention on the Law of the Sea of 10 December 1982. Treaty Series, vol. 1833, No. 31363. (also available from http://www.un.org/Depts/los/convention_agreements/convention_overview_convention.htm).
United Nations. 2012. SEEA-Water: System of Environmental-Economic Accounting for Water. New York, USA.
United Nations, Organization for Economic Cooperation and Development &World Bank. 2013. System of Environmental-Economic Accounting 2012: Experimental Ecosystem Accounting, White cover publication, pre-edited text subject to official editing. United Nations, New York. 183 pp.
United Nations. 2014. System of Environmental-Economic Accounting. New York, USA.United Nations, European Union, Food and Agriculture Organization of the United
Nations, International Monetary Fund, Organisation for Economic Co-operation and Development & The World Bank, 2014. System of Environmental-Economic Accounting 2012—Central Framework. New York, USA, UN.
United Nations Economic Commission for Europe (UNECE). 1992. Rio Declaration on Environment and Development. Principle 15. (also available at www.unep.org/Documents.Multilingual/Default.asp?documentid=78&articleid=1163).
United Nations Education, Scientific and Cultural Organization (UNESCO) & World Meteorological Organization (WMO). 1993. International glossary of hydrology. Second edition. (also available at http://webworld.unesco.org/water/ihp/db/glossary/glu/aglu.htm).
United Nations Statistics Division. 2010. International Recommendations for Water Statistics. Statistical Papers Series M No. 91.

Lessons learned in water accounting: the fisheries and aquaculture perspective in the SEEA framework64
United Nations Sustainable Development. 1992. United Nations Conference on Environment & Development. Agenda 21, Ch. 8 [online] Rio de Janeiro, Brazil, June 3–14, 1992. (also available at www.un.org/esa/sustdev/documents/agenda21/english/Agenda21.pdf).
Vickers, A. 2001. Handbook of water use and conservation. Amherst, USA, WaterPlow Press.
Villa, F. 2010. Bridging scales and paradigms in natural systems modelling. Metadata and semantic research. Communications in Computer and Information Science, 108: 1–7.
Villa, F., Athanasiadis, I.N., & Rizzoli, A.E. 2009. Modelling with knowledge: a review of emerging semantic approaches to environmental modelling. Environmental Modelling and Software, 24: 577–587.
Villa, F., Bagstad, B., Voigt, G., Johnson, W., Portela, R., Honzák, M. & Batker, D. 2014. A methodology for adaptable and robust ecosystem services assessment. PLOS One, 9: e91001.
Willems J.H.W. & van Schaik H.P.J. 2015. Water & heritage. Leiden, Netherlands, Sidestone Press.
World Bank. 2013. World Development Indicators 2013. Washington, DC: World Bank 123 pp. (also available at http://databank.worldbank.org/data/download/WDI-2013-ebook.pdf)
Zimmer, D. & Renault, D. 2003. Virtual water in food production and global trade: Review of methodological issues and preliminary results. In A. Hoekstra, ed. Proceedings of the international Expert Meeting on Virtual Water Trade. Value of Water Research Report Series No. 12. The Netherlands,
Zulian, G., Maes, J. & Paracchini, M. 2013. Linking land cover data and crop yields for mapping and assessment of pollination services in Europe. Land, 2: 472–492.
Zulian, G., Polce, C. & Maes, J. 2014. ESTIMAP: a GIS-based model to map ecosystem services in the European Union. Annali di Botanica, 4: 1–7.


Water accounting seeks to provide comprehensive, consistent and comparable information related to water for policy- and decision-making to promote a sustainable use of water
resources as well as equitable and transparent water governance among water users. One of the frameworks for environmental and economic accounting is the System of
Environmental-Economic Accounting (SEEA), which the United Nations Statistical Commission endorsed as an international standard in 2012. SEEA contains standard concepts, definitions,
classifications, accounting rules and accounting tables for producing internationally comparable statistics.
This document examines the accounting tables designed by the SEEA accounting framework and investigates the likelihood of the SEEA reflecting the dependence of the fisheries sector
on water resources and accounting for fisheries and aquaculture fisheries water uses and requirements. Through the lens of the fisheries sector, a more in-depth understanding of the
SEEA framework for water accounting emerges.
I5880E/1/07.16
ISBN 978-92-5-109319-1
9 7 8 9 2 5 1 0 9 3 1 9 1
ISSN 2070-7010