Embed Size (px)
Citation preview
1
Lessons Learned from the Bay Region Atmospheric Chemistry Experiment 1
(BRACE) and Implications for Nitrogen Management of Tampa Bay 2
3
Noreen D. Poor1,*, Lindsay M. Cross2 and Robin L. Dennis3 4 1Kivmetrics, LLC, 1282 York Circle, Melbourne, FL 32904 5
2Tampa Bay Estuary Program, 263 13th Avenue S., Suite 350, St. Petersburg, FL 33701 6 3U.S. Environmental Protection Agency, National Exposure Research Laboratory, 7 Atmospheric Modeling and Analysis Division, Research Triangle Park, NC 27711 8
9 Abstract 10
11
Results from air quality modeling and field measurements made as part of the Bay Region 12
Atmospheric Chemistry Experiment (BRACE) along with related scientific literature were 13
reviewed to provide an improved estimate of atmospheric reactive nitrogen (N) deposition to 14
Tampa Bay, to apportion atmospheric N between local and remote sources, and to assess the 15
impact of regulatory drivers on N deposition to Tampa Bay. Simulations using the 16
Community Multiscale Air Quality model v4.4 modified with the University of California 17
Davis aerosol module (CMAQ-UCD) provided a framework for this review. For 2002, 18
CMAQ-UCD modeled atmospheric loading rates were 6,910 metric tons N to the land 19
surface of the watershed and 548 metric tons N to bay surface of the watershed, respectively. 20
If an 18% transfer rate of atmospherically-deposited N from watershed to bay is assumed, 21
then the corresponding atmospheric loading to Tampa Bay was 1,790 metric tons N or 57 % 22
of the total N loading to the bay. From CMAQ-UCD modeling, oxidized N sources both 23
within and outside Tampa Bay’s watershed were important contributors to atmospheric N 24
loading to the bay. Within the watershed, oxidized N emissions from mobile sources had a 25
disproportionally larger impact than did power plant sources on atmospheric N loading. 26
Predicted decreases in atmospheric N deposition to Tampa Bay by 2010 due to regulatory 27
drivers were significant, and plausibly evident in recent declines in ambient air NOx 28
concentrations in urban Tampa and St. Petersburg. 29
30
Keywords: Florida, atmospheric deposition, ammonia, nitrogen oxides, CMAQ-UCD 31
32

2
*Corresponding author: Tel: +1 813 956 0855; E-mail: [email protected] (N. D. Poor) 33
34
1. Introduction 35
36
1.1 Purpose and Scope 37
38
Tampa Bay National Estuary Program (TBNEP) in 1996 published its nutrient budget for 39
Tampa Bay, Florida, USA, which revealed that atmospheric deposition contributed ~ 67 % of 40
the bay’s total annual reactive nitrogen (N) loading (TBNEP, 1996). With the announcement 41
in 1999 by a local utility company of its plans for significant reductions in power plant 42
nitrogen oxide (NOx) emissions, Tampa Bay Estuary Program (TBEP, formerly TBNEP) and 43
Florida Department of Environmental Protection (FDEP) saw the need to model at a regional 44
scale N emissions, transport, transformation, and deposition to assess the potential impact of 45
these reductions on the bay’s N budget. Bay Region Atmospheric Chemistry Experiment 46
(BRACE) began in concept as a short-term “supersite” experiment intended to collect multi-47
dimensional meteorological and air pollution data to validate model performance, but 48
evolved into a long-term multi-site experiment that included three intensive monitoring 49
periods and several special studies (Atkeson et al., 2007). BRACE goals were to (1) improve 50
estimates of atmospheric N deposition to Tampa Bay, (2) apportion atmospheric N between 51
local, regional, and remote sources, and (3) assess the impact of utility controls on N 52
deposition to Tampa Bay (Atkeson et al., 2007). The purpose of this article is to review 53
BRACE modeling and measurement results with an emphasis on the results of CMAQ-UCD 54
simulations, and to highlight the implications for bay management. 55
56
1.2 Background 57
58
Tampa Bay estuary is located along the west coast of central Florida and on Gulf of 59
Mexico’s eastern border (Figure 1), and at ~1,000 km2 is Florida’s largest open water estuary 60
(Greening and Janicki, 2006). Three counties border directly on the bay: Pinellas, 61
Hillsborough, and Manatee; Pasco, Polk, and Sarasota counties are also within the estuary’s 62
~6,000 km2 watershed (Figure 1). According to the 2010 US census, the population within 63

3
the bordering counties exceeded 2.5 million persons, with growth rates of more than 20% 64
seen in Hillsborough and Manatee counties between census years. Land use within the 65
watershed is mixed between undeveloped, agricultural, residential, commercial, and mining. 66
Tampa Bay’s shipping trade and tourism, and to a lesser extent commercial and recreational 67
fishing, play an important role in the local economy (TBEP, 2006; Tomasko et al., 2005). 68
69
The subtropical bay is relatively shallow with an average depth of 4 m, although deeper 70
dredged channels allow large ships to reach three major seaports (TBEP, 2006). Mangrove 71
forests, salt marshes, and seagrass beds thrive along protected shorelines of Tampa Bay and 72
serve as nurseries for fish, shellfish, and crustaceans, and as a feeding ground for migratory 73
birds. Seagrasses are considered by scientists and estuarine managers to be a sensitive 74
indicator of the bay’s overall health (TBNEP, 1996). Observations regarding the health of 75
seagrass beds is that inflows of bioavailable N cause excessive algal growth, which in turn 76
reduces water clarity and thus the ability of seagrass to survive in bay shallows (Sherwood, 77
2011). Between 1950 and 1985, seagrass acreage declined from 16,000 ha to 9,000 ha; bay 78
managers have set a recovery goal of 15,000 ha. The paradigm for recovery and maintenance 79
of seagrass is to reduce N inputs (Greening and Janicki, 2006; Greening et al., 2011). 80
81
In the mid-1990s, the Tampa Bay Estuary Program and its stakeholders set as a goal 82
reductions in loading of ~15 metric tons N yr-1 to maintain N loading at levels conducive to 83
seagrass growth even as the human population grew within the watershed (Greening et al., 84
2011; Greening and Janicki, 2006). Through management actions, N inputs to Tampa Bay 85
were reduced. Between 1999 and 2010 in apparent response and concurrent to these 86
reductions, bay water clarity improved, chlorophyll α concentrations decreased, and seagrass 87
coverage steadily increased from 10,000 ha to 13,500 ha (Greening and Janicki, 2006; 88
Sherwood, 2011). 89
90
Bioavailable or reactive N reaches coastal ecosystems in stormwater runoff (62 %), direct 91
atmospheric deposition (21 %), point sources (12 %), groundwater springs (4 %), and 92
accidental fertilizer losses (1 %) (Greening and Janicki, 2006). Reactive nitrogen (N) 93
deposited from the atmosphere to the landscape that is subsequently transferred to the bay is 94

4
referred to as indirect atmospheric deposition or indirect loading and is included in the 95
stormwater contribution. Atmospheric deposition of N can either directly or indirectly deliver 96
much of the new N loading to a coastal embayment, with estimates between 9 % and 75 % of 97
total N loading for bays of northeastern US (Howarth, 2008). Natural sources of atmospheric 98
N include emissions from feral animal excreta, forest fires, lightning, oceans, soils, 99
vegetation, and stratospheric injection; anthropogenic sources of N include emissions from 100
fertilizer application to crops, from nitrogen-fixing crops, excreta from human and farm 101
animal populations, urban fertilizer use, and fossil fuel combustion (Holland et al., 1999; 102
Galloway et al., 2004; Howarth, 2008). Atmospheric deposition represents a major source of 103
N to Tampa Bay and control of atmospheric emissions within and outside the watershed is 104
important to the future of Tampa Bay estuary. 105
106
2. Modeling 107
108
2.1 CMAQ-UCD modeling 109
110
As part of BRACE, scientists modeled N transport, transformation, and deposition within 111
the Tampa Bay watershed with the Models-3 Community Multiscale Air Quality (CMAQ) 112
v4.4 modeling system (Dennis and Arnold, 2007; Nolte et al., 2008). CMAQ’s chemical 113
transport model simulates horizontal and vertical advection, horizontal and vertical diffusion, 114
gas-phase and aqueous-phase reactions, cloud mixing and scavenging, aerosol dynamics, size 115
distribution and chemistry, and wet and dry deposition of gases and aerosols to Earth’s 116
surface (Byun and Schere, 2006). Computations for wet deposition include in-cloud 117
scavenging and below-cloud washout of air pollutants based on Henry’s Law partitioning for 118
gases and absorption of aerosols into cloud or rain water; dry deposition estimates assume 119
turbulent transfer of gases and aerosols to the surface and resistance to gas transfer at the 120
surface (Byun and Schere, 2006). CMAQ was run with University of California Davis 121
(UCD) Aerosol Module to capture the dynamics of nitric acid (HNO3) and sea salt 122
interactions (Nolte et al., 2008; Zhang and Wexler, 2008); the UCD Aerosol Module is based 123
on the Aerosol Inorganics Model (AIM) (Wexler and Clegg, 2002). This version of CMAQ is 124
also known as CMAQ-UCD. Meteorological input to CMAQ-UCD was modeled with Fifth 125
5
Generation Penn State University/National Center for Atmospheric Research mesoscale 126
model (MM5) v3.6 (Nolte et al., 2008). 127
128
Area source emissions were extracted from USEPA’s 1999 national emission inventory 129
(NEI) v3, projected to 2002 for mobile sources and to 2001 for other sectors. With slow 130
economic growth, differences between the 2001 and 2002 inventories for other sectors is 131
small. Emissions from electric generating units were based on 2002 continuous emission 132
monitoring (CEM) data (Dennis and Arnold, 2007; Dennis et al., 2008). USEPA’s ammonia 133
(NH3) inventory was adjusted upward to account for Florida’s warmer wintertime 134
temperature, and NH3 deposition velocities were corrected downward by 30% from default 135
values based on sensitivity studies conducted for Chesapeake Bay (Dennis et al., 2010; 136
Dennis and Arnold, 2007). Biogenic sources from the Biogenic Emissions Inventory System 137
(BEIS) v3.10 and size-segregated sea salt emissions, which were a function of wind speed 138
and relative humidity, were input separately (Nolte et al., 2008). 139
140
Three nested grids were defined to bring the modeling scale to a size relevant to addressing 141
deposition across Tampa Bay and its watershed. CMAQ-UCD’s 32-km grid cell modeling 142
domain covered the entire continental United States (US), within which was an 8-km nested 143
grid cell size over southeastern US, and within which was a 2-km nested grid cell size over 144
Tampa Bay’s watershed and nearby regions (Dennis and Arnold, 2007). CMAQ-UCD 145
simulations included meteorology for April, May, July, August, September, October, and 146
November of 2002 and January, February, and March of 2003, to achieve a simulated rainfall 147
amount that approximated the watershed’s 15-year annual average (Dennis and Arnold, 148
2007). Months with unusually high or low rainfall were excluded. Annual accumulated wet 149
and dry deposition was constructed from hourly deposition calculations over these ten 150
months with an adjustment to account for the two missing months. CMAQ-UCD modeled 151
reactive N species included reduced N: ammonia (NH3) and ammonium (NH4+); and 152
oxidized N: nitrogen monoxide (NO), nitrogen dioxide (NO2), nitric acid (HNO3), nitrate 153
(NO3-), and other oxides of N generated from emissions of NOx (= NO + NO2) (Dennis and 154
Arnold, 2007). 155
156

6
CMAQ model performance was evaluated against ground-based and aircraft 157
meteorological and air pollutant measurements from BRACE (Arnold and Luke, 2007; 158
Dennis and Arnold, 2007; Gunter, 2007; Luke et al., 2007a; Luke et al., 2007b; Nolte et al. 159
2008). Bias and error in MM5 meteorological modeling and CMAQ-UCD air pollutant 160
modeling were judged typical of those seen in other CMAQ evaluations (Eder and Yu, 2006; 161
Dennis and Arnold, 2007; Nolte et al., 2008). Atmospheric N deposition rates to Tampa 162
Bay’s watershed reported by Dennis and Arnold (2007) had a net positive bias of ~ 8 % 163
relative to CMAQ simulations based on later updates made to NO, NO2, and peroxyacetyl 164
nitrate (PAN) deposition parameters. 165
166
2.2 CALPUFF modeling 167
168
The CALPUFF modeling system consists of three main components: CALMET, 169
CALPUFF, and CALPOST (Scire et al., 2000). CALMET is a meteorological model that 170
develops three-dimensional wind and temperature fields and two-dimensional fields for 171
mixing height, surface characteristics, and dispersion properties. CALPUFF is a three-172
dimensional non-steady state Lagrangian puff model that simulates dispersion, transport, 173
transformation, and removal through wet and dry deposition of air pollutants between 10s of 174
m and up to hundreds of km from a source. CALPOST is a processes air pollutant 175
concentrations and deposition fluxes from binary to text files. As part of BRACE, CALPUFF 176
was employed (1) for source apportionment (Park et al., 2005; Poor et al., 2003), (2) to 177
calculate gas and particle deposition velocities N and chloride (Poor et al., 2006) in support 178
of an estimate of N retention in the Tampa Bay watershed (Pollman and Poor, 2003), (3) to 179
determine intra-state transport of chloride as it related to partitioning of HNO3 into sea salt 180
(Dasgupta et al., 2007), and (4) to investigate the relationship between N emission and 181
deposition for sources near to Tampa Bay (Poor, 2008). Details of CALMET and CALPOST 182
model inputs and parameterizations can be found in the cited literature. 183
184
3. Results and Discussion 185
186
3.1 How much of the total nitrogen loading to Tampa Bay is from atmospheric deposition? 187
7
188
Poe et al. (2005), Pribble et al. (2001) and JEI (2008) estimated for 1999-2006 total N 189
loading to Tampa Bay from direct atmospheric deposition, non-point sources, domestic and 190
industrial point sources, springs, groundwater, and material losses (Figure 2). They 191
calculated direct atmospheric deposition from monthly bay segment-specific rainfall rates, 192
rainfall N concentrations, and seasonal dry:wet deposition ratios. Monthly rainfall N 193
concentrations and seasonal dry:wet deposition ratios came from measurements made at 194
National Atmospheric Deposition Program (NADP) Atmospheric Integrated Research 195
Monitoring Network (AIRMoN) site FL 18 (Figure 1). Contributions from all other source 196
categories were based in general on basin- or bay segment-specific measurements of stream, 197
spring, and groundwater or wastewater discharges and their respective N concentrations; for 198
sub-basins without either stream flow gauges or water quality measurements, an empirical 199
model was applied to determine water discharge rates and N concentrations from monthly 200
rainfall amount and seasonal run-off coefficients based on land use and soil type. TBNMC 201
(2010) revised the point source and materials handling N loading rates used by Poe et al. 202
(2005) and JEI (2008). 203
204
Total N loading to Tampa Bay varied from year to year, e.g., from 2,190 metric tons N in 205
2000 to 6,690 metric tons in 2003 (Figure 2). In 2003 and 2004, higher rainfall rates 206
increased the hydrological loading within Tampa Bay’s watershed, which increased N 207
loading from non-point sources and in 2004 lead to emergency and accidental discharges of 208
N from industrial point sources. CMAQ v4.7 modeling revealed that in years with less 209
rainfall, atmospheric deposition of N within Tampa Bay’s watershed was dominated by dry 210
deposition (Poor et al., in review). Inter-annual estimates of direct atmospheric deposition N 211
loading to total N loading have ranged from 14 % to 32 % and estimates of direct plus 212
indirect atmospheric deposition N loading to total N loading have ranged from 35 % to 70 % 213
(Figure 2; Poor et al., in review). 214
215
Other estimates of atmospheric loading rates to Tampa Bay ranged from 1,100 metric tons 216
N yr-1 (Poor, 2008) to 3,030 metric tons N yr-1 (Dixon et al., 1996) as shown in Table 1 and 217
were characteristic of an estuary and watershed with moderate N pollution (Dentener 2006; 218

8
Holland et al. 2005). The broad range in estimates suggested significant differences in 219
measurement techniques, computational tools, and methodical assumptions. As examples, N 220
deposition rates have been determined by a mass balance approach (Patwardhan and 221
Donigian, 1997), bulk deposition monitoring (Dixon et al., 1996), ambient air and rainfall 222
monitoring with inferential modeling of dry deposition velocities (Poor et al., 2001), wet 223
deposition monitoring and use of dry-to-wet deposition ratios based on two years of local 224
observations (Pribble et al., 2001; Poe et al., 2005; JEI, 2008), and fate and transport 225
modeling (Appel et al., 2011; Dennis and Arnold, 2007; Poor, 2008). Fate and transport 226
models have been diagnostic (Poor, 2008; Poor et al., 2006) and prognostic (Appel et al., 227
2011; Dennis and Arnold, 2007). Inventories for fate and transport models have been limited 228
to central Florida (Poor, 2008) and inclusive of the entire US (Appel et al., 2011; Dennis and 229
Arnold, 2007). Even within the same prognostic modeling framework, differences existed 230
between spatial scales, parameterizations, and mechanistic algorithms (Appel et al., 2011; 231
Dennis and Arnold, 2007). 232
233
Table 1. Summary of estimates for direct and indirect atmospheric deposition of reactive 234
nitrogen (N) to Tampa Bay 235
Direct
(metric tons N yr-1)
Indirect
(metric tons N yr-1)
Year(s)
modeled/measured References
1,800 1,210 1984-1987 Patwardhan & Donigian, 1997
1,240 1,790 1985-1991 Dixon et al., 1996
1,000 - 1995-1998 Pribble et al., 2001
760 - 1996-1999 Poor et al., 2001
840 - 2002 Poe et al., 2005
- 1,750a 2002-2003 Poor et al., 2006
550 1,240a 2002-2003 Dennis and Arnold, 2007
480 620a 2002 Poor, 2008
1,080 1,490a 2002 Poor et al. (in review)
a18% transfer coefficient applied to estimate of terrestrial loading within watershed 236
237
CMAQ-UCD modeling yielded for 2002 atmospheric loading rates of 6,910 metric tons N 238
to land and 548 metric tons N to the bay (Dennis and Arnold, 2007). Assuming 18% of 239

9
atmospherically-deposited N was transferred from watershed to bay (Pollman and Poor, 240
2003) the estimated annual atmospheric loading to Tampa Bay was 1,790 metric tons N. 241
Dennis and Arnold (2007) reported that of this 1,790 metric tons N loading, relative 242
contributions were 60 % and 40 % for oxidized and reduced N, respectively, and 67 % and 243
33 % for dry and wet N deposition, respectively. 244
245
Poe et al. (2005) estimated that for 2002, total loading to Tampa Bay was 3,420 metric tons 246
N of which 840 metric tons N, or 25 % came directly from the atmosphere. To create an 247
estimate of the indirect loading from atmospheric deposition to the watershed, we revised the 248
2002 total loading figure by our new estimate of direct atmospheric deposition (Table 1) as 249
3,420 – 840 + 550 = 3,130 metric tons N and assumed that the indirect atmospheric 250
deposition was included in the non-point source contribution to total N loading. The CMAQ-251
modeled contribution of atmospheric N loading to total N loading was 1,790 ÷ 3,130 = 57 %, 252
of which 17 % was from direct and 40 % was from indirect deposition (Dennis and Arnold, 253
2007). The CMAQ-UCD model estimates were on the lower end of the direct loading range 254
and in the middle of the indirect loading range (Table 1). 255
256
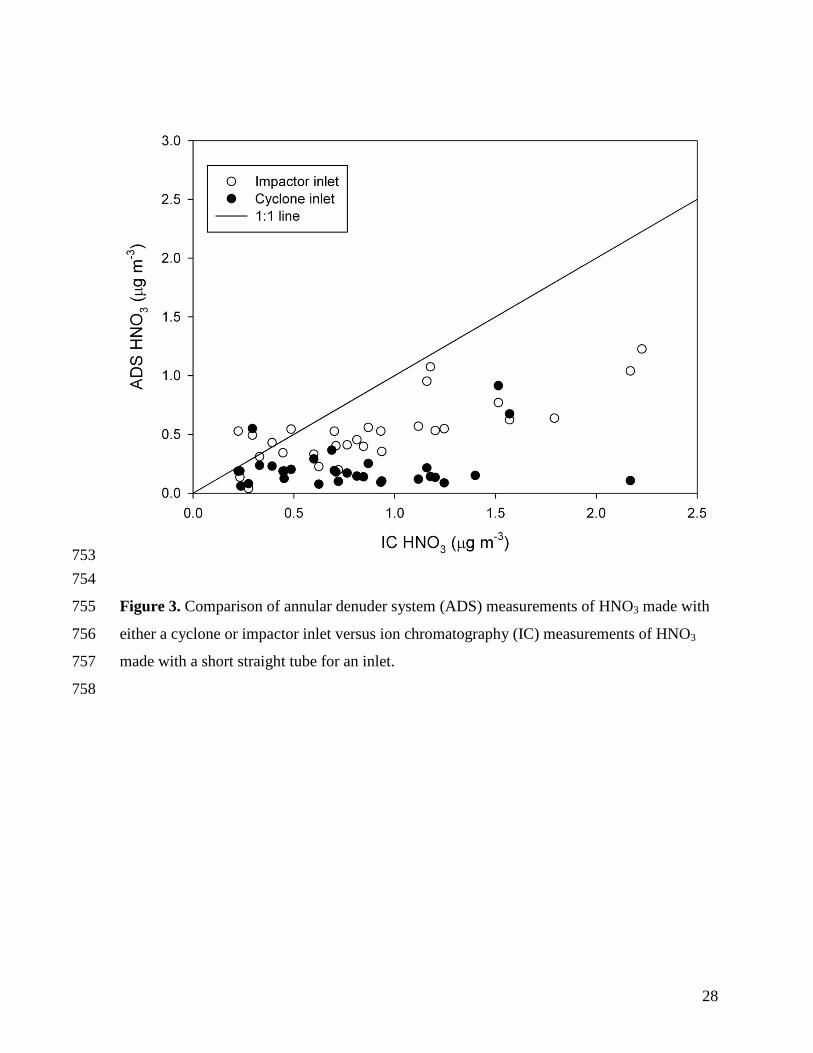
Some of the differences seen between estimates shown in Table 1 were attributed to 257
measurement error. For example, a significant source of measurement error in the estimates 258
described by Poor et al. (2001) was the loss of HNO3 at the inlet to the annular denuder 259
system for both cyclone and elutriator inlets, as compared with other field-based HNO3 260
measurement methods (Arnold et al., 2007; Poor et al., 2006). These losses could bias ~ 50 261
% low the HNO3 dry deposition rates (Figure 3). A second source of measurement error, 262
also associated with the annular denuder system, was the use of an inlet with a fine particle 263
cut-point. The inlet was designed to remove from the atmosphere with 50 % efficiency those 264
particles with an aerodynamic diameter of 2.5 µm, and with increasing efficiencies for 265
smaller particles. NO3-, however, was present in the atmosphere as a coarse particle 266
distributed in diameter around a ~ 4-µm mode (Campbell et al., 2002; Evans et al., 2004). As 267
illustrated in Figure 4, the use of the PM2.5 cut-point could bias ~ 60 % low the nitrate 268
particle deposition rates (Campbell et al., 2003). 269
270

10
Poor et al. (2001) applied the NOAA buoy model to calculate overwater dry deposition 271
velocities. Meteorological input to this model was obtained from an overwater station 272
(Mizak et al., 2007; Sopkin et al., 2006). Sopkin et al. (2006) compared the performance of 273
the NOAA buoy model and the Tropical Ocean Global Atmosphere (TOGA) Coupled-Ocean 274
Atmospheric Response Experiment (COARE) for predicting sensible heat and friction 275
velocities from overwater meteorological measurements. They found that while both models 276
tended to under-predict sensible heat, which would likely result in an under-prediction of 277
deposition velocities, modeled results for the statistical tests employed were still within 278
recommended performance guidelines. Their results had the caveat that neither model 279
predicted well for periods when the atmosphere was stable. 280
281
The CMAQ simulation did not consider organic N deposition. Wet deposition estimates by 282
Poor et al. (2001) were biased at least 10% low without the inclusion of organic N. Organic 283
N compounds such as urea, aliphatic amines and amino acids, pesticides, and nitrate-284
substituted organics (e.g., peroxyacetyl nitrate) added to atmospherically-deposited N. 285
Calderón et al. (2007) estimated that organic N made up ~10 % and ~9 % of the total 286
dissolved nitrogen in PM10 and in rainfall, respectively, and that most of the aerosol organic 287
N was in the fine particle fraction (Calderón et al., 2006). 288
289
CMAQ-UCD modeling showed steep atmospheric N deposition gradients and relatively 290
high contributions of local oxidized N emissions to gradients associated with urban 291
development and industrial activity near the bay (Dennis and Arnold, 2007). Atmospheric N 292
deposition gradients for reduced N emissions were steep in the vicinity of industrial activity 293
within the watershed (Poor et al., in review). Ambient air monitoring across Tampa Bay’s 294
watershed revealed that a significant spatial gradient existed between urban and rural sites for 295
oxidized N but not reduced N concentrations (Poor et al., 2006). Inconsistent results between 296
CMAQ-UCD modeling and local measurements of reduced N were likely a consequence of 297
the limited number and placement of monitors, which emphasizes the importance of both 298
modeling and measurement. 299
300
For CMAQ-UCD simulations (Dennis and Arnold, 2007), average wet oxidized N 301

11
deposition rates were lower and dry reduced N deposition rates higher than for CMAQ v4.7 302
simulations (Appel et al., 2011; Poor et al., in review) (Table 2). CMAQ-UCD simulations, 303
however, were tailored for the Tampa Bay watershed and featured a grid cell size of 2 km x 2 304
km versus 12 km x 12 km for CMAQ 4.7. A finer scale grid cell size improved the 305
resolution of land-sea breezes and mitigated error associated with sub-grid heterogeneity 306
(Luke et al., 2007b). For CMAQ-UCD modeling an upward adjustment was made to the 307
NH3 emissions inventory to account for the warmer year-round temperatures in subtropical 308
Florida. Neither the CMAQ-UCD nor the CMAQ v4.7 simulations included NOx generated 309
from lightning or bi-directional NH3 exchange at the earth’s surface, which may have biased 310
estimates low (Appel et al., 2011). 311
312
Table 2. Comparison of average annual N atmospheric deposition rates between CMAQ-313
UCD and CMAQ v4.7 model simulations with 2002 meteorology. 314
Form of N
Deposition
CMAQ v4.7 CMAQ –UCD*
Land, kg N ha-1 Bay, kg N ha-1 Land, kg N ha-1 Bay, kg N ha-1
Dry Oxidized N 6.29 5.23 6.08 2.07
Wet Oxidized N 3.64 3.24 1.64 1.84
Dry Reduced N 1.66 0.887 3.36 1.39
Wet Reduced N 2.15 1.53 1.60 1.42
Total 13.7 10.9 12.7 6.71
*Developed from CMAQ v4.4 315
316
3.2 What sources or source categories contribute the most to atmospheric deposition of 317
nitrogen to Tampa Bay? 318
319
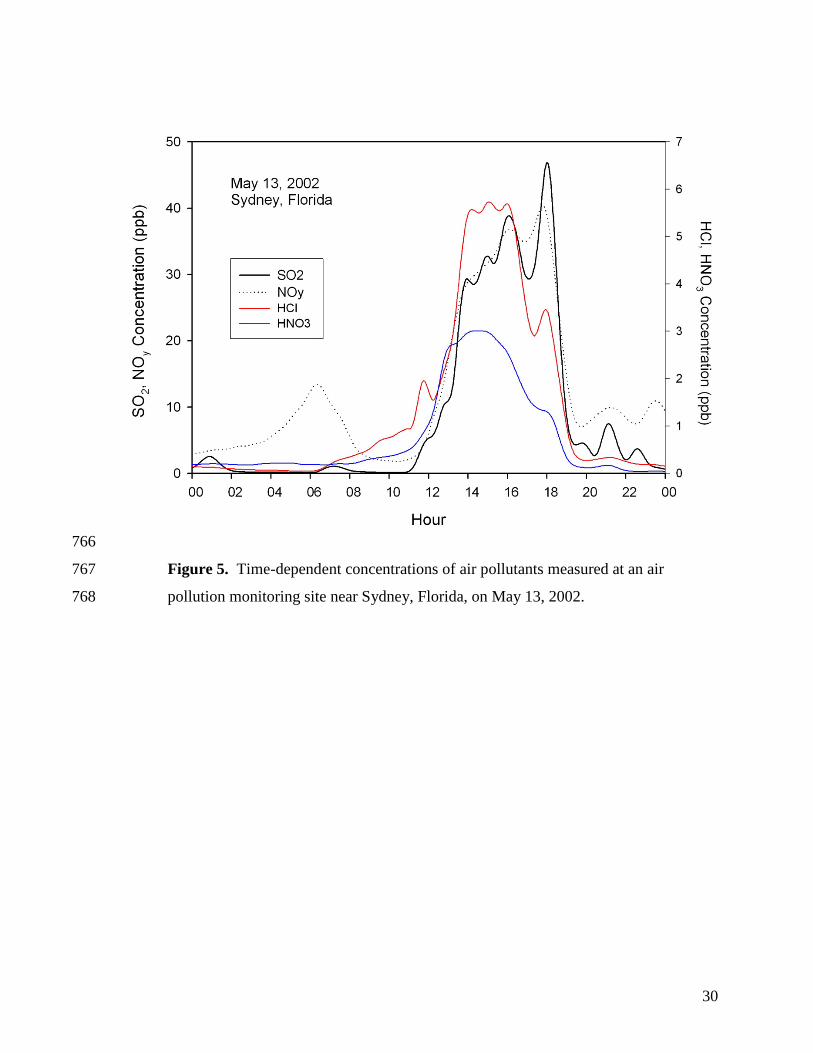
Release scenarios for power plant plumes are quite different from mobile source plumes. 320
Power plant plumes near their exhaust stack are concentrated and lofted and plume touch 321
down at the surface may occur many km distant from the plant. Figure 5, for example, shows 322
measured oxidized N and other constituents in power plant plumes that swept across 323
monitors at an air pollution monitoring site on the eastern fringe of Tampa’s metropolitan 324
area (Park et al., 2005; Poor et al., 2003). Power plant emissions greatly influence regional 325
12
transport of pollutants (Pinder et al., 2008; Strayer et al., 2007). Motor vehicles release their 326
exhaust near the surface; emissions from roadway traffic are rapidly diffused and difficult to 327
discern from “background” concentrations within a km from a roadway (Cape et al., 2004; 328
Kenty et al., 2007). Nonetheless, emission sources near the surface such as mobile sources 329
can dominate local deposition (Dennis and Arnold, 2007). 330
331
Luke et al. (2003) presented their initial oxidized-N flux (emission) estimates for the 332
metropolitan area surrounding Tampa Bay from aircraft measurements of atmospheric 333
constituents (Luke et al., 2007a, 2007b). Daily fluxes were calculated from five flights in 334
May 2002 as the product of the wind speed and N concentration (less “background”) and 335
integrated across the cross-sectional area of the urban plume. Their average oxidized N flux 336
was 470 metric tons d-1 and included point, area, and mobile source emissions. 337
338
By comparison, CMAQ-UCD modeled 2002 NOx emissions for Tampa Bay’s watershed 339
were ~360 metric tons d-1 (130,000 metric tons yr-1), distributed as 25 % from mobile 340
sources, 50 % from power plants, and 25 % from other sources (Dennis and Arnold, 2007). 341
Based on a CMAQ-UCD sensitivity analysis to assign attribution for the oxidized-N 342
deposition, approximately 50 % of the oxidized-N atmospheric deposition to the Tampa Bay 343
watershed came from NOx emissions from within the watershed and 50 % from NOx 344
emissions outside the watershed. Over the Tampa urban core NOx emissions from within the 345
watershed were responsible for more than 80 % of the oxidized-N deposition, a highly 346
localized result that also applies to St. Petersburg. Of the oxidized N deposition directly to 347
the bay, approximately 42 % was due to NOx emissions from within the watershed and 58 % 348
from NOx emissions outside the watershed because wet deposition plays a larger role in 349
deposition to the bay. 350
351
Strayer et al. (2007) estimated from trends in local rainwater chemistry that oxidized and 352
reduced N emission sources within central Florida contributed at least 25 % of the ~ 4 kg N 353
ha-1 yr-1 delivered annually in rainfall to the surface of Tampa Bay. Their conclusion was 354
supported by CMAQ-UCD modeling predicted an average wet deposition of 3.26 kg N ha-1 355
yr-1 (Table 2) to the surface of Tampa Bay, to which watershed mobile, power plant, and 356

13
other sources contributed 8.8 %, 18.5 %, and 12.4 %, respectively, or 1.3 kg N ha-1 yr-1 357
(Dennis and Arnold, 2007). 358
359
Mobile source emissions released near the surface and power plant emissions released from 360
tall stacks did not have the same degree of responsibility for local deposition. For the half of 361
the oxidized-N deposition to the watershed due to NOx emissions from within the watershed 362
the responsibility was distributed as 47 % from mobile sources, 27 % from power plants, and 363
25 % from other sources (Dennis and Arnold, 2007). For direct deposition to the bay that 364
was attributable to local sources the relative responsibilities were comparable. The CMAQ-365
UCD sensitivity results suggested that, per unit of emission, over the watershed the mobile 366
NOx emissions were responsible for four times more oxidized-N deposition than the power 367
plant emissions and over the bay the mobile NOx emissions were responsible for twice as 368
much oxidized-N deposition as the power plants. Thus, mobile sources had a 369
disproportionately higher contribution than power plant sources to atmospheric N deposition 370
to Tampa Bay. 371
372
From the USEPA’s 2002 NEI v3 (USEPA, 2008), within the Tampa Bay watershed 373
anthropogenic NOx (as N) emissions were ~ 10 times greater than the NH3 (as N) emissions, 374
yet CMAQ-modeled oxidized N and reduced N contributed approximately 60 % and 40 %, 375
respectively, of the N deposited to Tampa Bay and its watershed (Dennis and Arnold, 2007). 376
The relative importance of reduced N to atmospheric N deposition is explained by transport of 377
NH3 into the watershed (Dennis et al., 2010), higher deposition velocities of NH3 versus NOx, 378
(Dennis et al., 2010: Myles et al., 2007; Poor et al., 2006), and the near surface emissions of the 379
NH3 inventory compared with a combination near surface and elevated emissions for the NOx 380
inventory. Inventoried NH3 emissions in the Tampa Bay watershed, for example, were 381
predominantly from on-road sources or concentrated animal feed operations. Both CMAQ-382
UCD and CALPUFF modeling results suggested that reducing mobile source emissions within 383
the watershed had a leveraged impact on reducing N deposition to Tampa Bay (Dennis and 384
Arnold, 2007; Poor, 2008). 385
386
3.3 What are the temporal trends in atmospheric nitrogen deposition? 387

14
388
Through Clean Air Interstate Rule (CAIR, replaced with Cross-State Air Pollution Rule), 389
Tier 2 Vehicle and Gasoline Sulfur Rules, Heavy Duty Highway Rule, and Non-Road Diesel 390
Rule (USEPA, 2011a, b), USEPA seeks to improve air quality by phased reductions in air 391
pollutant emissions from both fixed and mobile sources. Fully implemented, these 392
regulations remove 6.7 million metric tons of NOx emissions from all states in continental 393
US, of which 5.2 million metric tons are from states in eastern US (Houyoux, 2005). On-394
road sources comprised 77 % and 74 % of the NOx emissions reductions for continental and 395
eastern US, respectively (Houyoux, 2005). NOx regulatory drivers do not address NH3 396
emissions, so these emissions are anticipated to grow with agricultural demand. Estimates 397
are that NH3 emissions are expected to grow by 0.44 million metric tons for all states in 398
continental US, of which 0.22 million metric tons of NH3 emissions are from states in eastern 399
US (Houyoux, 2005). Moreover, slated reductions in sulfur dioxide (SO2) emissions will 400
shift aerosol NH4+ to gaseous NH3 and thus favor increased localized deposition of reduced 401
N (Pinder et al., 2008). 402
403
CMAQ-UCD modeling was conducted to assess the potential impact of the CAIR by 2010 404
on atmospheric N deposition to Tampa Bay and its watershed. CMAQ-UCD modeling of the 405
2010 CAIR NOx emissions inventory (Houyoux, 2005) showed a removal of 390 metric tons 406
N or a 390/1,790 = 22 % reduction for atmospheric N loading to the bay (Dennis and Arnold, 407
2007), assuming an 18% transfer rate from watershed to bay. Poor et al. (in review) reported 408
a 33% percentage reduction in atmospheric N deposition based on CMAQ v4.7 modeling of 409
the CAIR impact through 2020 (Appel et al., 2011). Reconfiguration of two local coal-fired 410
power plants between 2002 and 2010 accounted for 86 metric tons N of this reduction in N 411
deposition (Dennis and Arnold, 2007). 412
413
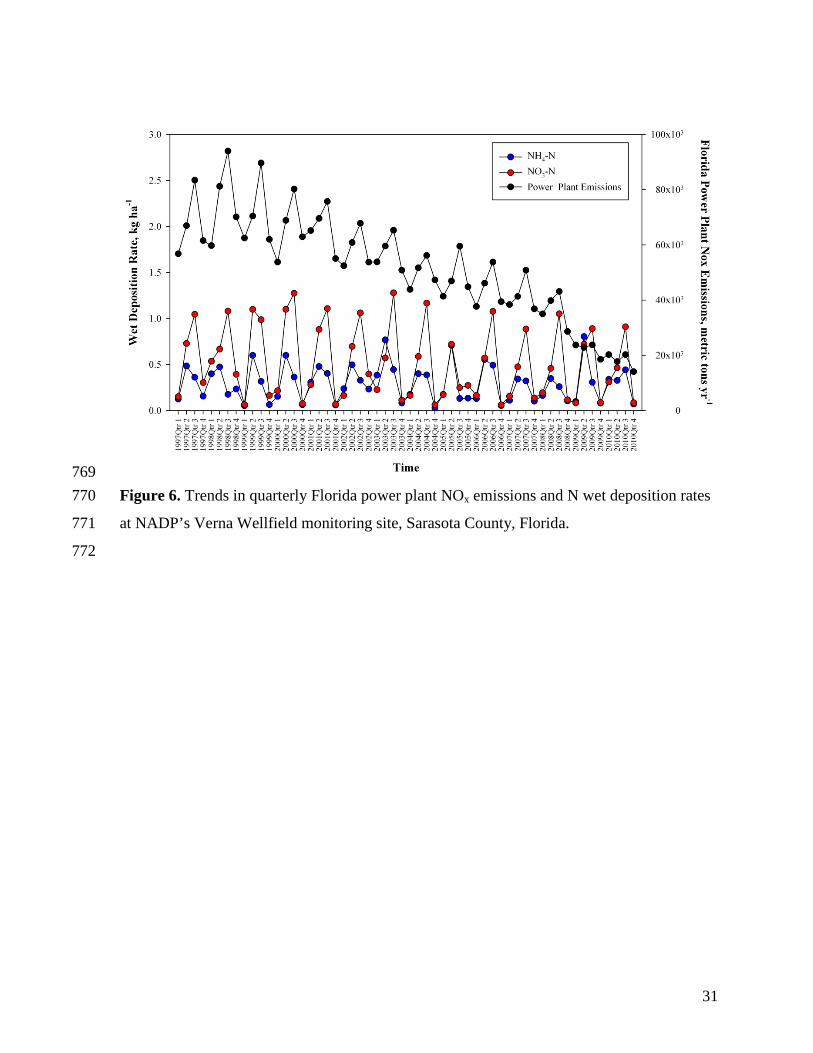
Was a downward trend seen in measured wet and dry N deposition rates? Between 1997 414
and 2011, NH4+ and NO3
- rainfall concentrations and deposition rates determined from 415
weekly rainfall collected at NADP’s National Trends Network (NTN) site FL 41 (Figure 1; 416
NADP, 2011) in Sarasota County did not discernibly track downward with reductions in 417
emissions from Florida power plants (Figure 6; USEPA, 2011). The apparent downward 418

15
trend in NO3- deposition rates was not statistically significant for inference testing of log-419
transformed data at the 95% confidence level. The lack of a significant downward trend in 420
observed NO3- wet deposition rates was a likely consequence of the location of rainfall 421
monitoring relative to major NOx sources, especially urban mobile sources, “smearing” of 422
storm events during rainfall collection, a relatively low contribution of local oxidized N 423
sources to rainfall NO3-, and low statistical power given the variability and dispersion of 424
rainfall rates (Mizak et al., 2005; Strayer et al. 2007; Dennis and Arnold 2007). 425
426
No measured dry N deposition rates were available over the same period but ambient air 427
NOx concentrations observed at urban monitors in both Hillsborough and Pinellas counties 428
tracked downward with reductions in emissions from Florida power plants (Figure 7; 429
USEPA, 2011). The downward trend in NOx concentrations were statistically significant 430
based on inference testing of log-transformed data at the 95% confidence level and offered 431
evidence in support of CMAQ-UCD modeled predictions of lower N deposition rates. 432
433
3.4 Implications for Tampa Bay Estuary 434
435
Algal abundance, water clarity, and seagrass acreage have improved substantially in the 436
Tampa Bay estuary between 1999 and 2010 (Sherwood, 2011) and it appears plausible that 437
declines in atmospheric N deposition to the estuary and its watershed were part of this 438
historical improvement. Estimates from both modeling and measurement revealed that since 439
the mid-1980s atmospheric N deposition to Tampa Bay has been a significant fraction of its 440
annual N loading. Further reductions in atmospheric N deposition are essential if only to 441
“hold the line” against population growth with its attendant reduced and oxidized N emission 442
sources. Air quality modeling has illustrated for us that any successful strategy to “hold the 443
line” must include components of both local and regional air quality control, ammonia (NH3) 444
and well as NOx control, and non-point as well as point source emission control. CMAQ-445
UCD simulations indicated that implementation of regulatory drivers between 2002 and 2010 446
represented a decrease of ~49 metric tons N yr-1, well above a target reduction rate of 15 447
metric tons N yr-1 needed to maintain a bay water quality for healthy seagrass beds (Greening 448
et al., 2011; Greening and Janicki, 2006). 449

16
450
4. Summary and Conclusions 451
452
What are the lessons learned from the BRACE? First, atmospheric N deposition is a 453
significant fraction of Tampa Bay’s total N loading, with estimates of inter-annual direct 454
atmospheric N deposition between 14 % and 32 %, and total (direct plus indirect) 455
atmospheric N deposition between 35 % and 70 %. Second, based on CMAQ-UCD modeling 456
of atmospheric N deposition, the relative contributions of oxidized N and reduced N were 60 457
% and 40 %, respectively, and the relative contributions of dry and wet N deposition were 67 458
% and 33 %, respectively, to atmospheric N loading. Ideally, the relative importance of 459
reduced N, dry N, and atmospheric N loading to total N loading to Tampa Bay would be 460
reflected in watershed monitoring. Third, modeled N mobile source emissions, which are 461
released close to the watershed surface, had a disproportionally larger impact than did power 462
plant emissions on oxidized N deposition to Tampa Bay and its watershed. Thus, reductions in 463
N emissions from mobile sources must be a part of the strategic plan for reducing N loading to 464
the bay. Fourth, modeled NOx emissions within the watershed contributed to 50 % of the 465
oxidized-N deposition to the watershed and 42 % of the oxidized-N deposition to the bay. 466
CMAQ-UCD modeling predicted a ~ 22 % decrease in atmospheric N deposition by 2010 467
due to regulatory drivers, which is plausibly in evidence by corresponding declines in NOx 468
concentrations in urban Tampa and St. Petersburg. Control of atmospheric N emissions both 469
within and outside the watershed is important to the future of the Tampa Bay estuary. 470
471
Acknowledgements 472
473
This research was funded by Florida Department of Environmental Protection (FDEP) 474
through Tampa Bay Estuary Program (TBEP) under FDEP Contract AQ206. Air quality data 475
were provided courtesy of the Environmental Protection Commission of Hillsborough 476
County and the Pinellas County Department of Environment and Infrastructure (formerly 477
Department of Environmental Management). Noreen Poor is affiliated with the University of 478
South Florida College of Public Health. Although this work was reviewed by EPA and 479

17
approved for publication, it may not necessarily reflect official Agency policy. Mention of 480
commercial products does not constitute endorsement by the Agency. 481
482
References 483
484
Appel, K. W., Foley, K. M., Bash, J.O., Pinder, R.W., Dennis, R. L., Allen, D. J., Pickering, 485
K., 2011. A multi-resolution assessment of the Community Multiscale Air Quality (CMAQ) 486
model v4.7 wet deposition estimates for 2002-2006. Geoscientific Model Development 4: 487
357-371. 488
489
Arnold, J. R., Hartsell, B. E., Luke, W. T., Ullah, S. M. R., Dasgupta, P. K., Huey, G. L., 490
Tate, P., 2007. Field test of four methods for gas-phase ambient nitric acid. Atmospheric 491
Environment 41: 4210-4226. 492
493
Arnold, J. R., Luke, W. T., 2007. Nitric acid and the origin and size segregation of aerosol 494
nitrate aloft during BRACE 2002. Atmospheric Environment 41: 4227-4241. 495
496
Atkeson, T., Greening, H., Poor, N., 2007. Bay Region Atmospheric Chemistry Experiment. 497
Atmospheric Environment 41: 4163-4164. 498
499
Byun, D., Schere, K. L., 2006. Review of governing equations, computational algorithms, 500
and other components of the Models-3 Community Multiscale Air Quality (CMAQ) 501
Modeling System. Applied Mechanics Reviews 59: 51-77. 502
503
Calderón, S. M., Poor, N. D., Campbell, S. W., 2007. Estimation of particle and gas 504
scavenging contributions to wet deposition of organic nitrogen. Atmospheric Environment 505
41: 4281-4290. 506
507
Calderón, S., Poor, N., Campbell, S., 2006. Investigation of the UV photolysis method for the 508
determination of organic nitrogen in aerosol samples. Journal of Air & Waste Management 509
Association 56: 1278-1286. 510

18
511
Campbell, S. W., Evans, M. C., Poor, N. D., 2002. Predictions of size-resolved aerosol 512
concentrations of ammonium, chloride and nitrate at a bayside site using EQUISOLV II. 513
Atmospheric Environment 36, 4299-4307. 514
515
Campbell, S. W., Evans, M. C., Poor, N. D., 2003. Prediction of coarse particle nitrate from 516
fine particle measurements in a coastal environment. Presented at the AGU Fall Meeting, 8-517
12 December, San Francisco, CA. 518
519
Cape, J. N., Tang, Y. S., van Dijk, N., Love, L., Sutton, M. A., Palmer, S. C. F., 2004. 520
Concentrations of ammonia and nitrogen dioxide at roadside verges, and their contribution to 521
nitrogen deposition. Environmental Pollution 132: 469-478. 522
523
Dasgupta, P. K., Campbell, S. W., Al-Horr, R. S., Ullah, S. M. R., Li, J., Amalfitano, C., 524
Poor, N. D., 2007. Conversion of sea salt aerosol to NaNO3 and the production of HCl: 525
analysis of temporal behavior of aerosol chloride/nitrate and gaseous HCl/HNO3 526
concentrations with AIM. Atmospheric Environment 41: 4242-4257. 527
528
Dennis, R. L., Arnold, J. R., 2007. CMAQ-UCD Atmospheric Deposition Estimates to 529
Tampa Bay Watershed Sub-basins and Tampa Bay Waters. Prepared for Tampa Bay Estuary 530
Program, St. Petersburg, Florida. 531
532
Dennis, R. L., Bhave, P. V., Pinder, R. W., 2008. Observable indicators of the sensitivity of 533
PM2.5 nitrate to emissions reductions—Part II: Sensitivity to errors in total ammonia and total 534
nitrate of the CMAQ-predicted non-linear effect of SO2 emissions reductions. Atmospheric 535
Environment 42: 1287-1300. 536
537
Dennis, R. L., Mathur, R., Pleim, J. E., Walker, J. T., 2010. Fate of ammonia emissions at the 538
local to regional scale as simulated by the Community Multiscale Air Quality model. 539
Atmospheric Pollution Research 1: 207-214. 540
541

19
Dentener, F., Drevet, J., Lamarque, J. F., Bey, I., Eickhout, B., Fiore, A. M., Hauglustaine, 542
D., Horowitz, L. W., Krol, M., Kulshrestha, U. C., Lawrence, M., Galy-Lacaux, C., Rast, S. 543
Shindell, D., Stevenson, D., Van Noije, T., Atherton, C., Bell, N., Bergman, D., Butler, T., 544
Cofala, J., Collins, B., Doherty, R., Ellingsen, K., Galloway, J., Gauss, M., Montanaro, V., 545
Müller, J. F., Pitari, G., Rodriguez, J., Sanderson, M., Solmon, F., Strahan, S., Schultz, M., 546
Sudo, K., Szopa, S., and Wild, O., 2006. Nitrogen and sulfur deposition on regional and 547
global scales: A multimodel evaluation. Global Biogeochemical Cycles 20: GB4003, 548
doi:10.1029/2005GB002672. 549
550
Dixon, L. K., Murray, S., Perry, J. S., Minotti, P.J., Henry, M.S., Pierce, R. H., 1996. 551
Assessment of Bulk Atmospheric Deposition to the Tampa Bay Watershed, Final Report. 552
Prepared for Tampa Bay National Estuary Program, St. Petersburg, Florida. TBNEP 553
Technical Publication #08-96. 554
555
Eder, B., Yu, S., 2006. A performance evaluation of the 2004 release of Models-3 CMAQ. 556
Atmospheric Environment 40: 4811-4824. 557
558
Evans, M. C., Campbell, S. W., Bhethanabotla, V., Poor, N. D., 2004. Effect of sea salt and 559
calcium carbonate interactions with nitric acid on the direct dry deposition of nitrogen to 560
Tampa Bay, Florida. Atmospheric Environment 38, 4847-4858. 561
562
Galloway, J. N., Dentener, F. J., Capone, D. G., Boyer, E. W., Howarth, R. W., Seitzinger, S. 563
P., Asner, G. P., Cleveland, C. C., Green, P. A., Holland, E. A., Karl, D. M., Michaels, A. F., 564
Porter, J. H., Townsend, A. R., Vörösmarty, C. J., 2004. Nitrogen cycles: past, present, and 565
future. Biogeochemistry 70: 153-226. 566
567
Gilliland, A. B., Butler, T. J., Likens, G. E., 2002. Monthly and annual bias in weekly 568
(NADP/NTN) versus daily (AIRMoN) precipitation chemistry data in the Eastern USA. 569
Atmospheric Environment 36: 5197-5206. 570
571

20
Greening, H. S., Cross, L. M., Sherwood, E. T., 2011. A multiscale approach to seagrass 572
recovery in Tampa Bay, Florida. Ecological Restoration 29: 82-93. 573
574
Greening, H., Janicki, A., 2006. Toward reversal of eutrophic conditions in a subtropical 575
estuary: water quality and seagrass response to nitrogen loading reductions in Tampa Bay, 576
Florida, USA. Environmental Management 38:163-178. 577
578
Gunter, R. L., 2007. Assessment of boundary layer variations in the Tampa Bay area during 579
the Bay Region Atmospheric Chemistry Experiment (BRACE). Atmospheric Environment 580
41: 4165-4176. 581
582
Holland, E. A., Dentener, F. J., Braswell, B. H., Sulzman, J. M., 1999. Contemporary and 583
pre-industrial global reactive nitrogen budgets. Biogeochemistry 46: 7-43. 584
585
Holland, E. A., Braswell, B. H., Sulzman, J., Lamarque, J.-F., 2005. Nitrogen deposition onto 586
the United States and Western Europe: Synthesis of observations and models. Ecological 587
Applications 15: 38-57. 588
589
Houyoux, M. 2005. Clear Air Interstate Rule: Emissions Inventory Technical Support 590
Document, United States Environmental Protection Agency. Available for download at 591
http://www.epa.gov/cair/technical.html. 592
593
Howarth, R. W., 2008. Coastal nitrogen pollution: A review of sources and trends globally 594
and regionally. Harmful Algae 8: 14-20. 595
596
Janicki Environmental, Inc. (JEI), 2008. Estimates of Total Nitrogen, Total Phosphorus, 597
Total Suspended Solids, and Biochemical Oxygen Demand Loadings to Tampa Bay, Florida: 598
2004-2007. Prepared for Florida Department of Environmental Protection. 599
600

21
Kenty, K., Poor, N., Kronmiller, K., McClenny, W., King, C., Atkeson, A., Campbell, S. W., 601
2007. Application of CALINE4 to roadside NO/NO2 transformations. Atmospheric 602
Environment 41: 4270-4280. 603
604
Luke, W. T., Arnold, J. R., Gunter, R. L., Watson, T. B., Wellman, D. L., Dasgupta, P. K., 605
Li, J., Riemer, D., Tate, P., 2007a. The NOAA Twin Otter and its role in BRACE: Platform 606
description. Atmospheric Environment 41: 4177-4189. 607
608
Luke, W. T., Arnold, J. R., Watson, T. B., Dasgupta, P. K., Li, J., Kronmiller, K., Hartsell, B. 609
E., Tamanini, T., Lopez, C., King, C., 2007b. The NOAA Twin Otter and its role in BRACE: 610
A comparison of aircraft and surface trace gas measurements. Atmospheric Environment 41: 611
4190-4209. 612
613
Luke, W., Arnold, J., Watson, T., Gunter, L., Wellman, D., Dasgupta, P., Li, J., Reimer, D., 614
2003. Aircraft observations of the Tampa urban plume during BRACE: transport, 615
photochemical, and depositional processes. Presented at the AGU Fall Meeting, 8-12 616
December, San Francisco, CA. 617
618
Mizak, C. A., Campbell, S. W., Luther, M. E., Carnahan, R. P., Murphy, R. J., Poor, N. D., 619
2005. Below-cloud ammonia scavenging in convective thunderstorms at a coastal research 620
site in Tampa, FL, USA. Atmospheric Environment 39, 1575-1584. 621
622
Mizak, C. A., Campbell, S. W., Sopkin, K., Gilbert, S., Luther, M., Poor, N., 2007. Effect of 623
shoreline meteorological measurements on NOAA buoy model prediction of coastal air-sea 624
gas transfer. Atmospheric Environment 41: 4304-4309. 625
626
Myles, L., Meyers, T. P., Robinson, L., 2007. Relaxed eddy accumulation measurements of 627
ammonia, nitric acid, sulfur dioxide and particulate sulfate dry deposition near Tampa, FL, 628
USA. Environmental Research Letters 2, doi: 10.1088/1748-9326/2/3/034004, 8 pp. 629
630

22
National Atmospheric Deposition Program (NADP), 2011. National Trends Network, 631
http://nadp.sws.uiuc.edu/ntn/. National Atmospheric Deposition Program. Accessed 632
November 2, 2011. 633
634
Nolte, C. G., Bhave, P. V., Arnold, J. R., Dennis, R. L., Zhang, K. M., Wexler, A. S., 2008. 635
Modeling urban and regional aerosols—Application of the CMAQ-UCD aerosol module to 636
Tampa, a coastal urban site. Atmospheric Environment 42: 3179-3191. 637 638
Park, S. S., Pancras, J. P., Ondov, J., Poor, N., 2005. A new pseudo-deterministic 639
multivariate receptor model for accurate individual source apportionment using highly time-640
resolved ambient concentration measurements. Journal of Geophysical Research 110: 641
D07S15. 642
643
Patwardhan, A. S., Donigian, Jr., A. S., 1997. Assessment of nitrogen loads to aquatic 644
systems. United States Environmental Protection Agency, National Exposure Research 645
Laboratory, Athens, GA. USEPA/600/SR-95/173, January 1997. 646
647
Pinder, R. W., Gilliland, A. B., Dennis, R. L., 2008. Environmental impact of atmospheric 648
NH3 emissions under present and future conditions in eastern United States. Geophysical 649
Research Letters 35: L12808, doi: 10.1029/2008GL033732. 650
651
Poe, A., Hackett, K., Janicki, S., Pribble, R., Janicki, A., 2005. Estimates of Total Nitrogen, 652
Total Phosphorus, Total Suspended Solids, and Biochemical Oxygen Demand Loadings to 653
Tampa Bay, Florida: 1999-2003, Final Report, March 2005. Tampa Bay Estuary Program 654
Technical Publication #02-05, St. Petersburg, FL, pp. 374. 655
656
Pollman, C., Poor, N. D., 2003. Export of Atmospherically Derived Nitrogen in the Tampa 657
Bay Watershed. American Geophysical Union (AGU) Fall Meeting, San Francisco, CA, 8-12 658
December. 659
660

23
Poor, N., 2008. Nitrogen Emission/Deposition Ratios for Air Pollution Sources that 661
Contribute to the Nitrogen Loading of Tampa Bay. Prepared for Environmental Protection 662
Commission of Hillsborough County, Tampa, FL, Pollution Recovery Fund Agreement 663
Number 06-02A, December, 55 pp. 664
665
Poor, N., Amalfitano, C., Ondov, J.M., Pancras, P., Gazula, S., Dasgupta, P., Al-Horr, R., 666
2003. Real-time monitoring of gases and aerosols reveals source contributions to air quality. 667
NARSTO Workshop on Innovative Methods for Emission-Inventory Development and 668
Verification, Austin, TX, 14-17 October. 669
670
Poor, N., Pollman, C., Tate, P., Begum, M., Evans, M., Campbell, S., 2006. Nature and 671
magnitude of atmospheric fluxes of total inorganic nitrogen and other inorganic species to 672
the Tampa Bay Watershed, FL, USA. Water, Air, and Soil Pollution 170: 267-283. 673
674
Poor, N., Pribble, R., Greening, H., 2001. Direct wet and dry deposition of ammonia, nitric 675
acid, ammonium, and nitrate to the Tampa Bay Estuary, FL, USA. Atmospheric Environment 676
35: 3947-3955. 677
678
Poor, N., Pribble, R., Schwede, D., Application of Watershed Deposition Tool to estimate 679
from CMAQ modeling the atmospheric deposition of nitrogen to Tampa Bay and its 680
watershed. In review by the Journal of the Air and Waste Management Association. 681
682
Pribble, R., Janicki, A., Zarbock, H., Janicki., S., Winowitch, M., 2001. Estimates of Total 683
Nitrogen, Total Phosphorus, Total Suspended Solids, and Biochemical Oxygen Demand 684
Loadings to Tampa Bay, Florida: 1995-1998, Final Report, July 2001. Tampa Bay Estuary 685
Program, St. Petersburg, FL, pp. 227. 686
687
Scire, J. S., Strimaitis, D. G., Yamartino, R., J., 2000. A User’s Guide for the CALPUFF 688
Dispersion Model (Version 5). Earth Tech, Inc., Concord, MA. 521 pp. 689
690

24
Sherwood, E. T., 2011. 2010 Tampa Bay Water Quality Assessment. Tampa Bay Estuary 691
Program Technical Report #01-11, St. Petersburg, FL. 2 pp. 692
693
Sopkin, K., Mizak, C., Gilbert, S., Subramanian, V., Luther, M., Poor, N., 2007. Modeling 694
air/sea flux parameters in a coastal area: a comparative study of results from the TOGA 695
COARE model and the NOAA buoy model. Atmospheric Environment 41: 4291-4303. 696
697
Strayer, H., Smith, R., Mizak, C., Poor, N., 2007. Influence of air mass origin on the wet 698
deposition of nitrogen to Tampa Bay, Florida—An eight-year study. Atmospheric 699
Environment 41: 4310-4322. 700
701
TBNMC, 2010. 2009 Reasonable Assurance Addendum: Allocation and Assessment 702
Report. Tampa Bay Nitrogen Management Consortium Technical Publication #03-10, Tampa 703
Bay Estuary Program, St. Petersburg, FL. 704
705
TBEP, 2006. Charting the Course: The Comprehensive Conservation and Management Plan 706
for Tampa Bay. Tampa Bay Estuary Program, St. Petersburg, Florida. 707
708
TBNEP, 1996. Charting the Course: The Comprehensive Conservation and Management 709
Plan for Tampa Bay. Tampa Bay National Estuary Program, St. Petersburg, FL. 710
711
Tomasko, D. A., Corbett, C. A., Greening, H. S., Raulerson, 2005. Spatial and temporal 712
variation in seagrass coverage in Southwest Florida: assessing the relative effects of 713
anthropogenic nutrient load reductions and rainfall in four contiguous estuaries. Marine 714
Pollution Bulletin 50: 797-805. 715
716
USEPA, 2011a. Clear Air Interstate Rule, www.epa.gov/cair/. United States Environmental 717
Protection Agency. Accessed October 26, 2011. 718
719
USEPA, 2011b. Cross-State Air Pollution Rule, www.epa.gov/airtransport/. United States 720
Environmental Protection Agency. Accessed October 26, 2011. 721

25
722
USEPA, 2008. Technology Transfer Network Clearinghouse for Inventories & Emissions 723
Factors, 2002 National Emissions Inventory Data & Documentation, 724
http://www.epa.gov/ttn/chief/net/2002inventory.html. United States Environmental Protection 725
Agency. Accessed January 14, 2008. 726
727
USEPA, 2011. Clear Air Market—Progress and Results, Preliminary Summary Reports, 728
Quarterly SO2, NOx, CO2, and heat input data. 729
http://www.epa.gov/airmarkets/emissions/index.html. United States Environmental 730
Protection Agency. Accessed November 13, 2011. 731
732
Wexler, A. S., Clegg, S. I., 2002. Atmospheric aerosol models for systems including the ions 733
H+, NH4+, Na+, SO4
2-, NO3-, Cl-, Br-, and H2O. Journal of Geophysical Research 107, doi: 734
10.1029/2001JD000451. 735
736
Zhang, K. M., Wexler, A. S., 2008. Modeling urban and regional aerosols—Development of 737
the UCD Aerosol Module and implementation in CMAQ model. Atmospheric Environment 738
42, 3166-3178. 739

26
740 741
Figure 1. Tampa Bay and its watershed. Also shown are the National Atmospheric 742
Deposition Program (NADP) National Trends Network (NTN) wet deposition monitoring 743
site at Verna Wellfield in Sarasota Count, the NADP Atmospheric Integrated Research 744
Monitoring Network (AIRMoN) site FL 18. 745
746

27
747 748
Figure 2. N loading rates to Tampa Bay by source category. Indirect atmospheric deposition 749
in included as a non-point source; other sources include domestic and industrial point 750
sources, springs, groundwater, and material losses (JEI, 2008; Poe et al., 2005; Pribble et al., 751
2001; TBNMC, 2010). 752
28
753 754
Figure 3. Comparison of annular denuder system (ADS) measurements of HNO3 made with 755
either a cyclone or impactor inlet versus ion chromatography (IC) measurements of HNO3 756
made with a short straight tube for an inlet. 757
758

29
759 Figure 4. Comparison of NO3
- aerosol distribution obtained with a micro-orifice impactor 760
(MOI) (tall curve) and fraction of this distribution captured by an annular denuder system 761
(ADS) (short curve). The MOI had an inlet with a coarse particle cut-point; the ADS had an 762
inlet with a fine particle cut-point. 763
764
765
0.0
0.2
0.4
0.6
0.8
0.01 0.10 1.00 10.00 100.00
Particle Diameter (m)
dC/d
lnD
(ug/
m3 )
30
766
Figure 5. Time-dependent concentrations of air pollutants measured at an air 767
pollution monitoring site near Sydney, Florida, on May 13, 2002. 768
31
769 Figure 6. Trends in quarterly Florida power plant NOx emissions and N wet deposition rates 770
at NADP’s Verna Wellfield monitoring site, Sarasota County, Florida. 771
772

32
773 Figure 7. Trends in quarterly Florida power plant NOx emissions and ambient air NOx 774
concentrations at Gandy Bridge and Azalea Park monitoring sites in Tampa and St. 775
Petersburg, Florida, respectively. 776
777
778