Embed Size (px)
Citation preview
GMI Workshop on Integrated Solid Waste Management, Mauritius September 2012
ISWM for East Africa
Lessons from ‘Solid Waste Management in the World’s Cities’
Andrew Whiteman

San Francisco,US Tompkins County, US
Managua, NC
Rotterdam, NL
Canete, PR
Belo Horizonte, BR Curepipe Lusaka,
ZM
Moshi,TZ
Nairobi, KE
Bamako, ML
Sousse, TU
Varna, BG
Delhi, IN
Ghorahi, NP
Bengaluru, IN Dhaka, BN
Kunming, CH
Quezon City, PH
Adelaide, AU
The 20 reference cities

What is ISWM?
The acronym is used to mean two different things:
Integrated solid waste management or
Integrated and sustainable waste management
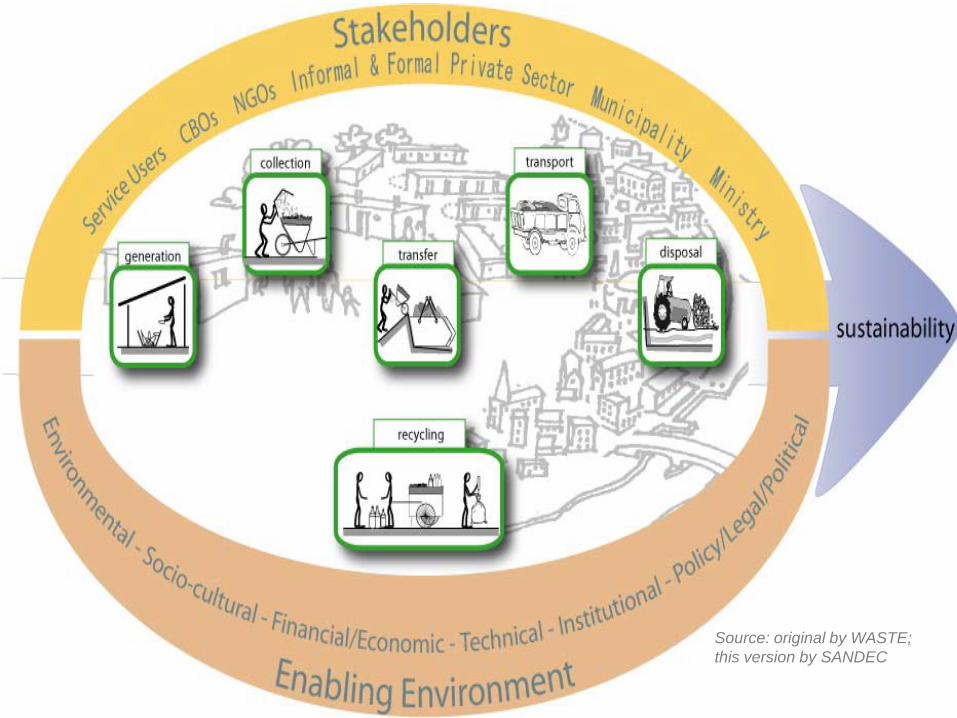
Source: original by WASTE; this version by SANDEC

Analytical Framework
3 key physical elements
• Public health/ collection
• Environmental protection/ disposal
• Resource management
3 key governance strategies • Inclusivity, of both users
and service providers
• Financial sustainablity
• Sound institutions and proactive policies

Public health
Maintaining healthy conditions in cities, particularly
through a good waste collection service.

Uncollected waste - public health issue
Waste dumped in
a stream, Nairobi
Burning uncollected waste, Venezuela
Waste blocking a
storm drain, Bamako, Mali
Dengue fever clean-up campaign, Quezon City
Photo credits clockwise from top left: © Jeroen Ijgosse; Erica Trauba; UN-Habitat; SWAPP
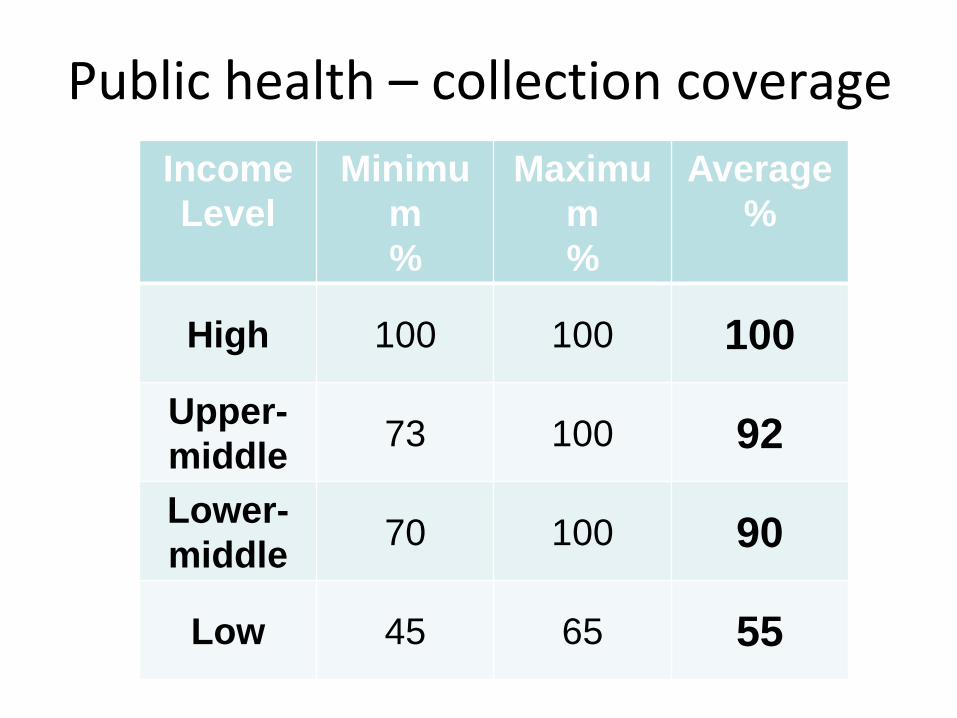
Public health – collection coverage Income Level
Minimum %
Maximum %
Average %
High 100 100 100
Upper-middle 73 100 92
Lower-middle 70 100 90
Low 45 65 55

Collection
Photo credits clockwise from top left: © WASTE; Erica Trauba; Justin Lang, Zero Waste South Australia; Curepipe Municipality; Ljiljana Rodic
Some examples of diversity
Door-to-door informal collector, India
Curepipe, Mauritius Adelaide, Australia Bicycle cart delivering to small transfer station in Kunming
CBO collection in Bamako, Mali
Environment
Protection of the environment throughout the waste chain, especially during waste
treatment and disposal.

Environmental control – waste disposal
Income Level
State of the art –
incineration*
State of the art - landfill
Disposal at simple
controlled sites
Disposal at open dumps, losses, illegal
dumping
High 25% 75% 0% 0%
Upper-middle
0% 75% 20% 5%
Lower-middle
6% 55% 32% 7%
Low 0% 29% 24% 47%
* only two reference cities, Rotterdam and Kunming, have state-of-the-art incinerators, so the incinerator/ landfill split should NOT to be taken as representative

Range of approaches to disposal State-of-the-art
Landfill construction in Lusaka Cows grazing by illegal dump in Bamako
Simple control
No control Incinerator construction in Kunming, viewed from the landfill
No control
Payatas site, Quezon City
Photo credits clockwise from top left: © Ljiljana Rodic; SWAPP; Erica Trauba; Lusaka City Council/ Jan G Tesink

The Hierarchy

Resource management
‘Closing the loop’ by returning both materials
and nutrients to beneficial use, through preventing waste and striving for high rates
of reuse, recycling and recovery.

Product, materials and waste flow
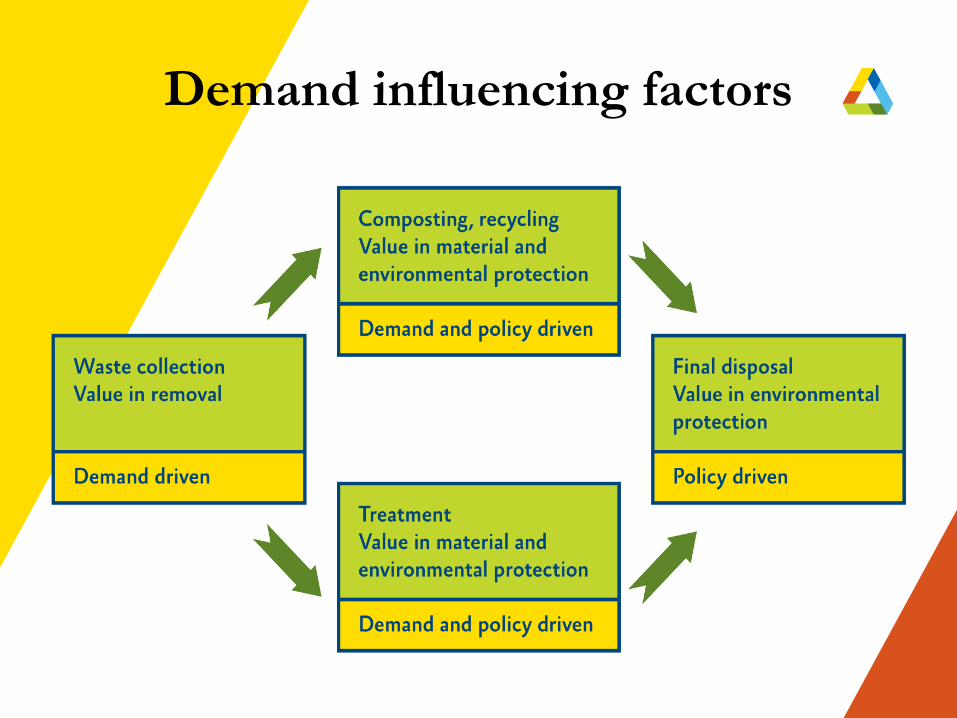
Demand influencing factors

Resource recovery – recycling rates
Income Level
Minimum %
Maximum %
Average %
High 30 72 54
Upper-middle 7 27 15
Lower-middle 6 39 27
Low 6 85 27
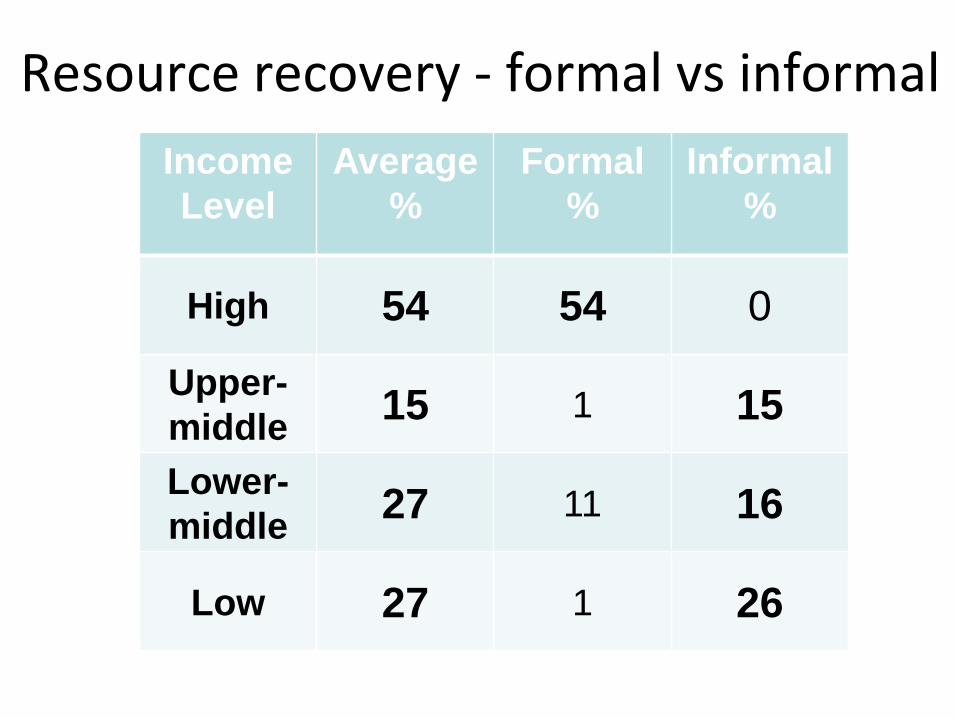
Resource recovery - formal vs informal Income Level
Average %
Formal %
Informal %
High 54 54 0
Upper-middle 15 1 15
Lower-middle 27 11 16
Low 27 1 26

How many professional waste workers in the community / informal sector? City % of total
population Bengaluru 0.5%
Belo Horizonte 0.0% Canete 0.4% Delhi 1.3%
Dhaka 1.7% Ghorahi 0.1% Lusaka 0.0%
Managua 0.3% Quezon City 0.5%
Sousse 0.1% Average 0.5%
Total workers in 10 cities 350,000
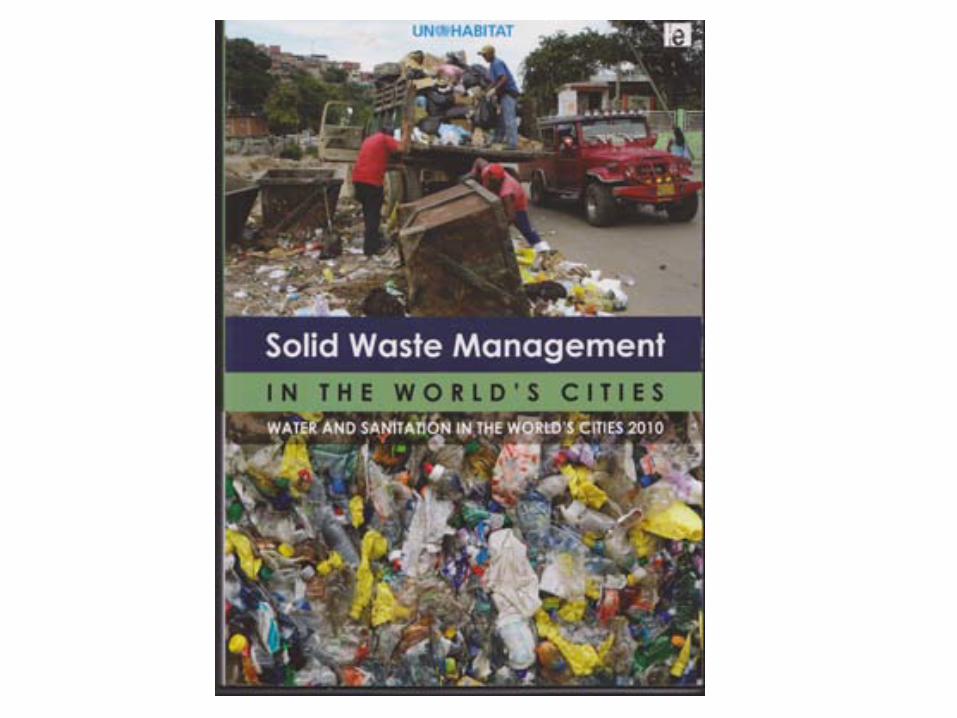
Source: Scheinberg A, Wilson D.C. and Rodic L. (2010). Solid Waste Management in the World’s Cities. Published for UN-Habitat by Earthscan, London
Global estimate: 15
million
Source: 2010 World Congress of Waste Pickers

Building on the informal recycling sector
• Relies entirely on the market value of materials
• Saves cities $m in avoided collection & disposal costs
• Major opportunity for win-win solutions – Build recycling rates – Improve livelihoods – Improve working conditions – Save the city money
Itinerant waste buyer in Brazil Sorting recycled plastics in Delhi
Photo credits: © Jeroen Ijgosse, Enrico Fabian

Case study: Quezon City, Philippines
NGO-led ‘Linis Ganda’ Linkages across supply chain Recognition & respectability uniforms, ID, access politically connected
Organise co-operatives Facilitate affordable credit Photo credits: Embassy of Japan in the
Philippines; Government of the Philippines, 2006
Year Total IWBs 1997 6% 4% 2006 25% 16% 2009 37% 24%
Sharp increase in recycling

The ISWM Framework: Governance elements
• Be inclusive, providing transparent spaces for stakeholders to contribute as users, providers and enablers.
• Be financially sustainable, which means cost-effective and affordable
• Rest on a base of sound institutions and pro-active policies
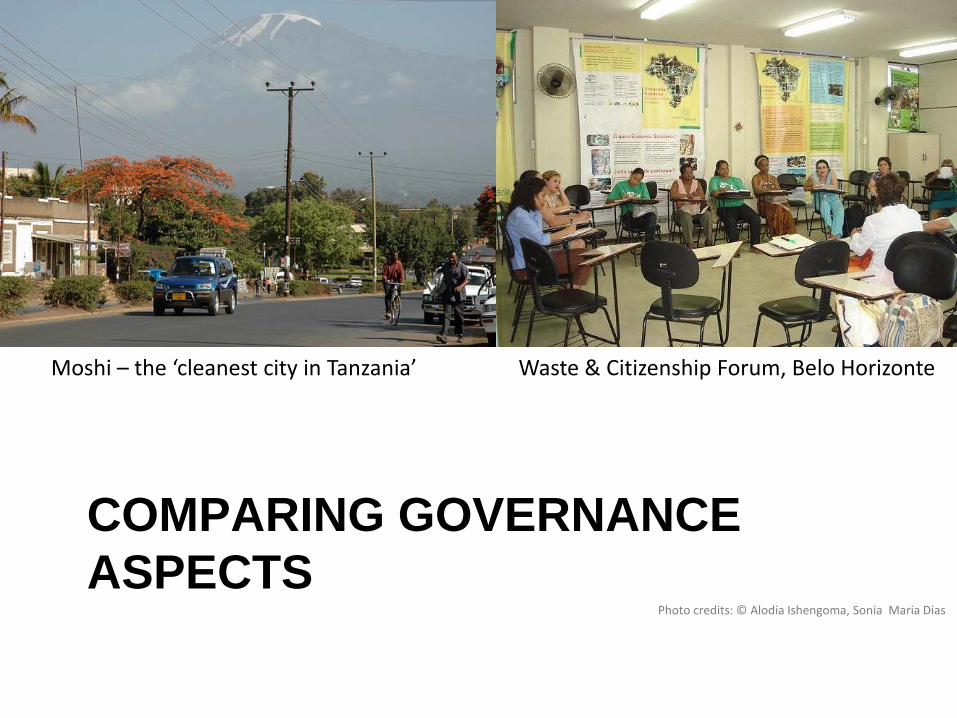
COMPARING GOVERNANCE ASPECTS
Photo credits: © Alodia Ishengoma, Sonia Maria Dias
Moshi – the ‘cleanest city in Tanzania’ Waste & Citizenship Forum, Belo Horizonte

Inclusivity – comparing indicators Incom
e Level
User Inclusivi
ty Rating
Provider Inclusivi
ty Rating
High High Medium Upper-middle Medium Medium
Lower-middle Medium Medium
Low Medium Medium
Only 2 cities scored high on both criteria • Adelaide • Belo Horizonte
Photo credit: © Sonia Maria Dias
Sorting plant operated by a recyclers’ co-operative in Belo Horizonte, Brazil


Financial sustainability – fee collection for formal waste services to households
Direct charging via a waste bill or a utility bill
(U)
Direct waste fee + property
tax
No direct fee (financed via property tax)
No direct fee (finance from
general sources)
Adelaide Bamako Belo Horizonte Ghorahi Canete Bengaluru Curepipe Quezon City
Kunming Delhi Lusaka Dhaka Moshi Managua
Nairobi (U) Sousse Rotterdam (U) San Francisco
Tompkins County

Financial sustainability – fee collection Income Level
SW fee as % of
household income
% of population
that pays for collection
Reported cost
recovery % via fees
High 0.44% 99% 81%
Upper-middle 1.4% 56% 36%
Lower-middle 0.26% 28% 27%
Low 0.9% 59% 22%

Sound Institutions

The Missing 7th Function

REFLECTIONS
Photo credits: © City of Rotterdam; Kossara Bozhilova-Kisheva; Bhushan Tuladhar
A diversity of approaches to separate collection for recycling
Kerbside sort in Rotterdam Bring bins in Varna, Bulgaria
Exchanging recyclables for onions Siddhipur, Nepal
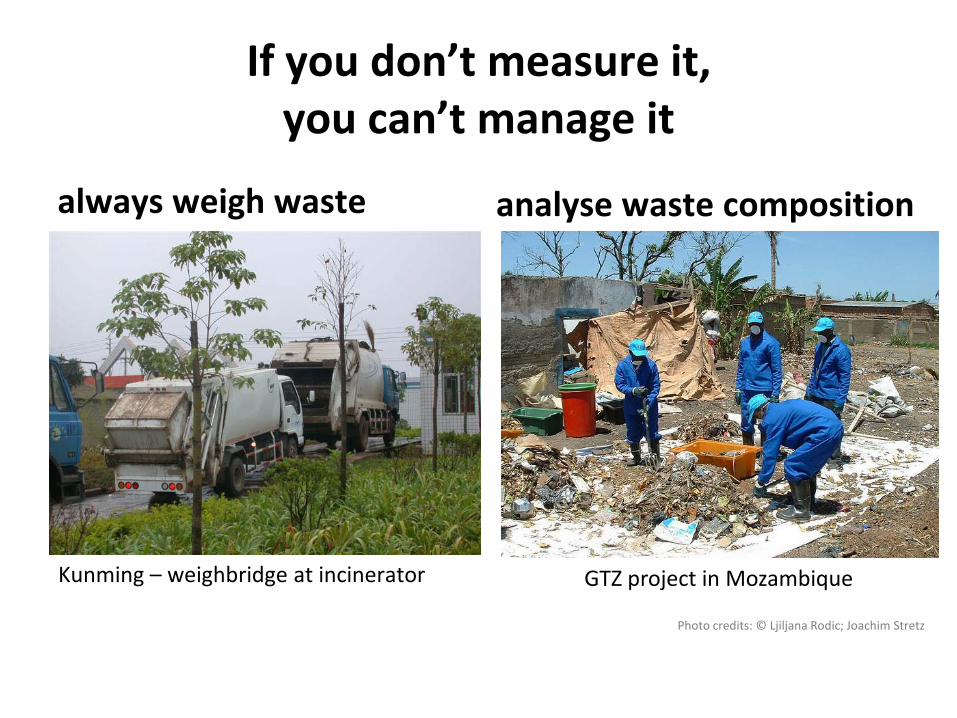
If you don’t measure it, you can’t manage it
always weigh waste
Kunming – weighbridge at incinerator
analyse waste composition
Photo credits: © Ljiljana Rodic; Joachim Stretz
GTZ project in Mozambique
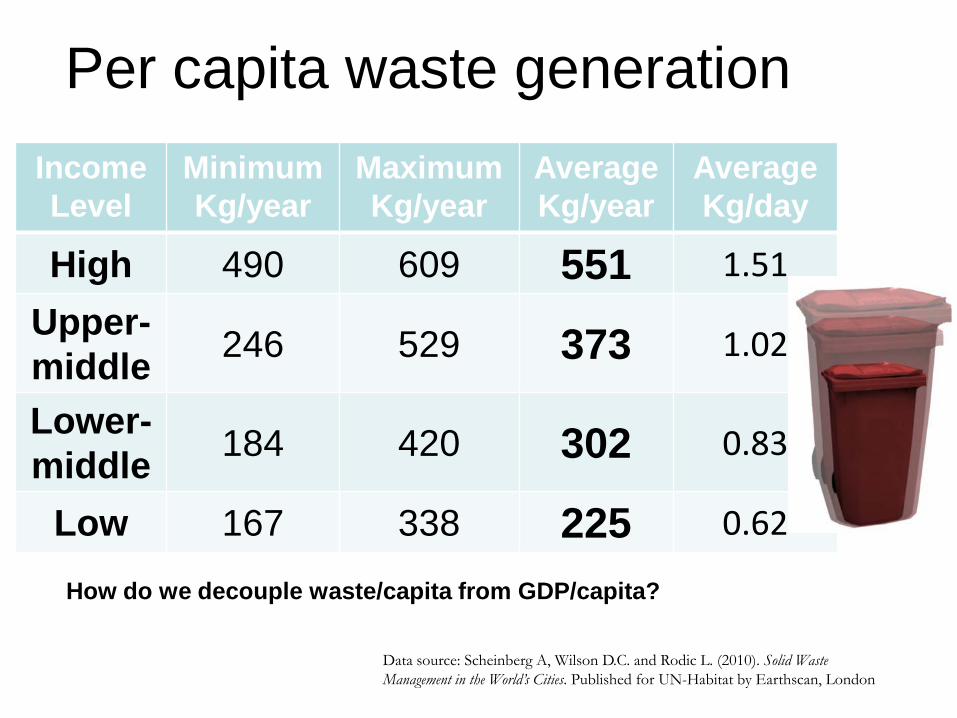
Per capita waste generation Income Level
Minimum Kg/year
Maximum Kg/year
Average Kg/year
Average Kg/day
High 490 609 551 1.51
Upper-middle 246 529 373 1.02
Lower-middle 184 420 302 0.83
Low 167 338 225 0.62
Data source: Scheinberg A, Wilson D.C. and Rodic L. (2010). Solid Waste Management in the World’s Cities. Published for UN-Habitat by Earthscan, London
How do we decouple waste/capita from GDP/capita?
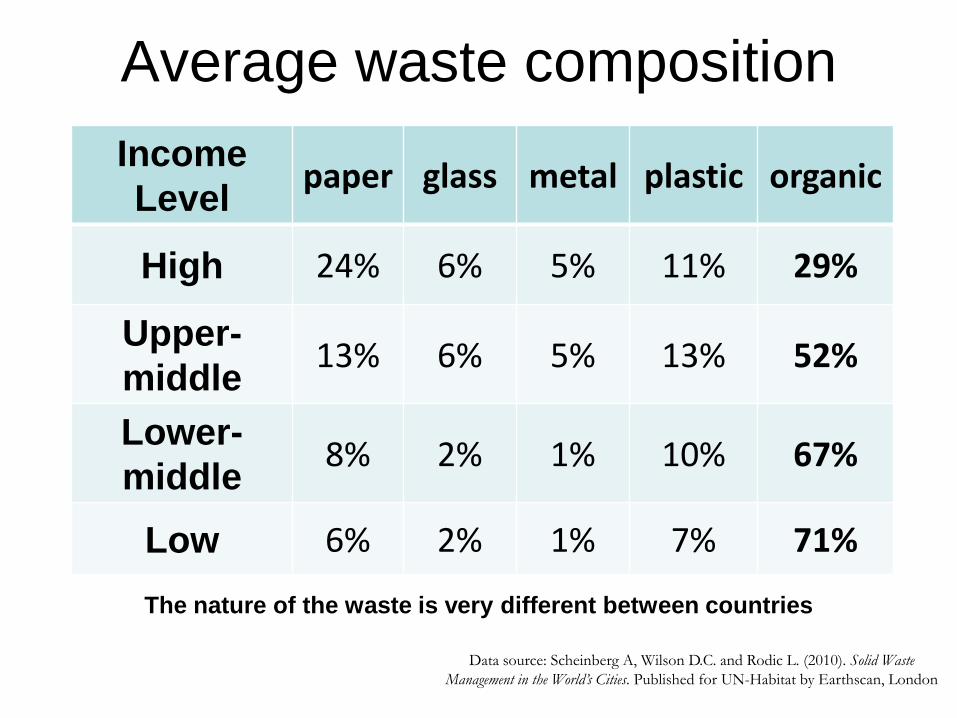
Average waste composition Income Level paper glass metal plastic organic
High 24% 6% 5% 11% 29%
Upper-middle 13% 6% 5% 13% 52%
Lower-middle 8% 2% 1% 10% 67%
Low 6% 2% 1% 7% 71%
Data source: Scheinberg A, Wilson D.C. and Rodic L. (2010). Solid Waste Management in the World’s Cities. Published for UN-Habitat by Earthscan, London
The nature of the waste is very different between countries

Key messages of SWWC
• No one size fits all – need a local solution
• Commitment does more than money: several poor cities with good systems
• Building on what you have works
• Including informal activities in formal reporting would make cities look a lot better
• Technical ambitions need to be modified to achieve affordability

Thank you for your attention!
You can buy the book at
www.earthscan.co.uk using discount code EN0910
GMI Workshop on Integrated Solid Waste Management, Mauritius September 2012
Estimated investment demand in East African countries
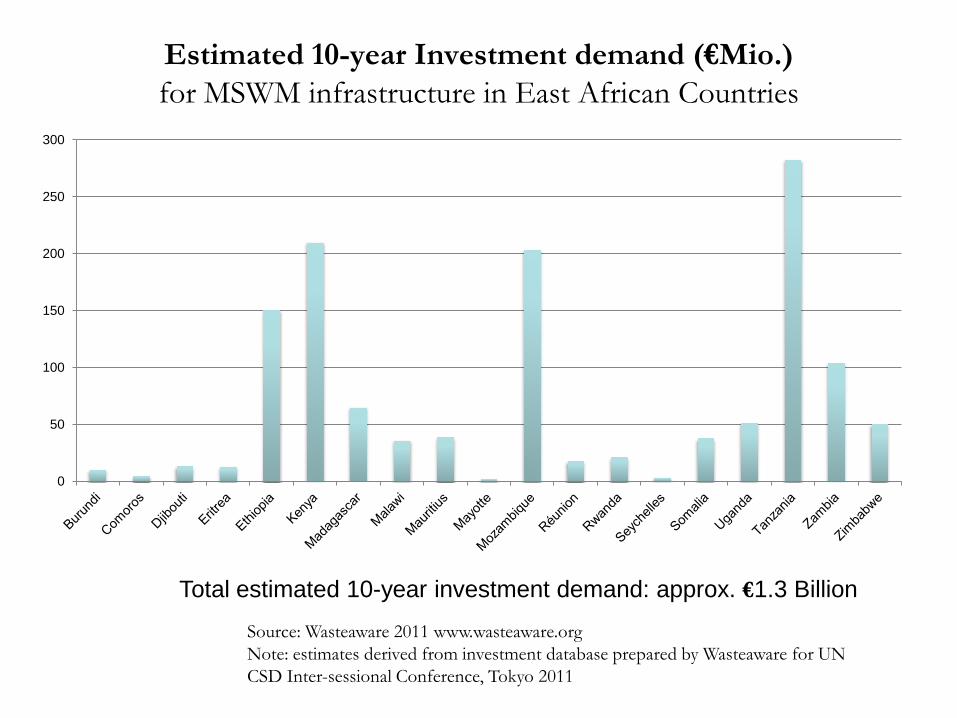
Estimated 10-year Investment demand (€Mio.) for MSWM infrastructure in East African Countries
Source: Wasteaware 2011 www.wasteaware.org Note: estimates derived from investment database prepared by Wasteaware for UN CSD Inter-sessional Conference, Tokyo 2011
Total estimated 10-year investment demand: approx. €1.3 Billion
0
50
100
150
200
250
300
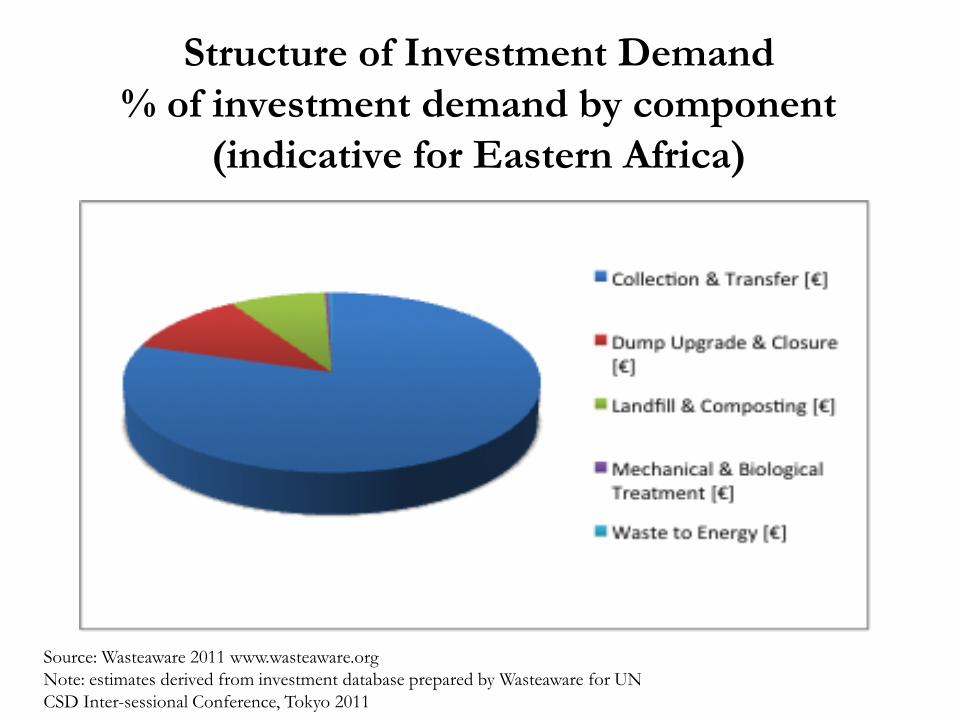
Structure of Investment Demand % of investment demand by component
(indicative for Eastern Africa)
Source: Wasteaware 2011 www.wasteaware.org Note: estimates derived from investment database prepared by Wasteaware for UN CSD Inter-sessional Conference, Tokyo 2011