Embed Size (px)
Citation preview
NYS COMMON CORE MATHEMATICS CURRICULUM 8•6 Lesson 9
Lesson 9: Determining the Equation of a Line Fit to Data Date: 3/4/15
S.70
© 2014 Common Core, Inc. Some rights reserved. commoncore.org This work is licensed under a Creative Commons Attribution-NonCommercial-ShareAlike 3.0 Unported License.
Lesson 9: Determining the Equation of a Line Fit to Data
Classwork
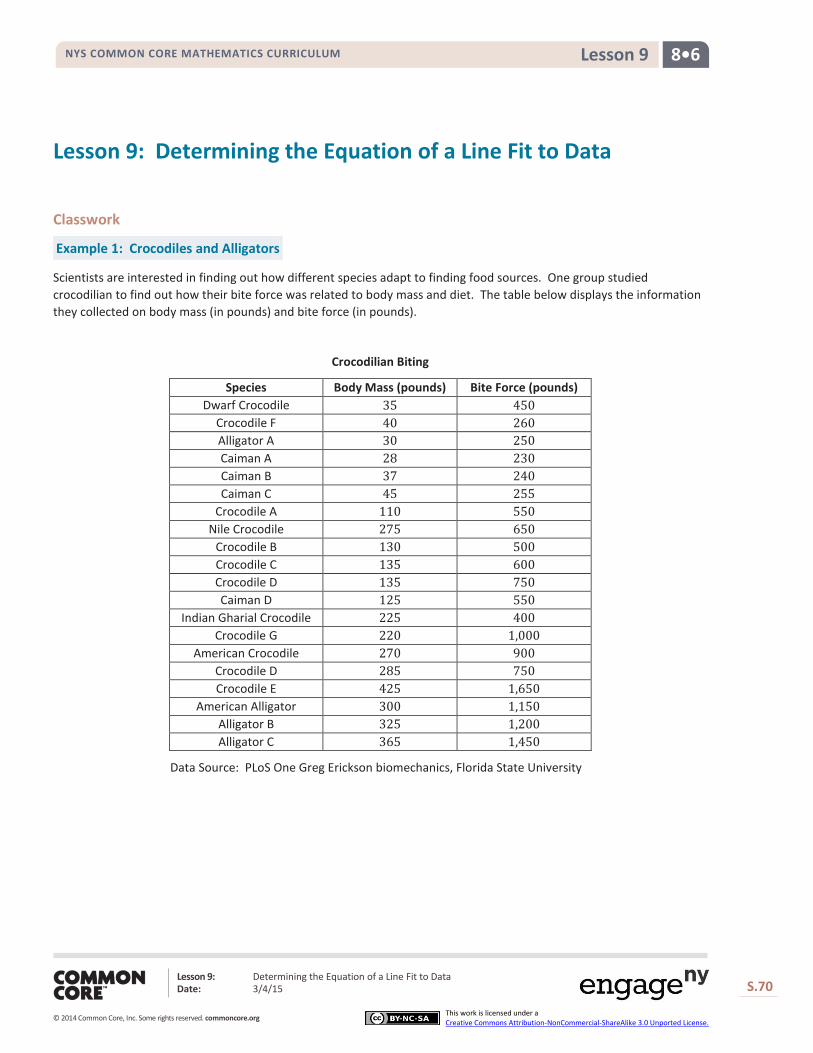
Example 1: Crocodiles and Alligators
Scientists are interested in finding out how different species adapt to finding food sources. One group studied
crocodilian to find out how their bite force was related to body mass and diet. The table below displays the information
they collected on body mass (in pounds) and bite force (in pounds).
Crocodilian Biting
Species Body Mass (pounds) Bite Force (pounds)
Dwarf Crocodile 35 450
Crocodile F 40 260
Alligator A 30 250
Caiman A 28 230
Caiman B 37 240
Caiman C 45 255
Crocodile A 110 550
Nile Crocodile 275 650
Crocodile B 130 500
Crocodile C 135 600
Crocodile D 135 750
Caiman D 125 550
Indian Gharial Crocodile 225 400
Crocodile G 220 1,000
American Crocodile 270 900
Crocodile D 285 750
Crocodile E 425 1,650
American Alligator 300 1,150
Alligator B 325 1,200
Alligator C 365 1,450
Data Source: PLoS One Greg Erickson biomechanics, Florida State University

NYS COMMON CORE MATHEMATICS CURRICULUM 8•6 Lesson 9
Lesson 9: Determining the Equation of a Line Fit to Data Date: 3/4/15
S.71
© 2014 Common Core, Inc. Some rights reserved. commoncore.org This work is licensed under a Creative Commons Attribution-NonCommercial-ShareAlike 3.0 Unported License.
Body Mass (pounds)
Bit
e F
orc
e (
po
un
ds)
4003002001000
1800
1600
1400
1200
1000
800
600
400
200
0
As you learned in the previous lesson, it is a good idea to begin by looking at what a scatter plot tells you about the data.
The scatter plot below displays the data on body mass and bite force for the crocodilian in the study.
Exercises 1–6
1. Describe the relationship between body mass and bite force for the crocodilian shown in the scatter plot.
2. Draw a line to represent the trend in the data. Comment on what you considered in drawing your line.
3. Based on your line, predict the bite force for a crocodilian that weighs 220 pounds. How does this prediction
compare to the actual bite force of the 220-pound crocodilian in the data set?

NYS COMMON CORE MATHEMATICS CURRICULUM 8•6 Lesson 9
Lesson 9: Determining the Equation of a Line Fit to Data Date: 3/4/15
S.72
© 2014 Common Core, Inc. Some rights reserved. commoncore.org This work is licensed under a Creative Commons Attribution-NonCommercial-ShareAlike 3.0 Unported License.
4. Several students decided to draw lines to represent the trend in the data. Consider the lines drawn by Sol, Patti,
Marrisa, and Taylor, which are shown below.
For each student, indicate whether or not you think the line would be a good line to use to make predictions. Explain
your thinking.
a. Sol’s line
b. Patti’s line
c. Marrisa’s line
d. Taylor’s line
Body Mass (pounds)
Bit
e F
orc
e (
po
un
ds)
400350300250200150100500
1800
1600
1400
1200
1000
800
600
400
200
0
Sol's Line
Body Mass (pounds)
Bit
e F
orc
e (
po
un
ds)
400350300250200150100500
1800
1600
1400
1200
1000
800
600
400
200
0
Marrisa's Line
Body Mass (pounds)
Bit
e F
orc
e (
po
un
ds)
400350300250200150100500
1800
1600
1400
1200
1000
800
600
400
200
0
Patti's Line

NYS COMMON CORE MATHEMATICS CURRICULUM 8•6 Lesson 9
Lesson 9: Determining the Equation of a Line Fit to Data Date: 3/4/15
S.73
© 2014 Common Core, Inc. Some rights reserved. commoncore.org This work is licensed under a Creative Commons Attribution-NonCommercial-ShareAlike 3.0 Unported License.
5. What is the equation of your line? Show the steps you used to determine your line. Based on your equation, what
is your prediction for the bite force of a crocodilian weighing 200 pounds?
6. Patti drew vertical line segments from two points to the line in her scatter plot. The first point she selected was for
a Dwarf Crocodile. The second point she selected was for an Indian Gharial Crocodile.
a. Would Patti’s line have resulted in a predicted bite force that was closer to the actual bite force for the Dwarf
Crocodile or for the Indian Gharial Crocodile? What aspect of the scatter plot supports your answer?
b. Would it be preferable to describe the trend in a scatter plot using a line that makes the differences in the
actual and predicted values large or small? Explain your answer.
Body Mass (pounds)
Bit
e F
orc
e (
po
un
ds)
400350300250200150100500
1800
1600
1400
1200
1000
800
600
400
200
0
Dwarf Croc
Indian Gharial Croc

NYS COMMON CORE MATHEMATICS CURRICULUM 8•6 Lesson 9
Lesson 9: Determining the Equation of a Line Fit to Data Date: 3/4/15
S.74
© 2014 Common Core, Inc. Some rights reserved. commoncore.org This work is licensed under a Creative Commons Attribution-NonCommercial-ShareAlike 3.0 Unported License.
Exercise 7: Used Cars
7. The plot below shows the age (in years) and price (in dollars) of used Honda Civic cars that were advertised in a local
newspaper.
a. Based on the scatter plot above, describe the relationship between the age and price of the used cars.
b. Nora drew a line she thought was close to many of the points and found the equation of the line. She used the
points (13, 6000) and (7, 12000) on her line to find the equation. Explain why those points made finding the
equation easy.
Age (years)
Pri
ce
(d
olla
rs)
1817161514131211109876543210
16000
15000
14000
13000
12000
11000
10000
9000
8000
7000
6000
5000
4000
3000
2000
1000
0
Age (years)
Pri
ce
(d
olla
rs)
1817161514131211109876543210
16000
15000
14000
13000
12000
11000
10000
9000
8000
7000
6000
5000
4000
3000
2000
1000
0
NYS COMMON CORE MATHEMATICS CURRICULUM 8•6 Lesson 9
Lesson 9: Determining the Equation of a Line Fit to Data Date: 3/4/15
S.75
© 2014 Common Core, Inc. Some rights reserved. commoncore.org This work is licensed under a Creative Commons Attribution-NonCommercial-ShareAlike 3.0 Unported License.
c. Find the equation of Nora’s line for predicting the price of a used car given its age. Summarize the trend
described by this equation.
d. Based on the line, for which car in the data set would the predicted value based on the line be farthest from
the actual value? How can you tell?
e. What does the equation predict for the cost of a 10-year-old car? How close was the prediction using the line
to the actual cost of the 10-year-old car in the data set? Given the context of the data set, do you think the
difference between the predicted price and the actual price is large or small?
f. Is $5,000 typical of the differences between predicted prices and actual prices for the cars in this data set?
Justify your answer.

NYS COMMON CORE MATHEMATICS CURRICULUM 8•6 Lesson 9
Lesson 9: Determining the Equation of a Line Fit to Data Date: 3/4/15
S.76
© 2014 Common Core, Inc. Some rights reserved. commoncore.org This work is licensed under a Creative Commons Attribution-NonCommercial-ShareAlike 3.0 Unported License.
Problem Set
1. Monopoly is a popular board game in many countries. The scatter plot below shows the distance from “Go” to a
property (in number of spaces moving from “Go” in a clockwise direction) and the price of the properties on the
Monopoly board. The equation of the line is 𝑃 = 8𝑥 + 40, where 𝑃 represents the price (in Monopoly dollars) and
𝑥 represents the distance (in number of spaces).
Distance from “Go”
(number of spaces)
Price of Property
(Monopoly dollars)
Distance from “Go”
(number of spaces)
Price of Property
(Monopoly dollars)
1 60 21 220
3 60 23 220
5 200 24 240
6 100 25 200
8 100 26 260
9 120 27 260
11 140 28 150
12 150 29 280
13 140 31 300
14 160 32 300
15 200 34 320
16 180 35 200
18 180 37 350
19 200 39 400
Lesson Summary
A line can be used to represent the trend in a scatter plot.
Evaluating the equation of the line for a value of the independent variable will determine a value
predicted by the line.
A good line for prediction is one that goes through the middle of the points in a scatter plot and for which
the points tend to fall close to the line.

NYS COMMON CORE MATHEMATICS CURRICULUM 8•6 Lesson 9
Lesson 9: Determining the Equation of a Line Fit to Data Date: 3/4/15
S.77
© 2014 Common Core, Inc. Some rights reserved. commoncore.org This work is licensed under a Creative Commons Attribution-NonCommercial-ShareAlike 3.0 Unported License.
Price of Property vs. Distance from “Go” in Monopoly
a. Use the equation to find the difference (observed value − predicted value) for the most expensive property
and for the property that is 35 spaces from “Go.”
b. Five of the points seem to lie in a horizontal line. What do these points have in common? What is the
equation of the line containing those five points?
c. Four of the five points described in part (b) are the railroads. If you were fitting a line to predict price with
distance from “Go,” would you use those four points? Why or why not?
2. The table below gives the coordinates of the five points shown in the scatter plots that follow. The scatter plots
show two different lines.
Data Point Independent Variable Response Variable
𝐴 20 27
𝐵 22 21
𝐶 25 24
𝐷 31 18
𝐸 40 12

NYS COMMON CORE MATHEMATICS CURRICULUM 8•6 Lesson 9
Lesson 9: Determining the Equation of a Line Fit to Data Date: 3/4/15
S.78
© 2014 Common Core, Inc. Some rights reserved. commoncore.org This work is licensed under a Creative Commons Attribution-NonCommercial-ShareAlike 3.0 Unported License.
Line 1 Line 2
a. Find the predicted response values for each of the two lines.
Independent Observed
Response
Response
Predicted by Line 1
Response
Predicted by Line 2
b. For which data points is the prediction based on Line 1 closer to the actual value than the prediction based on
Line 2?
c. Which line (Line 1 or Line 2) would you select as a better fit?
Independent Variable
Re
sp
on
se
Va
ria
ble
40353025200
28
26
24
22
20
18
16
14
12
10
0
y = -0.9 + 45
Independent Variable
Re
sp
on
se
Va
ria
ble
40353025200
28
26
24
22
20
18
16
14
12
10
0
y = -0.7 + 40𝒚 = −𝟎.𝟗𝒙 + 𝟒𝟓 𝒚 = −𝟎.𝟕𝒙 + 𝟒𝟎

NYS COMMON CORE MATHEMATICS CURRICULUM 8•6 Lesson 9
Lesson 9: Determining the Equation of a Line Fit to Data Date: 3/4/15
S.79
© 2014 Common Core, Inc. Some rights reserved. commoncore.org This work is licensed under a Creative Commons Attribution-NonCommercial-ShareAlike 3.0 Unported License.
Body Mass (pounds)
Bit
e F
orc
e (
po
un
ds)
400350300250200150100500
1800
1600
1400
1200
1000
800
600
400
200
0
Line 1
Body Mass (pounds)
Bit
e F
orc
e (
po
un
ds)
400350300250200150100500
1800
1600
1400
1200
1000
800
600
400
200
0
Line 2
3. The scatter plots below show different lines that students used to model the relationship between body mass (in
pounds) and bite force (in pounds) for crocodilian.
a. Match each graph to one of the equations below and explain your reasoning. Let 𝐵 represent bite force (in
pounds) and 𝑊 represent body mass (in pounds).
Equation 1 Equation 2 Equation 3
𝐵 = 3.28𝑊 + 126 𝐵 = 3.04𝑊 + 351 𝐵 = 2.16𝑊 + 267
Equation:
Equation:

NYS COMMON CORE MATHEMATICS CURRICULUM 8•6 Lesson 9
Lesson 9: Determining the Equation of a Line Fit to Data Date: 3/4/15
S.80
© 2014 Common Core, Inc. Some rights reserved. commoncore.org This work is licensed under a Creative Commons Attribution-NonCommercial-ShareAlike 3.0 Unported License.
Equation:
b. Which of the lines would best fit the trend in the data? Explain your thinking.
4. Comment on the following statements:
a. A line modeling a trend in a scatter plot always goes through the origin.
b. If the response variable increases as the independent variable decreases, the slope of a line modeling the
trend will be negative.