Embed Size (px)
Citation preview
Lesson 6: Would You Swim There? Handouts, Visuals, Answer Guides
Handout #1 1 Lesson 6: Would You Swim There?
Concepts:
Marginal analysis
Content Standards:
Standard 2: Effective decision making requires comparing the additional costs of alternatives with the additional benefits. Most choices involve doing a little more or a little less of something’ few choices are all-or-nothing decisions.
Overview
Our public discussions about pollution often rest on the unstated assumption that no price is too much to pay to save the environment. We tend to seek all-or-nothing solutions, rather than asking how much pollution we are willing to tolerate or how much clean-up we are willing to pay for.
This lesson asks students to apply marginal analysis by calculating the additional costs and additional benefits of the next level of pollution clean-up. As students decide whether to transform a dirty pond into a swimming hole, they weigh the costs and benefits of each step of the trans-formation. By engaging in marginal analysis, students also learn that people have a demand for environmental quality and are willing to pay for, or purchase, environmental quality as long as the benefits outweigh the costs. This leads to two insights:
100% pollution clean-up is never the only possible choice, and it may not be the best one; people demand different levels of environmental quality, depending on their values and the alternatives available to them; and
coercion (through government, law, and regulation) is not the only or the best way to achieve environmental protection; people acting as private citizens can and do protect the environment and clean up pollution.
Teacher Background
Thinking in terms of all-or-nothing solutions is not only unrealistic; it blocks our thinking about creative ways to achieve environmental goals. In our daily lives, most of the decisions we make are about doing or having a little more or a little less of something. Rarely do we face all-or-nothing alternatives. Marginal analysis, a powerful tool of economic reasoning, directs us to consider the additional costs and additional benefits of having a little more or a little less of something, instead of falling into the all-or-nothing trap. It sounds complicated but marginal analysis is so intuitively obvious that we do it all the time without thinking about it.
For example, how do you decide how much water to drink on a hot day? You decide one glass, or one gulp, at a time, based on how much satisfaction you think you’ll get from the next gulp or next cup. The first cool gulp? You anticipate huge satisfaction, so you eagerly drink it. And then, what
Lesson 6: Would You Swim There? Handouts, Visuals, Answer Guides
Handout #1 2 about the second? Not as much satisfaction as from the first, but still enough that you drink it. What about the third? The fourth? Decision-making at the margin reveals that the additional satisfaction decreases. Economists call this diminishing marginal utility, which means that at some point you won’t anticipate enough satisfaction to take another drink. Thus, the important question for the thirsty individual is not whether to have four drinks or none, but whether to have the next drink.
In addition to being an everyday decision-making tool, marginal analysis is particularly powerful for analyzing emotion-laden issues like pollution and environmental quality. In this lesson, students discover that the important question for those concerned with environmental quality isn’t whether to clean up pollution or not, but whether paying for the next level of cleanliness is worthwhile. Marginal analysis helps to counteract our collective tendency to approach pollution as an all-or-nothing issue in which we look only at total costs and total benefits, and opens our thinking to creative alternatives for achieving environmental goals.
Lesson Six is more than an intellectual exercise about possibilities; many real-world examples exist. One involves the work of “enviro-capitalist,” Peter S. O’Neill, a developer who prides himself on preserving and enhancing the beauty of natural surroundings and stream habitat. River Run (O’Neill’s development in Boise, Idaho) exemplifies his work.
“O’Neill recognized the growing demand for natural amenities in an urban setting and responded by building communities for fish as well as people. Among his early achievements was a project that revitalized a river and created one of the nation’s first urban spawning streams for trout. O’Neill recognized that visually pleasing and biologically productive surroundings are assets that add to property values. Hence, his housing developments offer free-flowing trout streams, lush streamside vegetation, and biologically diverse lakes and wetlands. . . .
As a partner in the River Run Development Company, O’Neill was not satisfied with these efforts. To him, it was obvious that the development could improve the environment even more, especially where there was an unsightly half-mile flood-relief channel that paralleled the northern border of the development and the Boise River. . . .
At a cost of $30,000 for modifying the flood control channel, the investment was substantial, but O’Neill decided to push ahead with the project. . . .
Because it took several years for vegetation to take hold and spread along the stream banks, the benefits of the project were not immediately visible. But once the natural system began to mature, the amenities became more visible, and the trout began to flourish. . . .
Since completing River Run, O’Neill has developed four other projects and is working on a fifth. . . . Has the expense and trouble been worth it for O’Neill? Undoubtedly, his housing developments command a financial premium because of their amenities. But on a personal level, O’Neill enjoys a tremendous personal satisfaction from the way he improved the environment.” (Anderson & Leal,

Lesson 6: Would You Swim There? Handouts, Visuals, Answer Guides
Handout #1 3 1997, pp. 1216 The stories of Peter O’Neill and many other private environmentalists can be found in Enviro-Capitalists—Doing Good While Doing Well, by Terry L. Anderson and Donald R. Leal.)

Lesson 6: Would You Swim There? Handouts, Visuals, Answer Guides
Handout #1 4 Activities for Lesson 6: Would You Swim There?
In the “Would You Swim There?” simulation, students play the roles of community members wrestling with the problem of cleaning up a polluted pond on their common property. They quickly discover that because of their different values and interests, the important question is not whether to clean up the pond, but how much clean-up they are willing to pay for.
Time Required:
2-3 class periods
Materials:
1 copy of handouts #1, 2, and 10 for each student Overhead transparency or slide of visuals #1 & 2 Copies of handouts #3-9 (Students will be divided into 7 groups and each group will
receive a different handout. Copy handouts on different colored paper; 2 or 3 per group. Download: .doc file: Lesson 6: Handouts, Visuals & Answer Guides
Procedure:
1. Explain that in this lesson the students will play the parts of community members who are trying to clean up a pollution problem.
o Distribute (or display on overhead) Handout #1. Read the pond scenario and check to see that the students understand the issue. Ask: Where has your family moved? (To a planned community with a large pond.) Who owns the pond? (It’s common property, owned by all community members.)
2. Distribute Handout #2, the consultant’s report, and read through it with the class. 3. Divide students into seven interest groups and assign roles in each group:
o discussion leader (keeps group on task) o recorder (responsible for worksheets and/or recording discussion points) o time keeper (allow 15 minutes for discussion and 5 minutes for preparing your
group’s presentation) o encourager (responsible for bringing everyone into the discussion) activity) o reporter (responsible for presentation to the Board)
4. Provide each group with copies of the appropriate role handouts #3-9) o TP2 (Tired of Teenagers Tee-Peeing): A concerned-parents group that wants their
kids to have access to reasonable, healthy activities that will keep them out of trouble.
o KPK (Keep our Property Kleen): A dedicated environmentalist group that campaigns for the elimination of pollution, even if the solutions require sacrifices.
o Boosters: Active families and young adults who want and are willing to pay for a wide variety of recreational activities that are conveniently located, in order to eliminate the necessity of driving into the city. First-time homeowners with growing families and careers.

Lesson 6: Would You Swim There? Handouts, Visuals, Answer Guides
Handout #1 5
o Out-of-Sight-Out-of-Mind: These property owners are mostly elderly, retired people who live on the end of the development opposite the pond, where smaller, less expensive houses are arranged in patio clusters around a central activity center. They have no views of the pond and don’t believe that its existence—or disappearance—will have any effect on their lives. Many of these people live on fixed incomes, and they are less worried about their property values than they are about yearly membership fees charged by the homeowners’ association.
o PPP (Pond Perimeter Property owners): These people own the most expensive homes in the development, with large lots that back up to the greenbelt separating the community from the pond. Many of them assumed, without asking, that the pond would be cleaned up, and they are angry that it hasn’t been. Many purchased the lots because of the gardening potential and the accessibility of pond water for use in gardening. Needless to say, they were none too happy to find that the slimy sludge not only smells terrible, it kills their roses!
o The Fish: This group of teenagers is afraid that adults will overlook the most important thing about ponds—swimming. With their slogan, “Keep Us Off the Streets,” they are lobbying for a beach and a summer hang-out.
o The Homeowners Association Board: As members of the community, you share concerns with some other groups forming around the pond issue. However, as Board members, you have a responsibility to consider what’s best for the entire community. Although you are volunteers, you take your duties seriously and you want your decision on the pond issue to benefit as many people as possible, while imposing only reasonable costs.
5. After assigning roles, ask each group to meet, decide which level of pollution clean-up they support, and prepare a 3-5-minute presentation for the Homeowners’ Association Board meeting. The presentation should include a brief description of the group, the stage of the project they support and reasons for their choice.
o Display Visual #1. Instruct each group to ask the following questions about each stage of clean-up:
o How much additional benefit does the community gain by doing this clean-up? (If the community does nothing, there is no benefit. By completing Stage 1, people gain about $3.5 million in benefits.)
o How is this benefit distributed? Who gains? (Groups will determine whether or not they benefit, based on their role descriptions.)
o How much additional cost is there to attain this level of clean-up? (If the community does nothing, the cost is $0. If it completes Stage 1, the additional cost is $1 million.)
o While the students are working, set up the room for the Homeowners’ Association Board meeting. Instruct the Association president how to conduct a meeting.
6. Hold a Homeowners’ Association Board meeting in which each group makes its presentation.
o After the presentations are over, open the floor for questions and discussion. o Ask the Board members to make a decision and to tell why they decided as they
did. Ask for a show of hands from the homeowners to see how many would support the decision.
Lesson 6: Would You Swim There? Handouts, Visuals, Answer Guides
Handout #1 6
o Perhaps the Board will make the “right” decision, using marginal analysis. But the activity can work well even if the Board does not use marginal analysis, provided that the debriefing is conducted carefully and thoroughly. Even if the Board fails to use marginal analysis, you can illustrate the power of marginal reasoning by showing the pitfalls in the Board’s reasoning.
7. Lead a class discussion to analyze the simulation. Ask: o How did you figure out which stage of the project to support? (Accept a variety of
answers. Encourage the students to talk about comparisons of costs and benefits from one step to the next. If students offer an answer based on total costs and total benefits, ask them why they did not look at costs at each step of the problem. The key to getting the students to accept this approach is to ask, at each step of the problem, what else could have been done with the money that was spent, and could a different expenditure provide the same or more benefit?)
o Marginal analysis means that we look at the additional costs and benefits of each step. Display Visual #2. Ask: For which state of the project were marginal benefits greatest? (Marginal benefits were greatest in the first step of the pollution clean-up project. Encourage students to consider why this would be the case. The biggest and most obvious pollution is the easiest to remove, requiring the least technological sophistication and making huge improvements that are immediately obvious. This is usually the case with pollution clean-up. Dollars spent produce the greatest results at the beginning of the project. Cleaning up more and more becomes more and more expensive.)
o For which state of the project were marginal benefits smallest? (Marginal benefits were smallest with the last step of the project. Spending the last million dollars results in less than $250,000 of benefit. Encourage students to examine the reasons for this. What is more expensive: hauling rusted cars out of the pond or filtering out microscopic pollutants? Again, this outcome tends to be true of all pollution clean-up projects. Removing the last five percent of pollution is certainly more expensive than removing the first five percent, and it may be more expensive than removing the first 95 percent!)
o For which state of the project were marginal costs greatest? (As we have set up the consultant’s report, marginal cost is the same for each step of the project. However, ask the students to look at marginal cost per 10 percent of pollution removed. The cost of removing the last 10 percent is $2 million—the cost of Stages 4 and 5.)
o At which state of the project were marginal costs smallest? (The cost of removing the first 10 percent of pollution is smallest—an average of about $250,000.)
o If the Board decided on the basis of marginal cost/marginal benefit, which stage of the project would it support? Why? (On the basis of marginal analysis, the Board would support only Stage 3 of the clean-up project. That is because, at Stage 1, a $1 million cost gets people about $3.5 million worth of benefits; at Stage 2, an additional $1 million cost gets people an additional $2 million worth of benefits; and at Stage 3, an additional $1 million cost gets people an additional $1 million worth of benefits. But at Stage 4, an additional $1 million cost gets people an additional benefit of only $750,000—less that the additional cost the community must pay.)
Lesson 6: Would You Swim There? Handouts, Visuals, Answer Guides
Handout #1 7
o Why does the marginal analysis provide a better way to decide than looking at the total costs and benefits? (Looking at the project in stages allows us to see what we are getting for each level of expenditure and to consider whether each additional step is worth it. What other things could the Homeowners’ Association do with the 4th million dollars? With the 5th or last million dollars? Might they be able to do something that gets them more benefit, or the same benefit by spending less—for example, building a swimming pool for $500,000 instead of doing the Stage 4 clean-up for $1 million?)
o Did people in the community share the costs and benefits of the project equally? Why or why not? Give examples. (In many homeowners’ associations, tenants pay the same yearly dues or fees to the association. In that case, each household pays the same cost. Students may argue, though, that because fees are charged per house, people with larger families, or with more children, pay a lower cost per individual. Regardless of whether the costs are shared equally, community members do not share the benefits equally. Some people have children; some do not. Some have gardens; some do not. Some houses have views of the pond; some do not. Additionally, the costs borne by different community members are in no way corre-lated with the benefits they receive.)
o Did the unequal distribution of costs and benefits make a difference to people in their decisions about which stage of the project they supported? (Yes. People tended to look at the costs and benefits to themselves and to others who shared their concerns and interests. For example, why might the retired people support only Stage 1 or 2 of the project instead of Stage 3? They fear that their fees will go up to cover the next $1 million expenditure, for which they will receive few benefits. They live where they can’t see the pond; they tend not to care about the recreational amenities. They’re not as worried about property values—which will accrue to their heirs when they die—as they are about immediate costs, like the homeowners’ association fees they pay.)
8. Closure: o What happened to marginal benefits as the project progressed through the stages?
(The marginal benefits for each $1 million spent declined.) o What happened to marginal costs as the project progressed? (The marginal costs
stayed the same: $1 million for each stage, 1-5. Another way to look at it is to say that the marginal cost of each additional 5 percent or 10 percent of pollution clean-up increased.)
o Fill in the blank: As the project progressed, we got (more or less?) additional benefit for the same additional cost. (Less.)
o Why do you think that happened? (At each successive stage, the pollution became harder and harder to clean up, or as the water became cleaner, additional cleanliness was harder to achieve.)
o Do you think that’s usually the case with water pollution clean-up, or was it only in this situation? Why? (Yes, it is usually the case. The pollution that is easiest and least costly to remove is removed first. Informally, this is often referred to as the “80/20 Rule,” meaning that 80% of the pollution can be cleaned up for 20% of the cost, or that the last 20% of pollution clean-up will be 80% of the cost.)
Lesson 6: Would You Swim There? Handouts, Visuals, Answer Guides
Handout #1 8
o Do you think it’s the case with other types of pollution clean-up? Why? Can you give an example? (Yes. Students may refer to the fact that pollution that is harder to see is costlier to clean up, requiring more expensive technology or more sophisticated techniques. A good example is cleaning up your bedroom. The room looks much better if you pick up the dirty clothes and school books from the floor and make the bed. What about cleaning the last 5 percent of “pollution” in your room—dusting the baseboards, wiping down the light fixtures, washing and polishing the windows?)
o Pose one final example. Suppose that the Board learned that if the completed Stage 4 of the pollution clean-up, a bottling plant in the city would take water from the stream below the pond because the water would be clean enough for their use. The plant would reap a benefit of about $25 million. Should the Board change its mind and pay for Stage 4? (A variety of answers is possible here. Should the homeowners pay for benefits to someone else? Personal values will enter in. What if the bottling plant offers to pay for part of the Stage 4 clean-up? How much should it pay? How much is it worth to the plant? Does that amount make it worthwhile to the homeowners?)
o Suppose that in Stage 4 of the clean-up the swimmers offer to pay a fee to use the pond. Should that change the board’s decision? Why? (Will the fee cover the additional costs? If it would, so that those who would benefit from the Stage 4 clean-up were bearing the costs, then the Board should consider the possibility. However, both sides should consider alternatives—the option of a swimming pool, for example.)
9. Assessment: Distribute Handout #4 and instruct students to complete the chart by showing 3-5 stages of room clean-up. For each stage of clean-up define the cost in units of time. Encourage students to use a reasonable time period—say 15 minutes or a half-hour rather than an hour. For each stage of the clean-up, they should also define the benefits—that is, the improvement in the cleanliness of the room. Expect students to list things like no clothes on the floor, books on desk put in shelves, desktop straightened, bed made, carpet vacuumed, etc. In deciding on the level of pollution clean-up, students should show their understanding of marginal analysis. Thus their answers should include such things as “Spending another half-hour dusting the baseboards and bookshelves didn’t seem worth it when I could use that half-hour to finish my homework or watch a favorite TV program.” Optional Alternative: If you want to maintain the water theme, change the scenario from the student’s bedroom to a backyard pool and an upcoming pool party.
Lesson 6: Would You Swim There? Handouts, Visuals, Answer Guides
Handout #1 9
It’s a Pond, But Would YOU Swim in It? Over the summer your family moved to a new planned community just outside a medium-sized city. At the first homeowners' association meeting/picnic, you waited eagerly for the meeting to begin because your parents promised to bring up the issue of the pond. At the edge of the community is a large, spring-fed pond. Once it was probably beautiful, but now it is not only an eyesore; it is dangerous. Rusted-out hulks of wrecked cars mingle with huge oil drums along the shore, and what appears to be a truck frame rises from the approximate location of the spring. Construction debris and wind-blown trash float on the water. The slimy surface suggests that whatever was in the oil drums is leaking, and the absence of birds indicates that whatever is leaking is probably not friendly to birds and other living things. There is little vegeta-tion on the edge of the pond, even in the marshy outlet area, and the shoreline is generally mucky and smelly. A creek running through the farmlands to the west drains the pond. The creek joins the stream that passes under the road to the nearest city, and while the creek eventually becomes scenic, it doesn't seem to attract any fishermen. While the pond is technically on the common land of the community, the developer has, on the advice of his insurance company, put up a huge chain-link fence. It didn't take long for you and your new friends to find a way through the fence, and you've twice had run-ins with the construction supervisor, who has clearly forgotten what it's like to be young and adventurous! Anyway, after punishing you for trespassing, your parents acknowledged that they, too, think it's a shame not to be able to use the pond for ice skating, fishing, and swimming. They agreed to bring up the issue at the homeowners' meeting. As it turns out, your friends also had been successful in convincing their parents to address the issue. And surprisingly, they were joined by an angry group of residents with no children who think that "there's no excuse" for not cleaning up the pond entirely. Because of general concern about the pond, members have voted to instruct the treasurer to hire a local consultant to report on the possibilities for clean-up. The homeowners' association’s funding comes from yearly fees paid by the homeowners. This money is spent for ongoing services (like removing snow and trash and mowing the greenbelt), and community-improvement projects (like building tennis courts or a playground). The consultant has submitted a proposal that has been distributed to the homeowners. The Board of Directors of the Homeowners' Association has called a meeting to consider the issue tomorrow night.
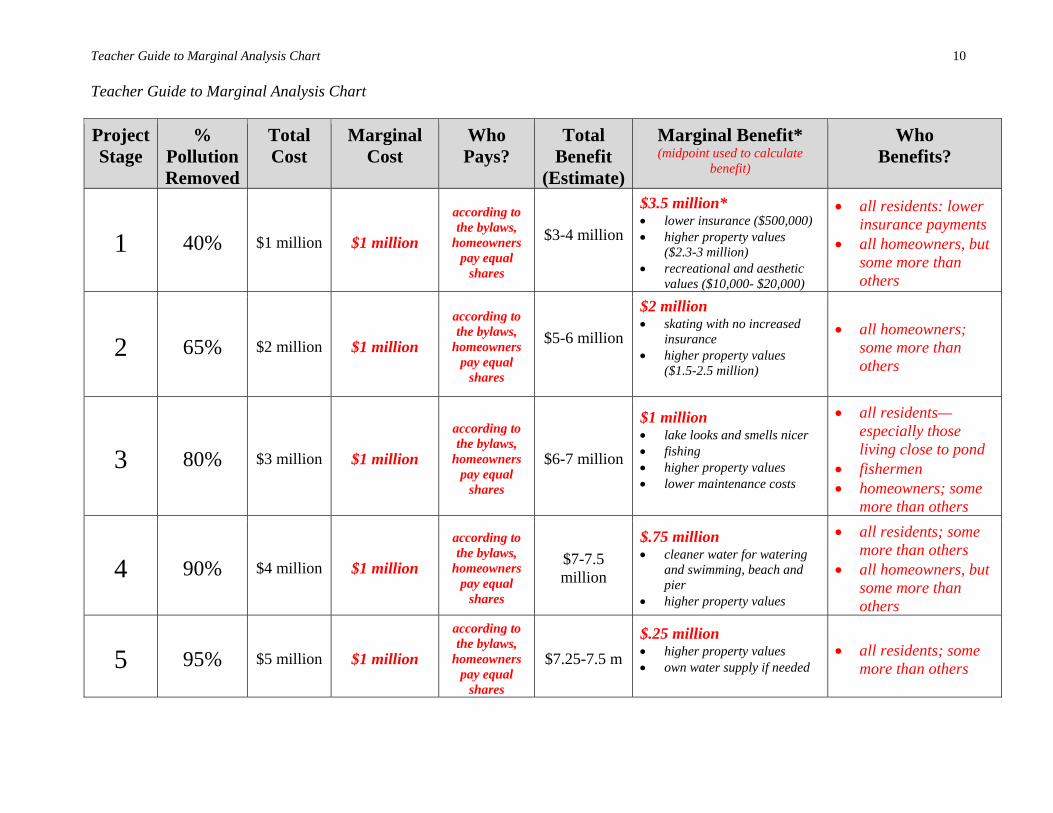
Teacher Guide to Marginal Analysis Chart 10 Teacher Guide to Marginal Analysis Chart
Project Stage
% Pollution Removed
Total Cost
Marginal Cost
Who Pays?
Total Benefit
(Estimate)
Marginal Benefit* (midpoint used to calculate
benefit)
Who Benefits?
1 40% $1 million $1 million
according to the bylaws,
homeowners pay equal
shares
$3-4 million
$3.5 million* lower insurance ($500,000) higher property values
($2.3-3 million) recreational and aesthetic
values ($10,000- $20,000)
all residents: lower insurance payments
all homeowners, but some more than others
2 65% $2 million $1 million
according to the bylaws,
homeowners pay equal
shares
$5-6 million
$2 million skating with no increased
insurance higher property values
($1.5-2.5 million)
all homeowners; some more than others
3 80% $3 million $1 million
according to the bylaws,
homeowners pay equal
shares
$6-7 million
$1 million lake looks and smells nicer fishing higher property values lower maintenance costs
all residents—especially those living close to pond
fishermen homeowners; some
more than others
4 90% $4 million $1 million
according to the bylaws,
homeowners pay equal
shares
$7-7.5 million
$.75 million cleaner water for watering
and swimming, beach and pier
higher property values
all residents; some more than others
all homeowners, but some more than others
5 95% $5 million $1 million
according to the bylaws,
homeowners pay equal
shares
$7.25-7.5 m
$.25 million higher property values own water supply if needed
all residents; some more than others

Handout #2 11
PROJECT OVERVIEW
The pond could be cleaned up in a five-stage project, each stage costing about $1 million. Later stages of clean-up are dependent on earlier stages, but there is no necessity that all five stages be completed. Here is a summary of the five stages, and the costs and benefits of each.
Project Stage
% of Pollution Removed
(Cumulative Total)
Cumulative Total Cost
Results: Possible Uses
Cumulative Total
Benefits* (Estimated $)
1 40% $1 million walking, picnics, wildlife viewing, dog run
$3-4 million
2
65% $2 million skating, hockey, boating $5-6 million
3 80% $3 million fishing, ice fishing, greenbelt & garden irrigation
$6-7 million
4
90% $4 million swimming $7-7.5 million
5 95% $5 million drinking water $7.25 - $7.5 million
Total Cost = $5 million Total Benefit = $7.5 million
*(Note: As in many real-life situations, the costs of projects can be calculated, while the benefits are "fuzzy" or unclear because they materialize in the future and may be hard to measure. Comparing the sales prices of homes gives us a good idea of the benefits in terms of property values, but how do we measure the value of a prettier view or a place for kids to play? That's why benefits on this chart are shown as a range. if you need to use the benefits in your calculations, use the mid-point of the range given. For example, if the benefits are $3 million to $4 million, use $3.5 million.)
Description of Project Stages: Stage 1: Improving the View Remove junk around the edge of the pond: vehicles, construction debris, leaking barrels, etc. Replace the chain link fence with a smaller, more attractive fence as a barrier to small children. Restrict access to the marshy shoreline in hopes of attracting birds and other wildlife. Additional (marginal) benefits to be gained by Stage 1: Lower insurance costs ($500,000). Increased property values in the entire community by approximately $2.5 million to $3 million. Increased recreational and aesthetic values, by approximately $10,000—$20,000 ($.01
million— $.02 million).
Handout #2 12
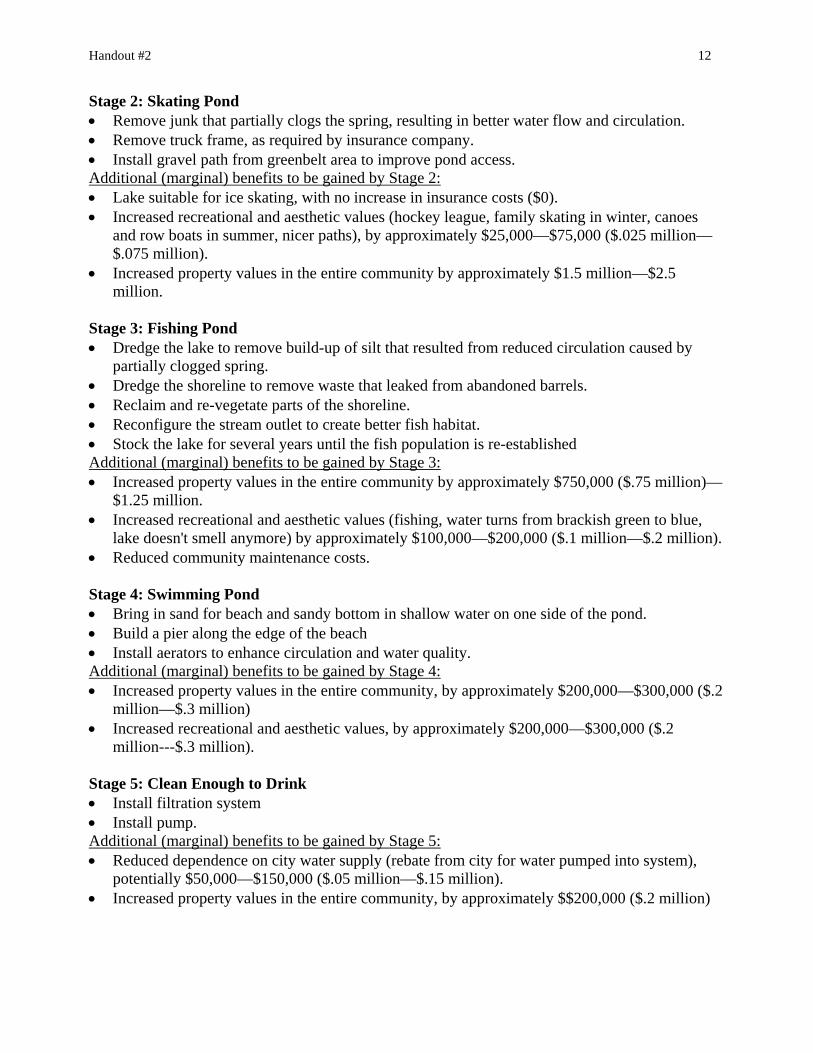
Stage 2: Skating Pond Remove junk that partially clogs the spring, resulting in better water flow and circulation. Remove truck frame, as required by insurance company. Install gravel path from greenbelt area to improve pond access. Additional (marginal) benefits to be gained by Stage 2: Lake suitable for ice skating, with no increase in insurance costs ($0). Increased recreational and aesthetic values (hockey league, family skating in winter, canoes
and row boats in summer, nicer paths), by approximately $25,000—$75,000 ($.025 million—$.075 million).
Increased property values in the entire community by approximately $1.5 million—$2.5 million.
Stage 3: Fishing Pond Dredge the lake to remove build-up of silt that resulted from reduced circulation caused by
partially clogged spring. Dredge the shoreline to remove waste that leaked from abandoned barrels. Reclaim and re-vegetate parts of the shoreline. Reconfigure the stream outlet to create better fish habitat. Stock the lake for several years until the fish population is re-established Additional (marginal) benefits to be gained by Stage 3: Increased property values in the entire community by approximately $750,000 ($.75 million)—
$1.25 million. Increased recreational and aesthetic values (fishing, water turns from brackish green to blue,
lake doesn't smell anymore) by approximately $100,000—$200,000 ($.1 million—$.2 million). Reduced community maintenance costs.
Stage 4: Swimming Pond Bring in sand for beach and sandy bottom in shallow water on one side of the pond. Build a pier along the edge of the beach Install aerators to enhance circulation and water quality. Additional (marginal) benefits to be gained by Stage 4: Increased property values in the entire community, by approximately $200,000—$300,000 ($.2
million—$.3 million) Increased recreational and aesthetic values, by approximately $200,000—$300,000 ($.2
million---$.3 million). Stage 5: Clean Enough to Drink Install filtration system Install pump. Additional (marginal) benefits to be gained by Stage 5: Reduced dependence on city water supply (rebate from city for water pumped into system),
potentially $50,000—$150,000 ($.05 million—$.15 million). Increased property values in the entire community, by approximately $$200,000 ($.2 million)
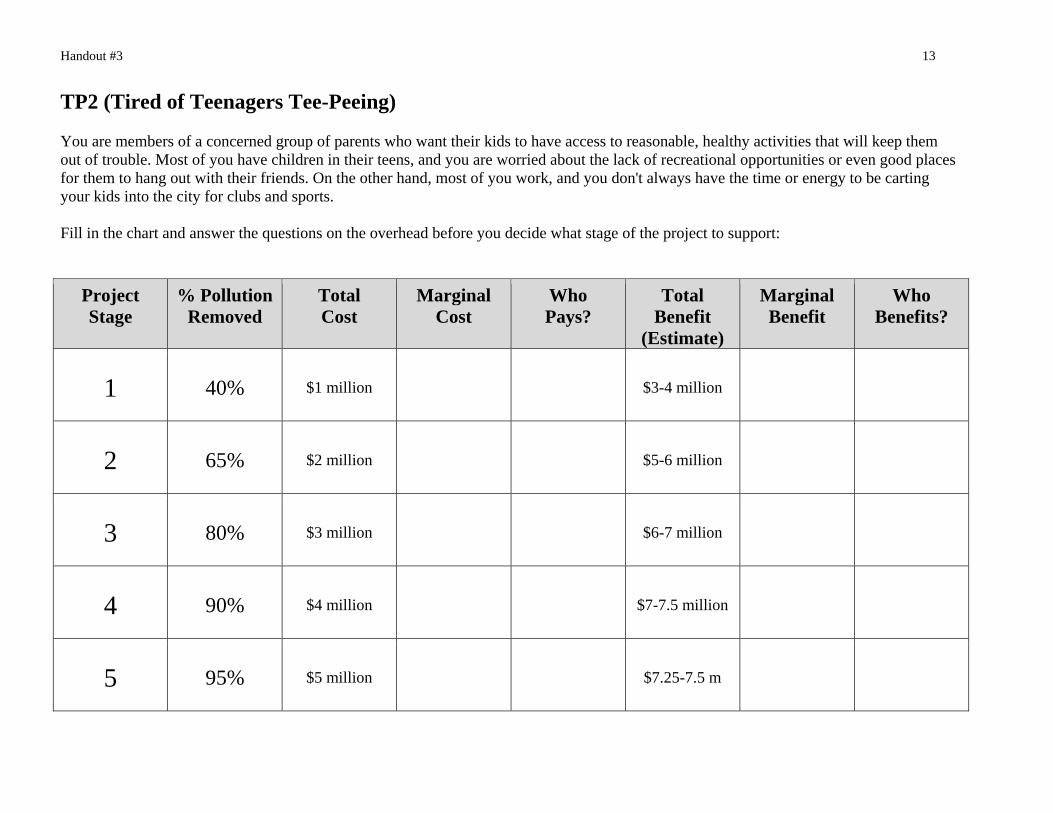
Handout #3 13
TP2 (Tired of Teenagers Tee-Peeing) You are members of a concerned group of parents who want their kids to have access to reasonable, healthy activities that will keep them out of trouble. Most of you have children in their teens, and you are worried about the lack of recreational opportunities or even good places for them to hang out with their friends. On the other hand, most of you work, and you don't always have the time or energy to be carting your kids into the city for clubs and sports. Fill in the chart and answer the questions on the overhead before you decide what stage of the project to support:
Project Stage
% Pollution Removed
Total Cost
Marginal Cost
Who Pays?
Total Benefit
(Estimate)
Marginal Benefit
Who Benefits?
1 40% $1 million $3-4 million
2 65% $2 million $5-6 million
3 80% $3 million $6-7 million
4 90% $4 million $7-7.5 million
5 95% $5 million $7.25-7.5 m
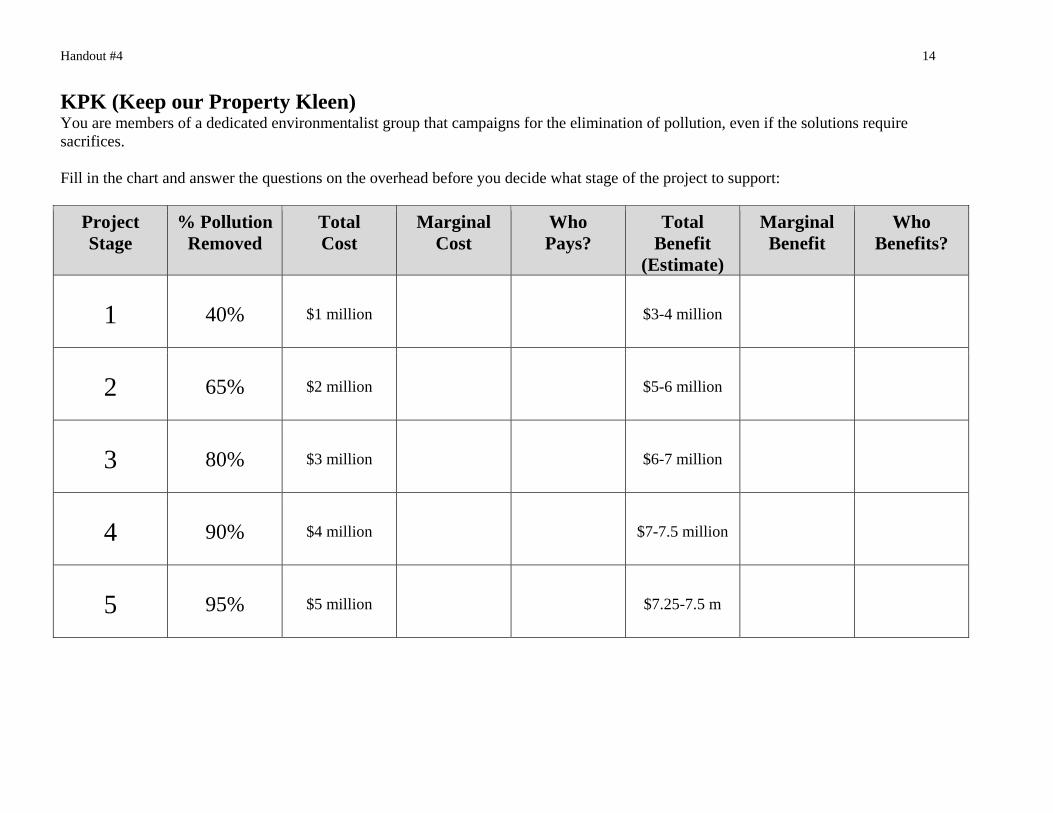
Handout #4 14
KPK (Keep our Property Kleen) You are members of a dedicated environmentalist group that campaigns for the elimination of pollution, even if the solutions require sacrifices. Fill in the chart and answer the questions on the overhead before you decide what stage of the project to support:
Project Stage
% Pollution Removed
Total Cost
Marginal Cost
Who Pays?
Total Benefit
(Estimate)
Marginal Benefit
Who Benefits?
1 40% $1 million $3-4 million
2 65% $2 million $5-6 million
3 80% $3 million $6-7 million
4 90% $4 million $7-7.5 million
5 95% $5 million $7.25-7.5 m
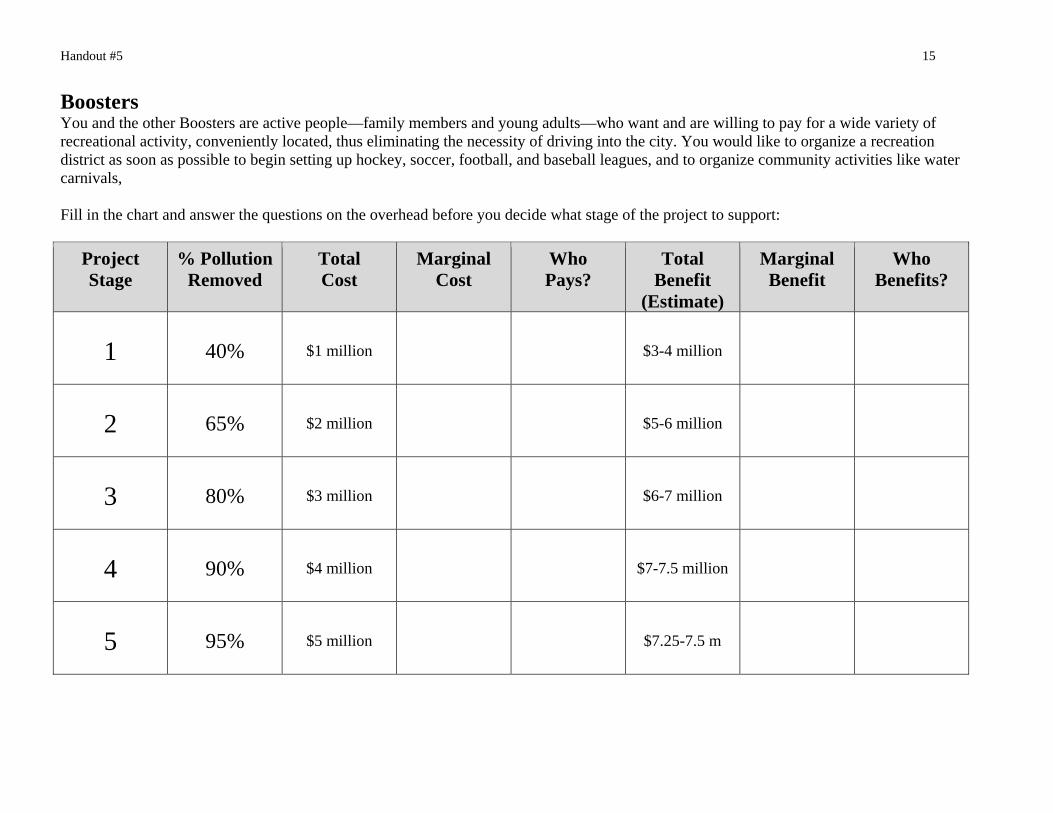
Handout #5 15
Boosters You and the other Boosters are active people—family members and young adults—who want and are willing to pay for a wide variety of recreational activity, conveniently located, thus eliminating the necessity of driving into the city. You would like to organize a recreation district as soon as possible to begin setting up hockey, soccer, football, and baseball leagues, and to organize community activities like water carnivals, Fill in the chart and answer the questions on the overhead before you decide what stage of the project to support:
Project Stage
% Pollution Removed
Total Cost
Marginal Cost
Who Pays?
Total Benefit
(Estimate)
Marginal Benefit
Who Benefits?
1 40% $1 million $3-4 million
2 65% $2 million $5-6 million
3 80% $3 million $6-7 million
4 90% $4 million $7-7.5 million
5 95% $5 million $7.25-7.5 m

Handout #6 16
Out-of-Sight, Out-of-Mind You are property owners—mostly elderly, retired people who live on the end of the development opposite the pond, where smaller, less expensive houses are arranged in patio clusters around a central activity center. You have no views of the pond and don't believe that its existence—or disappearance—will affect your lives. Many of you live on fixed incomes and are less worried about property values than about the yearly membership fees charged by the homeowners' association. You also engage only in limited physical activity; you like walking, and you enjoy watching sports, but your active hockey league days are past. Fill in the chart and answer the questions on the overhead before you decide what stage of the project to support:
Project Stage
% Pollution Removed
Total Cost
Marginal Cost
Who Pays?
Total Benefit
(Estimate)
Marginal Benefit
Who Benefits?
1 40% $1 million $3-4 million
2 65% $2 million $5-6 million
3 80% $3 million $6-7 million
4 90% $4 million $7-7.5 million
5 95% $5 million $7.25-7.5 m
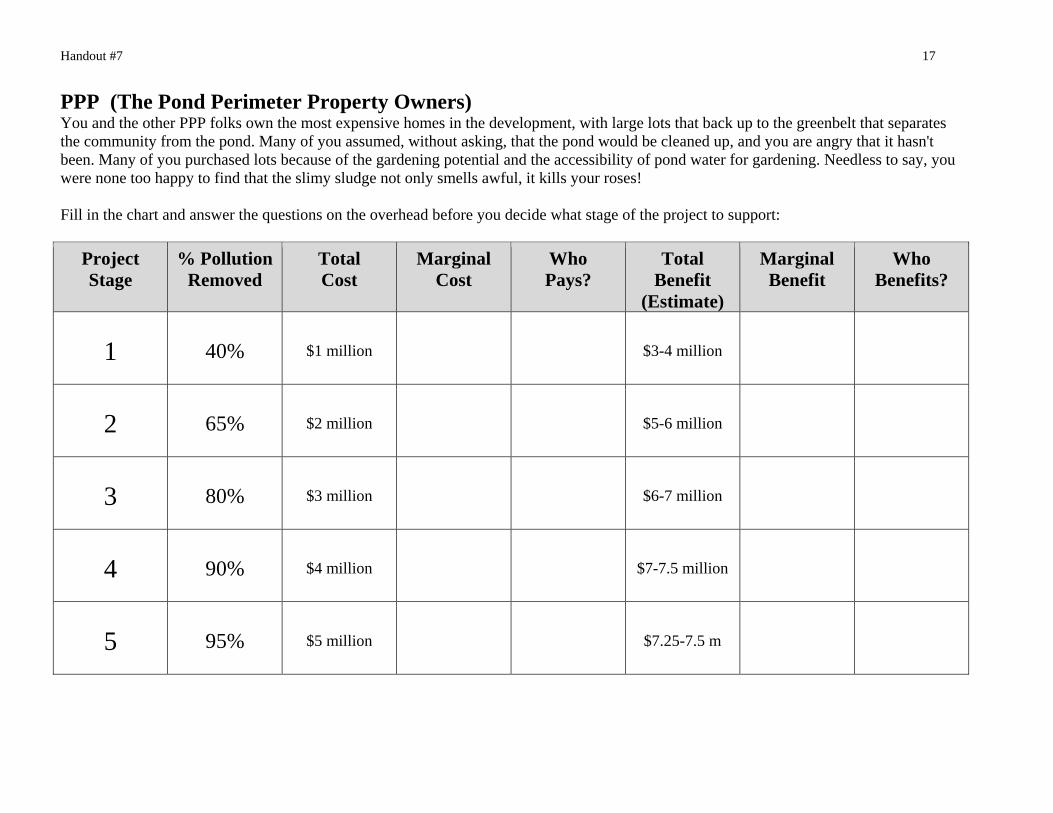
Handout #7 17
PPP (The Pond Perimeter Property Owners) You and the other PPP folks own the most expensive homes in the development, with large lots that back up to the greenbelt that separates the community from the pond. Many of you assumed, without asking, that the pond would be cleaned up, and you are angry that it hasn't been. Many of you purchased lots because of the gardening potential and the accessibility of pond water for gardening. Needless to say, you were none too happy to find that the slimy sludge not only smells awful, it kills your roses! Fill in the chart and answer the questions on the overhead before you decide what stage of the project to support:
Project Stage
% Pollution Removed
Total Cost
Marginal Cost
Who Pays?
Total Benefit
(Estimate)
Marginal Benefit
Who Benefits?
1 40% $1 million $3-4 million
2 65% $2 million $5-6 million
3 80% $3 million $6-7 million
4 90% $4 million $7-7.5 million
5 95% $5 million $7.25-7.5 m

Handout #8 18
The Fish You and your friends are teenagers, and you are afraid that adults will overlook the most important thing about ponds – swimming. With your slogan, "Keep Us Off the Streets," you are lobbying for a beach and a summer hang-out. Fill in the chart and answer the questions on the overhead before you decide what stage of the project to support:
Project Stage
% Pollution Removed
Total Cost
Marginal Cost
Who Pays?
Total Benefit
(Estimate)
Marginal Benefit
Who Benefits?
1 40% $1 million $3-4 million
2 65% $2 million $5-6 million
3 80% $3 million $6-7 million
4 90% $4 million $7-7.5 million
5 95% $5 million $7.25-7.5 m
Handout #9 19
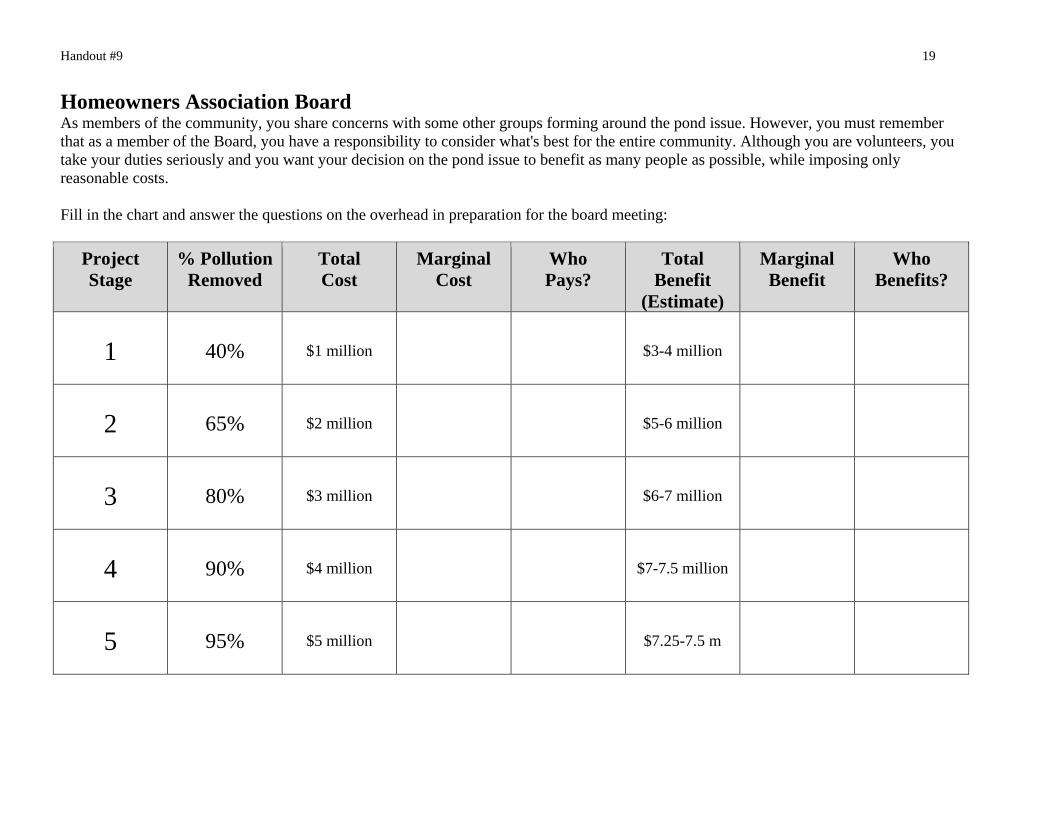
Homeowners Association Board As members of the community, you share concerns with some other groups forming around the pond issue. However, you must remember that as a member of the Board, you have a responsibility to consider what's best for the entire community. Although you are volunteers, you take your duties seriously and you want your decision on the pond issue to benefit as many people as possible, while imposing only reasonable costs. Fill in the chart and answer the questions on the overhead in preparation for the board meeting:
Project Stage
% Pollution Removed
Total Cost
Marginal Cost
Who Pays?
Total Benefit
(Estimate)
Marginal Benefit
Who Benefits?
1 40% $1 million $3-4 million
2 65% $2 million $5-6 million
3 80% $3 million $6-7 million
4 90% $4 million $7-7.5 million
5 95% $5 million $7.25-7.5 m
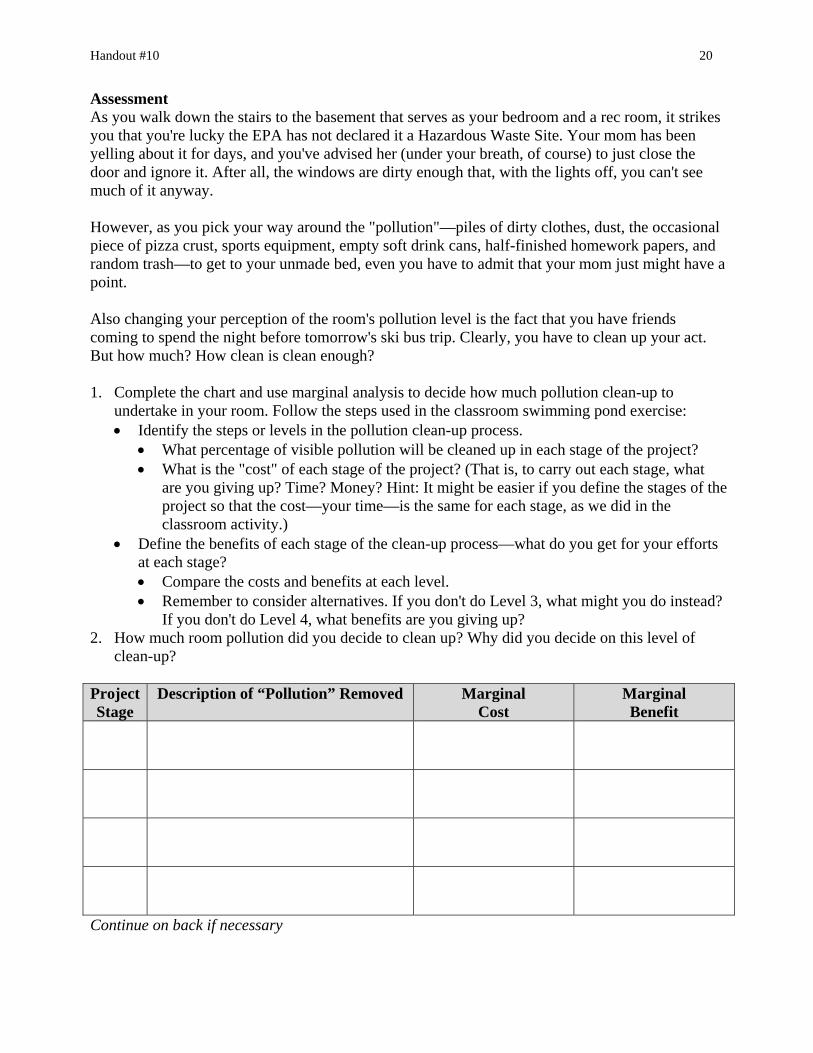
Handout #10 20
Assessment As you walk down the stairs to the basement that serves as your bedroom and a rec room, it strikes you that you're lucky the EPA has not declared it a Hazardous Waste Site. Your mom has been yelling about it for days, and you've advised her (under your breath, of course) to just close the door and ignore it. After all, the windows are dirty enough that, with the lights off, you can't see much of it anyway. However, as you pick your way around the "pollution"—piles of dirty clothes, dust, the occasional piece of pizza crust, sports equipment, empty soft drink cans, half-finished homework papers, and random trash—to get to your unmade bed, even you have to admit that your mom just might have a point. Also changing your perception of the room's pollution level is the fact that you have friends coming to spend the night before tomorrow's ski bus trip. Clearly, you have to clean up your act. But how much? How clean is clean enough? 1. Complete the chart and use marginal analysis to decide how much pollution clean-up to
undertake in your room. Follow the steps used in the classroom swimming pond exercise: Identify the steps or levels in the pollution clean-up process.
What percentage of visible pollution will be cleaned up in each stage of the project? What is the "cost" of each stage of the project? (That is, to carry out each stage, what
are you giving up? Time? Money? Hint: It might be easier if you define the stages of the project so that the cost—your time—is the same for each stage, as we did in the classroom activity.)
Define the benefits of each stage of the clean-up process—what do you get for your efforts at each stage? Compare the costs and benefits at each level. Remember to consider alternatives. If you don't do Level 3, what might you do instead?
If you don't do Level 4, what benefits are you giving up? 2. How much room pollution did you decide to clean up? Why did you decide on this level of
clean-up? Project Stage
Description of “Pollution” Removed Marginal Cost
Marginal Benefit
Continue on back if necessary
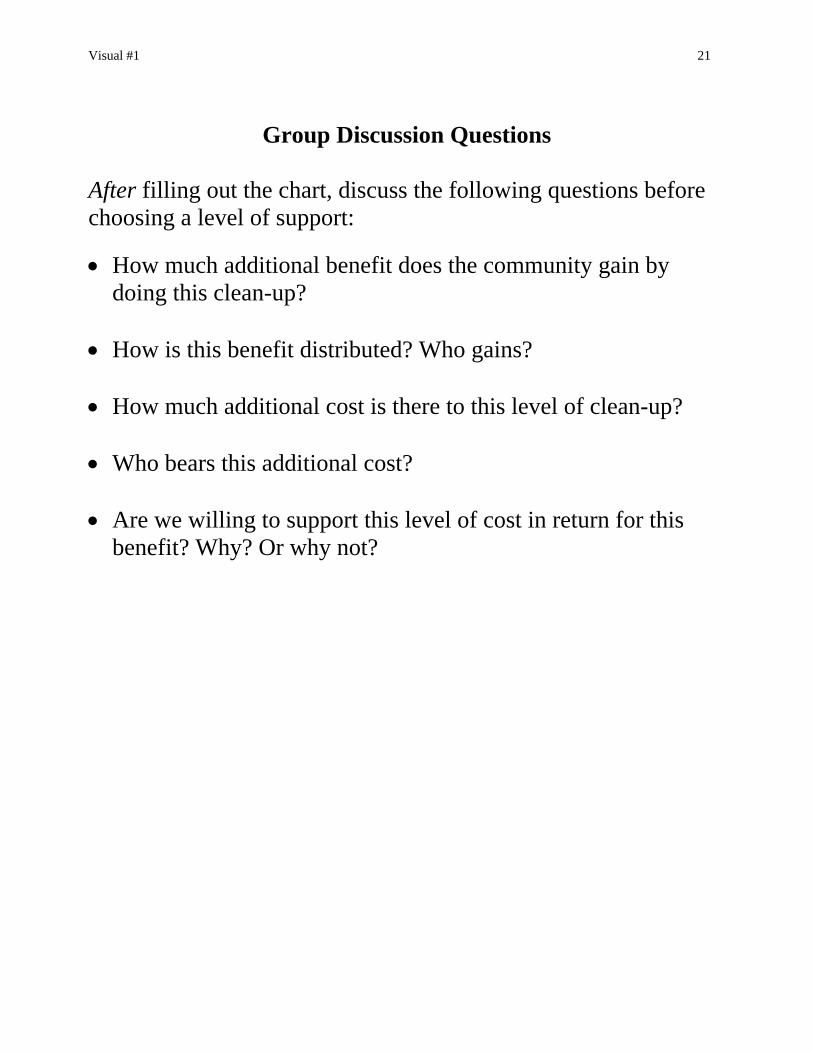
Visual #1 21
Group Discussion Questions After filling out the chart, discuss the following questions before choosing a level of support:
How much additional benefit does the community gain by doing this clean-up?
How is this benefit distributed? Who gains?
How much additional cost is there to this level of clean-up?
Who bears this additional cost?
Are we willing to support this level of cost in return for this benefit? Why? Or why not?
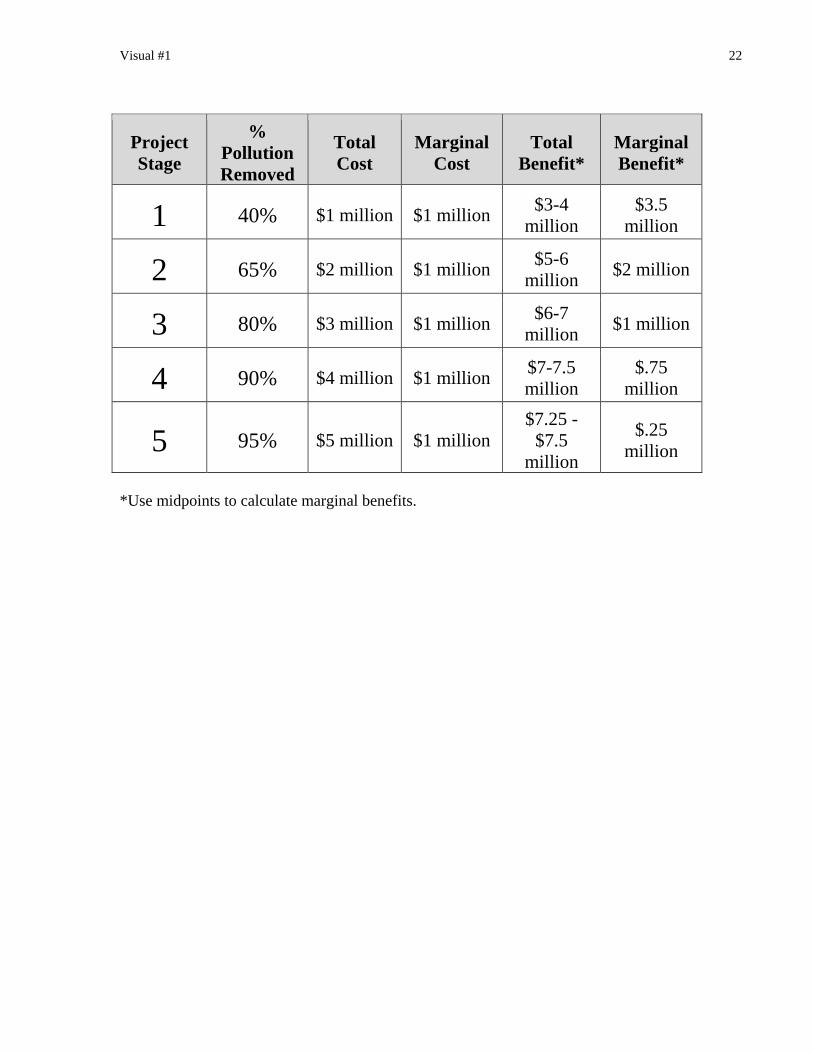
Visual #1 22
Project Stage
% Pollution Removed
Total Cost
Marginal Cost
Total Benefit*
Marginal Benefit*
1 40% $1 million $1 million $3-4
million $3.5
million
2 65% $2 million $1 million $5-6
million $2 million
3 80% $3 million $1 million $6-7
million $1 million
4 90% $4 million $1 million $7-7.5 million
$.75 million
5 95% $5 million $1 million $7.25 -
$7.5 million
$.25 million
*Use midpoints to calculate marginal benefits.