Embed Size (px)
Citation preview

Centers for Medicare & Medicaid Services
ESRD Update: Transitioning to New ESRD Conditions for Coverage Student Manual
Lesson #3: Using the New Survey Process Learning Objectives At the conclusion of this lesson, you will be able to: • Describe the expectations & challenges of an
ESRD survey • Recognize ESRD standards of care & how
these are used by surveyors • Describe tasks to be used to conduct the new
ESRD survey • Describe data available to ESRD surveyors &
its use in ESRD surveys • Demonstrate understanding of use of findings
in constructing DPS & findings for CMS 2567
35

Centers for Medicare & Medicaid Services
36

1
Judith KariGlenda Payne & The Transition Team
Using the ESRD Survey Process for the 2008 Conditions for Coverage
2
Objectives of This PresentationDescribe the expectations & challenges of an ESRD surveyRecognize ESRD standards of care & how these are used by surveyorsDescribe tasks to be used to conduct the new ESRD surveyDescribe data available to ESRD surveyors & its use in ESRD surveysDemonstrate understanding of use of findings in constructing DPS & findings for CMS 2567
3
Spectrum of ESRD Services“ESRD benefit” & the ESRD CfC cover:
Outpatient dialysis in ESRD facility• In hospital (“hospital based”) or• Outside hospital (“independent”) or• Special purpose (for 8 months max.)
Training & support for home/self dialysis
37

4
Hospital-Based Dialysis
Based on integrated ownership & operationNOT…• LOCATION• Shared service agreement• Patient referral agreement
At CFR 413.174
5
ESRD Benefit & the ESRD CfC Do NOT Cover
Dialysis in an inpatient settingAcute dialysis(These are covered by hospital PPS
& surveyed under Hospital COP)
Not covered:• Pre-ESRD: Stages 1-4 Chronic
Kidney Disease (CKD)
6
CMS Expectations for State Oversight of ESRD Facilities
Conduct initial surveys as soon as scheduling allows; Tier 3 workloadConduct resurveys, FY 2009• Tier 2: 10%; must be from top 20% of
outcomes list• Tier 3: 30%; 4 year interval maximum• Tier 4: 33%; 3 year interval average
Conduct complaint surveys• When warranted• Within specified timeframes
38

7
Challenges for ESRD SurveysSurveys are technically & clinically complex: Not intuitiveEquipment & technologies keep changing: Need updated informationLarge number of V-tags: Over 500Recognized Standards: Need updated informationWorkload competition: Not statutorily mandated
8
9
ESRD Survey Focus:Protect Patient Safety & Improve Patient Outcomes
Data is used to focus surveysDuring survey, observations focus on identification of safety hazards• Water/dialysate• Reuse• Machine operation/maintenance• Direct care• IDT assessment, planning &
delivery of care
39

10
Using Data/Outcomes in ESRD Survey
Pre-survey:• Use Outcomes List to select facilities • Use Dialysis Facility Reports to plan
surveyDuring survey:• Use data to focus survey• Expect QAPI action if poor outcomes
identifiedPost-survey:• Data may define the citation level (i.e.
standard, conditional, or Immediate Jeopardy)
11
Direct Partners in Guidelines & Standards: Incorporated in Regulations
AAMI: • RD52:2004 Dialysate for Hemodialysis• RD62:2001 Water for Hemodialysis• RD47:2002/03 Reuse of Hemodialyzers
CDC • RR-05: “Recommendations for Preventing
Transmission of Infections Among Chronic Hemodialysis Patients”
• RR-10: “Recommendations for Placement of Catheters in Adults and Children”
NFPA• 2000 Life Safety Code
12
Partners in StandardsFDA• Approval of devices, including
manufacturer’s guidelines• Reports on malfunctionsNKF• Kidney Disease Outcomes Quality
Initiative (KDOQI)• Community-accepted guidelines for both
“minimum” & “target” outcomesNQF• Develop CPMs
40
13
Partners for Reference Standards
American Nephrology Nurses’Association (ANNA)• Standards for nursing care• Guidelines for careState Practice Acts
14
Surveyor Use of Standards & Guidelines
POC: The implemented POC must result in patient outcomes that meet minimum levels of defined standards
If “minimum” standards of care are not met, there must be a change to the POC implemented
QAPI: For facility: Each facility must provide care to their (group of) patients that meets defined standards
15
Measures Assessment Tool (MAT)
Developed to allow updating as Standards changeIncludes both individual targets for patients & aggregate targets for facility use in QAPIIncluded as an addendum to the Interpretative Guidance Laminate for ease of use
41

16
The INITIAL Survey Process
Used for new ESRD facilitiesOrganized around TASKSMinimal number of patients to interview & limited records to review for assessments, plans of care plans or patient outcomes
17
The BASIC Survey Process
Used for recertificationUsed in whole or in part for complaint surveysOrganized around TASKSFocus of this session!
18
STAR: Automated ESRD Survey
Surveyor Technical Assistant for Renal Disease (STAR)An automated survey guideUses a wireless tablet PCGuides YOU through the survey processRoll-out in process
42
19
STAR …
Automatically produces a draft of Form CMS-2567• Finds V-tags• Converts handwriting to typed text
Will be updated to the new CfC asap• Can still use STAR in the meantime• Use the crosswalk to convert findings to
new tags
20
Survey Tasks1. Pre-survey prep2. Introductions3. Tour/Observations4. Entrance conference5. Patient sample
selection6. Water treatment/
Dialysate preparation7. Reprocessing/Reuse 8. Machine operation/
Maintenance
9. Home training dept review
10. Patient interviews11. Medical record review12. Personnel interviews13. QAPI14. Personnel record
reviews15. Decision making16. Exit conference
21
Pre-Survey Activities
Review of facility file• Problems, complaints• Previous surveys
Review of data • Outcomes List• Dialysis Facility Reports (DFRs)
Contact ESRD Network
43

22
What Type of Data Is Available for Surveyors?
ESRD dialysis facility reports developed for States for survey purposes:http://www.sph.umich.edu/kecc/usr/usr.htm
ESRD DFRs distributed to each state every September-October
23
ESRD Data Reports for Surveys
1. Outcomes List• Rank-ordered list of facilities (#1 is
the lowest-ranked facility)• List is based on 3 factors: Adequacy
of dialysis, anemia management & adjusted mortality rate
• There is a positive correlation between ranking on the outcomes list & survey deficiencies
24
Clicker Question!!
My state uses the outcomes list to choose facilities for survey each year.
A. YesB. NoC. I don’t knowD. I don’t work for a state
44

25
ESRD Data Reports for Surveys
2. Dialysis Facility Reports• Facility characteristics, patient
outcomes & practice patterns in the report
• Summary text on the first five pages: compares facility data to State, Network & national levels
26
Clicker Question!!
I have easy access to the DFR for every survey.
A. YesB. NoC. I don’t knowD. I don’t work for a state
27
ESRD Data Reports for Surveys
2. Dialysis Facility Reports • Charts for the following:
Standardized mortality rates (SMRs) under 1.00 are better than average—the lower the betterAdequacy: Kt/V of 1.2 or greater is targetHematocrit level 30-36% or hemoglobin level of 10-12 mg/dL are targets
• These data are COMPARATIVE—updated numbers from the facility may not be comparative
45

28
Clicker Question!!
I routinely use the DFR for every survey.
A. YesB. NoC. I don’t knowD. I don’t work for a state
29
Why Do Surveyors Use Data?
To SELECT facilities to surveyTo FOCUS the survey process onsite (look at current data, QAPI)To DETERMINE the extent of noncompliance (enforcement)
30
What Other ESRD Data Is Available?
Dialysis Facility Compare (DFC): facility-specific data for the public at www.medicare.gov/dialysisNetwork data: annual reports & other data at www.esrdncc.orgClinical Performance Measures (CPM): region-specific data on clinical performance measures at www.cms.hhs.gov/CPMProject/01_Overview.aspUnited States Renal Data System (USRDS) Annual Report at www.usrds.org
46

31
Coming Soon… CROWNWeb
New CfC requires all facilities to submit data electronically starting 2/1/09Will provide data on 100% of patients from each facilityDFRs in future will come from this source
32
Survey Tasks1. Pre-survey prep2. Introductions3. Tour/Observations4. Entrance conference5. Patient sample
selection6. Water treatment/
Dialysate preparation7. Reprocessing/Reuse 8. Machine operation/
Maintenance
9. Home training dept review
10. Patient interviews11. Medical record review12. Personnel interviews13. QAPI14. Personnel record
reviews15. Decision making16. Exit conference
33
“Our Survey” Data Shows
DFR shows 76% of the patients have hematocrit (Hct) > 30% (State average = 89%)
47

34
Surveying Is Like a Puzzle
It takes more than 1 piece to solve itYou may have a different view at the end than you did at the beginning!
35
Task 2: Introductions
Is BRIEFIntroduces the members of the team to the person in chargeBriefly explains the purpose of the survey
36
Task 3: Tour/Observations
Ongoing throughout surveyPhysical environmentInfection controlPatient/staff interactionPatient care deliveryStaffingMedical records/logs in use
48

37
Task 3a: Environmental Tour
3a: ”Flash survey” of all areas:Waiting roomPatient restroomsReuse roomWater /Dialysate areasHome training areaTreatment areaIsolation
38
During the Tour
Is the environment safe & sanitary? (V111, 112, 122, 401, 402)Free of hazards? (V401, 402) Are patients treated with respect? (V452) Are machine alarms set & responded to? (V402, 757)
(From your new laminate on the survey process)
39
Task 3b: Observe Care
Infection control practicesPatient careDialysis machine & dialyzer use
49

40
Observe CareAre staff following CDC recommendations & these regulations for prevention of transmission of infections? (V113, 115, 116, 117 & more!)Are current records complete? (V726, 326)Do staff respond to patient problems? (V543, 544, 546, 547, 549)Is a Registered Nurse present? (V759)Are trainees supervised? (V715, 760)
41
3c: Emergency Equipment
Review for equipment function (V413)Staff emergency preparedness (V409, 411)Evacuation supplies present/in date (V408)Fire extinguishers present (V417)
42
“Our Survey” Data Collection
During observations on 10/19/08 at 9:30 a.m., 12 of 18 dialyzers from the first shift to be reprocessed are noted to be bright red
50
43
Task 4: Entrance Conference
Purpose/ anticipated scheduleCMS 3427 to completeCollect facility specific info: use STAR or worksheet & reference materials listRequest patient sampling info
44
Task 4: Entrance Conference
Review the facility-specific data report with the managerAsk for current data
45
Task 5: Patient Sample Selection
10% sample (min=5; max=15) Sample to include variety—all treatment modalities offered must be representedUse info requested from facility to choose sample
51

46
Sample Selection
Current patient census by modality, with admit datesCurrent HD patient listing by shift (seating chart)Cumulative lab reportsInfection logsHospitalization logsVascular access informationAny pediatric patientsResidents of LTC facilities
“Our survey” sample would include some patients identified from cumulative lab reports as “challenges” for anemia management
47
Task 6: Water Treatment & Dialysate Preparation6a-Observation/ Interview
Talk to the people doing the work“Walk me through the waterRequired components:• TWO carbon tanks; 10 min EBCT
(V192, 195)• RO (V199, 200) or DI (V202, 203)
Observe chlorine /chloraminetesting (V196, 197, 270)
48
Task 6b: Review Of Water Treatment Logs
Chemical analysis (V201, 206, 177)Microbial surveillance: monthly CFU & EU (V213, 254); response to action levels (V178, 255)Ch/chl testing (V196, 197, 270)Daily logs: hardness (V191); RO/DI parameters (V199, 202)
52

49
Task 6c: Review Of Dialysate Prep & Delivery
Observe mixing if possibleBatches mixed on site:• Per DFU (V226)• Batch tested & verified (V229)• Bicarb not overmixed (V234)• Bicarb storage minimized (V233)All containers labeled (V228)
Outlets labeled/color coded (V245, 246, 247)Jugs: rinsed daily (V243), disinfected weekly (V244)
50
Task 7: ReuseTask 7a: Observations Of
Reprocessing Procedures/Interview With Reuse PersonnelObserve the entire reuse process:• Set up for use• Take down• Rinsing• Testing• Filling with germicide• Storage
51
Task 7b: Review of Reuse Logs
Reprocessing logs (V326)Germicide vapor testing (V318)Cultures/ LAL (V205, 314)PM/repairs (V316); tested after repairs (V317)QA: required audits done (V362-368); reviewed in QAPI (V635)
53

52
Task 7c: Centralized ReprocessingNote: Surveyor must review tasks
7a & 7b at the centralized reprocessing locationP&P at user ESRD facility for transportation & clinical use (V306)Safe transport of dialyzers (V331)
53
“Our Survey” Data Collection (cont.)
During observation of reuse practices at 10:00 a.m. on 10/19/08, you see that 6 of the 12 dialyzers used by patients on the first shift are dark red when brought to the reprocessing area for rinsing & reprocessing. 3 of these belong to the patients you interviewed, & they rinsed clear.
54
Task 10: Patient Interviews
Try for a minimum of 5 patientsCan be same sample as records reviewed or differentDone in treatment area, waiting room, in private, or by phoneUse a structured interview guide—in STAR, our guide or “custom”
54

55
Patient Interview Guide
Ask the following:How do you participate in your Plan of Care?* (V541, 556)How does your dialyzer look when your treatment is finished—clear, pink or red?**(V547)
(*=standard; **=custom)
56
“Our Survey” Data Collection
During patient interviews, 3 of 5 patients tell you their dialyzer is always red when their treatment is finished These 3 patients (#s 2, 4 & 5) were interviewed 10/19/08 from 11:30 to 1:15
57
Task 11: Medical Record ReviewReview 3-7 sampled records completely; focus remaining reviews on identified concernsUse STAR or the record review worksheetNew focus: patient assessment & POC developmentRefer to the MAT for current standards; if not met for individual patient, expect Δ to POC
55

58
Task 11: Medical Record Review
How will we know the POC is implemented?• Physician’s orders• Laboratory values• IDT progress notes • POC changes/ updates• Dialysis flowsheets
5959
Task 11: Medical Record Review
Current txorders:• Time• Frequency• BFR/DFR• Dialyzer• Heparin dose• ESA? Dose?• Iron Rx?
Flow sheet:• Tx delivered as
Rx?• Freq of B/P checks
during tx as patient needs?
• Are febrile reactions addressed?
• Assessments?
6060
“Our Survey” Data Collection (cont.)
Laboratory reports for 3 patients who indicated their dialyzers are always red show a fall in Hct over the last 3 months; 2 additional records reviewed did not have this finding. Review of care plans, orders & progress notes finds no evaluation of the fall (Reviewed on 10/20/08).
56

6161
Task 12: Personnel Interviews
Done during the survey:“talking to the people doing the work”Will include the nurse manager, water tech(s), reuse tech(s), patient care tech(s) & other nurse(s)May include MSW, RD & medical director If you have CfC findings, or findings related to medical director responsibilities, be sure & interview him/her
62
“Our Survey” Data Collection
Nurse manager tells you that every dialyzer is to be rinsed clear when patient’s blood is returned at the end of treatment
63
“Our Survey” Data Collection
3 patient care techs (#s 7, 9 & 12) tell you they have to finish the first shift of patients by 9:30 a.m. & sometimes they shorten the rinse-back procedure so the second shift of patients can start by 10:00. Interviews done on 10/20/08 from 9:15-9:35
57
64
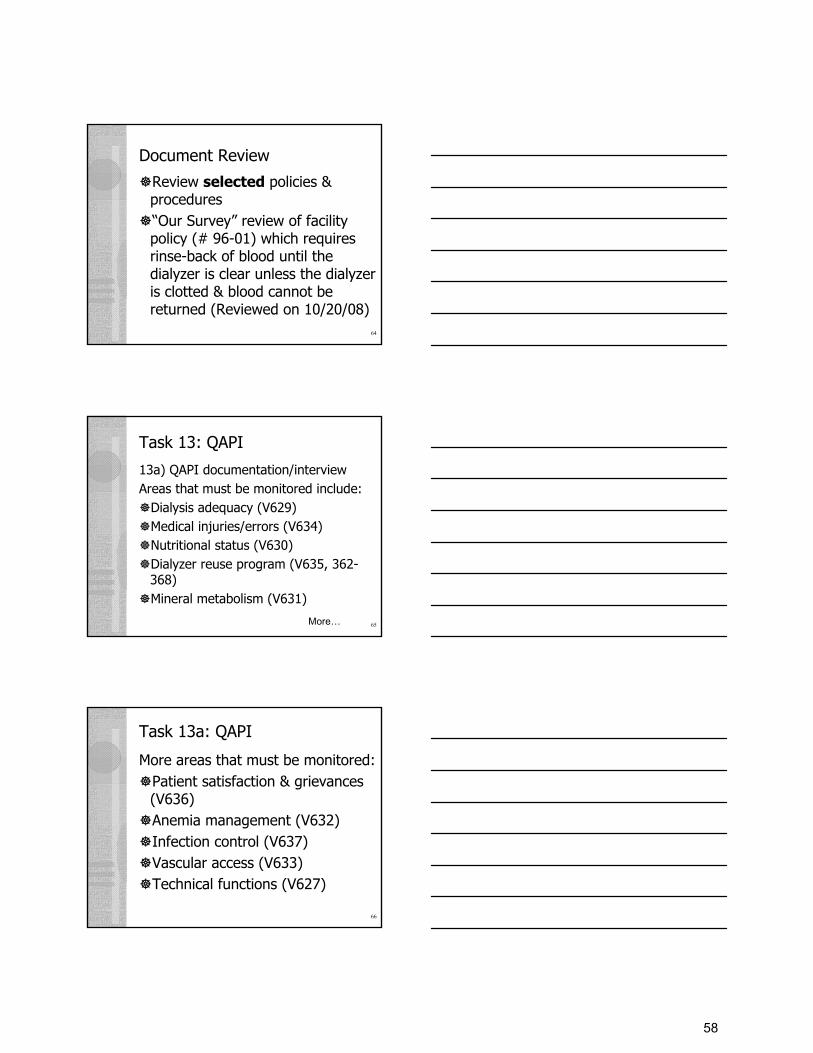
Document Review
Review selected policies & procedures“Our Survey” review of facility policy (# 96-01) which requires rinse-back of blood until the dialyzer is clear unless the dialyzer is clotted & blood cannot be returned (Reviewed on 10/20/08)
65
Task 13: QAPI
13a) QAPI documentation/interviewAreas that must be monitored include:
Dialysis adequacy (V629)Medical injuries/errors (V634)Nutritional status (V630)Dialyzer reuse program (V635, 362-368)Mineral metabolism (V631)
More…
66
Task 13a: QAPI
More areas that must be monitored:Patient satisfaction & grievances (V636)Anemia management (V632)Infection control (V637)Vascular access (V633)Technical functions (V627)
58

67
Task 13a: QAPI
Facility must prioritize those areas that affect patient safety (V639, 640)Develop and implement action plans aimed at making/sustaining improvement (V638)Home modalities included; PD outcomes reviewed separately (V628)
68
Task 13b: QAPI: ER Prep
Must address fire, power failure, water supply interruption, natural disasters & care-related emergencies (V408)Annual staff training (V409)Patient education program (V412)Annual contact with local disaster mgmt agency (V416)
69
“Our Survey” Data Collection
QAPI minutes from 10/07–9/08 have no evidence of audits of reuse & no evidence management has identified any issue with blood return post-treatment Facility staff have not reviewed their DRR
nor compared their anemia management rate of 76% with the State average of 89%Review done on 10/20/08
59

70
Task 14: Personnel Record Review
Review personnel document completed by facilityChoose a sample to review for orientation (V760), competency (V681), qualifications (V682-691, 694, 696), licensure (V681), certifications (V695), etc.Review PCT training & certification (V693-695)
71
Task 15: Decision Making
Review the data collectedDetermine what to cite, level of citation, & if additional observations, interviews or record reviews are needed.Organize for exit: use STAR or notes to make a list of deficient findings; start with most serious finding.
72
Task 16: Exit Conference
Provide an overview of survey activities; briefly summarize deficient practices identifiedAnswer questions Describe next steps
60

73
“Our Survey” Deficiency PresentedUnder the CfC QAPI:
V635: Hemodialyzer reuse program(IG: the QAPI meeting minutes
should demonstrate oversight of the reuse program …)
74
Deficient Practice Statement
Based on review of data, observations, patient & staff interviews & review of records, this facility did not identify a fall in the Hct measures of 3 of 5 sampled patients as potentially related to the facility processes of reuse, impacting all 44 patients who were included in the reuse program in this facility as of the survey date.
75
Findings
1. Review of facility data revealed 76% of the patients in this facility achieved the target hematocrit level of 30% for management of anemia, compared to the average of 89% for the State
61

76
Findings (cont.)
2. On 10/19/08 at 9:30 a.m., 12 of 18 dialyzers used for the first patient shift were observed to be bright red after completion of dialysis, indicating blood was left in the dialyzer rather than returned to the patient.
77
Findings (cont.)
3. On 10/19/08, from 11:30 to 1:15 a.m., interviews of patient #s 2, 4 & 5 found that their dialyzers were “always red” when their treatments were completed. A dialyzer that is red in color after treatment is completed indicates clotting of the dialyzer or incomplete rinse-back of the blood in the tubing & dialyzer.
78
Findings (cont.)
4. Observation of reuse practices at 10:00 a.m. on 10/19/08 found 6 of 12 dialyzers from the first patient shift were dark red when brought to the reprocessing area. These 6 included dialyzers for patient #s 2, 4 & 5. These dialyzers rinsed clear & were not clotted.
62

79
Findings (cont.)
5. Interviews of staff member #s 7, 9 & 12 on 10/20/08 from 9:15 to 9:35 revealed they “had to finish” the first shift of patients by 9:30 a.m. & that they “sometimes shorten” the rinse-back procedure.
80
Findings (cont.)
6. Review of records on 10/20/08 for patients 2, 4 & 5 revealed lab reports showing drops in hemoglobin over the past 3 months:
Jul. Aug. Sept. Patient 2: Hct 33.1 30 28Patient 4: Hct 30 29 27.8Patient 5: Hct 31 29 27There was no evidence in progress notes, plans of care, or orders of evaluations for reasons for the drops in Hct.
81
Findings (cont.)
7. Review of facility policy # 96-01 on 10/20/08 revealed staff were required to rinse back the patient’s blood until the dialyzer was clear unless the dialyzer was clotted & blood could not be returned
63

82
Findings (cont.)
8. Review of QAPI minutes from October 2007-Sept 2008 on 10/20/08 at 3:00 p.m. found no evidence of:a. Audits of reuse practices b. Identification of any issue with blood
return post-treatment c. Comparison of the facility’s anemia
management rate of 76% with the State average of 89%
83
Findings (cont.)
All record review findings were verified with the nurse manager at the time of the finding.*****************************
84
Goal: Positive Patient Outcomes
The renal community, State agency & Network work together to improve patient outcomes!
64

85
We Challenge You to Continue aLifetime of Learning:
WaterReuse Infection controlMachines & equipmentClinically complex patients!
86
Questions?
Using the ESRD Survey Process for the 2008 Conditions for Coverage
65

Centers for Medicare & Medicaid Services
66

Centers for Medicare & Medicaid Services
Resources
67

Centers for Medicare & Medicaid Services
68

Crosswalk from Old to New Tags Old Tag New Tag
Revised 8/08 1
V100 CfC: Compliance with Federal, state, & local laws V100 CfC: Compliance with Fed/State/Local Laws V101 Licensure V101 Compliance with Fed/State/Local Laws V102 Licensure V101 Compliance with Fed/State/Local Laws V103 Licensure or registration of personnel V681 Staff licensed as req/qualified: Demonstrate competencies
V684 Nurse manager: 12 mo RN + 6 mo dialysis V685 Self-care/home training nurse: 12 mo RN + 3 mo modality V686 Charge nurse: 12 mo nursing + 3 mo dialysis V688 Staff nurse: Meet state requirements V689 Dietitian: RD
V104 Conformity with other laws V145 IC: Report communicable diseases V276 W/D: In-center use of preconfigured HD systems: Follow FDA label V303 Reuse: Dialyzers must be labeled for multiple use per FDA V594 CAH: Preconfig HD sys: Testing water/dialysate follow DFU/ FDA
V110 CfC: Governing body and management V750 CfC: Governance V111 GB: Rules and regulations V751 Identifiable Governing Body w/full authority/responsibility V112 GB: Health and safety V751 Identifiable Governing Body w/full authority/responsibility V113 GB: Patient rights V751 Identifiable Governing Body w/full authority/responsibility V114 GB: Operation V751 Identifiable Governing Body w/full authority/responsibility V115 GB: Network V755 Adm responsibility for relationship with ESRD NW
V772 Responds to NW requests/works towards goals V116 GB: CEO V752 Appoint CEO/Administrator V117 Disclosure of ownership information V773 Disclosure of ownership V118 Owner corporation V773 Disclosure of Ownership V119 Partnership V773 Disclosure of Ownership V120 Changes in owner V773 Disclosure of Ownership V121 Operational objectives established V122 Operational objectives in writing V123 Revised operational objectives V124 GB: Responsibility for reuse V751 Identifiable Governing Body w/full authority/responsibility V125 Operational Objectives clear V126 Description of services V127 Admission criteria V128 Rules and regulations reviewed annually V129 CEO: Qualified and responsible V752 Appoint CEO/Administrator V130 CEO: Liaison V753 Adm resp for staff appointments V131 CEO: Alternate V132 CEO: Effective V752 Appoint CEO Administrator V133 CEO: Sufficient time V134 CEO: Implement/coordinate V715 MD resp: Ensure all adhere to P&P
V752 Appoint CEO/Administrator V135 CEO: Administrative function and accountability V625 CfC: Quality Assessment and Performance Improvement
V626 Covers scope of services/effective/IDT involved V627 Ongoing; uses indicators = improved health outcomes V628 Measure, analyze and track quality indicators V629 QAPI Indicator: Adequacy of dialysis V630 QAPI Indicator: Nutritional status V631 QAPI Indicator: Mineral metabolism/bone disease V632 QAPI Indicator: Anemia management V633 QAPI Indicator: Vascular access V634 QAPI Indicator: Medical injuries/errors V635 QAPI Indicator: HD reuse program V636 QAPI Indicator: Pt satisfaction & grievances V637 QAPI Indicator: Infection control: Trend/plan/act V638 Continuously monitor/take action/track/sustain improve V639 Prioritizing improvement activities V640 Immediately correct any IJ issues V756 Adm resp for resources for QAPI
V136 CEO: Fiscal responsibility V754 Adm resp for fiscal operations V137 CEO: Staff orientation V760 GB responsible for staff oriented to facility and responsibilities V138 CEO: Maintain records V139 CEO: Contracts V140 CEO: Organizational plan V754 Adm resp for fiscal operations V141 CEO: Staff train V713 MD resp: Staff ed, training and performance
V761 Staff have access to continuing education V142 Personnel P/P: Good care V751 Identifiable Governing Body w/full authority/responsibility V143 Personnel P/P: Good practices V144 Personnel P/P: Staff qualified V101 Compliance with Fed, State and Local laws
V260 Water/dialysate: Personnel: Training program/periodic audits V681 Staff licensed as req/qualified/demonstrate competencies V682 Medical director: BC + 12 months dialysis exp V683 Medical director exception (CMS approval) V684 Nurse manager: 12 mo RN + 6 mo dialysis
69

Crosswalk from Old to New Tags Old Tag New Tag
Revised 8/08 2
V685 Self-care/home training nurse: 12 mo RN + 3 mo modality V686 Charge nurse: 12 mo nursing + 3 mo dialysis V687 RN/LPN Charge supervision V688 Staff nurse: Meet state requirements V689 Dietitian: RD V690 Dietitian: 1 year experience V691 Social worker: MSW/ grandfather if before 1976 V692 PCT: State requirements and HS diploma V695 PCT: Certified V696 Water treatment system techs training V762 GB: Responsible for medical staff credentialing
V145 Personnel P/P: Safe and sanitary environment V111 IC: Sanitary environment V117 IC: Clean/dirty areas; med prep area; no common med carts V122 IC: Clean, disinfect surfaces & equipment/ written protocols V401 PE: Safe, functional. comfortable environment V402 PE: Building constructed/maintained to ensure safety V404 PE: Patient care environment: Sufficient space
V146 Personnel P/P: Incidents reviewed V148 IC: Monitor cath related BSI rates/ surveillance V275 Water/dialysate: Adverse events: Actions expected V356 Reuse: Recording adverse events/Dialyzer complaint log V627 QAPI: Ongoing: Uses indicators = improved health outcomes V634 QAPI Indicator: Medical injuries/errors V638 QAPI: Continuously monitor/take action/track/sustain improvement
V147 Personnel P/P: Health exams V126 IC: HBV: Vaccinate patients & staff V127 IC: HBV: Test patients/staff post last dose V310 Reuse: Personnel health monitoring records
V148 Personnel P/P: Routine health screening V126 IC: HBV: Vaccinate patients & staff V127 IC: HBV: Test patients/staff post last dose
V149 Personnel P/P: Trainees V693: PCT complete training program V150 Personnel records: Health V126 IC: HBV: Vaccinate patients & staff
V127 IC: HBV: Test patients/staff post last dose V151 Personnel records: Resumes V152 Personnel records: Job descriptions V153 Personnel P/P: Staff grievance V154 Personnel P/P: Staff education V132 IC: Training and education
V260 Water/dialysate: Personnel: Training program/periodic audits V308 Reuse: Training curriculum V309 Reuse: Training documentation includes med dir certification V409 ER preparedness of staff: Initial/annual/re informing patients V411 Nursing staff trained in emergency equip and meds V696 Water treatment system techs training V713 MD resp: Staff ed, training and performance V760 GB responsible for staff oriented to facility & responsibilities V761 Staff have access to continuing education
V155 Personnel manuals V156 Use of outside resources V588 Care at Home: Support services must be provided V157 Pt care policies: Written V714 MD resp: Develop, review and approve P&P
V259 Water/dialysate: Personnel: P&P V306 Dialyzer reprocessing manual
V158 Pt care policies: Reviewed V714 MD resp: Develop, review and approve P&P V259 Water/dialysate: Personnel: P&P
V159 Pt care policies: Development and review V714 MD resp: Develop, review and approve P&P V161 Pt care policies: Scope or service V162 Pt care policies: Admit and discharge V468 PR: Informed: D/C and transfer policies inc involuntary dc
V469 PR: Receive written 30 days notice before involuntary dc V716 MD resp: Ensure involuntary discharge P&P followed V766 GB & med dir ensure all staff follow disch/transfer P&P V767 GB: Involuntary discharge process requirements
V163: Pt care policies: Med supervision and service V164: Pt care policies: LTP and PCP V165: Pt care policies: Emergencies V408 PE: Emergency preparedness: Procedures
V412 PE: Emergency preparedness: Patients oriented/ trained V415 PE: Annual evaluation of emergency/disaster plans V416 PE: Contact local disaster management agency annually V585 CAH: Training content includes emergency prep for home patients
V166: Pt care policies: Rx services V167: Pt care policies: Medical records V168 Pt care policies: Administrative records V169: Pt care policies: Physical plant V170 Pt care policies: Consultants V171 Pt care policies: Home dialysis V585 CAH: Training content includes emergency prep for home patients V172 Pt care policies: Physician responsibilities V763 GB: Informs medical staff of P&P and QAPI program V173 Pt care policies: Hours of operation
70

Crosswalk from Old to New Tags Old Tag New Tag
Revised 8/08 3
V174 Pt care policies V542 POC: IDT develops plan of care V714 MD resp: Develop, review and approve P&P V715 MD resp: Ensure all adhere to P&P
V175 Medical supervision V762 GB: Responsible for medical staff credentialing V763 GB: Informs medical staff of P&P and QAPI program V768 GB: Provide pts/staff direction re emergency med care V769 Physician roster available
V176 Medical emergency coverage V768 GB: Provide pts/staff direction re emergency med care V769 Physician roster available
V177 Medical supervision: Orders V503 PA: Appropriateness of dialysis Rx V518 Assess HD adequacy monthly/PD adequacy q 4 months V542 POC: IDT develops plan of care V543 POC: Manage volume status V544 POC: Achieve adequate clearance V546 POC: Manage mineral metabolism V547 POC: Manage anemia/ H/H measured monthly V549 POC: Monitor ESA response V560 Patients seen by med staff member monthly
V178 Medical supervision: Plans of care V542 POC: IDT develops plan of care V556 POC completed/ signed by IDT & patient
V179 Medical supervision: Emergency roster V769 Physician roster available V180 Medical director appointed V753 GB: Admin resp for staff appointments V181 Medical staff appointments V753 GB: Admin resp for staff appointments V185 CfC Long term program and care plan V540 CfC Patient Plan of Care V186 LTP and PCP with transfer V187 Written LTP V512 Eval for self care, modality and setting
V513 Transplantation referral V515 Eval current physical activity level & voc/physical rehab V553 Home dialysis plan or why not V554 Transplantation status plan or why not V555 Rehab status addressed V561 Track TP referrals/communicate w/TP ctr annually & if Δ
V188 LTP team members V501 Patient assessment: Interdisciplinary Team mbrs/resp V542 IDT develops plan of care
V189 LTP: Reviewed by team V501 Patient assessment: Interdisciplinary Team mbrs/resp V542 IDT develops plan of care
V190 LTP: Pt involved V501 Patient assessment: Interdisciplinary Team mbrs/resp V542 IDT develops plan of care V556 POC completed/signed by IDT & patient
V191 LTP: Copy with transfer V192 PCP: Written, assessment based V501 Patient assessment: Interdisciplinary Team mbrs/resp
V502 Assess current health status inc comorbids V503 Appropriateness of dialysis Rx V504 Assess BP and fluid management needs V505 Assess lab profile V506 Immunization/medication history V507 Assess anemia V508 Assess renal bone disease V509 RD: Nutritional status V510 MSW: Psychosocial needs V511 Dialysis access type & maintenance V512 Eval for self-care, modality and setting V513 Transplantation referral V514 Eval family/support systems V515 Eval current physical activity level & voc/physical rehab V541 Patient Plan of Care: Goals=evidence-based standards V542 IDT develops plan of care V543 POC: Manage volume status V544 POC: Achieve adequate clearance V545 POC: Effective nutritional status V546 POC: Manage mineral metabolism V547 POC: Manage anemia/ H/H measured monthly V548 Home patient: Eval safe ESA administration V549 Monitor ESA response V550 Vascular access: Monitor/referrals V551 VA: Monitor to prevent failure/stenosis V552 Psychosocial counseling/referrals/assessment tool V553 Home dialysis plan or why not V554 Transplantation status plan or why not V555 Rehab status addressed V591 Home patient plan of care developed/updated
V193 PCP: Individualized V501 Patient assessment: Interdisciplinary Team mbrs/resp
71

Crosswalk from Old to New Tags Old Tag New Tag
Revised 8/08 4
V502 Assess current health status including comorbids V503 Appropriateness of dialysis Rx V504 Assess BP and fluid management needs V505 Assess lab profile V506 Immunization/medication history V507 Assess anemia V508 Assess renal bone disease V509 RD: Nutritional status V510 MSW: Psychosocial needs V511 Dialysis access type & maintenance V512 Eval for self-care, modality and setting V513 Transplantation referral V514 Eval family/support systems V515 Eval current physical activity level & voc/physical rehab V541 Patient Plan of Care: Goals=evidence-based standards V542 IDT develops plan of care V543 POC: Manage volume status V544 POC: Achieve adequate clearance V545 POC: Effective nutritional status V546 POC: Manage mineral metabolism V547 POC: Manage anemia/ H/H measured monthly V548 Home patient: Eval safe ESA administration V549 Monitor ESA response V550 Vascular access: Monitor/referrals V551 VA: Monitor to prevent failure/stenosis V552 Psychosocial counseling/referrals/assessment tool V553 Home dialysis plan or why not V554 Transplantation status plan or why not V555 Rehab status addressed
V194 PCP: Team V542 IDT develops plan of care V556 POC completed/ signed by IDT & patient
V195 PCP: Pt involved V542 IDT develops plan of care V556 POC completed/ signed by IDT & patient
V196 PCP: Frequency V516 Pt assessment frequency: Initial: 30 days/13 tx V517 F/U reassessment within 3 months of initial V519 Frequency reassessment: Stable=annual V520 Frequency reassessment: Unstable=monthly V557 Initial POC implemented: 30 days/13 tx V558 Implement updates of the POC: 15 days p assessment
V197 PCP: Copy with transfer V198 PCP: Home patients V589 Monitor home adaptation; home visits=POC
V590 Coordination of care by member of IDT V199 PCP: EPO at home V548 Home patient: Eval safe ESA administration V200 EPO at home: Ensure adequate iron V547 POC: Manage anemia/H/H measured monthly V201 EPO at home: Monitor Hct and iron levels V547 POC: Manage anemia/H/H measured monthly
V549 POC: Monitor ESA response V202 EPO at home: Reevaluation Rx V549 POC: Monitor ESA response V203 EPO at home: Follow-up V549 POC: Monitor ESA response V204 EPO at home: Patient knows s/s of BP problems V585 CAH: Training content including emergency prep for home pts
V586 CAH: Pt/caregiver demonstrate comprehension of training V205 EPO at home: D/C for excessive high BP V549 POC: Monitor ESA response
V590 Care at Home: Coordination of care by member of IDT V215 CfC Patients' rights and responsibilities V450 CfC Patients' Rights V216 Pt R/R: Staff trained V217 Pt R/R: Pt informed of rights/ responsibilities V451 Patients informed of rights when begin treatment
V464 Informed: Rules/expectations regarding patient conduct V470 Rights posted with state/NW contact #s and addresses
V218 Pt R/R: Pt informed of services/charges V462 Informed: Services and charges V219 Pt R/R: Pt informed of medical condition V461 Informed: Own medical status V220 Pt R/R: Pt informed of reuse V460 Informed: Whether facility practices reuse; if so, what options V221 Pt R/R: Pt informed of modalities V458 Informed: All modalities and settings V222 Participation in planning V456 Participate in care; discontinue/refuse treatment
V457 Execute advance directives; facility policy re AD V223 Pt R/R: Notice of transfer V468 Informed: Discharge and transfer policies inc involuntary dc
V469 Receive written 30 days notice before involuntary dc V767 Involuntary discharge process requirements
V224 Respect, dignity & privacy V452 Respect & dignity V454 Privacy & confidentiality in treatment V455 Privacy & confidentiality in records
V225 Pt R/R: Translators V453 Receive information in an understandable way V226 Confidentiality V406 PE: Accommodations for patient privacy
V454 Privacy & confidentiality in treatment
72

Crosswalk from Old to New Tags Old Tag New Tag
Revised 8/08 5
V455 Privacy and confidentiality in records V727 MR: Protect patient records from loss/keep confidential V728 MR: Obtain written permission for release
V227 Grievance mechanism V465 Informed: Internal grievance process V466 Informed: External grievance process V467 Informed: Right to file int/ext grievance w/o risk/anonymous V765 Internal grievance process components & implemented
V230 CfC Medical records V725 CfC Medical records V231 Med rec: Identify, justify, document V726 Medical records: Complete, accurate, accessible
V729 Complete records promptly V730 Centralize all info: Each member of IDT has access
V232 Med rec: Pt assessments V501 Patient assessment: Interdisciplinary Team mbrs/resp V502 Assess current health status inc comorbids V503 Appropriateness of dialysis Rx V504 Assess BP and fluid management needs V505 Assess lab profile V506 Immunization/medication history V507 Assess anemia V508 Assess renal bone disease V509 RD: Nutritional status V510 MSW: Psychosocial needs V511 Dialysis access type & maintenance V512 Eval for self-care, modality and setting V513 Transplantation referral V514 Eval family/support systems V515 Eval current physical activity level & voc/physical rehab
V233 Med rec: Reuse info V305 Reuse: Records: Meet requirements for med records V312 Patients informed regarding dialyzer reuse process V326 Reprocessing record: Complete/available to patient V460 Informed: Whether facility practices reuse; if so, options
V234 Med rec: PCP and LTP V542 IDT develops plan of care V235 Med rec: Pt involvement in PCP/LTP V542 IDT develops plan of care
V556 POC completed/ signed by IDT & patient V236 Med rec: ID and social data V237 Med rec: Consents V238 Med rec: Med and nursing history V502 Assess current health status inc comorbids
V506 Immunization/medication history V239 Med rec: Physicians exam V502 Assess current health status inc comorbids V240 Med rec: Orders V503 PA: Appropriateness of dialysis Rx
V518 Assess HD adequacy monthly/PD adequacy q 4 months V542 POC: IDT develops plan of care V543 POC: Manage volume status V544 POC: Achieve adequate clearance V546 POC: Manage mineral metabolism V547 POC: Manage anemia/ H/H measured monthly V549 POC: Monitor ESA response
V241 Med rec: Progress notes V556 POC completed/signed by IDT & patient V559 Outcome not achieved: Adjust POC
V242 Med rec: Treatments and findings V505 Assess lab profile V243 Med rec: Lab reports V505 Assess lab profile
V676 CLIA labs/meet needs of patients V244 Med rec: D/C summary V729 Complete records promptly
V730 Centralize all information in the record V245 Med rec: Protection of medical record information V727 MR: Protect patient records from loss/keep confidential
V728 MR: Obtain written permission for release V246 Medical records supervisor V247 Med rec: Completed promptly; info centralized V729 Complete records promptly
V730 Centralize all info: Each member of IDT has access V248 Med rec: Self-care/home patients V587 Fac receive/review self monitoring data every 2 months
V599 Care at Home: Recordkeeping system V731 Maintain home patient records
V249 Retention and preservation of records V732 Retain all records 6 years from discharge/death V250 Location and facilities V727 MR: Protect patient records from loss/keep confidential V251 Transfer of medical record information V733 Transfer requested records w/in 1 working day V255 CfC: Physical Environment V400 CfC: Physical Environment V256 PE: Constr & maintain for safety V401 PE: Safe, functional, comfortable environment
V402 PE: Building: Constructed/maintained to ensure safety V403 PE: Equipment maintenance: Per manufacturer's DFU V184 Water room: Environment secure and restricted
V257 PE: Fire ext & evac plans V408 Emergency preparedness: Procedures V258 PE: Equipment PM V248 Dialysate proportioning: Match ratio: All conc/ machine
73

Crosswalk from Old to New Tags Old Tag New Tag
Revised 8/08 6
V249 Dialysate proport: Match machine config w/ ratio in use V250 Dialysate proportioning: Monitor pH/ conductivity V316 Reuse: Maintenance per DFU or semiannual/maintenance record V403 Equipment maintenance: Manufacturer's DFU
V259 PE: Free of hazards V401 PE: Safe, functional, comfortable environment V402 Building: Constructed/maintained to ensure safety
V261 PE: Water treatment V175 CfC Water and dialysate quality V176 Water purity (AAMI RD 52:2004 reference) V177 Max level of chemical contaminants in water/Chem analysis V182 Equipment general/back up plan V184 Environment: Secure & restricted V185 Environment: Access to ports/meters V186 Environment: Alarms in treatment area V187 Environment: Schematic diagrams/labels V188 Sediment filters: Config and monitoring V189 Cartridge filters: Config and monitoring V190 Softeners: Automatically regenerated/timers/salt/salt level V191 Softeners: Testing hardness/log V198 Chemical injection systems V207 Ultrafiltration: Effective/ opaque housing/monitoring V204 DI: Require carbon pre, UF post V208 Water storage and distribution: Design V209 Water storage tank: Shape, vented, filter post V211 Water distribution systems: Continuous flow rate, no dead ends
V262 AAMI-water bacteriology V178 Bacteriology of water-maximum and action levels V179 Bacteriology of water-Medical director responsible V210 Water storage: Monitoring V213 Dist sys: Culture/LAL/sample site/frequency/(new)/log V214 Bacterial control devices: Ultraviolet irradiators V215 Ultraviolet irradiators: Filters post V216 Ozone generators: System requirements/ monitoring V217 Hot water disinf sys: Temp/time/ follow DFU/ piping V218 Hot water disinfection systems: Monitoring V219 Bacterial control: Disinfect monthly/disinfection dwell V211 Water distribution systems: Continuous flow rate, no dead ends V209 Water storage tank: Shape, vented, filter post V220 Bacterial control: Machine supply line disinfected V252 Microbial monitoring: Monthly water samples/method V255 Microbial monitoring: Repeat cultures V254 Microbial monitoring: Sample before disinfect V257 Heterotrophic plate count: Refrig if delay> 2 hours/no calib loop V256 Heterotrophic plate count: Dip samples require QC V258 Bacterial endotoxin test: LAL testing in-house: How to V274 Water test results: Deviations require corrective action plan
V263 AAMI-dialysate bacteriology V180 Bacteriology of conventional dialysate-max and action limits V181 Bacteriology of ultrapure dialysate V233 Bicarb mixing sys/storage/use time limits/min. combine V253 Microbial monitoring: Monthly dialysate samples/method V254 Microbial monitoring: Sample before disinfect V255 Microbial monitoring: Repeat cultures V256 Heterotrophic plate count: Dip samples require QC V257 Heterotrophic plate count: Refrig if delay> 2 hours/no calib loop V258 Bacterial endotoxin test: LAL testing in-house: How to
V264 AAMI-chemical contaminants V177 Max level of chemical contaminants in water/Chem analysis V192 Carbon adsorption: Two tanks/sample ports V193 Carbon adsorption: Banks of tanks V194 Carbon adsorption: Iodine #900/replacement V195 Carbon adsorption: 10 minutes EBCT V196 Carbon adsorption: Monitoring, testing, frequency V197 Carbon adsorption: Action if first test positive V199 RO: Meets AAMI/monitored/recorded on log V200 RO: Monitor/alarm/prevent use of unsafe water V201 RO: Chemical analysis: Frequency V202 DI: Continuous monitoring resistivity/logged 2x day V203 DI: Alarms/divert to drain V204 DI: Require carbon pre/ UF post V205 DI: Polish or back up V206 DI: Chemical analysis: Frequency V212 Water distribution systems: No added burden V270 Ch/chl breakthrough: Corrective action V271 Ch/chl breakthrough: Holding tank use V272 Ch/chl breakthrough: Notify Medical director V273 Ch/chl breakthrough: Action=correction V274 Water test results: Deviations require corrective action plan
74

Crosswalk from Old to New Tags Old Tag New Tag
Revised 8/08 7
No previous tags (Water/ Dialysate) V223 Concentrate preparation: Materials compatibility V222 Acid bulk storage tanks: Safety controls V224 Mixing systems: Water/drain/electric V225 Mixing systems: Safe work environment/ PPE V226 Mixing sys: Follow DFU/monitoring/PM/log/sanitization V227 Mixing systems: Self designed V228 Mixing systems: Labeling V229 Mixing systems: Permanent record/ verification testing V230 Mixing systems: Cleaning V231 Acid conc mixing systems: Empty completely/prevent corrosion V232 Bicarb mixing sys: Empty/disinfect/ prevent corrosion V233 Bicarb mixing sys: Storage/use time limits/min. combine V234 Bicarb mixing sys: Not over-mixed V235 Additives: Mixing spikes V236 Additives: Labeling spiked jugs/ labeling if for specific patient V237 Concentrate distribution: Materials compatibility V238 System configurations: Elevated tanks V239 Bicarb conc distribution: Weekly disinfect/dwell times/conc V240 Bicarb distribution systems: Use of UV V241 Bicarb distribution systems: Ozone disinfection V242 Concentrate distribution: Bicarb monitoring initially V243 Bicarb jugs rinsed daily & stored dry V244 Bicarb jug maintenance and disinfection V245 Acid conc distribution: Conc labeled & color-coded red V246 Bicarb conc distribution: Color coded blue & sealed V247 Conc outlets: Separate/labeled/connection safety V277 In-center preconfigured HD: Meets AAMI RD52 V278 In-center preconfigured HD: Quarterly cultures/LALs
V265 PE: Functional, sanitary, & comfortable V111 Infection control: Sanitary environment V117 IC: Clean/dirty areas; med prep area; no common med carts V121 IC: Handling infectious waste V122 IC: Clean & disinfect surfaces and equipment/written protocols V404 PE: Patient care environment: Sufficient space V405 PE: Comfortable temperature
V266 PE: Infection control V110 CfC: Infection control V113 IC: Wear gloves/hand hygiene V114 IC: Sinks available V115 IC: Wear gowns, shields/masks; staff not eat, drink in tx area V116 IC: Items taken to station disposed/dedicated or disinfected V117 IC: Clean/dirty areas; med prep area; no common med carts V118 IC: Single use vials V119 IC: Supply cart distant/No supplies in pockets V120 IC: Transducer protectors: Not wetted/changed V121 IC: Handling infectious waste V122 IC: Clean & disinfect surfaces and equipment/written protocols V124 IC: HBV: Test all pts, review results/pt status known pre admit V125 IC: HBV: Seroconversion=investigation V126 IC: HBV: Vaccinate patients/staff V127 IC: HBV: Test patients/staff post last dose V128 IC: HBV: Isolation (existing facilities) V129 IC: HBV: Isolation (new facilities) V130 IC: HBV: Isolation of machines/equipment/supplies V131 IC: HBV: Isolation-staffing V132 IC: Training and education V142 IC: Oversight: Monitor activities and implement policies V143 IC: Aseptic technique for IV meds V144 IC: Staff report IC issues V145 IC: Report communicable diseases V146 IC: Catheters: General V147 IC: Staff education re catheters/catheter care V148 IC: Monitor cath related BSI rates/surveillance V331 Reprocessing: Transportation and handling V637 QAPI: Indicator: Infection control: Trend/plan/act
V267 PE: Sufficient space V404 PE: Patient care environment: Sufficient space V268 PE: Storage self-dialysis supplies V269 PE: Nursing station V407 PE: Hemodialysis patients in view during treatments V270 PE: Comfortable temp V405 PE: Comfortable temperature V271 PE: Central delivery V503 PA: Appropriateness of dialysis Rx V272 Prevent cross contamination V116 IC: Items taken to station disposed/dedicated or disinfected
V117 IC: Clean/dirty areas; med prep area; no common med carts V118 IC: Single use vials V119 IC: Supply cart distant/No supplies in pockets V120 IC: Transducer protectors: Not wetted/changed V122 IC: Clean & disinfect surfaces and equipment/written protocols
75

Crosswalk from Old to New Tags Old Tag New Tag
Revised 8/08 8
V142 IC: Oversight: Monitor activities and implement policies V404 PE: Patient care environment: Sufficient space
V273 Waste storage and disposal V121 IC: Handling infectious waste V274 Contamination prevention: Policies/functions V142 IC: Oversight: Monitor activities and implement policies V275 Contamination prevention: Reuse V311 Reuse: Patient considerations: Medical issues
V331 Reprocessing: Transportation and handling V276 Emergency preparedness V408 Emergency preparedness: Procedures
V409 ER preparedness of staff: Initial/annual/re informing patients V412 Emergency preparedness: Patients oriented/trained V414 Emergency plans: EMS contact V415 Annual evaluation of emergency/disaster plans V416 Contact local disaster management agency: Annually V768 GB: Provide pts/staff direction re emergency med care
V277 ER Policy: Reviewed and tested V415 Annual evaluation of emergency/disaster plan V278 ER: Personnel trained V409 ER preparedness of staff: Initial/annual/re informing patients
V411 Nursing staff trained in emergency equip and meds V585 Care at Home: Training content including emergency prep for home pts
V279 ER: Written plan V408 Emergency preparedness: Procedures V414 Emergency plans: EMS contact V415 Annual evaluation of emergency/disaster plans V768 GB: Provide pts/staff direction re emergency med care
V280 ER: Periodic drills V415 Annual evaluation of emergency/disaster plans V281 ER: Drugs and supplies V413 Emergency equipment: On premises: O2, AED, suction, etc. V282 ER: Staff trained in equipment V410 Patient care staff: Current CPR certification
V411 Nursing staff trained in emergency equip and meds V283 ER: Staff trained in procedures V409 ER preparedness of staff: Initial/annual/re informing patients
V411 Nursing staff trained in emergency equip and meds V284 ER: Patients informed V409 ER preparedness of staff: Initial/annual/re informing patients
V412 Emergency preparedness: Patients oriented/trained V768 GB: Provide pts/staff direction re emergency med care
V300 CfC: Reuse V300 CfC: Reuse of hemodialyzers and bloodlines V301 Reuse follows AAMI V304 Reprocessing requirements meets AAMI RD 47:2001/2002 V302 Reuse: Records meet MR standards V305 Records: Meet requirements for med records V303 Dialyzer reprocessing manual V306 Dialyzer reprocessing manual V304 Reprocessing record V326 Reprocessing record: Complete, available to patient V305 Equipment maintenance record V316 Maintenance per DFU or semiannual/maintenance record V306 Personnel health files V310 Personnel health monitoring records V307 Complaint investigation record V356 Recording adverse events/dialyzer complaint log V308 QA & QC record V360 Quality Assurance: General/records/trend analysis V309 Personnel qualifications V307 Personnel qualifications V310 Training curriculum V308 Training curriculum V311 Training documented V309 Training documentation includes med dir certification V312 Reuse: Medical issues V301 Reuse: General requirements: No reuse for HBV+ pts.
V311 Patient considerations: Medical issues V313 Informed consent V312 Patients informed regarding dialyzer reuse process V314 Reuse: Equipment V313 Equipment: Design/construction/function V315 Water systems requirement V178 Water: Bacteriology of water-maximum and action levels
V314 Water systems meet AAMI bact/chem quality/monitoring V316 Water system disinfection V219 Water: Bacterial control: Disinfect monthly/disinfection dwell V317 Testing water supply V314 Water systems meet AAMI bact/chem quality/monitoring V318 Utility requirements V315 Reprocessing systems: Utility requirements V319 Process control testing V324 Process control testing: Methods established
V325 Process control testing: Concentration of germicide V320 Maintenance of equipment V316 Maintenance per DFU or semiannual/maintenance record V321 Repairs of equipment V317 Repairs by qualified personnel; fxn test before return to use V322 Reprocessing area ventilation V318 Reprocessing area and ventilation V323 Storage area V321 Storage area/segregation of dialyzers in process V324 Laboratory area V325 Personnel protection V320 Personnel protective gear V326 Germicides: Environmental safety V319 Environmental safety regarding chemicals V327 Reuse supplies: Spec & tests V322 Reprocessing supplies: Specifications and testing V328 Inventory control V323 Inventory control V329 Hemodialyzer labeling V327 Hemodialyzer labeling: Unique to patient V330 Time of labeling V328 Time of labeling: Before or at first use; updated p each use V331 Label composition V329 Label composition & placement V332 Label information V330 Information recorded on label: Similar name warning V333 Reprocessing V334 Transportation and handling V331 Reprocessing: Transportation and handling V335 Start time for reprocessing V331 Reprocessing: Transportation and handling V336 Rinsing V332 Rinsing/cleaning: Pre-cleaning equipment/pressures
V333 Rinsing/cleaning: Use AAMI quality water
76

Crosswalk from Old to New Tags Old Tag New Tag
Revised 8/08 9
V334 Dialyzer header cleaning and disinfection V337 Cleaning V335 Rinsing/cleaning: Chemicals used/ rinsed after each V338 Performance test after each use V336 TCV measured after q use/original volume known V339 Ultrafiltration V359 Ultrafiltration: Monitoring patient's weight V340 Blood path integrity V337 Blood path integrity test after each use V341 Germicide: High level disinfectant V339 Germicidal process: High level disinfection achieved V342 Germicide concentration V338 Germicide: Sufficient for point of use V343 Water testing V178 Water: Bacteriology of water-maximum and action levels
V314 Water systems meet AAMI bacti/chem quality/monitoring V344 Filling with germicide, cap cleaning V340 Dialyzer germicide=90% conc/port caps disinfected V345 Water testing frequency V178 Water: Bacteriology of water-maximum and action levels
V314 Water systems meet AAMI bacti/chem quality/monitoring V346 Germicide concentration verification V341 Chemical germicide concentration: Verification testing V347 Exterior cleaning V342 Dialyzer exterior: Low level disinfection V348 Inspection after reprocessing V343 Dialyzer inspection after reprocessing: All aspects/aesthetics V349 Inspect: Dialyzer jacket V343 Dialyzer inspection after reprocessing: All aspects/aesthetics V350 Inspect: No cracks V343 Dialyzer inspection after reprocessing: All aspects/aesthetics V351 Inspect: No clotted fibers V343 Dialyzer inspection after reprocessing: All aspects/aesthetics V352 Inspect: Headers V343 Dialyzer inspection after reprocessing: All aspects/aesthetics V353 Inspect: Ports capped V343 Dialyzer inspection after reprocessing: All aspects/aesthetics V354 Inspect: Label V343 Dialyzer inspection after reprocessing: All aspects/aesthetics V355 Disposition of rejected dialyzers V344 Disposition of rejected dialyzers V356 Storage V345 Reprocessed dialyzer storage V357 Procedure for prep to use V346 Prep for dialysis: Written P&Ps for germicide testing V358 Visual inspection V347 Prep for dialysis: Visual inspection: All aspects V359 Patient ID check V348 Verification of patient identification: 2 people V360 Germicide presence check V350 Germicide presence test of each dialyzer V361 Germicide contact time V349 Verification of germicidal contact V362 Presence for each V350 Germicide presence test of each dialyzer V363 Req if each not tested V351 Germicide presence: Process control/sampling V364 Automate or use dye indicator V351 Germicide presence: Process control/sampling V365 Sample for presence V351 Germicide presence: Process control/sampling V366 Rinse pre use V352 Dialyzer priming/rinsing the germicide V367 Test for residual V353 Testing for residual germicide/max time rinsed to use V368 Repeat rinsing V353 Testing for residual germicide/max time rinsed to use V369 Written guide for tests V346 Prep for dialysis: Written P&Ps for germicide testing V370 Pt observed for complications V354 Monitoring dialysis/patient's clinical course V371 Temps pre and post tx V355 Monitoring: Fever/chills/ other symptoms V372 Suspicious reactions evaluated V355 Monitoring: Fever/chills/ other symptoms V373 Reactions= incident report V356 Recording adverse events/Dialyzer complaint log
V383 FDA reporting of adverse outcomes V374 Dialyzer failures recorded V357 Dialyzer failures/blood leaks recorded V375 URR or KT/V assessed V358 Monitoring: Patient clinical results/Kt/V V376 QA: Process review: Outcomes V360 Quality assurance: General/records/trend analysis
V635 QAPI Indicator: HD reuse program V377 QA: Review of records V360 Quality assurance: General/records/trend analysis V378 QA: Schedule of activities V361 Schedule of QA activities/medical director responsible V379 QA: Yearly audit p/p re consent V362 QA audits: Patient considerations annually V380 QA: Yearly audit procedures and prn V363 QA audits: Manuals and procedures annually and prn V381 QA: Yearly audit physician environ V364 QA audits: Physical plant/environmental safety annually V382 QA: Q 6 mo review supplies V365 QA audits: Reprocessing supplies semiannually V383 QA: Quarterly audit labeling V366 QA audits: Hemodialyzer labeling quarterly V384 QA: Audit practice issue V367 QA audits: Reprocessing procedures monthly; semiannually V385 QA: Audit set up for tx V368 QA audits: Preparation for dialysis quarterly V386 Chemical germicides V379 Dialyzers not exposed to more than one germicide V387 Surveillance V381 Blood/dialysate cultures for adverse patient reactions
V382 Cluster of adverse patient reactions/suspend reuse V388 Transducer filters V120 IC: Transducer protectors not wetted/ changed V389 Bloodline reuse requirements V378 Reprocess dialyzers and bloodlines by DFU V390 Reuse: Labeled for single use V378 Reprocess dialyzers and bloodlines by DFU V391 Reuse: Has FDA protocol V378 Reprocess dialyzers and bloodlines by DFU V392 Bloodline reuse acc to FDA protocol V378 Reprocess dialyzers and bloodlines by DFU V410 CfC: Affiliation agreement V770 Transfer agreement with hospital for inpatient care V411 Aff Agreement: Pts accepted in ER V412 Aff Agreement: Transfer timely V413 Aff Agreement: Med records V414 Aff Agreement: Pt personal items V420 CfC: Director of a renal dialysis facility V710 CfC: Responsibilities of the Medical Director V421 Director: Qualified V682 Personnel: Medical director: BC + 12 months dialysis exp
77

Crosswalk from Old to New Tags Old Tag New Tag
Revised 8/08 10
V683 Personnel: Medical director exception (CMS approval) V711 Medical director qualified/accountable to Governing Body
V422 Resp: Selection of modality V512 PA: Eval for self care, modality & setting V553 POC: Home dialysis plan or why not V554 POC: Transplantation status plan or why not
V423 Resp: Training staff V132 Infection control training and education V260 Water/dialysate: Personnel: Training program/periodic audits V308 Reuse training: Curriculum V309 Reuse: Training documentation includes med dir certification V409 ER preparedness of staff: Initial/annual/re informing patients V411 Nursing staff trained in emergency equip and meds V696 Water treatment system techs training V713 MD resp: Staff ed, training and performance V760 GB responsible for staff oriented to facility & responsibilities V761 Staff have access to continuing education
V424 Resp: Monitoring process V275 Water/dialysate: Adverse events: Actions expected V559 POC: Outcome not achieved: Adjust POC V638 QAPI: Continuously monitor/take action/track/ sustain/ improve V712 MD resp: QAPI Program V715 MD resp: Ensure all adhere to P&P
V425 Resp: P/P manual V714 MD resp: Develop, review and approve P&P V426 Resp: Self-care V562 POC: Patient/family education & training
V585 Care at Home: Training content including emergency prep for home pts V586 Care at Home: Pt/caregiver demonstrate comprehension of training
V430 CfC: Staff of a renal dialysis facility V750 CfC: Governance V431 Registered nurse V501 Patient assessment: Interdisciplinary Team mbrs/resp
V502 Assess current health status inc comorbids V504 Assess BP and fluid management needs V505 Assess lab profile V506 Immunization/medication history V507 Assess anemia V508 Assess renal bone disease V511 Dialysis access type & maintenance V512 Eval for self-care, modality and setting V513 Transplantation referral V514 Eval family/support systems V515 Eval current physical activity level & voc/physical rehab V541 Patient Plan of Care: Goals=evidence-based standards V543 POC: Manage volume status V544 POC: Achieve adequate clearance V545 POC: Effective nutritional status V546 POC: Manage mineral metabolism V547 POC: Manage anemia/ H/H measured monthly V548 POC: Home patient: Eval safe ESA administration V549 POC: Monitor ESA response V551 POC: VA: Monitor to prevent failure/stenosis V553 Home dialysis plan or why not V554 Transplantation status plan or why not V684 Personnel: Nurse manager: 12 mo RN + 6 mo dialysis
V432 On-duty personnel: Licensed person V759 GB: RN present at all times V433 Staff ratios meet pt needs V757 GB: Staff # and ratio meets patient needs V434 Staff numbers meet pt needs V592 CAH: Pt consultation with members of IDT as needed
V757 GB: Staff # and ratio meets patient needs V758 GB: RN, MSW & RD available to meet patient needs
V435 Adeq number for non-med needs V757 GB: Staff # and ratio meets patient needs V436 Self-care dialysis training personnel V584 CAH: Training conducted by qualified RN
V685 Self care/home training nurse: 12 mo RN + 3 mo modality V440 CfC: Minimal service requirements V750 CfC: Governance
V675 CfC: Laboratory services V680 CfC: Personnel qualifications
V441 Outpatient dialysis services V764 GB: Services furnished on the main premises V442 Self-dialysis services V580 CfC: Care at Home
V588 CAH: Support services must be provided V597 CAH: Provide ordered supplies/equipment
V443 Laboratory services-in-house V676 CLIA labs/meet needs of patients V444 Laboratory services-outside V676 CLIA labs/meet needs of patients V445 Social services V510 PA: MSW: Psychosocial needs
V514 PA: Eval family/support systems V515 PA: Eval current physical activity level & voc/physical rehab V552 POC: Psychosocial counseling/referrals/assessment tool V555 POC: Rehab status addressed
78

Crosswalk from Old to New Tags Old Tag New Tag
Revised 8/08 11
V592 CAH: Pt consultation with members of IDT as needed V758 GB: RN, MSW, and RD available to meet patients' needs V767 GB: Involuntary discharge process requirements
V446 Social worker qualified V691 Social worker: MSW/grandfather if from before 1976 V447 Social worker responsibilities V501 Patient assessment: Interdisciplinary Team mbrs/resp
V510 PA: MSW: Psychosocial needs V512 PA: Eval for self care, modality & setting V513 PA: Transplantation referral V514 PA: Eval family/support systems V515 PA: Eval current physical activity level & voc/physical rehab V542 IDT develops plan of care V552 POC: Psychosocial counseling/referrals/assessment tool V553 POC: Home dialysis plan or why not V554 POC: Transplantation status plan or why not V555 POC: Rehab status addressed V556 POC Completed/signed by IDT & patient V559 Outcome not achieved: Adjust POC V562 POC: Patient/family education & training V582 CAH: IDT oversees home training V592 CAH: Pt consultation with members of IDT as needed V626 QAPI: Covers scope of services/effective/IDT involved V636 QAPI Indicator: Pt satisfaction & grievances V765 GB: Internal grievance process components and implemented V767 GB: Involuntary discharge process requirements
V448 Dietetic services V508 PA: Assess renal bone disease V509 PA: RD: Nutritional status V545 POC: Effective nutritional status V546 POC: Manage mineral metabolism V592 CAH: Patient consultation with members of IDT as needed V689 Personnel: Dietitian: RD V690 Dietitian: 1 year experience after registration V758 GB: RN, MSW, and RD available to meet patients' needs
V449 RD responsibilities V509 PA: RD: Nutritional status V542 IDT develops plan of care V545 POC: Effective nutritional status V556 POC completed/signed by IDT & patient V559 Outcome not achieved: Adjust POC V562 POC: Patient/family education & training V582 CAH IDT oversees home training V592 CAH: Pt consultation with members of IDT as needed V626 QAPI: Covers scope of services/effective/IDT involved V630 QAPI indicator: Nutritional status V758 GB: RN, MSW, and RD available to meet patients' needs
V450 Self-dialysis support services V581 CAH: IDT resp=services equivalent to in-center patients V589 CAH: Monitor home adaptation; home visits=POC
V451 Self-dialysis RD & MSW V582 CAH: IDT oversees home training V592 CAH: Pt consultation with members of IDT V501 Patient assessment: Interdisciplinary Team mbrs/resp V509 PA: RD: Nutritional status V510 PA: MSW: Psychosocial needs V512 PA: Eval for self care, modality & setting V513 PA: Transplantation referral V514 PA: Eval family/ support systems V515 PA: Eval current physical activity level & voc/physical rehab V542 IDT develops plan of care V545 POC: Effective nutritional status V552 POC: Psychosocial counseling/referrals/assessment tool V554 POC: Transplantation status plan or why not V555 POC: Rehab status addressed V556 POC completed/signed by IDT & patient V559 Outcome not achieved: Adjust POC V562 POC: Patient/family education & training V582 CAH: IDT oversees home training V592 CAH: Pt consultation with members of IDT as needed V636 QAPI Indicator: Pt satisfaction & grievances V765 GB: Internal grievance process components and implemented V767 GB: Involuntary discharge process requirements
V452 Self-dialysis: Records V726 Medical records: Complete, accurate, accessible V729 Med Rec: Complete records promptly V730 Med Rec: Centralize all info: Each member of IDT has access V599 CAH: Recordkeeping system V731 Med Rec: Maintain home patients' records
V453 Self-dialysis: Equipment V588 CAH: Support services must be provided V597 CAH: Provide ordered supplies and equipment
79

Crosswalk from Old to New Tags Old Tag New Tag
Revised 8/08 12
V593 CAH: Monitor water/dialysate inc on site evaluation V594 CAH: Preconfig HD sys: Testing water/dialysate follow DFU/FDA V595 CAH: Meet RD 52:2004
V454 Self-dialysis: Water treatment V593 CAH: Monitor water/dialysate inc on site evaluation V594 CAH: Preconfig HD sys: Testing water/dialysate follow DFU/FDA V595 CAH: Meet RD 52:2004 V596 Correct water/dialysate problem or arrange back up dialysis
V455 Self-dialysis: Supplies V588 CAH: Support services must be provided V597 CAH: Provide ordered supplies and equipment
V456 Participation in recipient registry V457 Use of EPO at home: Patient selection V548 POC: Home patient: Eval safe ESA administration V458 EPO: Conditions the patient must meet V548 POC: Home patient: Eval safe ESA administration V459 EPO: Physician/facility direction V507 PA: Assess anemia
V547 POC: Manage anemia/H/H measured monthly V548 POC: Home patient eval safe ESA administration V549 POC: Monitor ESA response
V460 EPO: Pt & caregiver requirements V548 Home patient: Eval safe ESA administration V585 CAH: Training content including emergency prep for home pts
V461 EPO: Care and storage of drug V548 Home patient: Eval safe ESA administration V462 EPO: Physician/fac responsibility V548 Home patient: Eval safe ESA administration No previous tags V417 PE: Fire safety: Life Safety code 2000
V418 PE: LSC: Sprinklers V419 PE: LSC: Waiver if state requirements meet Fed req V420 PE: LSC waiver V459 PR: Informed: Patient care policies V463 PR: Receive services outlined in POC V583 CAH: Training provided by certified home training facility V598 CAH: Plan for ER back-up dialysis V660 CfC: Special Purpose Renal Dialysis Facilities V661 Special Purpose: Two categories V662 SP: Approval period: 8 months V663 SP: Service limitations V666 SP: Physician contact V667 SP: Records transferred within 30 days V694 Personnel: PCT: Training program content V771 GB: Electronic data submission required for program admin
80

SAMPLE
Produced by The University of Michigan Kidney Epidemiology and Cost Center 1/18 iii__________________________________________________________________________________
2008 Dialysis Facility ReportSAMPLE DIALYSIS CENTER State: XX Network: 99 CMS Provider#: 999999
iii
2008 Dialysis Facility Report
Purpose of the Report
Enclosed is the 2008 Dialysis Facility Report (DFR) for this facility, based on data from the Centers forMedicare & Medicaid Services (CMS).
This DFR includes data specific to provider number(s): 999999These data could be useful in quality improvement and assurance activities. The information contained in thisreport facilitates comparisons of patient characteristics, treatment patterns, transplantation rates, hospitalizationrates, and mortality rates to local and national averages. Some of these comparisons account for the patient mixat this facility, including age, sex, race, and diabetic status. This report is provided as a resource forcharacterizing selected aspects of clinical experience at this facility relative to other caregivers in this state,ESRD Network, and across the United States.
In September 2008, each state's surveyors will receive the DFR for all dialysis facilities in their state.
This report also provides you with advance notice of the updated quality measures (urea reduction ratio,hemoglobin, and patient survival) for your facility that will be reported on the Dialysis Facility Compare (DFC)website in November 2008 (www.medicare.gov).
Collaborators
CMS has contracted with the University of Michigan Kidney Epidemiology and Cost Center (UM-KECC) andArbor Research Collaborative for Health to produce the 2008 Dialysis Facility Reports.
How to Submit Comments
Please visit https://secure.ArborResearch.org/ESRDmeasures/ and follow the instructions to send yourcomments to:
● Dialysis Facility Compare: Comment on the three DFC measures (see page 2) which will bereported on the DFC public website in November 2008. Your comments will not appear onthe DFC website.
● State Surveyor: Comment on your DFR for the state surveyors. The state surveyors willreceive a copy of your DFR in September 2008 with your comments.
● UM-KECC: Submit questions about your DFR to UM-KECC. You can also submit yoursuggestions to improve the DFR.
The deadline for submitting comments is September 7, 2008.
SAMPLE
SAMPLE
SAMPLE
81

SAMPLE
Produced by The University of Michigan Kidney Epidemiology and Cost Center 2/18 iii__________________________________________________________________________________
2008 Dialysis Facility ReportSAMPLE DIALYSIS CENTER State: XX Network: 99 CMS Provider#: 999999
iiiDear Dialysis Facility Director:
This report has been prepared for this facility by the University of Michigan Kidney Epidemiology and CostCenter (UM-KECC) with funding from the Centers for Medicare & Medicaid Services (CMS). It is thethirteenth in a series of annual reports. This is one of 5,279 reports that have been sent to the ESRD Networksfor distribution to ESRD providers in the U.S. Your state survey agency will receive this report in September2008. Selected highlights from this report are given here. The information specific to this facility is printed inbold type for easy identification.
What's New This Year: As part of a continuing effort to improve the quality and relevance of this reportfor your facility, the following changes have been incorporated into your 2008 DFR. A new section on thenumber of days patients spend in the hospital is now reported with the admission statistics in Table 2. Thepercent of patients experiencing a hospitalization with congestive heart failure, cardiac dysrhythmia, andcardiac arrest have also been added. A section on all transplants after day 90 of ESRD is now reported alongwith the first transplantation summary statistics in Table 3. The number of patients who received transplantsfrom a living donor has also been added. The anemia management measures contained in Table 5 are nowreported as percent of patients meeting specified hemoglobin levels. Please refer to the section entitled "What'sNew" in Section I of the Guide to the 2008 Dialysis Facility Reports for greater detail on these changes.
Dialysis Facility Compare: The anemia and patient survival measures will be reported differently on DFCthis year. Hemodialysis adequacy will be reported as before. Anemia management will be reported as twomeasures: the percent of patients with hemoglobin values of less than 10 g/dL and the percent of patients withhemoglobin values greater than 12 g/dL. Patient survival will be reported in three categories as before but thecategory definitions have changed (see below). The URR and hemoglobin measures were calculated forMedicare approved dialysis facilities operating at any time during 2007. The hemoglobin measures werecalculated only for patients treated with erythropoiesis stimulating agents (ESA). The patient survival measurewas calculated for Medicare approved dialysis facilities operating at any time from 2004 through 2007. Thefollowing measures for this facility will appear on the DFC website:
Measure Name This Facility
1. The percentage of Medicare hemodialysis patients treatedin this facility during 2007 with URR ≥ 65% mmmmiNumber of patients included in calculation: 36
100%
2. The percentage of Medicare patients treated in this facility during 2007with ESA-treated hemoglobin <10 g/dLwith ESA-treated hemoglobin >12 g/dLNumber of patients included in calculation: 35
0%74%
3. Patient survival reported as "as expected," "better than expected,"or "worse than expected" for the time period 2004-2007 for this facility mmmmiStandardized Mortality Ratio (SMR):mmmmi0.96mmmmiP-value:AAAAAAAAAAAimmmmmmmmi 0.89
As Expected
Please see Table 5 for more information on URR and ESA-treated hemoglobin for this facility. URR andESA-treated hemoglobin measures based on 10 or fewer patients will be reported as "not available" on DFC. Table 1 provides additional information on patient survival. If the Standardized Mortality Ratio (SMR) is lessthan 1.00 and statistically significant (p<0.05), the patient survival classification is "Better than Expected" onDFC. If the facility SMR is greater than 1.00 and statistically significant (p<0.05), the patient survivalclassification is "Worse than Expected" on DFC. Otherwise, the patient survival classification is "As Expected"on DFC. Please note that the classification is not reported for a facility if the SMR is based on 3 or fewerexpected deaths.
SAMPLE
SAMPLE
SAMPLE
82

SAMPLE
Produced by The University of Michigan Kidney Epidemiology and Cost Center 3/18 iii__________________________________________________________________________________
2008 Dialysis Facility ReportSAMPLE DIALYSIS CENTER State: XX Network: 99 CMS Provider#: 999999
iii
Overview: This report includes summaries of patient characteristics, treatment patterns, and patient outcomesfor chronic dialysis patients who were treated in this facility between January 2004 and December 2007. Mortality, hospitalization, and transplantation statistics are reported for a three- or four-year period. Regionaland national averages are included to allow for comparisons. Several of the summaries of patient mortality,hospitalization, and transplantation are adjusted to account for the characteristics of the patient mix at thisfacility, including age, sex, race, ethnicity, and diabetes as a cause of ESRD. Unless otherwise specified, datarefer to hemodialysis and peritoneal dialysis patients combined.
Summary data about the percent of patients with URR of 65% or higher and with central catheters are included,as suggested by Kidney Disease Outcomes Quality Initiative (KDOQI) Clinical Practice Guidelines. Summarydata about the percent of patients with hemoglobin from 10 g/dL to 12 g/dL are also reported. These practicepattern measures are strongly correlated with the mortality and hospitalization measures found in these reports. Note that elevated mortality or hospitalization rates may be due to a variety of causes unrelated to clinicalpractices, so it may not always be possible to identify clinical practices that explain those rates.
Mortality: Mortality summaries are provided in Table 1. A Standardized Mortality Ratio (SMR) iscalculated for each facility. Although mortality statistics can vary substantially from year to year, they arereported here as a key outcome for dialysis patients. The SMR compares the observed death rate in this facilityto the death rate that would be expected based on national death rates for patients with the characteristics of thepatients at this facility. Time at risk and deaths within 60 days after transfer out of this facility are attributed tothis facility. Time at risk and deaths after transplantation are excluded from the analysis. The SMR is adjustedfor patient age, sex, race, ethnicity, diabetes as a cause of ESRD, duration of ESRD, nursing home status, BMIat incidence, and comorbidities at incidence, as well as state population death rates. The rate of withdrawalfrom dialysis and the percentage of deaths due to infection are reported in the table to help in the interpretationof the mortality outcomes.
There was a 22% annual observed death rate among the patients treated at this facility during2004-2007, while a rate of 23% would be expected, based on the age, sex, race, ethnicity, diabetes as causeof ESRD, duration of ESRD, nursing home status, BMI at incidence, comorbidities at incidence, andstate population death rates. The SMR of observed to expected deaths is 0.96, which is not far (4%)below the national reference value of 1.00.
Hospitalization: Hospitalization summaries are reported for Medicare patients in Table 2. The tableincludes information on the number of hospital admissions, the number of hospital days, and the diagnosespresent at admission for patients at this facility. The total days hospitalized rate reports the total number of daysthis facility's patients spent in the hospital per year, including multiple admissions per patient, and is adjustedfor age, race, sex, and diabetes. As in the mortality calculation, time at risk and hospitalizations within 60 daysafter transfer out of this facility are attributed to this facility. Time at risk and hospitalizations starting 3 daysbefore transplantation are excluded from the analysis.
The Standardized Total Days Hospitalized Ratio of observed to expected number of days for patients for2004-2006 at this facility is 0.99, which is 16% lower than expected.
Infection: Information on hospitalizations for septicemia is reported on Table 2. The information in Table 2is based on Medicare patient claims.
The percentage of Medicare dialysis patients at this facility hospitalized with septicemia during2004-2006 was 16%, compared to 12% nationally.
Transplantation: Transplantation summaries are reported in Table 3. The Standardized TransplantationRatio (STR) represents relative first transplantation rates (observed/expected) for patients at this facilityadjusting for patient age. Patients who are 70 or older as well as those with a prior kidney transplant are
SAMPLE
SAMPLE
SAMPLE
83

SAMPLE
Produced by The University of Michigan Kidney Epidemiology and Cost Center 4/18 iii__________________________________________________________________________________
2008 Dialysis Facility ReportSAMPLE DIALYSIS CENTER State: XX Network: 99 CMS Provider#: 999999
iii
excluded. As in the mortality and hospitalization calculations, time at risk and transplants within 60 days aftertransfer out of this facility are attributed to this facility.
Of the patients under age 70 treated at this facility during 2004-2007 who had not previously received atransplant, 8% were transplanted annually, while a rate of 6% would be expected for these patients. TheSTR of observed to expected number of patients transplanted for this facility is 1.39, which is 39% higherthan expected for this facility. This difference is not statistically significant (p>0.05) and could plausiblybe due to random chance.
Transplant Waitlist: Table 4 summarizes waitlist information for patients under age 70 being treated atthis facility at the end of each year. Unlike the mortality, hospitalization, and transplantation statistics, thewaitlist statistics do not include patients who transferred out of the facility.
Among the 35 dialysis patients under age 70 treated at this facility on December 31, 2007, 31% were onthe kidney transplant waitlist compared to 24% nationally. This difference is not statistically significant(p>0.05) and is plausibly due to random chance.
Practice Patterns: Table 5 summarizes the dialytic modality, hemoglobin, and URR for patients treated atthis facility during each year. These data are derived from CMS Medicare paid dialysis claim data. Vascularaccess data for prevalent and incident patients as reported by the CMS Fistula First project are summarized inTable 6.
Among the 35 ESA-treated dialysis patients included in the analysis of Medicare claims data of hemoglobin for 2007 at this facility, 26% had hemoglobin between 10-12 g/dL compared to 54%nationally. Among the 36 hemodialysis patients in this facility included in the analysis of Medicareclaims data of URR in 2007, 100% had URR above the KDOQI minimum value for URR (URR ≥ 65%),compared to 95% nationally.
At this facility in 2007, an average of 7% of incident patients had AV fistulae in place, compared to 29%nationally. Also at this facility in 2007, an average of 52% of prevalent patients had AV fistulae in place,compared to 55% nationally. Of the prevalent patients receiving hemodialysis treatment at this facilityin 2007, 8% had a catheter which had been in place for more than 90 days as their only vascular access,compared to 12% nationally. See Tables 5 and 6 for more information about practice patterns.
Patient Characteristics: Characteristics of patients starting dialysis during 2004-2007 are reported inTable 7. Table 8 gives summaries for all dialysis patients being treated at the end of each year, 2004-2007. Comorbidities are reported in Table 9 for Medicare dialysis patients being treated at the end of each year,2004-2006.
There were 16 patients with Medical Evidence Forms (CMS-2728) which indicated that they startedtreatment at this facility during 2007. The average number of comorbidities reported for new patients is3.3, which is higher than the average of 3.1 reported nationally. Also, 31% of these patients were notunder the care of a nephrologist before starting dialysis, compared to 31% nationally. Furthermore,94% of these patients were informed of their transplant options, compared to 71% nationally. Theaverage serum albumin calculated for these patients (before first dialysis) is 2.8 g/dl, which is lower thanthe national average value of 3.1 g/dl. The average residual renal function (GFR) calculated for thesepatients from serum creatinine (before first dialysis) and other parameters was 10.7 ml/min, which islower than the national average value of 10.8 ml/min. iii
Among patients treated at this facility on December 31, 2007, 4% were treated in a nursing home duringthe year, which is lower than the national average value of 13%.iiThe average number of comorbidities
SAMPLE
SAMPLE
SAMPLE
84

SAMPLE
Produced by The University of Michigan Kidney Epidemiology and Cost Center 5/18 iii__________________________________________________________________________________
2008 Dialysis Facility ReportSAMPLE DIALYSIS CENTER State: XX Network: 99 CMS Provider#: 999999
iii
reported on Medicare claims in 2006 for Medicare patients in this facility on December 31, 2006 is 4.0,which is lower than the national average value of 4.1.
Facility Information: General information about this facility is provided in Tables 11, 12, and 13. Table11 provides counts of patients treated, Medicare eligibility, treatment modality, and staffing from the AnnualFacility Survey (Form CMS-2744). Table 12 reports survey and certification activity. Table 13 includesservices provided by this facility as well as information on ownership.
This facility reported having 0 staff members to care for 48 patients at the end of 2007. This facilityreported having 12 stations available as of March 31, 2008. This facility offers hemodialysis servicesonly. Additional information regarding patient counts, patient modality, and facility staffing is availablein Table 11.
* * *
Sources of Patient Data: This report is based primarily on Medicare claims and data collected for CMS. Patients were assigned to this facility based on the Standard Information Management System (SIMS) database,Medicare claims, and Medical Evidence Forms (Form CMS-2728). Network 99 has a list of the patientsincluded in the mortality analyses for this facility. Table 9 reports comorbidities reported on Medicare claims. Table 10 reports the number of patients placed in this facility for analyses in Tables 1, 2, 3, 8, and 9 of thisreport. Table 10 also provides information on patient status at the end of the year, both for patients who remainin this facility until the end of each year, and for those who transfer out of this facility, receive a transplant, ordie during the year.
These are just a few highlights of the statistics you will find in this report based on the data for this facility. Wehope that this report is of interest to you and that you will discuss it with your staff. We welcome any questionsor comments you might have about the content of the current report or any suggestions you might have forfuture reports. Comments or suggestions can be submitted at https://secure.ArborResearch.org/ESRDmeasures/until September 7, 2008. If you have questions after the comment period is over, please contact us directly [email protected] or (734)998-9823.
For a complete description of the methods used to calculate the statistics in this report, please see the Guide tothe 2008 Dialysis Facility Reports. The Guide is available from ESRD Network 99, and is also on theUM-KECC web site at www.sph.umich.edu/kecc.
Prepared byThe University of Michigan Kidney Epidemiology and Cost Center (UM-KECC)under contract with the Centers for Medicare & Medicaid Services
SAMPLE
SAMPLE
SAMPLE
85
SAMPLE
Produced by The University of Michigan Kidney Epidemiology and Cost Center 6/18 iii__________________________________________________________________________________
2008 Dialysis Facility ReportSAMPLE DIALYSIS CENTER State: XX Network: 99 CMS Provider#: 999999
TABLE 1: Mortality Summary for All Dialysis Patients 1, 2004-2007
This FacilityRegional Averages2,per Year, 2004-2007
Measure Name iii 2004 iii 2005 iii 2006 iii 2007 iii 2004-2007 iii State iii Network iii U.S.Death Rates1a Patients (n=number) 56 62 65 61 2447 97.5 71.2 94.0
1b Patient years (PY) at risk (n) 41.2 44.2 45.1 45.1 1767 67.3 48.3 59.2
1c Deaths (n) 12 8 10 9 397 14.7 11.0 13.0
1d Expected deaths (n) 9.6 10.1 10.4 10.4 40.57 15.5 12.0 13.0
1e Death rate per 100 PY 29.1 18.1 22.2 20.0 22.2 21.9 22.7 21.9
1f Expected death rate per 100 PY 23.2 22.9 23.0 23.1 23.1 23.1 24.8 22.0
Categories of Death1g Withdrawal from dialysis prior to death (% of 1c) 50.0 37.5 40.0 22.2 38.5 27.4 33.7 23.5
1h Due to infections (% of 1c) 33.3 12.5 10.0 22.2 20.5 18.5 19.0 18.6
1i Dialysis unrelated deaths3 (n; excluded from SMR) 0 0 0 0 07 0.1 0.1 0.1
Standardized Mortality Ratio (SMR)
1j SMR4 1.25 0.79 0.96 0.86 0.96 0.95 0.91 1.00
1k P-value5 0.51 0.64 0.99 0.81 0.89 n/a n/a n/a
1l 95% Confidence interval for SMR6
Upper limit 2.19 1.56 1.77 1.64 1.32 n/a n/a n/a
Lower limit 0.65 0.34 0.46 0.39 0.68 n/a n/a n/a
SMR Percentiles for this Facility (i.e. percent of facilities with lower mortality rates)1m In this State 77 30 61 42 59
1n In this Network 80 39 63 50 65
1o In the U.S. 72 26 49 42 47
n/a = not applicable[1] See Guide, Section IV.[2] Values are shown for the average facility, annualized.[3] Defined as deaths due to street drugs and accidents unrelated to treatment.[4] Calculated as a ratio of deaths (1c) to expected deaths (1d); not shown if there are too few expected deaths.[5] A p-value less than or equal to 0.05 indicates that the difference between the actual and expected mortality is probably real and is not due to random
chance alone, while a p-value greater than 0.05 indicates that the difference could plausibly be due to random chance.[6] The confidence interval range represents uncertainty in the value of the SMR due to random variation.[7] Sum of 4 years used for calculations; should not be compared to regional averages.SAM
PLE
SAMPLE
SAMPLE
86

SAMPLE
Produced by The University of Michigan Kidney Epidemiology and Cost Center 7/18 iii__________________________________________________________________________________
2008 Dialysis Facility ReportSAMPLE DIALYSIS CENTER State: XX Network: 99 CMS Provider#: 999999
TABLE 2: Hospitalization Summary for Medicare Dialysis Patients1, 2004-2006
This FacilityRegional Averages2,per Year, 2004-2006
Measure Name iii 2004 iii 2005 iii 2006 iii 2004-2006 iii State iii Network iii U.S.Medicare Dialysis Patients
2a Medicare dialysis patients (n) 46 50 55 1516 77.4 56.0 71.0
2b Patient years (PY) at risk (n)3 34.1 35.9 37.7 107.76 53.9 38.3 44.3
Total Days Hospitalized Statistics
2c Total days hospitalized (n) 484 512 531 15276 879.3 543.4 660.5
2d Expected total days hospitalized (n) 490.0 516.7 533.8 1540.56 823.0 576.2 664.5
2e Days hospitalized rate per PY 14.2 14.3 14.1 14.2 16.3 14.2 14.9
2f Expected days hospitalized rate per PY 14.4 14.4 14.2 14.3 15.3 15.1 15.0
2g Standardized Total Days Hospitalized Ratio4 0.99 0.99 0.99 0.99 1.07 0.94 0.99
Total Admission Statistics
2h PY at risk for total admissions (n)3 32.8 34.5 36.2 104 51 37 42
2i Total admissions (n) 73.0 92.0 72.0 2375 115 76 85
2j Expected total admissions (n) 65.5 68.4 70.5 204.45 104.1 73.9 84.7
2k Admission rate per PY 2.2 2.7 2.0 2.3 2.2 2.1 2.0
2l Expected admission rate per PY 2.0 2.0 1.9 2.0 2.0 2.0 2.0
2m Standardized Total Admission Ratio5 1.11 1.35 1.02 1.16 1.11 1.03 1.00
Diagnoses Present at Admission (% of 2a)2n Septicemia 17.4 14.0 16.4 15.9 15.1 12.6 11.6
2o Acute myocardial infarction 6.5 6.0 5.5 6.0 6.3 5.4 4.0
2p Congestive heart failure 30.4 36.0 30.9 32.5 31.7 28.7 24.3
2q Cardiac dysrhythmia 26.1 28.0 16.4 23.2 17.3 17.5 14.1
2r Cardiac arrest 6.5 4.0 0.0 3.3 2.2 1.9 1.7
Length of Stay2s One day admissions (% of 2i) 15.1 22.8 19.4 19.4 12.4 14.5 13.7
2t Average length of stay (days per admission; 2c/2i) 6.6 5.6 7.4 6.4 7.6 7.1 7.8
n/a = not applicable[1] Based on patients with Medicare as primary insurer; see Guide, Section V.[2] Values are shown for the average facility, annualized.[3] Patient years at risk in 2b includes all time at risk. Patient years at risk for total admissions in 2h does not include time in the hospital.[4] Standardized Total Days Hospitalized Ratio calculated as ratio of actual (2c) to expected (2d) hospitalized days.[5] Standardized Total Admission Ratio calculated as ratio of actual (2i) to expected (2j) total admissions.[6] Sum of 3 years used for calculations; should not be compared to regional averages.
SAMPLE
SAMPLE
SAMPLE
87

SAMPLE
Produced by The University of Michigan Kidney Epidemiology and Cost Center 8/18 iii__________________________________________________________________________________
2008 Dialysis Facility ReportSAMPLE DIALYSIS CENTER State: XX Network: 99 CMS Provider#: 999999
TABLE 3: Transplantation Summary for Dialysis Patients under Age 70, 2004-2007
This FacilityRegional Averages2,per Year, 2004-2007
Measure Name iii 2004 iii 2005 iii 2006 iii 2007iii 2004-2007 iii State iii Network iii U.S.
3a Eligible patients1 (n) 33 34 35 37 1399 64.6 44.3 63.8
3b Transplants (n) 3 3 4 2 129 3.2 2.7 2.5
3c Donor type (sums to 3b3)
Living Donor (n) 1 2 0 0 3 1.2 1.1 0.8
Deceased Donor (n) 2 1 4 2 9 2.1 1.7 1.7
Patients who have not Previously Received a Transplant
3d Eligible patients1 (n) 26 26 28 32 1129 58.4 39.5 57.6
3e Patient years (PY) at risk (n) 18.7 19.1 20.2 24.7 82.79 41.0 27.2 37.2
3f 1st transplants4 (n) 3 1 2 1 79 2.8 2.3 2.2
3g Expected 1st transplants (n) 1.2 1.2 1.3 1.4 5.09 2.4 1.6 2.2
3h 1st transplant rate per 100 PY 16.0 5.2 9.9 4.1 8.5 6.8 8.6 5.9
3i Expected 1st transplant rate per 100 PY 6.2 6.2 6.2 5.7 6.1 5.8 5.8 5.8
3j Donor type (sums to 3f5)
Living Donor (n) 1 1 0 0 2 1.0 0.9 0.7
Deceased Donor (n) 2 0 2 1 5 1.8 1.5 1.5
Standardized 1st Transplantation Ratio (STR)
3k STR6 2.56 0.84 1.59 0.71 1.39 1.16 1.48 1.01
3l P-value7 0.23 0.99 0.72 0.99 0.48 n/a n/a n/a
3m 95% Confidence interval for STR8
Upper limit 7.49 4.69 5.75 3.94 2.87 n/a n/a n/a
Lower limit 0.53 0.02 0.19 0.02 0.56 n/a n/a n/a
STR Percentiles for this Facility (i.e. percent of facilities with lower transplantation rates)3n In this State 93 43 69 38 66
3o In this Network 84 32 57 26 50
3p In the U.S. 92 48 77 44 73
n/a = not applicable[1] See Guide, Section VI. [2] Values are shown for the average facility, annualized.[3] Values may not sum to 3b due to unknown donor type.[4] Among first transplants that occurred after the start of dialysis from 2004-2007, 4.3% of transplants in the U.S. were not included because the transplant
occurred less than 90 days after the start of ESRD and 0.8% were not included because the patient was not assigned to a facility at time of transplant.[5] Values may not sum to 3f due to unknown donor type.[6] Standardized Transplantation Ratio calculated as ratio of actual (3f) to expected (3g). Not shown if 3g is too small.[7] A p-value less than or equal to 0.05 indicates that the difference between the actual and expected transplants is probably real and is not due to random
chance, while a p-value greater than 0.05 indicates that the difference is plausibly due to random chance.[8] The confidence interval range represents uncertainty in the value of the STR due to random variation.[9] Sum of 4 years used for calculations; should not be compared to regional averages.
SAMPLE
SAMPLE
SAMPLE
88

SAMPLE
Produced by The University of Michigan Kidney Epidemiology and Cost Center 9/18 iii__________________________________________________________________________________
2008 Dialysis Facility ReportSAMPLE DIALYSIS CENTER State: XX Network: 99 CMS Provider#: 999999
TABLE 4: Waitlist Summary for Dialysis Patients under Age 70 Treated as of December 31st of EachYear1, 2004-2007
This Facility Regional Averages2, 2007Measure Name iii 2004 iii 2005 iii 2006 iii 2007 iii State iii Network iii U.S.
4a Eligible patients on 12/311 (n) 27 26 25 35 51.5 35.1 46.5
4b Patients on the waitlist (% of 4a) 29.6 38.5 44.0 31.4 24.9 25.5 23.7
4c P-value 3 (compared to U.S. value) 0.23 0.05 0.02 0.19 n/a n/a n/a
4d Patients on the waitlist by subgroup (% of corresponding value in 4e)
Age < 40 40.0 37.5 75.0 66.7 42.7 42.5 36.4
Age 40-69 23.5 38.9 38.1 28.1 22.1 22.7 21.6
Male 40.0 46.2 50.0 34.8 25.9 26.1 24.5
Female 16.7 30.8 36.4 25.0 23.5 24.5 22.6
African American . . . . 22.8 23.2 21.7
Asian/Pacific Islander . . . 0.0 36.4 43.6 36.0
Native American . . . . 38.3 23.8 18.6
White, Hispanic 0.0 0.0 0.0 0.0 25.8 22.8 26.4
White, Non-Hispanic 30.8 40.0 45.8 33.3 26.8 26.7 23.4
Other/unknown race . . . . 20.0 19.1 28.2
Diabetes 16.7 41.7 36.4 25.0 19.8 20.1 18.2
Non-diabetes 40.0 35.7 50.0 36.8 28.5 29.5 27.9
Previous kidney transplant 57.1 50.0 100 75.0 47.1 47.2 46.7
No previous kidney transplant 20.0 35.0 36.4 25.8 22.5 22.8 21.4
< 2 years since start of ESRD 9.1 33.3 22.2 13.3 17.5 18.6 15.8
2-4 years since start of ESRD 28.6 33.3 45.5 30.0 31.4 30.6 27.5
5+ years since start of ESRD 55.6 50.0 80.0 60.0 28.5 30.3 30.3
4e Eligible patients in 4a by subgroup (n)
Age < 40 10 8 4 3 7.0 4.8 6.5
Age 40-69 17 18 21 32 44.6 30.3 40.1
Male 15 13 14 23 29.2 20.0 26.1
Female 12 13 11 12 22.3 15.2 20.4
African American 0 0 0 0 26.6 14.0 19.5
Asian/Pacific Islander 0 0 0 1 0.7 0.9 2.1
Native American 0 0 0 0 0.3 1.4 0.8
White, Hispanic 1 1 1 1 1.5 1.3 6.8
White, Non-Hispanic 26 25 24 33 22.3 17.3 16.5
Other/unknown race 0 0 0 0 0.2 0.2 0.8
Diabetes 12 12 11 16 21.3 15.0 20.3
Non-diabetes 15 14 14 19 30.3 20.1 26.2
Previous kidney transplant 7 6 3 4 5.0 3.8 4.2
No previous kidney transplant 20 20 22 31 46.6 31.3 42.4
< 2 years since start of ESRD 11 9 9 15 21.1 14.9 18.6
2-4 years since start of ESRD 7 9 11 10 16.1 10.7 14.4
5+ years since start of ESRD 9 8 5 10 14.3 9.6 13.6
n/a = not applicable[1] See Guide, Section VII. [2] Values are shown for the average facility.[3] Facility waitlist percentage is compared to the U.S. waitlist percentage for that year: 22.1% (2004), 22.6% (2005), 23.0% (2006), 23.7% (2007).
A p-value greater than 0.05 indicates that the difference between percent of patients waitlisted at the facility and national percentage is plausibly due torandom chance.
SAMPLE
SAMPLE
SAMPLE
89

SAMPLE
Produced by The University of Michigan Kidney Epidemiology and Cost Center 10/18 iii__________________________________________________________________________________
2008 Dialysis Facility ReportSAMPLE DIALYSIS CENTER State: XX Network: 99 CMS Provider#: 999999
TABLE 5: Facility Modality, Hemoglobin, and Urea Reduction Ratio for Medicare Dialysis Patients1,2004-2007
This Facility Regional Averages2, 2007Measure Name iii 2004 iii 2005 iii 2006 iii 2007 iii State iii Network iii U.S.
Modality (among all dialysis patients with ESRD for 90+ days and 1+ claim at this facility)
5a Patients treated during year1 (n) 52 60 61 58 91.7 69.7 77.9
5b Modality (% of 5a; sums to 100%)
Hemodialysis 100 100 100 100 89.1 89.7 89.7
CAPD/CCPD 0.0 0.0 0.0 0.0 4.8 5.2 5.7
Other dialysis3 0.0 0.0 0.0 0.0 6.1 5.1 4.6
Hemoglobin (among ESA-treated dialysis patients with ESRD for 90+ days and 4+ Hemoglobin claims at this facility)
5c Eligible patients1 (n) 38 42 42 35 61.0 44.0 50.2
5d Average hemoglobin (g/dL) 12.4 12.1 12.4 12.4 12.0 11.9 11.9
5e Hemoglobin categories (% of 5c; sums to 100%)
< 10 g/dL 0.0 0.0 0.0 0.0 1.7 1.6 1.7
10-12 g/dL 21.1 35.7 26.2 25.7 47.0 54.1 54.3
> 12 g/dL 78.9 64.3 73.8 74.3 51.3 44.2 44.0
5f Hemoglobin 10-12 g/dL (% of HD pts) 21.1 35.7 26.2 25.7 46.3 53.5 53.7
Hemoglobin 10-12 g/dL (% of PD pts) . . . . 58.8 63.0 61.7
5g Hemoglobin percentiles for this facility4
In this State 8 35 11 9
In this Network 7 26 8 8
In the U.S. 6 24 10 8
Urea Reduction Ratio (URR; among HD patients with ESRD for 183+ days and 4+ URR claims at this facility)
5h Eligible patients 1(n) 34 36 37 36 56.3 40.7 46.4
5i URR categories (% of 5h; sums to 100%)
< 60.0 % 0.0 0.0 0.0 0.0 1.7 1.9 1.6
60.0-64.9 % 2.9 2.8 0.0 0.0 3.0 3.5 3.0
65.0-69.9 % 2.9 0.0 2.7 2.8 13.1 14.3 11.6
70.0-74.9 % 17.6 30.6 35.1 38.9 39.6 38.5 36.1
75+ % 76.5 66.7 62.2 58.3 42.6 41.8 47.7
5j URR 65+ (% of 5h; meets a KDOQI guideline) 97.1 97.2 100 100 95.3 94.6 95.4
5k URR percentiles for this facility5
In this State 57 52 99 99
In this Network 52 52 99 99
In the U.S. 51 55 99 99
n/a = not applicable[1] See Guide, Section VIII. [2] Counts are shown for the average facility.[3] Other dialysis includes patients who switch between HD and PD during the year and patients for whom modality is unknown.[4] Percent of facilities with a smaller percentage of patients with hemoglobin 10-12 g/dl.[5] Percent of facilities with a smaller percentage of patients with URR 65+.
SAMPLE
SAMPLE
SAMPLE
90

SAMPLE
Produced by The University of Michigan Kidney Epidemiology and Cost Center 11/18 iii__________________________________________________________________________________
2008 Dialysis Facility ReportSAMPLE DIALYSIS CENTER State: XX Network: 99 CMS Provider#: 999999
TABLE 6: Vascular Access Information1 (CMS Fistula First), 2004-2007
This Facility Regional Averages2, 2007Measure Name iii 2004 iii 2005 iii 2006 iii 2007 iii State iii Network iii U.S.
Vascular Access
6a Prevalent hemodialysis patient months3 560 573 544 641
6b Vascular access type in use (% of 6a; sums to 100%)
Arteriovenous fistula 48.6 51.7 45.6 48.8 41.7 44.3 47.0
Arteriovenous graft 26.6 27.9 30.7 33.4 31.0 24.4 24.9
Catheter 16.4 17.6 23.0 16.5 26.9 30.9 27.7
Other 0.0 0.0 0.0 0.0 0.1 0.1 0.0
Missing 8.4 2.8 0.7 1.2 0.3 0.3 0.5
6c Arteriovenous fistulae in place4 (% of 6a) 51.1 56.4 52.4 52.3 50.0 54.0 55.5
6d Catheter only > 90 days5 (% of 6a) 5.7 5.4 6.8 7.6 11.7 13.9 11.7
Vascular Access at First Treatment6e Incident hemodialysis patients (n) 20 14 17 14 19.8 15.7 17.4
6f Vascular access type in use6 (% of 6e; sums to 100%)
Arteriovenous fistula 10.0 7.1 5.9 0.0 14.3 14.9 15.7
Arteriovenous graft 15.0 28.6 11.8 7.1 6.5 4.6 4.7
Catheter 40.0 21.4 70.6 50.0 76.3 78.5 76.0
Other 0.0 0.0 0.0 0.0 0.4 0.5 0.1
Missing 35.0 42.9 11.8 42.9 2.4 1.5 3.5
6g Arteriovenous fistulae in place4 (% of 6e) 10.0 14.3 11.8 7.1 24.3 27.5 28.9
n/a = not applicable[1] See Guide, Section IX. [2] Values are shown for the average facility.[3] Patients may be counted up to 12 times per year.[4] Includes all patients with fistulae, regardless of whether or not they received their hemodialysis treatments using their fistulae.[5] Catheter was used for treatment and has been in place for 90 days or more prior to treatment. Patient does not have an fistula or graft in place. Catheter is
only access. Port access devices are reported as catheters for this project.[6] Patients listed as graft or catheter may have had fistulae in place for future use, but they actually received their treatment through a graft or catheter.
SAMPLE
SAMPLE
SAMPLE
91

SAMPLE
Produced by The University of Michigan Kidney Epidemiology and Cost Center 12/18 iii__________________________________________________________________________________
2008 Dialysis Facility ReportSAMPLE DIALYSIS CENTER State: XX Network: 99 CMS Provider#: 999999
TABLE 7: Characteristics of New Dialysis Patients1, 2004-2007 (Form CMS-2728)
This Facility Regional Averages2, 2007Measure Name iii 2004 iii 2005 iii 2006 iii 2007 iii State iii Network iii U.S.
Patient Characteristics3
7a Total number of patients with forms (n) 20 9 17 16 32.7 29.8 31.0
7b Average age (years [0-95]) 64.6 70.1 67.7 63.8 63.4 64.4 63.2
7c Female (% of 7a) 35.0 44.4 29.4 37.5 45.0 44.1 44.6
7d Race4 (% of 7a; sums to 100%)
African-American 0.0 0.0 0.0 0.0 35.3 23.5 28.6
Asian/Pacific Islander 0.0 0.0 0.0 6.3 1.1 2.0 4.1
Native American 0.0 0.0 0.0 0.0 0.5 2.5 1.0
White 100 100 100 93.8 62.7 71.5 65.9
Other/Unknown/Missing 0.0 0.0 0.0 0.0 0.3 0.5 0.4
7e Hispanic (% of 7a) 0.0 0.0 0.0 0.0 2.1 2.7 13.0
7f Primary cause of ESRD (% of 7a; sums to 100%)
Diabetes 35.0 33.3 29.4 50.0 42.7 41.1 45.1
Hypertension 40.0 55.6 29.4 12.5 29.2 27.8 28.4
Primary Glomerulonephritis 10.0 0.0 5.9 6.3 6.5 7.5 6.6
Other/Missing 15.0 11.1 35.3 31.3 21.5 23.6 20.0
7g Medical coverage (% of 7a; sums to 100%)
Employer group only 0.0 22.2 0.0 18.8 19.8 17.3 16.4
Medicare only 5.0 0.0 0.0 6.3 13.2 13.8 19.5
Medicaid only 10.0 11.1 0.0 6.3 10.8 10.2 11.2
Medicare and Medicaid only 0.0 11.1 17.6 12.5 11.1 10.2 12.5
Medicare and Other 60.0 55.6 70.6 56.3 35.7 38.2 24.7
Other/Unknown 25.0 0.0 5.9 0.0 4.5 6.4 8.4
None 0.0 0.0 5.9 0.0 4.8 4.0 7.2
7h Body Mass Index5
Male 25.4 28.5 25.0 26.6 27.0 26.8 26.4
Female 28.4 34.3 24.1 25.8 28.2 28.3 27.8
7i Employment6
Six months prior to ESRD treatment 0.0 . 50.0 16.7 33.3 38.6 36.5
At first ESRD treatment . 100 16.7 16.7 18.0 22.5 22.4
7j Primary modality7 (% of 7a; sums to 100%)
Hemodialysis . . 100 100 93.8 93.7 93.7
CAPD/CCPD . . 0.0 0.0 6.2 6.3 6.3
Other/Unknown/Missing . . 0.0 0.0 0.0 0.0 0.0
7k Number of incident hemodialysis patients7 (n) . . 17 16 30.7 27.8 28.9
7l Access used at first outpatient dialysis7 (% of 7k; sums to 100%)
Arteriovenous fistula . . 11.8 0.0 12.8 14.0 13.7
Arteriovenous graft . . 5.9 6.3 3.9 3.5 3.8
Catheter . . 82.4 93.8 83.2 82.4 81.7
Other/Unknown/Missing . . 0.0 0.0 0.0 0.0 0.9
7m Arteriovenous fistulae placed (% of 7k) . . 23.5 31.3 24.9 28.3 30.0
Average Lab Values Prior to Dialysis3
7n Hemoglobin (g/dL [3-18]) 10.2 11.2 11.0 9.9 10.0 10.2 10.1
7o Serum Albumin (g/dL [0.8-6.0]) 3.1 3.2 3.4 2.8 3.2 3.2 3.1
SAMPLE
SAMPLE
SAMPLE
92

SAMPLE
Produced by The University of Michigan Kidney Epidemiology and Cost Center 13/18 iii__________________________________________________________________________________
2008 Dialysis Facility ReportSAMPLE DIALYSIS CENTER State: XX Network: 99 CMS Provider#: 999999
TABLE 7 (cont): Characteristics of New Dialysis Patients1, 2004-2007 (Form CMS-2728)
This Facility Regional Averages2, 2007Measure Name iii 2004 iii 2005 iii 2006 iii 2007 iii State iii Network iii U.S.
Average Lab Values Prior to Dialysis3
7p Serum Creatinine (mg/dL [2-33]) 6.4 4.7 5.8 5.9 6.0 5.9 6.4
7q GFR (mL/min [0-60]) 9.1 12.4 11.7 10.7 11.5 11.5 10.8
Care Prior to ESRD Therapy7r Received ESA prior to ESRD (% of 7a) 20.0 55.6 23.5 56.3 29.3 32.9 29.4
7s Pre-ESRD nephrologist care7 (% of 7a; sums to 100%)
No . . 58.8 31.3 34.1 32.8 31.0
Yes, < 6 months . . 0.0 0.0 5.2 5.5 10.6
Yes, 6-12 months . . 29.4 50.0 21.7 22.5 23.2
Yes, > 12 months . . 11.8 18.8 30.8 32.7 23.5
Unknown . . 0.0 0.0 8.3 6.4 11.7
7t Informed of transplant options7 (% of 7a) . . 76.5 93.8 70.4 71.1 70.8
7u Patients not informed of transplant options7 (n) . . 4 1 9.2 8.4 9.6
7v Reason not informed7 (% of 7u; may not sum to 100%)
Medically unfit . . 25.0 0.0 38.1 41.4 31.3
Unsuitable due to age . . 0.0 100 40.1 36.6 24.3
Psychologically unfit . . 0.0 0.0 3.4 3.1 2.6
Patient declined information . . 25.0 0.0 2.3 2.0 1.5
Patient has not been assessed . . 25.0 0.0 30.1 28.8 45.3
Comorbid Conditions7w Pre-existing Comorbidity (% yes of 7a)
Congestive heart failure 20.0 55.6 29.4 43.8 39.4 37.1 32.6
Atherosclerotic heart disease8 50.0 44.4 47.1 25.0 25.3 27.3 21.6
Other cardiac disorder8 5.0 11.1 0.0 18.8 18.8 17.7 16.2
CVD, CVA, TIA 5.0 11.1 5.9 0.0 9.9 10.1 9.5
Peripheral vascular disease 30.0 0.0 11.8 18.8 14.7 16.4 14.3
History of hypertension 80.0 88.9 82.4 93.8 86.2 85.1 84.2
Diabetes8 45.0 66.7 41.2 68.8 56.6 55.4 57.4
Diabetes on insulin 5.0 0.0 23.5 43.8 38.8 37.2 35.3
COPD 10.0 0.0 11.8 6.3 12.1 11.6 9.0
Current smoker 5.0 0.0 0.0 12.5 9.0 8.2 6.4
Cancer 0.0 0.0 5.9 0.0 10.3 10.5 7.3
Alcohol dependence 0.0 0.0 0.0 0.0 2.2 2.3 1.5
Drug dependence 0.0 0.0 0.0 0.0 2.2 1.8 1.4
Inability to ambulate 15.0 0.0 0.0 0.0 7.3 6.4 6.8
Inability to transfer 5.0 0.0 0.0 0.0 3.9 3.1 3.3
7x Average number of comorbid conditions 2.8 2.8 2.6 3.3 3.4 3.3 3.1
n/a= not applicable[1] See Guide, Section X. [2] Values are shown for the average facility.[3] For continuous variables, summaries include only responses in range indicated in brackets.[4] 'Asian' includes Indian sub-continent. 'Native American' includes Alaskan Native. 'White' includes Middle Eastern and Arabian.[5] The median BMI is computed for adult patients at least 20 years old.[6] Full-time, part-time, or student (% of 18-60 year olds).[7] Data collection for these items began mid-year 2005. Summaries for these items shown starting in 2006.[8] 'AHD' includes ischemic heart disease (coronary artery disease) and myocardial infarction. 'Other cardiac disorder' includes cardiac arrest, cardiac
dysrhythmia, and pericarditis. 'Diabetes' includes patients with diabetes as the primary cause of ESRD.
SAMPLE
SAMPLE
SAMPLE
93

SAMPLE
Produced by The University of Michigan Kidney Epidemiology and Cost Center 14/18 iii__________________________________________________________________________________
2008 Dialysis Facility ReportSAMPLE DIALYSIS CENTER State: XX Network: 99 CMS Provider#: 999999
TABLE 8: Summaries for All Dialysis Patients Treated as of December 31 of Each Year1, 2004-2007
This Facility Regional Averages2, 2007Measure Name iii 2004 iii 2005 iii 2006 iii 2007 iii State iii Network iii U.S.
8a Patients treated on 12/31 (n) 40 46 45 45 72.9 53.2 65.5
8b Average age (years) 56.7 60.2 63.2 60.5 61.5 62.7 60.9
8c Age (% of 8a; sums to 100%)
< 20 0.0 2.2 0.0 0.0 0.5 0.5 0.6
20-64 52.5 45.7 46.7 62.2 54.9 50.8 56.1
65+ 47.5 52.2 53.3 37.8 44.6 48.7 43.3
8d Female (% of 8a) 42.5 39.1 33.3 31.1 45.7 45.2 45.6
8e Race (% of 8a; sums to 100%)
African American 0.0 0.0 0.0 0.0 45.6 32.6 37.4
Asian/Pacific Islander 0.0 0.0 0.0 2.2 1.3 2.2 4.7
Native American 0.0 0.0 0.0 0.0 0.5 3.1 1.5
White 100 100 100 97.8 52.3 61.5 54.9
Other/Unknown/Missing 0.0 0.0 0.0 0.0 0.3 0.5 1.4
8f Ethnicity (% of 8a; sums to 100%)
Hispanic 2.5 2.2 2.2 2.2 2.9 3.4 15.0
Non-Hispanic 95.0 95.7 97.8 97.8 95.1 94.9 82.5
Unknown 2.5 2.2 0.0 0.0 1.9 1.6 2.5
8g Cause of ESRD (% of 8a; sums to 100%)
Diabetes 32.5 34.8 33.3 37.8 41.0 41.4 43.4
Hypertension 25.0 28.3 33.3 26.7 29.9 27.0 27.5
Glomerulonephritis 12.5 6.5 8.9 8.9 9.9 10.6 10.4
Other/Unknown 27.5 30.4 24.4 26.7 16.5 18.5 17.5
Missing 2.5 0.0 0.0 0.0 2.6 2.4 1.2
8h Average duration of ESRD (years) 4.8 4.6 3.4 3.8 4.2 4.1 4.2
8i Years since start of ESRD (% of 8a; sums to 100%)
< 1 27.5 17.4 24.4 20.0 18.9 19.5 18.6
1-2 20.0 26.1 17.8 26.7 19.7 20.7 19.4
2-3 12.5 15.2 24.4 8.9 15.6 15.3 14.6
3-6 22.5 23.9 20.0 31.1 25.5 25.1 25.7
6+ 17.5 17.4 13.3 13.3 20.3 19.5 21.7
8j Nursing home patients3 (% of 8a) 5.0 19.6 11.1 4.4 13.1 15.7 13.2
8k Modality (% of 8a; sums to 100%)
In-center hemodialysis 100 100 100 100 91.1 90.9 90.7
In-center self hemodialysis 0.0 0.0 0.0 0.0 0.0 0.0 0.0
Home hemodialysis 0.0 0.0 0.0 0.0 1.2 1.1 0.9
Continuous ambulatory peritoneal dialysis 0.0 0.0 0.0 0.0 3.7 3.5 2.5
Continuous cycling peritoneal dialysis 0.0 0.0 0.0 0.0 3.6 4.1 5.5
Other modality4 0.0 0.0 0.0 0.0 0.4 0.4 0.4
n/a = not applicable[1] See Guide, Section XI. [2] Values are shown for the average facility.[3] Includes patients who were also treated by a nursing facility at any time during the year. The source of nursing facility history of patients is the Nursing
Home Minimum Dataset.[4] Other modality includes other dialysis, uncertain modality, and patients not on dialysis but still temporarily assigned to the facility (discontinued dialysis,
recovered renal function, and lost to follow up).
SAMPLE
SAMPLE
SAMPLE
94

SAMPLE
Produced by The University of Michigan Kidney Epidemiology and Cost Center 15/18 iii__________________________________________________________________________________
2008 Dialysis Facility ReportSAMPLE DIALYSIS CENTER State: XX Network: 99 CMS Provider#: 999999
TABLE 9: Comorbidities Reported on Medicare Claims for Medicare Dialysis Patients Treated as ofDecember 31 of Each Year1, 2004-2006
This Facility Regional Averages2, 2006Measure Name iii 2004 iii 2005 iii 2006 iii State iii Network iii U.S.
9a Medicare dialysis patients on 12/31 (n) 31 36 37 53.6 37.1 42.6
9b Comorbidity (% yes of 9a)
AIDS/HIV positive 0.0 0.0 0.0 1.1 0.9 1.8
Alcohol dependence 0.0 0.0 0.0 2.5 2.8 2.2
Anemia 12.9 11.1 2.7 11.0 9.3 8.8
Cancer 16.1 13.9 10.8 12.1 11.9 10.8
Cardiac arrest 3.2 2.8 0.0 1.2 1.2 1.4
Cardiac dysrhythmia 35.5 52.8 29.7 44.3 41.5 34.4
Cerebrovascular disease 22.6 41.7 18.9 31.8 28.0 27.1
Chronic obstructive pulmonary disease 41.9 52.8 37.8 36.0 33.3 29.4
Congestive heart failure 41.9 55.6 37.8 57.9 54.4 51.7
Diabetes 54.8 61.1 64.9 62.9 61.5 61.2
Drug dependence 0.0 0.0 2.7 2.1 2.3 1.8
Gastrointestinal tract bleeding 9.7 2.8 8.1 3.3 3.3 3.0
Hepatitis B 0.0 2.8 0.0 1.5 1.2 1.2
Hepatitis other 3.2 2.8 2.7 3.9 3.2 3.7
Hyperparathyroidism 6.5 0.0 2.7 7.8 12.6 8.7
Infection 61.3 61.1 54.1 57.4 52.1 51.5
Ischemic heart disease 45.2 66.7 51.4 59.9 56.6 51.1
Myocardial infarction 6.5 13.9 8.1 11.9 9.8 8.4
Peripheral vascular disease3 58.1 61.1 54.1 51.4 48.7 46.7
Pneumonia 6.5 13.9 10.8 4.8 4.4 5.0
9c Average number of comorbid conditions 4.3 5.2 4.0 4.6 4.4 4.1
n/a = not applicable[1] Based on patients with Medicare as primary insurer on 12/31 each year. See Guide, Section XII.[2] Values are shown for the average facility.[3] Peripheral vascular disease includes both venous and arterial diseases.SAM
PLE
SAMPLE
SAMPLE
95

SAMPLE
Produced by The University of Michigan Kidney Epidemiology and Cost Center 16/18 iii__________________________________________________________________________________
2008 Dialysis Facility ReportSAMPLE DIALYSIS CENTER State: XX Network: 99 CMS Provider#: 999999
TABLE 10: How Patients Were Assigned to This Facility and End of Year Patient Status1, 2004-2007
This Facility Regional Averages2, 2007Measure Name iii 2004 iii 2005 iii 2006 iii 2007 iii State iii Network iii U.S.
10a Number of patients placed in facility1 (n) 56 62 65 61 104.3 76.6 92.2
10b Initial patient placement for the year in this facility
(% of 10a; sums to 100%)
Continuing at facility on 01/01 73.2 64.5 70.8 73.8 68.4 67.2 68.2
Incident (new to ESRD) 25.0 22.6 23.1 21.3 20.3 21.3 20.4
Transferred into facility 1.8 12.9 6.2 4.9 11.3 11.4 11.4
10c Patient status at end of year (% of 10a; sums to 100%)
Alive in this facility on 12/31 71.4 74.2 69.2 73.8 69.9 69.4 71.1
Alive in another facility on 12/31 0.0 4.8 6.2 3.3 8.3 8.0 8.0
Received a transplant 5.4 4.8 7.7 4.9 3.1 3.7 2.9
Died; death attributed to this facility 21.4 12.9 15.4 14.8 15.1 15.3 14.5
Died; death attributed to another facility 0.0 1.6 0.0 0.0 1.4 1.4 1.5
Other3 1.8 1.6 1.5 3.3 2.2 2.3 2.0
[1] Patient assignment for Tables 1,2,3,8, and 9 only. See Guide, Section XIII. [2] Values are shown for the average facility.[3] Includes patients who recovered renal function, discontinued dialysis, or were lost to follow-up. Also includes dialysis unrelated deaths. Dialysis
unrelated deaths are not attributed to any facility for the purposes of the mortality calculations in this report.
SAMPLE
SAMPLE
SAMPLE
96

SAMPLE
Produced by The University of Michigan Kidney Epidemiology and Cost Center 17/18 iii__________________________________________________________________________________
2008 Dialysis Facility ReportSAMPLE DIALYSIS CENTER State: XX Network: 99 CMS Provider#: 999999
TABLE 11: Patient and Staff Counts from the Annual Facility Survey (Form CMS-2744)1, 2004-2007
This Facility Regional Averages2, 2007Measure Name iii 2004 iii 2005 iii 2006 iii 2007 iii State iii Network iii U.S.
Patients Treated During the Year11a Patients treated during year (n) 66 67 73 70 113.9 84.7 100.5
11b Incident patients (% of 11a) 28.8 16.4 21.9 24.3 19.8 20.5 20.0
11c Transferred into facility (% of 11a) 7.6 16.4 11.0 8.6 14.0 14.3 13.7
11d Transferred out of facility (% of 11a) 6.1 13.4 9.6 10.0 14.2 14.6 14.1
Patients Treated as of 12/3111e Patients treated as of 12/31 (n) 45 47 46 48 75.3 55.1 67.3
11f Patient modality as of 12/31 (n; sums to 11e)
In-center HD 45 47 46 48 69.0 50.3 61.4
In-center CAPD 0 0 0 0 0.0 0.0 0.0
In-center CCPD 0 0 0 0 0.0 0.0 0.0
In-center Other 0 0 0 0 0.0 0.0 0.0
Home HD 0 0 0 0 0.9 0.7 0.6
Home CAPD 0 0 0 0 3.3 2.2 1.9
Home CCPD 0 0 0 0 2.1 1.9 3.4
Home Other 0 0 0 0 0.0 0.0 0.0
11g Medicare eligibility status as of 12/31 (% of 11e; sums to 100%)
Medicare 93.3 93.6 93.5 93.8 86.8 87.3 87.4
Medicare application pending 6.7 6.4 6.5 6.3 10.3 9.1 8.1
Non-Medicare 0.0 0.0 0.0 0.0 2.9 3.6 4.5
Facility Staffing as of 12/313
11h Total full and part time staff positions (n) 9 8 10 0 7.6 8.7 12.6
11i Staff positions by type (n; sums to 11h)
Full time nurse4 3 3 3 0 2.1 2.6 4.1
Full time patient care technician 4 3 5 0 3.4 2.7 4.8
Full time renal dietician 0 0 0 0 0.3 0.2 0.4
Full time social worker 0 0 0 0 0.3 0.3 0.5
Part time nurse4 0 0 0 0 0.4 1.1 1.0
Part time patient care technician 0 0 0 0 0.5 0.8 0.8
Part time renal dietician 1 1 1 0 0.3 0.5 0.5
Part time social worker 1 1 1 0 0.3 0.5 0.5
[1] See Guide, Section XIV. [2] Values are shown for the average facility.[3] A full time position is defined as a position with at least 32 hours of employment a week and a part time position is defined as a position with less than 32hours of employment a week (includes positions that were opened but not filled on this date).[4] Nursing staff includes registered nurse, licensed practical nurse, vocational nurse, or advanced practical nurse degree.
SAMPLE
SAMPLE
SAMPLE
97
SAMPLE
Produced by The University of Michigan Kidney Epidemiology and Cost Center 18/18 iii__________________________________________________________________________________
2008 Dialysis Facility ReportSAMPLE DIALYSIS CENTER State: XX Network: 99 CMS Provider#: 999999
TABLE 12: Survey and Certification Activity 1, January 2004-June 2008
This FacilityRegional Averages2,Jan 2004-June 2008
Measure Name Survey iii State iii Network iii U.S.12a Date of last survey 05/17/2007 n/a n/a n/a
12b Type of last survey RECERTIFICATION n/a n/a n/a
12c Compliance condition after last survey Acceptable plan of correction n/a n/a n/a
12d Number of deficiencies cited at last survey3
Condition for coverage (CfC) deficiencies 0 0.1 0.1 0.2
Standard deficiencies 3 2.2 4.0 4.5
12e CfC deficiencies cited at last survey3
V100 Compliance with Fed., State, and local No, not cited 0.0 0.5 0.3
V110 Governing body and management No, not cited 3.9 2.7 7.7
V185 Long term program and care plan No, not cited 2.0 1.1 2.5
V215 Patient rights and responsibilities No, not cited 0.0 0.0 0.4
V230 Medical records No, not cited 0.0 0.0 1.1
V255 Physical environment No, not cited 1.3 2.2 5.0
V300 Reuse No, not cited 0.7 0.3 1.2
V410 Affiliation agreement-arrangement No, not cited 0.0 0.3 0.2
V420 Director of a renal dialysis facility No, not cited 0.7 1.4 2.6
V430 Staff of a renal dialysis facility No, not cited 0.0 0.0 1.5
V440 Minimal service requirements No, not cited 0.0 0.0 1.2
[1] See Guide, Section XV. [2] Average values are shown for the latest survey at each facility during the period January 2004 through June 2008. Some surveys from April through June
of 2008 may not be included.[3] Values are shown for this facility only if the most recent survey was in 2004 or later.
TABLE 13: Facility Information 1, 2008
Ownership: For Profit
Organization: SAMPLE DIALYSIS CENTER
Initial Medicare certification date: 08/07/1997
Number of stations: 12
Services provided: Hemodialysis
Provider numbers included in this report:999999
[1] Information based on SIMS data as of March 31, 2008. See Guide, Section XVI.
SAMPLE
SAMPLE
SAMPLE
98

315 West Huron Street , Su i te 240 Ann Arbor , MI 48103 (p) 734.998.9823 ( f ) 734 .998.6620 [email protected] www.sph.umich.edu/kecc
Guide to the 2008 Dialysis Facility Reports:
Overview, Methodology, and Interpretation
July 2008
99

Guide to the 2008 Dialysis Facility Reports July 2008
Produced by The University of Michigan Kidney Epidemiology and Cost Center i
Guide to the 2008 Dialysis Facility Reports for Dialysis Patients: Overview, Methodology, and Interpretation
Table of Contents
I. PURPOSE OF THIS GUIDE AND THE DIALYSIS FACILITY REPORTS................1 “What’s New” ...........................................................................................................................1
II. OVERVIEW....................................................................................................................1
III. ASSIGNING PATIENTS TO FACILITIES .................................................................3 General Inclusion Criteria for Dialysis Patients.......................................................................3 Identifying Patients Treated at Each Facility (see also Section XIII) .......................................3
IV. MORTALITY SUMMARY FOR ALL DIALYSIS PATIENTS, 2004-2007 ..............4 Patients (1a) ..............................................................................................................................5 Patient Years at Risk (1b) ..........................................................................................................5 Deaths (1c) ................................................................................................................................5 Expected Deaths (1d).................................................................................................................6 Death Rate per 100 Patient Years (1e)......................................................................................6 Expected Death Rate per 100 Patient Years (1f).......................................................................6 Categories of Death (1g, 1h, 1i) ................................................................................................6 Standardized Mortality Ratio (SMR) (1j) ..................................................................................7 P-value (1k) ...............................................................................................................................8 Confidence Interval for SMR (1l) ..............................................................................................8 SMR Percentiles for This Facility (1m, 1n, 1o) .........................................................................9
V. HOSPITALIZATION SUMMARY FOR MEDICARE DIALYSIS PATIENTS, 2004-2006......................................................................................................................................9
Medicare Dialysis Patients (2a) ..............................................................................................11 Patient Years at Risk (2b) ........................................................................................................11 Total Days Hospitalized (2c) ...................................................................................................11 Expected Total Days Hospitalized (2d) ...................................................................................11 Observed Hospitalized Day Rate (2e) .....................................................................................11 Expected Hospitalized Day Rate (2f).......................................................................................12 Standardized Total Days Hospitalized Ratio (2g) ...................................................................12 Patient Years at Risk for Total Admissions (2h)......................................................................12 Total Admissions (2i)...............................................................................................................12 Expected Total Admissions (2j) ...............................................................................................12 Observed Admission Rate (2k).................................................................................................13 Expected Admission Rate (2l)..................................................................................................13 Standardized Total Admission Ratio (2m)...............................................................................13 Diagnoses Present at Admission (2n-r) ...................................................................................13 One Day Admissions (2s).........................................................................................................13 Average Length of Stay (2t) .....................................................................................................14
VI. TRANSPLANTATION SUMMARY FOR DIALYSIS PATIENTS UNDER AGE 70, 2004-2007 ..........................................................................................................................14
Eligible Patients (3a)...............................................................................................................14 Transplants (3b) ......................................................................................................................14
100

Guide to the 2008 Dialysis Facility Reports July 2008
Produced by The University of Michigan Kidney Epidemiology and Cost Center ii
Donor Type (3c).......................................................................................................................14 Eligible Patients (3d)...............................................................................................................14 Patient Years at Risk (3e) ........................................................................................................15 Actual First Transplants (3f) ...................................................................................................15 Expected First Transplants (3g) ..............................................................................................15 First Transplant Rate per 100 Patient Years (3h) ...................................................................15 Expected First Transplant Rate per 100 Patient Years at Risk (3i) ........................................15 Donor Type (3j) .......................................................................................................................16 Standardized Transplantation Ratio (3k) ................................................................................16 P-value (3l) ..............................................................................................................................16 Confidence Intervals for STR (3m) ..........................................................................................16 STR Percentile for This Facility (3n, 3o, 3p)...........................................................................17
VII. WAITLIST SUMMARY FOR DIALYSIS PATIENTS UNDER AGE 70 TREATED AS OF DECEMBER 31 OF EACH YEAR, 2004-2007 ...................................................17
Eligible Patients on 12/31 (4a)................................................................................................17 Patients on the Waitlist (4b) ....................................................................................................17 P-value (4c) .............................................................................................................................17 Patient Characteristics (4d-4e) ...............................................................................................18
VIII. FACILITY MODALITY, HEMOGLOBIN, AND UREA REDUCTION RATIO, 2004-2007 ..........................................................................................................................18
Modality (5a, 5b) .....................................................................................................................18 Hemoglobin(5c-5g)..................................................................................................................18 Urea Reduction Ratio (5h-5k) .................................................................................................19
IX. VASCULAR ACCESS INFORMATION (CMS FISTULA FIRST), 2004-2007 ......19 Prevalent hemodialysis patient months (6a)............................................................................19 Vascular access type in use (6b)..............................................................................................20 Arteriovenous Fistulae placed (AV) (6c) .................................................................................20 Catheter only ≥ 90 days (6d) ...................................................................................................20 Incident hemodialysis patients (6e) .........................................................................................20 Vascular access type in use (6f)...............................................................................................20 Arteriovenous Fistulae placed (AV) (6g).................................................................................21
X. CHARACTERISTICS OF NEW DIALYSIS PATIENTS, 2004-2007 (FORM CMS-2728) ..................................................................................................................................21
Patient Characteristics (7a-7m) ..............................................................................................21 Average Lab Values Prior to Dialysis (7n-7q) ........................................................................21 Nephrologist Care Prior to Start of ESRD Therapy (7r-7s)....................................................21 Kidney Transplant Options (7t-7v)..........................................................................................22 Comorbid Conditions (7w-7x) .................................................................................................22
XI. SUMMARIES FOR ALL DIALYSIS PATIENTS TREATED AS OF DECEMBER 31 OF EACH YEAR, 2004-2007 ......................................................................................22
Patients Treated on 12/31 of Year (8a) ...................................................................................22 Age (8b, 8c)..............................................................................................................................22 Female (8d)..............................................................................................................................22 Race (8e)..................................................................................................................................22 Ethnicity (8f) ............................................................................................................................23
101

Guide to the 2008 Dialysis Facility Reports July 2008
Produced by The University of Michigan Kidney Epidemiology and Cost Center iii
Cause of ESRD (8g).................................................................................................................23 Duration of ESRD (8h, 8i) .......................................................................................................23 Nursing facility patients (8j)....................................................................................................23 Modality (8k) ...........................................................................................................................23
XII. COMORBIDITIES REPORTED ON MEDICARE CLAIMS FOR MEDICARE DIALYSIS PATIENTS TREATED AS OF DECEMBER 31 OF EACH YEAR, 2004-2006....................................................................................................................................23
Patients Treated on 12/31 of Year (9a) ...................................................................................24 Comorbid Conditions (9b).......................................................................................................24 Average Number of Comorbid Conditions (9c).......................................................................24
XIII. HOW PATIENTS WERE ASSIGNED TO THIS FACILITY AND END OF YEAR PATIENT STATUS, 2004-2007 .......................................................................................24
Number of Patients Placed in Facility (10a) ...........................................................................25 Initial Patient Placement for the Year in This Facility (10b) ..................................................25 Patient Status at End of Year (10c) .........................................................................................25
XIV. PATIENT AND STAFF COUNTS FROM ANNUAL FACILITY SURVEY (FORM CMS 2744), 2004-2007........................................................................................25
Patients Treated during the Year (11a-11d)............................................................................25 Patients Treated as of 12/31 (11e-11g) ...................................................................................25 Staffing (11h-11i).....................................................................................................................26
XV. SURVEY AND CERTIFICATION ACTIVITY, 2008 .............................................26 Date and type of last survey (12a, 12b)...................................................................................26 Compliance condition after last survey (12c)..........................................................................26 Deficiencies cited at last survey (12d, 12e) .............................................................................26
XVI. FACILITY INFORMATION, 2008 .........................................................................26
XVII. PLEASE GIVE US YOUR COMMENTS..............................................................27
REFERENCES ..................................................................................................................28
102

Guide to the 2008 Dialysis Facility Reports July 2008
Produced by The University of Michigan Kidney Epidemiology and Cost Center Page 1 of 29
I. Purpose of this Guide and the Dialysis Facility Reports This guide explains in detail the contents of the Dialysis Facility Reports that were prepared for each dialysis facility under contract to the Centers for Medicare & Medicaid Services. Included here are the reports’ objectives, discussions of methodological issues relevant to particular sections of each report (e.g., mortality, hospitalization, and transplantation) and descriptions of each data summary. In the interest of stimulating quality improvement efforts and facilitating the quality improvement process, the Dialysis Facility Reports make information available to those of you involved in dialysis care and the assurance of its quality. This report allows you to compare the characteristics of your facility’s patients, patterns of treatment, and patterns in transplantation, hospitalization, and mortality to local and national averages. Such comparisons help you to evaluate patient outcomes and to account for important differences in the patient mix — including age, sex, race, and patients’ diabetic status —which in turn enhances each facility’s understanding of the clinical experience relative to other facilities in the state, Network, and nation.
“What’s New” Improvements to the 2008 DFR: A new section on the number of days patients spend in the hospital is now reported with the admission statistics in Table 2. The percent of patients experiencing a hospitalization with congestive heart failure, cardiac dysrhythmia, and cardiac arrest have also been added. A section on all transplants after day 90 of ESRD is now reported along with the first transplantation summary statistics in Table 3. The number of patients who received transplants from a living donor has also been added. Table 5 of the DFR now reports the percent of ESA-treated patients in the facility with hemoglobin values of <10, 10-12 and >12 g/dl.
II. Overview The University of Michigan Kidney Epidemiology and Cost Center (UM-KECC) has produced the 2008 Dialysis Facility Reports with funding from the Centers for Medicare & Medicaid Services (CMS). The UM-KECC sends the reports to each ESRD Network Office, which in turn sends them to personnel at each dialysis facility. Your Facility Director may of course share these results with others. Those state agencies which are responsible for certifying dialysis facilities also receive the reports. Each report provides summary data on each facility’s dialysis patients for the years 2004-2007. We compiled these summaries using the UM-KECC ESRD patient database, which is largely derived from the CMS Program Medical Management and Information System (PMMIS/REMIS), the Standard Information Management System (SIMS) database maintained by the 18 ESRD Networks, the National Vascular Access Improvement Initiative’s Fistula First project, the CMS Annual Facility Survey (Form CMS-2744), Medicare dialysis and hospital payment records, the CMS Medical Evidence Form (Form
103

Guide to the 2008 Dialysis Facility Reports July 2008
Produced by The University of Michigan Kidney Epidemiology and Cost Center Page 2 of 29
CMS-2728), transplant data from the Organ Procurement and Transplant Network (OPTN), the Death Notification Form (Form CMS-2746), the Nursing Home Minimum Dataset, the Online Survey Certification and Reporting (OSCAR) system, and the Social Security Death Master File. The database is comprehensive for Medicare patients. Non-Medicare patients are included in all sources except for the Medicare payment records. SIMS provides tracking by dialysis provider and treatment modality for non-Medicare patients. This year we provided reports to the ESRD Networks for more than 5000 Medicare-approved dialysis facilities in the United States. We did not send reports to transplant-only facilities or Veterans Administration facilities. We have suppressed information about the Standardized Mortality Ratio (SMR) and its components for facilities with either less than one expected death for any given year, or fewer than three expected deaths for the four-year period. Statistics produced for such a small group of patients can be unstable and particularly subject to random variation, and thus difficult to interpret. Similarly, we suppressed information about the Standardized Transplantation Ratio and its components, for facilities with either less than one expected transplant for any given year, or fewer than three expected events for the four-year period. This is the thirteenth in this series of individualized reports. We welcome your participation and feedback concerning the clarity, utility, limitations, and accuracy of this report. You will find information on how to directly provide feedback to us at the UM-KECC in Section XVII. This guide discusses the meaning of the data summaries each report provides, and describes the methodology used to calculate each summary (Sections III-XVI). Sections III-XVI are organized according to the order of the summaries in the Dialysis Facility Report, and may serve as references for their interpretation. Since in many cases, understanding a particular section’s contents requires you to understand the issues presented in the previous section, we recommend that you review Sections III-XVI in order. The report starts with five pages of text highlights for your facility, followed by thirteen tables each with detailed information for your facility. To provide more stable estimates of patient outcomes, we combined mortality information (Table 1) over a four-year period, 2004-2007. Similarly, we combined hospitalization information (Table 2) over a three-year period, 2004-2006, and transplant information (Table 3) over a four-year period, 2004-2007. The separate estimates provided for each year allow you to evaluate time trends. Note that for the three- and four-year summaries, individual patients typically contribute data for more than one year. We document self-reported vascular access (Table 6) for 2004-2007. Comorbidities as they are reported on Medicare claims for 2004-2006, as well as regional averages for 2006 are reported in Table 9. Table 11 reports Annual Facility Survey information for 2004-2007. Table 12 reports information about the last survey at this facility as well as information about deficiencies cited at the last state survey. Table 13 reports general information about your facility as of March 31, 2008. The remaining tables (4, 5, 7, 8, and 10) report patient characteristics and practice
104

Guide to the 2008 Dialysis Facility Reports July 2008
Produced by The University of Michigan Kidney Epidemiology and Cost Center Page 3 of 29
patterns for your facility each year from 2004-2007, as well as regional averages for 2007 for comparison. Each row of a table in the report summarizes an item. Your facility has a column for each time period, and in most cases, three columns for the corresponding geographical summaries, including averages for your facility’s state, its ESRD Network, and the entire nation. Whenever the statistic reported was a count (n), we calculated regional and national averages by taking the average count for all facilities in that area. When the statistic reported for a period included more than one year, we annualized regional and national values to make them comparable to a single-year period. When a statistic was a percent, rate, or ratio, we calculated regional and national summaries by pooling together all individual patients in that area to obtain an estimate for that area as if it were one large facility. We do not report state summary data for dialysis facilities in states or U.S. territories with only one or two dialysis units, with the exception of Annual Facility Survey data, which is public information. We do provide summaries for the geographic aggregate of the ESRD Network and the nation for facilities in these states or territories.
III. Assigning Patients to Facilities This section describes the methods we used to assign patients to a facility in order to calculate the summaries appearing in Tables 1-3 and 8-10. The sections on the other tables describe the other tables’ methods for identifying patients. Because some patients receive dialysis treatment at more than one facility in a given year, we use standard methods based on assigning person-years to a facility, rather than on assigning a patient’s entire follow-up to a facility. We developed conventions which define the group of patients assigned to a facility at any time during the particular year. This method is described below.
General Inclusion Criteria for Dialysis Patients A patient’s follow-up in the database can be incomplete during the first 90 days of ESRD therapy. For the purposes of this report, we only entered a patient’s follow-up into the tabulations after that patient had received chronic renal replacement therapy for at least 90 days. This minimum 90-day period assures that most patients are eligible for Medicare insurance either as their primary or secondary insurer. It also excludes from analysis patients who died during the first 90 days of ESRD, since such patients have incomplete data. In order to exclude patients who only received temporary dialysis therapy, we assigned patients to a facility only after they had been on dialysis there for at least 60 days. This 60 day period is used both for patients starting renal replacement therapy for the first time and for those who returned to dialysis after a transplant. That is, deaths and survival during the first 60 days do not impact the SMR of that facility.
Identifying Patients Treated at Each Facility (see also Section XIII) For each patient, we identified the dialysis provider at each point in time using a combination of Medicare-paid dialysis claims, the Medical Evidence Form (Form CMS-
105

Guide to the 2008 Dialysis Facility Reports July 2008
Produced by The University of Michigan Kidney Epidemiology and Cost Center Page 4 of 29
2728), and data from the Standard Information Management System (SIMS). Starting with day 91 of ESRD, we determined facility treatment histories for each patient, and then listed each patient with a facility only once the patient had been treated there for 60 days. When a patient transferred from a facility, the patient remained assigned to it in the database for 60 days. This continued tabulation of the time at risk for 60 days after transfer from a facility attributes to a facility the sequelae of treatment there, even when a patient was transferred to another facility (such as a hospital-based facility) after his or her condition worsened. In particular, we placed patients in their initial facility on day 91 of ESRD once that facility had treated them for at least 60 days. If on day 91 a facility had treated a patient for fewer than 60 days, we waited until the patient reached day 60 of treatment at that facility before placing him or her there. State and Network summaries do not include patients who were not assigned to a facility; these patients are, however, included in the U.S. summaries. Using paid dialysis claims and SIMS data to determine whether a patient has transferred to another facility, we attributed patient outcomes to the patient's original facility for 60 days after transfer out. On day 61 after transfer from a facility, we placed the patient in the new facility once the patient had been treated at the new facility for 60 days. When a patient was not treated in a single facility for a span of 60 days (for instance, if there were two switches within 60 days of each other), we did not attribute that patient to any facility. Patients were removed from facilities upon receiving transplants. Patients who withdrew from dialysis or recovered renal function remained assigned to their treatment facility for 60 days after withdrawal or recovery. We removed any patient from a facility’s analysis whose last evidence of dialysis treatment at that facility was one year old, considering them lost to follow-up. In other words, if a period of one year passed with neither paid dialysis claims nor SIMS information to indicate that a patient was receiving dialysis treatment, we considered the patient lost to follow-up, and did not continue that patient in the analysis. When dialysis claims or other evidence of dialysis reappeared, the patient was entered into analysis after 60 days of continuous therapy at a single facility. Table 10 reports how we assigned patients to your facility. It also displays their status at year’s end (see Section XIII).
IV. Mortality Summary for All Dialysis Patients, 2004-2007 This report compares patient outcomes in your facility with national averages. Table 1 provides information about patient mortality. We have calculated a relative mortality rate, or Standardized Mortality Ratio (SMR), for patients in your facility. The SMR compares the observed death rate in your facility to the death rate that was expected based on national death rates for patients with the same characteristics as those in your facility (Wolfe, 1992). The SMR uses expected mortality calculated from a Cox model (SAS Institute Inc., 2000; Andersen, 1993; Collett, 1994), adjusting for patient age, race,
106

Guide to the 2008 Dialysis Facility Reports July 2008
Produced by The University of Michigan Kidney Epidemiology and Cost Center Page 5 of 29
ethnicity, sex, diabetes, duration of ESRD, nursing home status, patient comorbidities at incidence, body mass index (BMI) at incidence, and population death rates. The SMR accounts for many patient characteristics known to be associated with mortality, but cannot account for all factors that may explain differences in mortality between facilities. For example, since the SMR accounts for age and diabetes, an older average age or large percentage of diabetic patients at a facility would not elevate the SMR. Other factors, such as nutritional status, factors relating to the process of care, or comorbid conditions that developed after incidence, are not accounted for. Therefore, if the SMR statistic indicates potential differences in mortality for your facility compared to regional or national averages, please consider the role other important factors play within your facility. As with the hospitalization and transplantation summaries which are described below in Sections V and VI, you will find the mortality summaries most informative if you use them as part of an integrated quality assurance process. We reported information on the mortality of dialysis patients for each year between 2004 and 2007, and also summarized the statistic for the 2004-2007 period. We also reported the averages in your state, your ESRD Network, and the nation for this combined four-year period.
Patients (1a) We based the mortality summaries on the dialysis patients who received treatment in your facility according to the conventions described in Section III. Patients who died of AIDS are no longer excluded from this count, because starting in 2005, AIDS is not listed as a cause of death on the ESRD Death Notification Form (Form 2746) and therefore, we can no longer identify patients who died of AIDS.
Patient Years at Risk (1b) For all patients, time at risk began at the start of the facility treatment period (see Section III) and continued until the earliest occurrence of the following: transplant; date of death; end of facility treatment period; or December 31 of the year. A patient may have been treated at one facility for multiple periods during the same year; patient years at risk include time at risk for all periods of treatment at a facility.
Deaths (1c) We reported the number of deaths that occurred among dialysis patients during each year, as well as the total across the years. This count does not include deaths from street drugs or accidents unrelated to treatment. Deaths from these causes varied by facility, with certain facilities (in particular, urban facilities that treated large numbers of male and young patients) reporting large numbers of deaths from these causes and others reporting extremely low numbers (Turenne, 1996). Since these deaths are unlikely to have been due to treatment facility characteristics, we excluded them from the calculations. This count also does not include deaths related to Hurricanes Katrina and Rita. These are identified as deaths occurring between August 27, 2005 and October 31, 2005 that are
107

Guide to the 2008 Dialysis Facility Reports July 2008
Produced by The University of Michigan Kidney Epidemiology and Cost Center Page 6 of 29
noted in the Death Notification Form or in SIMS as being related to Hurricane Katrina or Hurricane Rita.
Expected Deaths (1d) We calculated the expected deaths as –ln(Si(ti)), where Si(t) was the survival curve from a Cox model adjusted to the characteristics of patient i and ti was the amount of follow-up time (patient years at risk) for that patient during the year (SAS Institute Inc., 2000; Andersen, 1993; Collett, 1994). We adjusted the Cox model for age, race, ethnicity, sex, diabetes, years since start of ESRD, nursing home status, patient comorbidities at incidence, and patient BMI at incidence (BMI = weight (kg)/ height2 (m2)). In cases where the comorbidities or BMI were missing for a patient, we used the average values of the group of patients with similar characteristics (age, race, ethnicity, sex, diabetes). We also controlled for age-adjusted population death rates by state and race, based on the U.S. population in 2003-2005 (National Center for Health Statistics, 2007). As with the deaths in 1c, we then summed these expected deaths in order to obtain the total number of deaths expected for each year at your facility, and we summed the annual values to yield the expected number of deaths over the four-year period for each facility.
Death Rate per 100 Patient Years (1e) We calculated the death rate by dividing the number of deaths by the total number of patient years at risk and then multiplying the result by 100. This yielded a measure of your facility’s death rate during the period. We expressed the number of deaths relative to the total number of patient years (rather than the number of patients) because many patients did not receive treatment for a full calendar year.
Expected Death Rate per 100 Patient Years (1f) We obtained the expected death fraction by dividing the number of expected deaths by the number of patient years at risk, and then multiplying the result by 100. This measures your facility’s expected death rate based on the age, race, ethnicity, sex, diabetes, years since start of ESRD, nursing home status, comorbidities at incidence, BMI at incidence, and population death rates. We expressed the expected number of deaths relative to the total number of patient years (rather than the number of patients) because many patients did not receive treatment for a full calendar year.
Categories of Death (1g, 1h, 1i) Row 1g reports the percentage of dialysis patient deaths (row 1c) for which the CMS ESRD Death Notification Form (Form-2746) indicated that the patient voluntarily discontinued renal replacement therapy prior to death. For the causes of death calculations in rows 1h and 1i, we considered all causes of death (primary and secondary) provided on the form. Row 1h reports the percentage of deaths in 1c listed as due to infection for either the primary or one of the secondary causes of death. Line 1i reports the number of patients who, according to any of the primary or secondary causes of death listed on the Death Notification Form, died from accidents unrelated to dialysis treatment, died from street drugs, or those whose deaths were determined to be related to Hurricanes Katrina or Rita (see 1c). We did not include these dialysis-unrelated
108

Guide to the 2008 Dialysis Facility Reports July 2008
Produced by The University of Michigan Kidney Epidemiology and Cost Center Page 7 of 29
deaths in the total death count in line 1c or the SMR; therefore, differences in SMRs between different dialysis facilities do not correspond to differences in the number of dialysis-unrelated deaths. Information on category of death may help you interpret the SMR value for your facility. For example, a high rate of withdrawal will not increase the SMR substantially if the patients who withdraw have a short expected lifetime, though it will cause an increase if patients have a long expected remaining life. However, we would advise using caution when interpreting these percentages by category of death, since we did not adjust them for patient characteristics. Expressing this information as a simple percentage of the total number of deaths does not indicate whether the percentage of deaths in any particular category differs from the national average for similar patients.
Standardized Mortality Ratio (SMR) (1j) The SMR equals the ratio of the actual number of deaths (1c) divided by the expected number of deaths (1d). The SMR estimates the relative death rate ratio for your facility, as compared to the national death rate. Qualitatively, the degree to which your facility’s SMR varies from 1.00 is the degree to which it exceeds (>1.00) or is under (<1.00) the 2004-2007 national death rates for patients with the same characteristics as those in your facility. As stated previously, we adjusted the SMR for age, race, ethnicity, sex, diabetes, duration of ESRD, nursing home status, comorbidities at incidence, BMI at incidence, and population death rates. The SMR indicates whether patients treated in your facility had higher or lower mortality than expected when adjusted for age, race, ethnicity, sex, diabetes, years of ESRD, nursing home status, comorbidities, BMI, and population death rates. Detailed statistical methodology for the SMR is included in a separate document titled Technical Notes on the Standardized Mortality Ratio for the Dialysis Facility Reports. This document and an accompanying Microsoft Excel spreadsheet are available on the UM-KECC website at http://www.sph.umich.edu/kecc under the DFR icon. Quantitatively, if your facility’s death rates equal the national death rates (in deaths per patient year or per year at risk) times a multiplicative constant, then the SMR estimates that multiplicative constant. If the multiplicative constant varies for different subgroups of patients, then the SMR estimates a weighted average of those constants according to your facility’s patient mix. For example, an SMR=1.10 would indicate that your facility’s death rates typically exceed national death rates by 10% (e.g., 22 deaths observed where 20 were expected, according to your facility’s patient mix). Similarly, an SMR=0.95 would indicate that your facility’s death rates are typically 5% below the national death rates (e.g., 19 versus 20 deaths). An SMR=1.00 would indicate that your facility’s death rates equal the national death rates. We calculated the regional and national summaries as the ratio of the total number of observed deaths among patients from each region to the number of expected deaths among patients from each region (1c/1d).
109

Guide to the 2008 Dialysis Facility Reports July 2008
Produced by The University of Michigan Kidney Epidemiology and Cost Center Page 8 of 29
Why the national SMR may not be exactly equal to 1.00 The reported 2004-2007 SMR for the U.S. as a whole may not be precisely equal to 1.00. The SMR value for the U.S. given in the Dialysis Facility Reports does not include all U.S. dialysis facilities in its calculation. In particular, as discussed in the Overview, transplant-only, Veteran’s Administration, and non-Medicare facilities are not included in the geographic summaries. Random variation The SMR estimates the true ratio of death rates at your facility relative to the national death rates. An SMR value that differs from 1.00 indicates that your facility’s death rates differ from the national death rates. However, the SMR’s value varies from year to year above and below the true ratio, due to random variation. Thus, your facility’s SMR could differ from 1.00 due to random variation rather than to a fundamental difference between your facility’s death rates and the nation’s. Both the p-value and the confidence interval, discussed below, will help you interpret your facility’s SMR in the face of such random fluctuations. We based our calculations of both items on an assumed Poisson distribution for the number of deaths at your facility.
P-value (1k) The p-value measures the statistical significance (or evidence) for testing the two-sided hypothesis that the true ratio of death rates for your facility versus the nation is different (higher or lower) from 1.00. The p-value is the probability that the SMR would, just by chance, deviate from 1.00 as much as does the observed SMR, and is sometimes naively interpreted as the probability that the true SMR equals 1.00. A smaller p-value tends to occur when the ratio differs more greatly from 1.00 and when one uses more patient data to calculate the SMR value. A p-value of less than 0.05 is usually taken as evidence that the ratio of death rates truly does differ from 1.00. For instance, a p-value of less than 0.05 would indicate that the difference between your facility’s death rates and the nation’s is unlikely to have arisen from random fluctuations alone. The smaller the p-value, the more statistically significant the difference between national and individual facility death rates is. A small p-value helps rule out the possibility that an SMR’s variance from 1.00 could have arisen by chance. However, a small p-value does not indicate the degree of importance of the difference between your facility’s death rates and the nation’s. The SMR’s actual quantitative value reflects the clinical importance of the difference between your facility’s and the nation’s death rates. An SMR that differs greatly from 1.00 is more important than an SMR in the range of 0.95 to 1.05.
Confidence Interval for SMR (1l) The 95% confidence interval gives a range of plausible values for the true ratio of facility-to-national death rates, in light of the observed SMR. The upper and lower limits enclose the true ratio between them approximately 95% of the time. Statistically significant confidence intervals do not contain 1.00.
110
Guide to the 2008 Dialysis Facility Reports July 2008
Produced by The University of Michigan Kidney Epidemiology and Cost Center Page 9 of 29
Recommended Course of Action if SMR Is Elevated In past years, Medical Directors have asked the UM-KECC what they should do if their SMR is elevated. Our general guidelines, which are not intended to be exhaustive, follow. 1) Does the SMR deviate from 1.00 by chance? If your facility has few patients, then random variation may explain the deviation. Evaluate the confidence interval and the p-value. Most likely, the true SMR lies between the confidence limits. If the p-value exceeds 0.05, or if the confidence interval includes 1.00 (crosses the 1.00 line), the SMR is not statistically significant at the 0.05 level, and random variation could plausibly explain its elevation. Please note that the p-value is based on an exact calculation, while the confidence interval is an approximation, accurate in most cases. In rare cases, these measures of statistical significance may differ, with one indicating a statistically significant result and the other an insignificant one. Should this occur, use the p-value rather than the confidence interval. 2) Is the result consistent across the years? See if the values are consistent from year to year or if there is a consistent trend towards higher or lower values. If not, then the results may be less reliable than if the individual year estimates follow a pattern. 3) Examine input data. Table 10 gives some details about the patients assigned to your facility. Your Network can provide you with a list of patients used in this report, which includes patient identifiers and death dates, if applicable. Consider whether the counts of patients by year are plausible over time, as well as for any one year. If this list contains substantial errors, we would like to know about them. 4) Consider other characteristics of your facility not adjusted for in the SMR. The SMR adjusts for age, race, ethnicity, sex, diabetes, years of ESRD, nursing home status, comorbidities, BMI, and population death rates. The SMR could differ from 1.00 because patients differ with respect to other important factors not adjusted for (e.g., poor nutritional status). 5) A statistically significant SMR greater than 1.10 likely reflects truly elevated mortality. Therefore, you may best address such a finding by evaluating various treatment factors in your unit, as well as other patient characteristics.
SMR Percentiles for This Facility (1m, 1n, 1o) This section reports the percentile rank of your facility’s SMR relative to all other facilities in the state, Network, and nation. This percentile — reported for each year’s SMR and for the four-year combined SMR — is the percentage of facilities with an SMR lower than your facility’s. In other words, a high or low percentile indicates that your facility has a high or low SMR relative to other facilities in the state, Network, or nation.
V. Hospitalization Summary for Medicare Dialysis Patients, 2004-2006 Hospitalization rates strongly indicate patient morbidity and quality of life. The typical dialysis patient is admitted to the hospital twice a year. Hospitalizations – also very costly – represent approximately 36 percent of total Medicare expenditures for dialysis
111

Guide to the 2008 Dialysis Facility Reports July 2008
Produced by The University of Michigan Kidney Epidemiology and Cost Center Page 10 of 29
patients (U.S. Renal Data System, 2007). Measures of the frequency of hospitalization and diagnoses present at hospitalization help efforts to control escalating medical costs, and play an important role in providing cost-effective health care. Hospitalization summaries for Medicare dialysis patients are reported in Table 2. This report includes summaries of the hospitalization rates among dialysis patients in your facility, along with comparative regional and national data. However, the reasons for differences in hospitalization rates by facility are complex. In some cases, a hospitalization may result from deteriorated patient health caused, for example, by inadequate dialysis. In other cases, a hospitalization to treat a pre-existing comorbid condition may effectively prevent additional or more serious hospitalizations. Thus, we provide hospitalization summaries in this report as indicators of the process of care, rather than as measures of patient outcomes in a facility. Hospitalization rates are more difficult to summarize than are mortality rates. First, a patient can be hospitalized more than once during a year. Further, hospitalization data are not always as complete as mortality data. Ideally, this table includes only patients whose Medicare billing records include all hospitalizations for the period. To achieve this goal, we require that patients reach a certain level of Medicare-paid dialysis bills to be included in hospitalization statistics, or that patients have Medicare-paid inpatient claims during the period. We intend for this criterion to assure completeness of information on hospitalizations for all patients included in the years at risk. Patient periods are included if each month in the period meets the criterion of being within two months after the end of a month having at least $900 of Medicare-paid dialysis claims or at least one Medicare-paid inpatient claim. On average, 72% all time at risk for the mortality statistics (1b) satisfies this criterion for inclusion in the hospitalization statistics (2b). If less than 30% of the original time at risk at a facility satisfies the criterion for inclusion in the hospitalization statistics for any year, no hospitalization statistics are reported for the facility. Statistics for such facilities would not be representative of the patients treated at the facility. We report two standardized statistics for hospitalization rates. The total days hospitalized rate reports the total number of days patients assigned to this facility were spent in the hospital. The total admission rate reports the total number of hospital admissions per year. Both statistics include multiple admissions per patient. Summaries of the total number of hospitalized days are reported in rows 2c through 2g, and summarizes of hospital admissions are reported in Rows 2h through 2m. We calculated for each facility a Standardized Total Days Hospitalized Ratio and a Standardized Total Admission Ratio. Like the SMR, these statistics are based on comparing your facility’s observed rate to the expected, national rates for 2004-2006 for patients with the same characteristics as those in your facility. We adjusted the standardized hospitalization statistics for age, race, sex, and diabetes. We reported the hospitalization summaries for each year from 2004-2006 and for the entire three-year period. We reported the result for the average facility over the combined 2004-2006 period for regional and national summaries.
112

Guide to the 2008 Dialysis Facility Reports July 2008
Produced by The University of Michigan Kidney Epidemiology and Cost Center Page 11 of 29
Medicare Dialysis Patients (2a) The number of Medicare dialysis patients included in the hospitalization summaries (2a) is generally smaller than the number of patients included in the mortality summaries (1a). We calculated hospitalization rates based only on periods in which dialysis patients had satisfied the Medicare payment criterion (described above).
Patient Years at Risk (2b) The number of patient years at risk indicates the total amount of time we followed patients in this table’s analyses. We used the number of patient years at risk reported in 2b as the denominator in the calculation of the total days hospitalized statistics. Patients were at risk for spending another day in the hospital whether or not they were hospitalized at the time. For all patients, time at risk began at the start of the facility treatment period (see Section III) and continued until the earliest occurrence of the following: three days prior to a transplant; date of death; end of facility treatment; or December 31 of the year. Since a facility may have treated a patient for multiple periods during the same year, patient years at risk includes time at risk for all periods of treatment at your facility.
Total Days Hospitalized (2c) This represents the total number of days that eligible patients assigned to this facility spent in the hospital. The total number of days includes multiple admissions (i.e., second hospitalization for the same patient, third, etc.). The number of hospital days in a particular year includes days until discharge for all admissions that start sometime between the patient’s start date and the end of the year. Thus, if a patient who was admitted near the end of one year was not discharged until the following calendar year (e.g., admitted on 12/28/2005 and discharged on 1/4/2006), the number of hospital days included those spent in the hospital during the subsequent year (four days during 2005 plus four days during 2006 = eight days in hospital).
Expected Total Days Hospitalized (2d) We calculated the expected number of hospitalized days among Medicare dialysis patients in a facility for 2004-2006 based on national hospitalization rates (days per year) by age, sex, race, and diabetes. Multiplying the time at risk for each patient in a facility by the national hospitalization rate (total days per year) for the corresponding age-diagnosis-sex-race patient subgroup yielded an expected number of days for each patient. Row 2d reports your facility’s sum of expected total days.
Observed Hospitalized Day Rate (2e) We calculated the hospitalized day rate by dividing the number of days hospitalized by the total number of patient years at risk in 2b. Patients were at risk for spending another day in the hospital whether or not they were hospitalized at the time. This value represents the average number of days spent in the hospital per year for patients in your facility. This measure of hospital use reflects both the number and length of hospital admissions. We expressed the number of hospitalized days relative to the total number of
113

Guide to the 2008 Dialysis Facility Reports July 2008
Produced by The University of Michigan Kidney Epidemiology and Cost Center Page 12 of 29
patient years (rather than the number of patients) because many patients did not receive treatment for a full calendar year.
Expected Hospitalized Day Rate (2f) We obtained the expected hospitalized day rate by dividing the number of expected hospitalized days by the number of patient years at risk. We expressed the expected number of hospitalized days relative to the total number of patient years (rather than the number of patients) because many patients did not receive treatment for a full calendar year.
Standardized Total Days Hospitalized Ratio (2g) We calculated the standardized ratio for total days hospitalized by dividing the observed total days hospitalized by the expected total days hospitalized. As with the SMR, it enables a comparison of your facility’s experience to the national average. A value of less than 1.00 indicates that your facility’s total number of hospitalized days was less than expected, based on national rates; whereas a value of greater than 1.00 indicates that your facility had a rate of total hospitalized days higher than the national average. We adjusted this measure for your facility’s patient age, race, sex, and diabetes characteristics.
Patient Years at Risk for Total Admissions (2h) We used the number of patient years at risk for total admissions to calculate the total admission statistics. Time at risk for total admissions equaled the patient years at risk (2b) minus any time spent in the hospital. Thus, the number of patient years at risk for total admissions included all time not spent in the hospital during that year, since a patient could not be at risk for an admission while still in the hospital. As before, the time-at-risk period continued until the earliest of either death, end of the facility treatment period, or December 31. Since a facility may have treated a patient for multiple periods during the same year, patient years at risk includes time at risk while not in the hospital for all periods of treatment at your facility.
Total Admissions (2i) This represents the total number of hospital admissions among the Medicare dialysis patients eligible for the hospitalization summaries. The total number of admissions includes multiple admissions (i.e., second hospitalization for the same patient, third, etc.). The number of admissions in a particular calendar year includes a hospital admission in which a patient was admitted during the year but was discharged the following year (e.g., a stay from December 31-January 1). Such admissions are not counted again for the following year.
Expected Total Admissions (2j) We calculated the expected number of hospital admissions among Medicare dialysis patients in a facility for 2004-2006 based on national hospital admission rates (admissions per year) by age, sex, race, and diabetes. Multiplying the time at risk for each patient in a facility by the national admission rate (total admissions per year) for the
114

Guide to the 2008 Dialysis Facility Reports July 2008
Produced by The University of Michigan Kidney Epidemiology and Cost Center Page 13 of 29
corresponding age-diagnosis-sex-race patient subgroup yielded an expected number of admissions for each patient. Row 2j reports your facility’s sum of expected total admissions.
Observed Admission Rate (2k) We calculated the admission rate by dividing the number of admissions by the total number of patient years at risk in 2h. This yielded a measure of your facility’s admission rate during the period. We expressed the number of admissions relative to the total number of patient years (rather than the number of patients) because many patients did not receive treatment for a full calendar year.
Expected Admission Rate (2l) We obtained the expected admission fraction by dividing the number of expected admissions by the number of patient years at risk in 2h. We expressed the expected number of admissions relative to the total number of patient years (rather than the number of patients) because many patients did not receive treatment for a full calendar year.
Standardized Total Admission Ratio (2m) We calculated the standardized ratio for total admissions by dividing the observed total admissions by the expected total admissions. As with the SMR, it enables a comparison of your facility’s experience to the national average. A value of less than 1.00 indicates that your facility’s total number of admissions was less than expected, based on national rates; whereas a value of greater than 1.00 indicates that your facility had a rate of total admissions higher than the national average. We adjusted this measure for your facility’s patient age, race, sex, and diabetes characteristics.
Diagnoses Present at Admission (2n-r) Row 2n reports the percentage of patients in 2a who had septicemia reported as one of the diagnoses on a hospital bill with a start date during a period of treatment at your facility. In order to determine which hospitalizations listed septicemia as a contributing cause, we first identified ICD-9 diagnosis codes associated with septicemia, and then looked for these codes on the hospital bills (in any position on the list of diagnoses). Similarly, rows 2o through 2r give the percentage of patients in 2a who had acute myocardial infarction, congestive heart failure, cardiac arrhythmia, and cardiac arrest reported as one of the diagnoses on a hospital bill with a start date during a period of treatment at your facility. We also identified these through their ICD-9 diagnosis codes. Rows 2n through 2r include all bills, even if the patient did not leave the hospital in between bills. Note that a patient may appear in more than one of the categories.
One Day Admissions (2s) We reported the percentage of total hospital admissions lasting one day or less — a value based on the total number of admissions reported in row 2i. One-day admissions included hospitalizations in which the patient was discharged either the same or the following day. We did not adjust this statistic for patient characteristics.
115

Guide to the 2008 Dialysis Facility Reports July 2008
Produced by The University of Michigan Kidney Epidemiology and Cost Center Page 14 of 29
Average Length of Stay (2t) We reported, as a measure of the severity of hospitalizations, the average duration (in days) of hospital admissions among Medicare dialysis patients eligible for the hospitalization summaries. We calculated this duration from Medicare payment records, which listed an admission and discharge date for each hospitalization. We calculated the average duration per admission, with no adjustment for patient characteristics.
VI. Transplantation Summary for Dialysis Patients under Age 70, 2004-2007 The results of numerous studies have indicated that the recipients of renal transplants have better survival than comparable dialysis patients (Wolfe, 1999). Although the number of renal transplants has increased, it has not kept pace with the rising number of patients on transplant waiting lists. This report includes Standardized Transplantation Rates (STRs) for dialysis patients. We calculated the STR using the same methods as the SMR, described in more detail in Section IV. Adjustments for the STR differed from those for the SMR because the STR was adjusted for age only. Since we included patients in this table only once they reached day 91 of ESRD, we excluded patients who received a pre-emptive transplant or a transplant within the first three months of treatment. You will find these statistics useful in that they allow a facility to compare the rate of transplantation for the dialysis patients they treat, though these statistics should not be interpreted as including all transplants. Footnote 3 gives the percentage of transplants in the U.S. that were not included because the transplant occurred less than 90 days after the start of ESRD, as well as those that were not included because the patients were not assigned to facilities at times of transplant.
Eligible Patients (3a) Row 3a reports the number of dialysis patients under age 70. All transplantation statistics in this report refer only to those patients less than 70 years of age because transplants in people aged 70 or greater occurred much less frequently than did transplants in younger patients.
Transplants (3b) Row 3b reports the number of dialysis patients under the age of 70 in each facility who received a transplant.
Donor Type (3c) Row 3c reports by year the number of patients who received transplants from a living and from a deceased donor. The sum is the number of transplants in row 3b.
Eligible Patients (3d) Row 3d reports the number of dialysis patients under age 70 from row 3a who had never received a kidney transplant before. The first transplant rates in the rest of the table are restricted to these patients. The number of dialysis patients included in this report’s transplantation summaries (3d) was typically much smaller than the number of patients
116

Guide to the 2008 Dialysis Facility Reports July 2008
Produced by The University of Michigan Kidney Epidemiology and Cost Center Page 15 of 29
included in the mortality summaries (1a) for two reasons. First, all transplantation statistics in this report refer only to those patients less than 70 years of age. Second, we computed transplantation statistics only for patients who had never received a kidney transplant before.
Patient Years at Risk (3e) We limited our calculations for 3e to patients under the age of 70 who had not previously received a transplant. For all patients, time at risk began at the start of the facility treatment period (see Section III) and continued until the earliest of the following occurrences: transplant; date of death; end of the facility treatment period; or December 31. A patient may have been treated at one facility for multiple periods during the same year; in such a case, the number of patient years at risk included time at risk for all periods of treatment at that facility.
Actual First Transplants (3f) Row 3f reports the number of dialysis patients under the age of 70 in each facility who received a first transplant.
Expected First Transplants (3g) We calculated the expected number of patients who had received transplants during the year in a manner similar to calculating the expected number of deaths, but with one important difference: We adjusted transplantation statistics for age only. We did not adjust transplantation statistics for sex, race, or diabetes because, generally speaking, these are inappropriate adjustments for access to transplantation. We calculated the expected number of first transplants during the year for each patient as –ln(Si(ti)), where Si(t) is the survival curve from a Cox model adjusted to the age of patient i and ti is the amount of follow-up time (patient years at risk) for that patient during the year (SAS Institute Inc., 1999; Andersen, 1993; Collett, 1994). Table 3 sums and reports the total number of patients expected to receive a first transplant from your facility, with corresponding regional and national averages.
First Transplant Rate per 100 Patient Years (3h) We calculated the first transplantation rate for patients under 70 by dividing the number of patients receiving a kidney transplant for the first time during the period (3f) by the total number of patient years at risk for transplant (3e), and then multiplying the result by 100. We expressed the number of transplants relative to the total number of patient years (rather than the number of patients) because many patients did not receive treatment for a full calendar year.
Expected First Transplant Rate per 100 Patient Years at Risk (3i) We calculated the expected first transplantation rate by dividing the expected number of first transplants (3g) by the total number of patient years at risk (3e), and then multiplying the result by 100. We expressed the expected number of transplants as relative to the total number of patient years (rather than the number of patients) because many patients did not receive treatment for a full calendar year.
117

Guide to the 2008 Dialysis Facility Reports July 2008
Produced by The University of Michigan Kidney Epidemiology and Cost Center Page 16 of 29
Donor Type (3j) Row 3j reports by year the number of patients who received transplants from a living and from a deceased donor. The sum is the number of transplants in row 3f.
Standardized Transplantation Ratio (3k) The Standardized Transplantation Ratio (STR) is the ratio of the actual number (3f) of first transplants to the expected number (3g) of first transplants for your facility, given the age composition of your facility’s patients. Note that we adjusted the STR for patient age only. Interpret the STR as you would the SMR. An STR of 1.00 indicates that the observed number of transplants in your facility equals the estimated national rate, adjusted for age. An STR of less than 1.00 indicates that your facility’s transplant rate is lower than the national average. An STR greater than 1.00 indicates that your facility’s transplant rate exceeds the national average. The amount by which an STR lies above or below 1.00 corresponds to the percentage your facility’s transplant rate is above or below the national average, respectively. For example, an STR of 0.90 would mean that your facility’s rate of transplantation is 10% less than the estimated national rate (e.g., nine transplants where ten are expected). An STR exceeding 1.00 is desirable. We calculated the STRs for the regional and national summaries as the ratio of the total observed number of first transplant summed across facilities to the total expected number of first transplants summed across facilities. Random Variation The STR tends to show more random variation than the SMR because numbers of transplants are much smaller than numbers of deaths. Small numbers of events contribute to instability, increasing the chances that an observed result owes to chance rather than to the true ratio of observed-to-expected transplants. This makes p-values and confidence intervals instrumental in interpreting your facility’s STR. We calculated these statistics based on an assumed Poisson distribution of the observed number of patients transplanted.
P-value (3l) We used the p-value to determine the statistical significance of the STR. The p-value measures the statistical significance (or evidence) for testing the two-sided hypothesis that the true ratio of transplantation rates for your facility versus the nation is different (higher or lower) from 1.00. The p-value indicates the probability that the result obtained owed to chance alone, with smaller values meaning chances are low that the STR differs from the national average merely because of random variation. Although a p-value of less than 0.05 usually indicates a result’s statistical significance, you should also use the absolute magnitude of the STR’s deviation from 1.00 to determine its clinical importance.
Confidence Intervals for STR (3m) The 95% confidence interval gives a range of plausible values for the true ratio of facility-to-national first transplant rates, in light of the observed STR. The upper and
118
Guide to the 2008 Dialysis Facility Reports July 2008
Produced by The University of Michigan Kidney Epidemiology and Cost Center Page 17 of 29
lower limits enclose the true ratio between them approximately 95% of the time. Statistically significant confidence intervals do not contain 1.00.
STR Percentile for This Facility (3n, 3o, 3p) This section reports the percentile rank of your facility’s STR relative to all other facilities in the state, Network, and nation. We report these percentiles for each year’s STR and for the four-year combined STR. The percentile indicates the percentage of facilities with an STR lower than your facility’s STR. In other words, a high or low percentile number indicates that your facility has a high or low STR relative to other facilities in the state, Network, or nation.
VII. Waitlist Summary for Dialysis Patients under Age 70 Treated as of December 31 of Each Year, 2004-2007 The results of numerous studies have indicated that the recipients of renal transplants have better survival than comparable dialysis patients (Wolfe, 1999). The first step in the transplant process is getting placed on the transplant waitlist.
Eligible Patients on 12/31 (4a) This table reports waitlist summary statistics for all dialysis patients under age 70 that were being treated on December 31 of each year in your facility. Row 4a reports the number of dialysis patients included in the waitlist summaries. All waitlist statistics in this profile refer only to those patients less than 70 years of age because transplants in people aged 70 or greater occur with much less frequency than do transplants in younger patients. This table gives a snapshot of the waitlist at four dates. The criteria for including patients in this table are different than those described in Section III for Tables 1, 2, and 3. For this table, we included patients at the facility they were in on December 31 of each year according to claims data or SIMS. The 60-day transfer rule did not apply, and we included patients new to dialysis (the 90 day rule did not apply).
Patients on the Waitlist (4b) Row 4b reports the percentage of patients in 4a who were on the kidney or kidney-pancreas transplant waitlist as of December 31, with the corresponding national percentage for 2007 reported for comparison.
P-value (4c) We used a two-sided p-value to test the hypothesis that the true percentage of patients on the waitlist reported in row 4b is different (higher or lower) from the U.S. value for that year. Footnote 3 shows the percentage of patients on the waitlist in the U.S. for each year used in this comparison. The p-value indicates the probability that the difference between the percentage of patients on the waitlist in your facility and in the U.S. occurred due to chance. A low p-value means that the chances are low that the facility percentage was higher or lower than the national average merely because of random variation. A p-value of less than 0.05 usually indicates a result’s statistical significance. You should also use
119

Guide to the 2008 Dialysis Facility Reports July 2008
Produced by The University of Michigan Kidney Epidemiology and Cost Center Page 18 of 29
the absolute magnitude of the difference between your facility and national percentage of patients on the waitlist to determine its clinical importance.
Patient Characteristics (4d-4e) Lines 4d and 4e break down the information in lines 4a and 4b by various patient characteristics. Line 4e reports the patient counts by age, sex, race and ethnicity, cause of ESRD, previous transplant, and years of ESRD treatment. These counts sum to line 4a for each set of categories. Line 4d reports the percentage of patients in each category in 4e who were on the kidney or kidney-pancreas transplant waitlist. State, Network, and U.S. averages for 2007 are given for comparison.
VIII. Facility Modality, Hemoglobin, and Urea Reduction Ratio, 2004-2007 Table 5 reports information on facility practice patterns, each section of which includes a slightly different group of patients. We restricted dialytic modality and hemoglobin information to patients who have had ESRD for at least 90 days. Information on urea reduction ratio is restricted to patients who have had ESRD for at least 183 days. The inclusion criteria are described in more detail below. Table 5 includes state, Network, and U.S. summaries for 2007 only.
Modality (5a, 5b) We based the reported dialytic modality information on all Medicare dialysis claims submitted by your facility, excluding patient claims that started before day 90 of ESRD. Each patient treated during January 2004 through December 2007 at your facility was classified as receiving hemodialysis (including home hemodialysis), CAPD/CCPD, or other dialysis. Patients were categorized as receiving ‘other dialysis’ if they had claims for both hemodialysis and peritoneal dialysis in the same year. Rows 5a and 5b report the number and percentage of patients who received each of these therapeutic modalities.
Hemoglobin(5c-5g) We based the hemoglobin information reported in lines 5c to 5g on all Medicare dialysis claims submitted by your facility that indicated the use of an erythropoiesis stimulating agent (ESA), specifically, the use of epoetin alfa or darbepoetin alfa. We calculated hemoglobin as hematocrit divided by three for claims that report hematocrit but not hemoglobin. We included neither patient claims starting before day 90 of ESRD nor claims with hemoglobin values less than 5 or greater than 20. Line 5c reports the number of patients for whom at least four claims fulfilling these criteria were submitted by your facility for each year. A patient treated at more than one facility during the year was included in the report for each facility (as long as the patient had at least 4 claims from the facility). For each patient in line 5c, we calculated the average hemoglobin reported on claims submitted by your facility. We summed the average hemoglobin values for the patients in 5c and then divided by the number of patients in 5c in order to obtain your facility average reported in 5d. Row 5e
120

Guide to the 2008 Dialysis Facility Reports July 2008
Produced by The University of Michigan Kidney Epidemiology and Cost Center Page 19 of 29
presents the percentage of patients from 5c in each of three hemoglobin categories: less than 10g/dl, between 10-12 g/dl, and greater than 12 g/dl. In line 5f, the percent of patients whose average hemoglobin was between 10-12 g/dl is reported separately for hemodialysis (HD) and peritoneal dialysis (PD) patients. For this statistic, claims from the facility for each patient were further divided by the treatment modality for the claim. This means that patients who received both HD and PD treatment at the facility appear in line 5f in both the HD and PD statistic. Patients who had at least 4 total claims from the facility appear in this line, even when there were fewer than 4 claims for the particular modality. Line 5g reports for each year the percentile rank of your facility’s hemoglobin relative to all other facilities in the state, Network, and nation.
Urea Reduction Ratio (5h-5k) We base the urea reduction ratio (URR) information reported in lines 5h-5k on all Medicare dialysis claims submitted by your facility, with the following two exclusions: claims which started before day 183 of ESRD for a patient; and claims with missing URR category. (Although we did not explicitly exclude peritoneal dialysis (PD) patients, PD patients would not have URR reported.) Line 5h reports the number of patients for whom at least four claims fulfilling these criteria had been submitted for your facility for each year. A patient who had been treated at more than one facility during the year was included at both facilities in line 5h when the patient had at least four claims with URR at each facility. We assigned each patient in 5h to the median URR. For patients treated at more than one facility during the year, we calculated separately the URR category for them for each facility based on the claims from each facility only. Row 5i reports the percentage of patients in your facility in each category. The KDOQI guidelines recommend that all patients have a URR of 65% or more (NKF-KDOQI, 1997; NKF-KDOQI, 2001). Line 5j reports the percentage of patients in row 5h with URR that meets KDOQI guidelines (i.e., 65% or more). Line 5k reports the percentile rank of your facility’s URR (percentage of patients who met KDOQI guides for URR) for each year, relative to all other facilities in the state, Network, and nation.
IX. Vascular Access Information (CMS Fistula First), 2004-2007 Table 6 reports vascular access data from the National Vascular Access Improvement Initiative’s Fistula First project. The Fistula First project collects monthly data on vascular access from dialysis facilities. We summarized these data for each year, from 2004-2007, reporting yearly averages for each facility. We also report comparison values for 2007 for the state, Network, and U.S. These vascular access data are self-reported at the facility level.
Prevalent hemodialysis patient months (6a) The Fistula First project defines the monthly prevalent hemodialysis patient count at a facility to include all non-transient patients (home and in-center) who receive
121

Guide to the 2008 Dialysis Facility Reports July 2008
Produced by The University of Michigan Kidney Epidemiology and Cost Center Page 20 of 29
hemodialysis as of the last day of that calendar month. Incident patients (those who received ESRD treatment for the first time ever) were included in this count. Line 6a reports the number of prevalent hemodialysis patient months reported at your facility each year. The number of patient months over a time period is the sum of patients reported for the months covered by the time period. An individual patient may contribute up to 12 patient months per year.
Vascular access type in use (6b) Line 6b reports the type of vascular access in use during the last hemodialysis treatment of the calendar month, summarized for each year. This line reports the percentage of patient months in 6a in which the patient received dialysis through arteriovenous (AV) fistulae, AV grafts, catheters, or other access types for the last treatment of the month. Patients who are reported as having an AV graft or a catheter in use with an AV fistula in place for future use are included in the AV graft or catheter category. For the Fistula First project, port access devices were reported as catheters. A patient’s vascular access was classified as Other if it was considered to be different from the above categories (e.g., lifeline). Patients were classified as having missing access types if the vascular access data were missing from the record.
Arteriovenous Fistulae placed (AV) (6c) Line 6c reports the average percentage of patient months in 6a in which an AV fistula was in place at the time of the last treatment of the month, regardless of whether or not the patient received hemodialysis treatment using this AV fistula.
Catheter only ≥ 90 days (6d) Line 6d reports the average percentage of patient months in 6a in which a catheter was in use at the last treatment of the month, a catheter was the only means of vascular access (i.e. patient did not have an AV fistula or AV graft in place), and the catheter was in place for at least 90 days prior to treatment. For the Fistula First project, port access devices were reported as catheters.
Incident hemodialysis patients (6e) Line 6e reports the total number of incident hemodialysis patients at your facility each year. The average number of incident patients during 2007 is reported for comparison for your state, Network, and the U.S. The Fistula First project defines incident hemodialysis patients to be non-transient hemodialysis patients (home and in-center) who received their first ever ESRD treatment during the month for which the data was reported. These patients are a subset of prevalent patients.
Vascular access type in use (6f) Line 6f reports the type of vascular access in use during the last hemodialysis treatment of the calendar month in which the patient was incident, summarized for each year. This line reports the percentage of incident hemodialysis patients in 6e who received dialysis through arteriovenous (AV) fistulae, AV grafts, catheters, or other access types.
122
Guide to the 2008 Dialysis Facility Reports July 2008
Produced by The University of Michigan Kidney Epidemiology and Cost Center Page 21 of 29
Patients who are reported as having an AV graft or a catheter in use with an AV fistula in place for future use are included in the AV graft or catheter category. For the Fistula First project, port access devices were reported as catheters. A patient’s vascular access was classified as Other if it was considered to be different from the above categories (e.g., lifeline). Patients were classified as having missing access types if the vascular access data were missing from the record.
Arteriovenous Fistulae placed (AV) (6g) Line 6g reports the percentage of incident patients in 6e with an AV fistula in place at the last treatment for the month the patient was incident. Patients with an AV fistula in place are included in this line regardless of whether or not they received their hemodialysis treatments using the fistula.
X. Characteristics of New Dialysis Patients, 2004-2007 (Form CMS-2728) Table 7 presents detailed data from the ESRD Medical Evidence Form (Form CMS-2728) on the characteristics of new patients in your facility by year. State, Network and national averages for 2007 are also shown for comparison. The patients represented in this table were hemodialysis and peritoneal dialysis patients who started dialysis between January 1, 2004 and December 31, 2007. Please note that we placed the patients included here not according to the conventions described in Section III, but rather according to the provider number that appeared on their Medical Evidence Forms. For each patient characteristic, we present the average value for your facility as well as state, Network, and U.S. averages. We excluded from the calculations values for individual patients which fell outside the ranges shown in brackets [] on this table because we considered them to be clinically implausible. Lines 7j-7m and 7s-7v were added to the Form CMS-2728 in June 2005; we report data on the DFR only for 2006 and 2007 only.
Patient Characteristics (7a-7m) Line 7a of this table gives the total number of forms submitted by your facility for the year. Lines 7b-7m deal with your patients’ demographic characteristics, including their age, sex, ethnicity, race, medical coverage, body mass index, primary cause of ESRD, employment, primary modality, and access type.
Average Lab Values Prior to Dialysis (7n-7q) Lines 7n through 7q report lab values prior to start of ESRD. We estimated the glomerular filtration rate (GFR) reported in line 7q using a formula developed by the Modification of Diet in Renal Disease (MDRD) Study (Levey et al, 1999) — a formula based on serum creatinine before first dialysis, age, race, and gender.
Nephrologist Care Prior to Start of ESRD Therapy (7r-7s) Line 7r reports the percentage of incident patients in 7a who have received an ESA prior to ESRD. Line 7s gives the percentage of patients in 7a who had been under the care of a
123

Guide to the 2008 Dialysis Facility Reports July 2008
Produced by The University of Michigan Kidney Epidemiology and Cost Center Page 22 of 29
nephrologist prior to the start of ESRD therapy by categories of time (never, <6 months, 6-12 months, >12 months, unknown).
Kidney Transplant Options (7t-7v) Line 7t reports the percentage of patients in 7a who had been informed of transplant options. Line 7u gives the count of patients who were not informed of their transplant options. The reasons for not informing the patients reported in 7u of their transplant options (due to being medically unfit, unsuitable due to age, psychologically unfit, declining the information, or not yet being assessed) are reported in line 7v.
Comorbid Conditions (7w-7x) Line 7w reports the percentage of patients in your facility with each of the comorbid conditions (measured before the start of dialysis) listed. The 2005 changes in Form CMS-2728 have affected the cardiac and diabetes listings; note that ‘Ischemic Heart Disease’ and ‘Myocardial Infarction’ are included in Atherosclerotic Heart Disease (ASHD), and ‘Cardiac Arrest’, ‘Cardiac Dysrhythmia’, and ‘Pericarditis’ are included in Other Cardiac Disease. Line 7x gives the average number of comorbid conditions reported per new patient in your facility, your state, your Network, and the nation.
XI. Summaries for All Dialysis Patients Treated as of December 31 of Each Year, 2004-2007 Table 8 summarizes the characteristics of dialysis patients treated on December 31, 2004-2007 in your facility, with corresponding average values for 2007 among patients in your state, ESRD Network, and the U.S.
Patients Treated on 12/31 of Year (8a) Row 8a reports the total number of dialysis patients treated in your facility on December 31 of each year, according to the conventions described in Section III. We based the summaries of the patient characteristics in Table 8 on the patient population count in this row.
Age (8b, 8c) We determined age as of December 31 for each patient for each year. We reported the average age and the percentage of patients in each of several age ranges.
Female (8d) Line 8d reports the percentage of female patients.
Race (8e) We established each patient’s race using two sources of information: the Medical Evidence Form and Standard Information Management System (SIMS). We reported the percentage of patients in each of five race categories: Asian/Pacific Islander (includes Indian sub-continent), African American, Native American (includes Alaskan Native),
124

Guide to the 2008 Dialysis Facility Reports July 2008
Produced by The University of Michigan Kidney Epidemiology and Cost Center Page 23 of 29
White (includes Middle Eastern and Arabian), and a combined group for other/unknown/missing race. The ‘other/unknown/missing race’ category includes patients for whom none of the other race categories was indicated on any of the above sources.
Ethnicity (8f) We obtained the ethnicity of patients from the CMS Medical Evidence Form, and supplemented it with the ESRD Clinical Performance Measures data sample when available. We reported the percentage of patients in the Hispanic and Non-Hispanic categories.
Cause of ESRD (8g) We ascertained each patient’s cause of ESRD using two sources of information: the Medical Evidence Form and Standard Information Management System (SIMS). We reported the percentage of patients in each of five major cause groups: diabetes; hypertension; glomerulonephritis; other/unknown; and missing cause.
Duration of ESRD (8h, 8i) We calculated the number of years since first renal replacement therapy for each patient treated in your facility on December 31 of each year. Row 8h reports the average number of years of prior ESRD therapy. Row 8i displays ranges of years since start of ESRD and the corresponding percentages of patients per range.
Nursing facility patients (8j) We obtained the nursing facility history of patients from the Nursing Home Minimum Dataset. We reported the percentage of patients treated on December 31 of each year that were also treated at a nursing facility at any time during the year.
Modality (8k) Line 8k reports the percent of patients on chronic dialysis treatment at your facility (%8a) receiving dialysis through the following modalities: In-center hemodialysis, In-center self-hemodialysis, Home hemodialysis, Continuous ambulatory peritoneal dialysis, Continuous cycling peritoneal dialysis and other. The ‘Other’ modality category includes other dialysis, uncertain modality, and patients not on dialysis but still temporarily assigned to the facility (discontinued dialysis, recovered renal function, and lost to follow-up.)
XII. Comorbidities Reported on Medicare Claims for Medicare Dialysis Patients Treated as of December 31 of Each Year, 2004-2006 Table 9 reports comorbid conditions identified on Medicare claims for Medicare dialysis patients treated on December 31, 2004-2006 in your facility, with corresponding average values for 2006 among patients in your state, Network, and the U.S.
125

Guide to the 2008 Dialysis Facility Reports July 2008
Produced by The University of Michigan Kidney Epidemiology and Cost Center Page 24 of 29
A detailed list of ICD-9 diagnostic codes used to identify hospitalizations and comorbidities is included in a separate document available on the UM-KECC website http://www.sph.umich.edu/kecc under the DFR icon. Like the hospitalization table, this table should include only patients who are covered by Medicare(so that Medicare billing records have complete information about the patient). To achieve this goal, we use the criterion described in Section V for the hospitalization statistics. Patient periods are included if each month in the period meets the criterion of being within two months after the end of a month having at least $900 of Medicare-paid dialysis claims or at least one Medicare-paid inpatient claim. This table is then further restricted to patients being treated at the facility at the end of the year. As noted in Section V, if less than 30% of the original time at risk (1b) at a facility satisfies the criterion for inclusion in the hospitalization statistics for any year, no hospitalization statistics are reported for the facility. The comorbidity statistics are also not reported for these facilities. In addition, if fewer than 30% of the patients being treated on December 31 at the facility (8a) meet the inclusion criteria for any year, no comorbidity statistics are reported for the facility. Again, statistics for such facilities would not be representative of the patients treated at the facility.
Patients Treated on 12/31 of Year (9a) Row 9a reports the total number of Medicare dialysis patients treated in your facility on December 31 of each year, according to the conventions described in Sections III who also satisfy the criterion described above for assuring that Medicare claims data are complete for the patient. We based the summaries of the patient characteristics in Table 9 on the patient population count in this row.
Comorbid Conditions (9b) Line 9b reports the percentage of patients in your facility with each of the comorbid conditions listed.
Average Number of Comorbid Conditions (9c) Line 9c reports the average number of the comorbid conditions listed in 9b on Medicare claims for patients in your facility.
XIII. How Patients Were Assigned to This Facility and End of Year Patient Status, 2004-2007 An important purpose of this report is to provide and seek feedback on the quality of these data. Much of this report relies on a reasonably accurate and complete description of the patients being treated in each facility at a particular point in time. We believe the overall results warrant a high level of confidence in the assignment of patients to providers. The UM-KECC will continue its efforts to measure and improve the quality of all data presented in this report through comparisons with other available data sources.
126

Guide to the 2008 Dialysis Facility Reports July 2008
Produced by The University of Michigan Kidney Epidemiology and Cost Center Page 25 of 29
Number of Patients Placed in Facility (10a) Line 10a gives the total number of patients who have been placed in your facility for the mortality summary according to the conventions described in Section III. This number is identical to 1a — the number of patients included in the mortality summaries.
Initial Patient Placement for the Year in This Facility (10b) Patients entered your facility in one of three ways: as a continuing patient from the previous year; as new to dialysis this year at your facility; as a transfer into the facility during the year. Item 10b reports the percentage of patients who entered your facility each way. We considered a patient who initiated dialysis treatment at one facility and then transferred to another later that year as both new to dialysis at the first facility and transferred into the facility for the second. We considered patients returning to dialysis after transplant as a transfer into the facility.
Patient Status at End of Year (10c) Item 10c reports the status at year’s end for each patient who was placed in your facility. The categories include patients who were alive and receiving treatment in your facility, who were alive and receiving treatment in another facility, who received a transplant, who died and whose death was attributed to your facility, and who died and whose death was attributed to another facility, as well as all other patients. ‘Other patients’ includes those who recovered renal function, who discontinued dialysis, or who were lost to follow-up. It also includes dialysis-unrelated deaths. For the purposes of this report’s mortality calculations, we did not attribute dialysis-unrelated deaths to any facility.
XIV. Patient and Staff Counts from Annual Facility Survey (Form CMS 2744), 2004-2007 Table 11 reports patient counts according to the Annual Facility Survey (Form CMS-2744). This information was self-reported by the facilities. We report the number of patients who were treated during each year in your facility from 2004-2007, and we show regional averages for 2007 for comparison.
Patients Treated during the Year (11a-11d) Line 11a reports the number of patients who were treated during each year. Lines 11b-11d report the percentage of these patients who were incident, transferred into your facility, and transferred out of your facility during each year. These numbers include both outpatient and home dialysis patients.
Patients Treated as of 12/31 (11e-11g) Line 11e reports the number of patients who were treated as of December 31 of each year. Line 11f reports patient modality counts. Line 11g reports the percentage of these patients who had Medicare coverage, had a Medicare application pending, or were non-Medicare patients.
127

Guide to the 2008 Dialysis Facility Reports July 2008
Produced by The University of Michigan Kidney Epidemiology and Cost Center Page 26 of 29
Staffing (11h-11i) Line 11h reports the total number of full and part time staff positions at the facility as of December 31 of the year. This includes positions that were opened but not filled on this date. Line 11i reports the number of positions in line 11h broken down by type of position. For the purposes of the Annual Facility Survey, a full time position is defined as a position with at least 32 hours of employment a week and a part time position is defined as a position with less than 32 hours of employment a week. In this report, nurses include all staff holding a registered nurse, licensed practical nurse, vocational nurse, or an advanced practical nurse degree.
XV. Survey and Certification Activity, 2008 Table 12 reports the latest survey and certification information for this facility as of June 2008. We obtained this data from Online Survey Certification and Reporting (OSCAR).
Date and type of last survey (12a, 12b) Line 12a reports the date of the most recent survey, and line 12b reports the type of survey. The type can be an initial survey, a recertification survey, or a termination survey.
Compliance condition after last survey (12c) Line 12c reports the compliance condition after the last survey. The possible values are: meets requirements, acceptable plan of correction, or does not meet requirements.
Deficiencies cited at last survey (12d, 12e) Line 12d reports the number of condition for coverage (CfC) deficiencies cited during the last survey and separately reports the number of standard deficiencies cited during the last survey. Line 12d includes summary of these numbers using surveys from January 2004-June 2008 in this state, ESRD Network, and the nation. Line 12e reports each of the eleven CfC deficiencies separately and includes a summary reporting the percent of surveys citing each deficiency between January 2004 and June 2008 in this state, Network, and the nation.
XVI. Facility Information, 2008 Table 13 reports the ownership type, organization name, initial Medicare certification date, number of stations, and types of services provided by the facility as of March 31, 2008. These data were obtained from SIMS as of March 31, 2008. Other provider numbers from which data have been included in this report are also listed in this table.
128

Guide to the 2008 Dialysis Facility Reports July 2008
Produced by The University of Michigan Kidney Epidemiology and Cost Center Page 27 of 29
XVII. Please Give Us Your Comments We welcome questions or comments about this report’s content, or any suggestions you might have for future reports of this type. Improvements in the content of future reports will depend on feedback from the nephrology community. Comments can be submitted to www.ArborResearch.org/ESRDmeasures until September 7, 2008. If you have questions after the comment period is over, please contact The University of Michigan Kidney Epidemiology and Cost Center (UM-KECC) directly by email, fax, or mail. Please note “2008 Dialysis Facility Reports” as the topic of your correspondence, and include your contact information and facility’s Medicare provider number. UM-KECC 315 West Huron, Suite 240 Ann Arbor, MI 48103 (734) 998-9823 (phone) (734) 998-6620 (fax) [email protected] (email pertaining to DFR) www.sph.umich.edu/kecc
129

Guide to the 2008 Dialysis Facility Reports July 2008
Produced by The University of Michigan Kidney Epidemiology and Cost Center Page 28 of 29
References Andersen PK, Borgun O, Gill RD, Keiding N. Statistical Models Based on Counting Processes. New York: Springer-Verlag; 1993. See pages 334 and 406-407. Collett D. Modeling Survival Data in Medical Research. London, England: Chapman and Hall; 1994. See page 153, equation 5.6, and page 151, equation 5.1. Levey AS, Bosch JP, Lewis JB, Greene T, Rogers N, Roth D. A more accurate method to estimate glomerular filtration rate from serum creatinine: A new prediction equation. Modification of Diet in Renal Disease Study Group. Ann Intern Med 1999; 130(6):461-470. National Center for Health Statistics. Health, United States, 2007 With Chartbook on Trends in the Health of Americans. Centers for Disease Control and Prevention, Health and Human Services Dept., 176-177. NKF-DOQI Clinical Practice Guidelines for Hemodialysis Adequacy. National Kidney Foundation. Am J Kidney Dis. 1997 Sep; 30 (3 Suppl 2): S15-66. NKF-DOQI Clinical Practice Guidelines for the Treatment of Anemia of Chronic Renal Failure. National Kidney Foundation-Dialysis Outcomes Quality Initiative. Am J Kidney Dis. 1997 Oct;30(4 Suppl 3):S192-240. NKF-KDOQI Clinical Practice Guidelines for Hemodialysis Adequacy: Update 2000. Am J Kidney Dis. 2001 Jan; 37 (1 Suppl 1): S7-S64. NKF-KDOQI Clinical Practice Guidelines for Anemia of Chronic Kidney Disease: Update 2000. Am J Kidney Dis. 2001 Jan;37(1 Suppl 1): S182-238. NKF-DOQI Clinical Practice Guidelines for Hemodialysis Adequacy: Update 2006. Am J Kidney Dis. Volume 48, Supplement S1 (July 2006) pages S2-S90 NKF-DOQI Clinical Practice Guidelines for Anemia of Chronic Kidney Disease: Update 2006. Am J Kidney Dis. Volume 47, Supplement S3, Pages 146-146 (May 2006): SAS Institute Inc. 2004. SAS/STAT 9.1 User’s Guide. Cary, NC: SAS Institute Inc.: 3213-3329. Turenne MN, Loos ME, Port FK, Emmert G, Hulbert-Shearon TE, Wolfe RA, Levine GN, Daugirdas JT, Agodoa LYC, Held PJ. The impact of deaths due to AIDS, accidents, and street drugs on standardized mortality ratios (SMRs) by facility. U.S. Renal Data System and University of Michigan, Ann Arbor. Poster presented at the American Society of Nephrology, New Orleans, LA, November 1996. Abstracts – J Am. Soc Nephrol 1996;7:1467. U.S. Renal Data System, USRDS 2007 Annual Data Report: Atlas of End-Stage Renal Disease in the United States, National Institutes of Health, National Institute of Diabetes and Digestive and Kidney Diseases, Bethesda, MD, 2007. Wolfe RA, Gaylin DS, Port FK, Held PJ, Wood CL. Using USRDS generated mortality tables to compare local ESRD mortality rates to national rates. Kidney Int 1992; 42: 991-96.
130

Guide to the 2008 Dialysis Facility Reports July 2008
Produced by The University of Michigan Kidney Epidemiology and Cost Center Page 29 of 29
Wolfe RA, Ashby VB, Milford EL, Ojo AO, Ettenger RE, Agodoa LYC, Held PJ, Port FK: Comparison of mortality in all patient on dialysis, patients awaiting transplantation, and recipients of a first cadaveric transplant. N Engl J Med 1999; 341: 1725-1730. Wolfe RA, Ashby VB, Port FK.1993 DMMS comorbidity index validated by Medical Evidence Form data. J Am Soc Nephrol 2001; 11:247A.
131

Centers for Medicare & Medicaid Services
132