Embed Size (px)
Citation preview
IAEA - CANDU I&CSNERDI, Shanghai
Lesson #3: Controller TuningModule 1: Ultimate Sensitivity Method
page 3 - 1 - 1
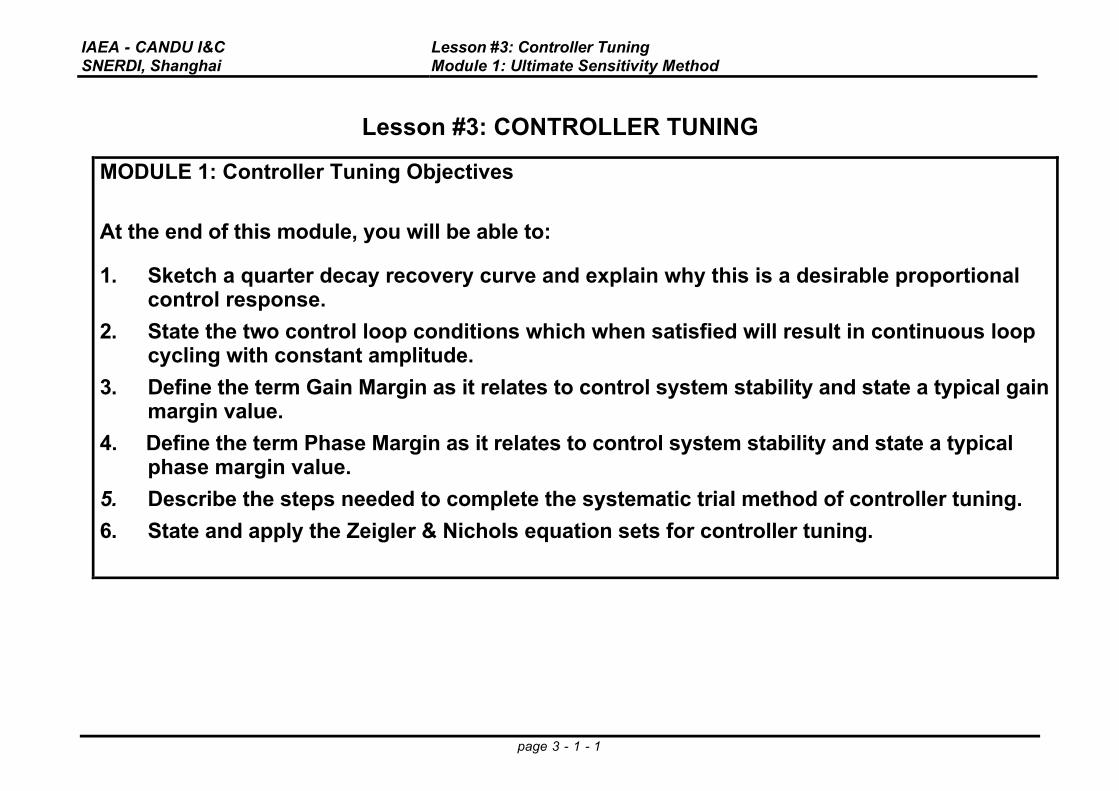
Lesson #3: CONTROLLER TUNING
MODULE 1: Controller Tuning Objectives
At the end of this module, you will be able to:
1. Sketch a quarter decay recovery curve and explain why this is a desirable proportionalcontrol response.
2. State the two control loop conditions which when satisfied will result in continuous loopcycling with constant amplitude.
3. Define the term Gain Margin as it relates to control system stability and state a typical gainmargin value.
4. Define the term Phase Margin as it relates to control system stability and state a typicalphase margin value.
5. Describe the steps needed to complete the systematic trial method of controller tuning.
6. State and apply the Zeigler & Nichols equation sets for controller tuning.

IAEA - CANDU I&CSNERDI, Shanghai
Lesson #3: Controller TuningModule 1: Ultimate Sensitivity Method
page 3 - 1 - 2
Module 1: Controller Tuning
Introduction
• We have seen that a typical controller, either pneumatic or electronic, can be provided withup to three adjustable parameters or control modes, ( proportional, integral, and derivative).
• The adjustment of these parameters is often not understood well, and so incorrect (or lessthan optimal) settings can result in a poorly performing control system.
Figure 1: Typical 1/4 Decay Proportional Response – response plus stability.
• The generally accepted performance goal for well adjusted or tuned proportional control isone that produces a quarter decay characteristic (Figure 1) following an applied upset ordisturbance. Each subsequent peak is 1/4 the magnitude of the previous peak.
IAEA - CANDU I&CSNERDI, Shanghai
Lesson #3: Controller TuningModule 1: Ultimate Sensitivity Method
page 3 - 1 - 3
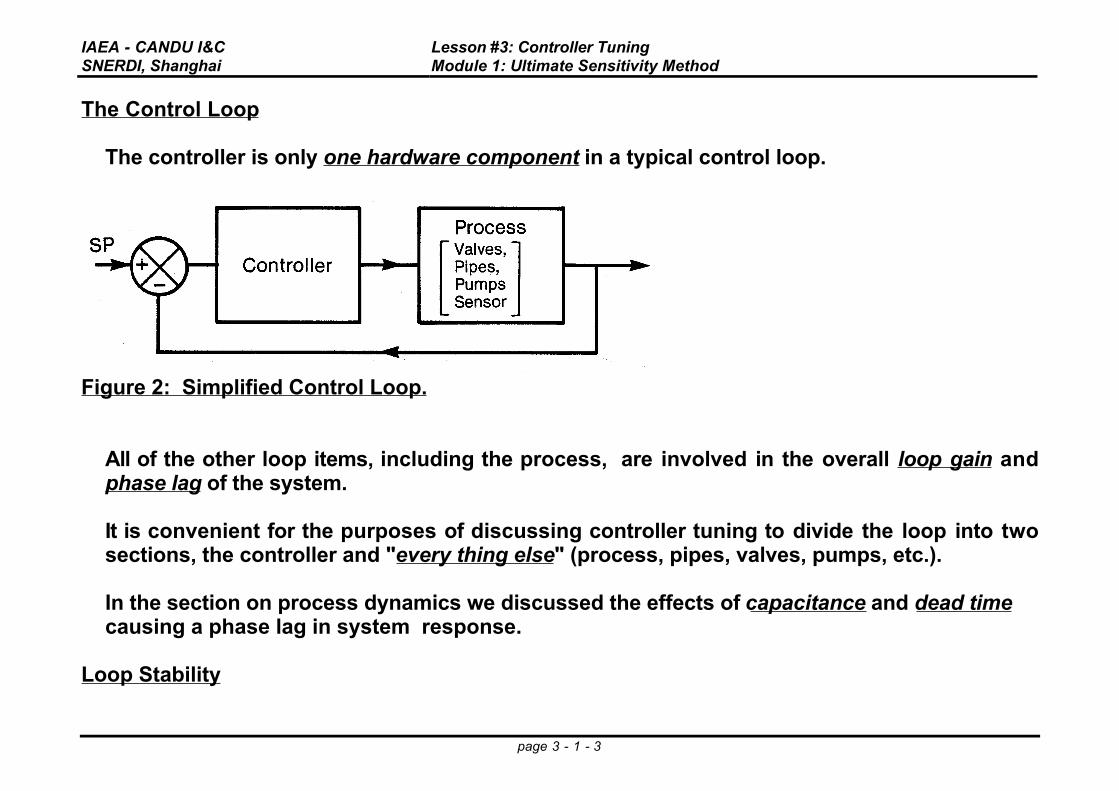
The Control Loop
• The controller is only one hardware component in a typical control loop.
Figure 2: Simplified Control Loop.
• All of the other loop items, including the process, are involved in the overall loop gain andphase lag of the system.
• It is convenient for the purposes of discussing controller tuning to divide the loop into twosections, the controller and "every thing else" (process, pipes, valves, pumps, etc.).
• In the section on process dynamics we discussed the effects of capacitance and dead timecausing a phase lag in system response.
Loop Stability
IAEA - CANDU I&CSNERDI, Shanghai
Lesson #3: Controller TuningModule 1: Ultimate Sensitivity Method
page 3 - 1 - 4
• Recall that if an additional 180° of lag, over and above the inherent negative feedback 180°lag introduced by proportional control, is applied, then we no longer have a negativefeedback system.
• We would then have constructive interference or excitation in phase with the input signaland, provided the gain is sufficient, the loop has the potential for oscillation.
• In practice it can be stated that most control loops have the ability to introduce more than180∞ of lag.

IAEA - CANDU I&CSNERDI, Shanghai
Lesson #3: Controller TuningModule 1: Ultimate Sensitivity Method
page 3 - 1 - 5
LOOP STABILITY MARGINS
• A control system will just begin to cycle when: the loop gain = 1 and the phase lag = 180 degrees.
Loop Gain KL = KC x KT x KV x KP
• The convenient means to prevent loop oscillation is the controller gain setting, althoughselection of transmitter, valve trim, valve accessories, etc. during design (and sometimesduring commissioning) is very important.
• This is why controllers must be tuned at site during commissioning once all equipment isinstalled, since each process application is usually uniquely different from any other and alldesign uncertainties can not be resolved.
Adjustable Loop Gain KL = KC x unchanged loop values
• we speak of margins to loop stability based on system gain and system phase lag

IAEA - CANDU I&CSNERDI, Shanghai
Lesson #3: Controller TuningModule 1: Ultimate Sensitivity Method
page 3 - 1 - 6
Loop Stability Margins
• The Gain Margin is the amount that the loop gain is less than 1 when the phase lag is 180degrees
• Typical open loop design Gain Margins would be 5 to 10 dB (loop gains of approximately .3to .6), where the magnitude ratio is calculated as M = 20 log10 (K) decibels
• The Phase Margin is the system lag in degrees below 180 when the loop gain is one.
• Typical open loop design Phase Margins would be 40 to 60 degrees.

IAEA - CANDU I&CSNERDI, Shanghai
Lesson #3: Controller TuningModule 1: Ultimate Sensitivity Method
page 3 - 1 - 7
GENERAL LOOP PERFORMANCE ASSESSMENT
• There are several methods available for tuning controllers - Systematic Trial & Error, UltimateSensitivity and the Reaction Curve methods.
• There should be reasonably good agreement for the tuning results from these differentmethods and you should be able to use one method as a check on another method if yourequire assurance that the tuning values make sense and are approximately correct.
When does a loop need to be tuned?
• New construction - first commissioning
• Major rehabilitation work, maintenance outages, system modifications
• Optimizing Performance - If a loop is mostly performing in a satisfactory manner( this issubjective so ensure you are conservative - that the loop has been challenged), a completeretuning may not be necessary. However, it may be possible to improve the loop's upsetrecovery performance by making small tuning adjustments and observing the results (makesure you allow enough recovery/observation time). The composite system performance canusually be improved significantly by making such small improvements to individual loops.

IAEA - CANDU I&CSNERDI, Shanghai
Lesson #3: Controller TuningModule 1: Ultimate Sensitivity Method
page 3 - 1 - 8
SYSTEMATIC TRIAL & ERROR LOOP TUNING CONSIDERATIONS
ASSESS THE GENERAL PERFORMANCE OF THE CONTROL SYSTEM.
• Talk to the operator to gain his insight into the process performance and discuss yourimpending workplan.
• It is essential that the operator know what you intend to do, and how you intend to approachthis work so that he will be in the best position to help complete the loop tuning activitieswhile still maintaining stable control of the overall process.
• Always note the active interfaces that the loop under tuning will effect.
• Also review any potential hazard conditions with the operator.
• Agree on the necessary work plan ‘back out’ conditions under which the tuning activities willbe terminated and the original settings restored.

IAEA - CANDU I&CSNERDI, Shanghai
Lesson #3: Controller TuningModule 1: Ultimate Sensitivity Method
page 3 - 1 - 9
Loop Tuning - STARTING POINT
• Note down the ‘as found’ settings for the subject controller
• Obtain a printout or trend copy of the loop performance ‘as found’ so that your startingcondition is known and documented.
• Many times, it would be desirable to be able to at least return to the safe, known startingpoint if uncertainties occur making the tuning task more difficult than expected.
• An important rule to follow is to only change one parameter at a time so the change and theimpact of that change can be assessed.
• If you begin to change too many things at one time, it will be a much more complex problemto analyze, along with a high probability for errors.
BEGIN TUNING
• If practicable, apply a small upset or perturbation to the system with the original settings, toobtain a copy of how the loop performed (disturbance response) with the initial settings(sometimes, people remember performance different from the current reality).
• Ensure that adequate time is allowed for the process to recover and stabilize - again so youare working from a known point (- know where you are starting from).
IAEA - CANDU I&CSNERDI, Shanghai
Lesson #3: Controller TuningModule 1: Ultimate Sensitivity Method
page 3 - 1 - 10
ional Adjustment
• At this time, you should now have a reasonable assessment of the process and generalstability (i.e. is it slow, sluggish or fast and very dynamic) and any past performancedifficulties.
• You should use this information to guide your controller mode setting adjustments.
• It is desirable to tune first the “proportional band”, then the “reset” or “integral” and finallythe “derivative” - in that order (if you are working with a 2 or 3 mode controller).
• Toward this goal, set the controller to manual mode (assuming there is automatic trackingand the loop was stable)
• Then set the derivative time to zero minutes (i.e. no derivative action) and as well set the resettime to infinite minutes per repeat - we now have no reset and no derivative actions
(conversely, you would set reset rate to zero repeats per minute).

IAEA - CANDU I&CSNERDI, Shanghai
Lesson #3: Controller TuningModule 1: Ultimate Sensitivity Method
page 3 - 1 - 11
PROPORTIONAL BAND ADJUSTMENT (continued)
• Next choose a proportional band setting that you think is suitably wide (low gain) to ensurestability, while still having some responsiveness for the control loop.
• Restore the controller to Automatic mode (now performing proportional only control).
• Apply a small setpoint change, say increasing by 2% (or as needed to obtain a controlresponse) and observe the process response.
• The control signal should respond in complete proportion to the control error and the valveshould stroke in response to this signal change.
• Monitor both the valve feedback signal and transmitter signal changes for smooth andcontinuous action to ensure that the loop problems are not external to the controller.
• Likely you will find that this control setting is very stable, but not very responsive and so thecontrol gain can be increased.
• Continue increasing the controller gain and ‘bumping’ the process by setpoint changes inthis manner until the optimum proportional recovery response is seen ( 1/4 decay recoverycurve). Note that the subsequent setpoint changes should be alternatively positive and thennegative so the process is maintained near the desired operating point.
• If the gain had been increased so much that the loop begins to cycle, widen the proportionalband setting until loop stability is again achieved.
• Note (i.e. record it) the optimum proportional band setting found at this time.

IAEA - CANDU I&CSNERDI, Shanghai
Lesson #3: Controller TuningModule 1: Ultimate Sensitivity Method
page 3 - 1 - 12
RESET MODE ADJUSTMENTS
• If you are now going to adjust the reset mode, it is important to widen the previously foundoptimum proportional band somewhat (say by 10% of present setting) since reset is adestabilizing mode - otherwise you could force the loop to cycle.
• Recall that Reset mode increases the low frequency loop phase lag and increases the lowfrequency loop gain
• Again - with the controller in manual mode, (with the %PB widened as suggested) begin todecrease the reset time setting and then restore the controller to automatic.
• Based on your knowledge of the process, you can select an appropriate reset time (i.e. if theprocess is fast responding, you can use a fast reset time, say 0.1 minutes per repeat, if theprocess is slow responding, you should use say 10 Minutes per repeat).
• Monitor the control loop response as the process is forced back toward the setpoint by resetaction.
• Make sure you allow enough time for the process to completely recover.
• The desired response can be achieved my adjusting the reset time since the proportionalgain is not being changed.
• Once the process is restored to the setpoint in an optimum recovery manner, that reset timeshould be recorded. along with the widened proportional band setting.

IAEA - CANDU I&CSNERDI, Shanghai
Lesson #3: Controller TuningModule 1: Ultimate Sensitivity Method
page 3 - 1 - 13
DERIVATIVE MODE ADJUSTMENTS
• If this control application has derivative mode, the derivative time setting can now beincreased in a systematic manner as described previously for proportional plus reset modes,with the controller set to manual mode.
• The derivative time should be gradually increased (i.e. start with say .01 or 0.1 minutes) andthe corresponding loop upset response should be observed.
• You should see larger control signal response to a dynamic error condition with smallerresultant process deviations (due to the larger magnitude control corrections).
• Once the desired coordinated mode response is achieved, the controller proportional bandcan be reduced somewhat as derivative is a stabilizing factor
• Derivative mode reduces the system high frequency phase lag and increases the highfrequency gain.
• Similarly, a faster reset time can now be used due to the compensating effect of derivative.
• This means that a few more iterations are necessary once the apparent final settings areobtained to see (this is a subjective exercise) if a better combination of gains and settingtimes can be obtained.
IAEA - CANDU I&CSNERDI, Shanghai
Lesson #3: Controller TuningModule 1: Ultimate Sensitivity Method
page 3 - 1 - 14
SYSTEMATIC TRIAL METHOD CONCLUSION
• At the end of the control mode adjustment process, you should disturb the process further(larger magnitude) in both directions to ensure that the final composite settings are stable.
• If possible, operation at other (preferably known difficult) conditions should be confirmed.
• All findings, observations and trends or records from the tuning exercise should be collectedand organized.
• You should also have a closeout discussion with the operator to advise him of the newsettings, the expected performance and to confirm that he is satisfied with the performanceof the adjusted loop.
• You should also confirm with the operator that none of the interfaced loops have beenadversely effected by this tuning exercise.
• You should leave the operator with a record of the ‘as found values’ and the ‘as left values’.
• Upon returning to your work area, you should make a brief work report describing what youdid and what you observed and summarize the findings (are they what you expected?).
• This sort of information will be invaluable later on during plant operations if a relatedproblem occurs - the intent here is to try to capture the benefit of work done for futurereference purposes.

IAEA - CANDU I&CSNERDI, Shanghai
Lesson #3: Controller TuningModule 1: Ultimate Sensitivity Method
page 3 - 1 - 15
Systematic Trial & Error LOOP TUNING SUMMARY1. Review workplan and strategy with operator
2. Record ‘as found’ conditions and settings, and performance of interfacing systems
3. Switch controller to manual and turn off reset and derivative modes
4. Choose a widen Proportional Band (PB) Setting
5. Switch controller to Automatic and apply a setpoint shift (positive & negative shifts)
6. Monitor control and process responses - look for smooth continuity, allow adequate time
7. Repeat narrowing proportional band until optimum PB response is achieved
8. Record selected PB settings
9. If adjusting Reset mode - widen PB by 10% of present value
10. Systematically decrease Reset time until PI optimum response is obtained
12. If adjusting Derivative mode, systematically increase Derivative time
13. Assess overall performance (Narrow PB and faster Reset time as practical)
14. Confirm expected loop performance with larger setpoint shifts (+ve and -ve)
15. Collect data and findings
16. Discuss ‘as left’ settings with operator, explain expected response
17. Leave a record of both ‘as found’ and ‘as left’ settings for the operator
18. Confirm interfacing systems are functioning as expected
19. Prepare a short work report to summarize findings, settings
ULTIMATE SENSITIVITY TUNING METHOD

IAEA - CANDU I&CSNERDI, Shanghai
Lesson #3: Controller TuningModule 1: Ultimate Sensitivity Method
page 3 - 1 - 16
• A method which illustrates the principle of controller tuning very well is the one developedand described by Ziegler and Nichols in 1942.
• This is termed the Ultimate Sensitivity Method. The process must be able to cycle to applythis methodology - no stability recovery concerns must exist.
• One attraction of the Ziegler-Nichols method is that it was empirically derived as a result ofobservations carried out on many control loops and it presents a simpler method of tuningthat is less experience intensive.
• Based on the fact that most control systems in closed loop mode (automatic) can be made tooscillate if the controller gain is increased progressively.
• If the system is made to oscillate at constant amplitude, then the overall loop gain is one.
• The setting of controller gain used to cause a loop gain of one is termed the UltimateProportional Band (PBu).
• If the proportional gain is further increased the amplitude of the oscillations willprogressively increase (unbounded) .
• If the gain is reduced the oscillations will eventually attenuate. This is shown in Figure 3.

IAEA - CANDU I&CSNERDI, Shanghai
Lesson #3: Controller TuningModule 1: Ultimate Sensitivity Method
page 3 - 1 - 17
LOOP RESPONSE TO CONTROL GAIN CHANGES
Figure 3: Responses to Varying Proportional Gains.
IAEA - CANDU I&CSNERDI, Shanghai
Lesson #3: Controller TuningModule 1: Ultimate Sensitivity Method
page 3 - 1 - 18
PROCESS PERIOD• There is another piece of information available from this method. It is the period of the
process oscillation and it is representative of the natural frequency of the system.
• We will require this process period information to determine the best reset and derivativesettings which are time related.
ULTIMATE SENSITIVITY TUNING METHOD
1. While in manual mode turn off, or increase reset time to maximum (if in MPR) or decreasereset rate (RPM) to minimum. Similarly switch off derivative or reduce derivative time tominimum value and then set the proportional control to some arbitrary wide PB setting.
2. With the controller in automatic mode, subject the process to a small upset (shift thesetpoint to a new value)
3. If the response curve obtained from step 2 (recorder trend or CRT printout), does notdamp out then the loop gain is too high (PB too narrow). Otherwise, the control gainsetting should be reduced, (try halving the %PB, when in manual mode) and then repeatstep 2.
4. If the response curve from step 2 damps out (upper and centre graphs), then the loop gainis too low (PB too wide) and the control gain must be increased.
5 . Repeat the tuning process steps with different gains until constant amplitude processcycling is obtained. This PB setting is the PBu, and note the process ultimate period (Pu).

IAEA - CANDU I&CSNERDI, Shanghai
Lesson #3: Controller TuningModule 1: Ultimate Sensitivity Method
page 3 - 1 - 19
SUMMARY
• The PB at which the constant process cycling occurs is recorded, and is the UltimateProportional Band (PBu).
• Also recorded is the process Ultimate Period (Pu), the time taken, in minutes, for one cycle ofprocess oscillation.
Applying the Ziegler and Nichols formulae.(1). PROPORTIONAL CONTROL only:
A 1/4 decay curve will be obtained if the PBu is doubled,(i.e. the gain is halved).
PB = 2.0 x PBu
(2). PROPORTIONAL PLUS RESET (P + I):
Recall overall gain must be reduced slightly when using Integral mode:
PB = 2.2 x PBu, Reset = Pu / 1.2 (MPR)
The reset time is the ultimate process cycle period (Pu) in minutes divided by 1.2
(3). PROPORTIONAL PLUS RESET PLUS DERIVATIVE (P + I + D)
PB = 1.6 PBu, Reset = Pu / 2 (MPR), Derivative = Pu / 8 (Mins)
The derivative time is the ultimate process cycle period (Pu) in minutes divided by 8

IAEA - CANDU I&CSNERDI, Shanghai
Lesson #3: Controller TuningModule 1: Ultimate Sensitivity Method
page 3 - 1 - 20
EXAMPLE APPLICATION of the Ziegler and Nichols formulae.
A temperature control loop is to be tuned by the Ziegler-Nichols method. It was found that theprocess cycled, at constant amplitude, with a PBu of 12% and an ultimate period of 22 Minutes(Pu). What would be the suggested Z&N settings for a three mode (P + I + D) controller?
The Zeigler and Nichols formulae for a three mode controller is:
P = 1.6 PBu
Proportional setting = 1.6 x 12 = 19.2% (perhaps 20% setting as possible)
R = Pu / 2 (MPR)
Reset setting, R = 22 / 2 = 11 MPR
D = Pu / 8 (Mins)
Derivative setting, D = Pu / 8 = 22/8 = 2.75 Minutes(perhaps 2.7 or even 2.5 minutes depending on graduations)

IAEA - CANDU I&CSNERDI, Shanghai
Lesson #3: Controller TuningModule 1: Ultimate Sensitivity Method
page 3 - 1 - 21
THE REACTION CURVE TUNING METHOD
• This third controller tuning method is worth noting in that this method only requires oneupset to be applied to the process - it is not necessary to subject the process to a cyclingcondition.
• This approach requires that the loop be opened (say place the control in manual mode sothat continual feedback control is not available)
• The process is then subjected to a step input change by open loop command.
• The resultant process reaction curve to this input disturbance is then plotted and analyzed todetermine the best controller settings for the application.
• The following information must be noted or obtained as the tuning method is applied:
1. the magnitude of the change in final device posiiton in percent( %cvp - % change in valve position )
2. the lag time from step change application until process response is seen( L - process time lag in minutes ) - this is the approximate system dead time
3. the process reaction rate approximation( R - %process change per minute )

IAEA - CANDU I&CSNERDI, Shanghai
Lesson #3: Controller TuningModule 1: Ultimate Sensitivity Method
page 3 - 1 - 22
THE REACTION CURVE TUNING METHOD (continued)
• The reaction curve rate is found by sketching the tangent to the reaction curve point ofinflection and then finding the slope of that line.
• The process reaction rate R is calculated in % of process change per minute from thistangent line slope.
• The reaction curve tangent line should be extended to the time line to allow thedetermination of the process time lag. The time (T0) from step change application start untilthe intercept of the reaction curve tangent point (Tl) is the time delay lag value;
L = Tl - T0 determined in minutes.
• These values can now be used to determine the controller settings:
%cvp = % of change in final control device applied
R = rate of change in process reaction curve (% per minute)
L = process lag approximation seen from step change application
REACTION CURVE SETTINGS

IAEA - CANDU I&CSNERDI, Shanghai
Lesson #3: Controller TuningModule 1: Ultimate Sensitivity Method
page 3 - 1 - 23
A. STRAIGHT PROPORTIONAL:
%PB = [100 * R * L] / %cvp
Note #1: if the process reaction rate R is very large (responsive process), or the dead time L isquite long , then the %PB setting will be compensatingly large (i.e. a low control gain)
B. PROPORTIONAL PLUS RESET
%PB = [110 * R * L] / %cvp , Reset = 3.3 * L (MPR)
Note #2: the %PB setting for P+I is wider than for straight P since Reset is a destabilizing mode
Note 3: The longer the process dead time, the slower the reset time becomes
C. PROPORTIONAL PLUS RESET PLUS DERIVATIVE
%PB = [83 * R * L] / %cvp , Reset = 2 * L , Derivative = 0.5 * L
Note 4: the %PB setting for PID is narrower than P only as derivative is a stabilizing mode
Note 5: the longer the process dead time, the larger the derivative time becomes

IAEA - CANDU I&CSNERDI, Shanghai
Lesson #3: Controller TuningModule 1: Ultimate Sensitivity Method
page 3 - 1 - 24
REACTION CURVE METHOD EXAMPLE
Assume that a temperature process is found to have a Reaction Rate R of 10%/Min for anapplied step change of 2.1 % in Control Valve position. The effective process dead time isfound to be 30 seconds.
Reaction Curve Formula for PROPORTIONAL PLUS RESET PLUS DERIVATIVE
30 seconds = 0.5 minutes dead time
%PB = [83 * R * L] / %cvp
%PB = [83 * 10 * 0.5] / 2.1 = 415 / 2.1 = 197.6% (likely 200 %)
Reset = 2 * L
R = 2 * 0.5 = 1 MPR
Derivative = 0.5 * L
D = 0.5 * 0.5 = 0.25 Minutes
Reaction curve 3 mode settings are: PB = 200%, R = 1 MPR, D = 0.25 Min

IAEA - CANDU I&CSNERDI, Shanghai
Lesson #3: Controller TuningModule 1: Ultimate Sensitivity Method
page 3 - 1 - 25
CHAPTER 8 MODULE 1: CONTROLLER TUNING ASSIGNMENT
1. Sketch a quarter decay recovery curve and explain why this is a desirable proportionalcontrol response.
2. State the two control loop conditions which when satisfied will result in continuous loopcycling with constant amplitude.
3. Define the term Gain Margin as it relates to control system stability and state a typical gainmargin value.
4. Define the term Phase Margin as it relates to control system stability and state a typicalphase margin value.
5. Describe the steps needed to complete the systematic trial method of controller tuning.
6. State and apply the Zeigler & Nichols equation sets for controller tuning.
7. A level control system is tuned by the Ziegler-Nichols method. The PB setting for constantamplitude cycling was 20%. The process cycled with an ultimate period of 1.8 minutes.What would be the Ziegler-Nichols settings for P + I control?
8. State and apply the Reaction Curve equation sets for controller tuning.
9. Briefly review each control mode (proportional, reset and derivative) with respect to loopgain and loop phase lag to describe how the inclusion of that mode will effect loopstability.

IAEA - CANDU I&C Lesson #3 DCC FeaturesSNERDI, Shanghai
Page 3 - 2 - 1
CANDU Control Computer System
• Computers perform all major monitoring, annunciation and control functions in the CANDU nuclear power plants.
• Figure 1. shows a simplified schematic of a dual-redundant control computer system (i.e. this means there are two computer systems, eitherwhich is individually capable of completing the assigned control task successfully).
• The two central control computers, with near identical inputs and outputs, operate in a master/standby configuration - so that eithercomputer system can control the plant when called upon to do so.
• The outputs from the computers are wired through interlocking logic so that only the outputs from the controlling (i.e. master or in-control)machine are connected to the field.
• The active computer must recognize and confirm that it is in control and then will assume the role of master computer. In this manner themaster computer is able to energize the output controlling switching relays.
• The disabled computer, having failed either the program (application S/W) or the computer itself (platform H/W), is unable to satisfy the ‘in-control’ or ‘Master’ logic requirements and so can not energize the necessary output controlling relays.

IAEA - CANDU I&C Lesson #3 DCC FeaturesSNERDI, Shanghai
Page 3 - 2 - 2
Figure #1 - A Dual Redundant Control Computer Configuration

IAEA - CANDU I&C Lesson #3 DCC FeaturesSNERDI, Shanghai
Page 3 - 2 - 3
Wiring the Controlling Computer to the Field Device
• By wiring the ‘Master in-control’ logic via normally-open (N.O.) contacts in series with the ‘not in control’ normally-closed (N.C.) contactsallows only the designated Master Computer to access the field.
• For example allow that DCC-X signal outputs are routed through a N.O. DCC-X controlled relay (say contact xc1 of relay #1) contact andthen through a N.C. DCC-Y controlled relay (say yc1 of relay #2) contact before being wired to the field device.
• In this way, with DCC-X in-control, relay #1 will be energized causing contact xc1to close and relay #2 will be de-energized causing contact
yc1 to also be closed so that both contacts in the circuit to connect DCC-X to the field are closed.
• Similarly, allow that DCC-Y outputs are routed through a N.O. DCC-Y controlled relay (say contact yc2 of relay #3) contact and thenthrough a N.C. DCC-X controlled relay (say contact xc2 of relay #4) contact before being wired to the field device.
• In this way, with DCC-X in-control, relay #4 will be energized causing contact xc2 to open and relay #3 will be de-energized causingcontact yc2 to also be open so that both contacts in the circuit to connect DCC-Y to the field are opened . DCC-Y is not connected to thefield since DCC-X is in-control.
• On detection of a disabling program or computer fault, that computer is no longer able to satisfy the logic conditions for being ‘in-control’and so is unable to energize its output signal selection control relays.
IAEA - CANDU I&C Lesson #3 DCC FeaturesSNERDI, Shanghai
Page 3 - 2 - 4
Determination of the Controlling Computer
• At the same time, the former standby computer is able to now fulfill the ‘in-control’ logic requirements and so is able to energize its outputcontrol relays.
• The change in state of these output control relays then switches the control of the field devices from the former master computer to theprevious standby machine completing the automatic transfer from say DCC-X to DCC-Y.
• Each computer is fully capable of individually running the plant independently and the operator can select the desired ‘master’ computer byhandswitch control.
• The two machines are connected by a data-link which can transmit non-essential information for annunciation and display purposes.
• Both computers provide CRT based operating displays and log sequential operational information resulting from normal operations or anevent.
• Computerized alarm information is displayed on the central annunciation CRT’s.
• Stylized system displays and graphical updates (analog trends, bar charts, point data, etc) are provided on the system panel and the consoleCRT’s.

IAEA - CANDU I&C Lesson #3 DCC FeaturesSNERDI, Shanghai
Page 3 - 2 - 5
Computer Program Checks
• Either computer can drive any of the CRT displays and the two annunciation CRT’s - usually the ‘Master’ computer is selected to drive theseCRT’s but the standby computer can be selected to cross-check indications that are being obtained.
• It is important to indicate (at all times) which Computer information is being displayed as well as showing which computer is in control.
• The computer system checks for faults at the program level (i.e. are the conditions satisfied necessary to allow this program to runautomatically?) and at the computer system level (i.e. are the correct power supplies available for the computer, are expected operationsbeing performed, necessary interfaces available and are operations being performed within the expected time slice, etc).
• External countdown registers are used to schedule programs and to time their execution.
• A program will fail (i.e. not satisfy the requirements for continued operation) if it does not execute within a specified time interval or if aspecified number or combination of its inputs are not deemed to be rational.
• At the system level, a machine fails if it does not update a watch-dog timer within a specified time interval, if a fault is detected in theinput/output subsystem or if a memory parity fault is detected.
• On a system fault, all digital outputs for that computer are opened, the analog outputs are set to the fail-safe condition (usually zero signal),and control is automatically transferred to the standby machine.

IAEA - CANDU I&C Lesson #3 DCC FeaturesSNERDI, Shanghai
Page 3 - 2 - 6
Control Computer Availability
• Each computer continuously performs extensive self-check tests on its peripheral hardware (i.e. analog inputs or outputs, etc) and on itsinternal computer components (i.e. CPU, ALU, memory, etc).
• Minor faults are annunciated to the operator or maintenance staff (as appropriate) for repair purposes while major faults will initiate thetransfer of control logic so that the ‘in-control’ status is relinquished to the standby computer.
• The design approach is to avoid the loss of monitoring, control or annunciation due to the occurrence of one single failure.
• In keeping with this philosophy, most sensors are duplicated or triplicated as is appropriate for the application.
• For duplicated measurements, the average value is used if the two signals are in good agreement, otherwise the most conservative value toensure the safest decision (i.e. say the highest pressure) is selected for control sensing.
• Where triplicated signals are provided and they are all rational, then the median signal is selected for control sensing. Otherwise, theunacceptable parameter is rejected and annunciated as being irrational and the signal selection reverts to that of a duplicated system.
• Redundancy is also provided for the final devices so that control valves can be driven in parallel or configured in a master/standby manner.
• In addition, interchannel and computer to computer comparisons will check for differences in signals, thus facilitating early recognition andmaintenance of signal degradations.
• This information monitoring and the ability to perform on-line maintenance contributes significantly to the high capacity factors achievedby CANDU plants.

IAEA - CANDU I&C Lesson #3 DCC FeaturesSNERDI, Shanghai
Page 3 - 2 - 7
ANNUNCIATION and DISPLAY FUNCTIONS
• A wide variety of display functions are available to the operator. These include:n annunciationn graphical trendsn bar chartsn status displaysn schematic displaysn point data displaysn summary data displays
• A standard keyboard interface to the computer driven CRT system has been developed for all of the operator information functions. Thiskeyboard is the operator’s prime means of communicating with the computer system.
• The CANDU main control room operations keyboard is divided into three groups:n numeric keys for data entryn function keys to initiate displaysn keys for operator functions
• The labeled, special function select keys provide very rapid access to the various system data formats associated with each CRT.
• Typically the computer display response time to an operator request for a new data format is less than one second.
• Changes to data (that are allowed for the operator) stored in the computer such as control setpoints or alarm limits and changes forparameters appearing on a trend or bar chart; are done by the numeric key pad and control keys.

IAEA - CANDU I&C Lesson #3 DCC FeaturesSNERDI, Shanghai
Page 3 - 2 - 8
Figure 2. Typical Computer Control Keyboard Layout

IAEA - CANDU I&C Lesson #3 DCC FeaturesSNERDI, Shanghai
Page 3 - 2 - 9
ANNUNCIATION CRT DISPLAYS
• Early traditional designs used hardwired alarm windows located above the control panels to annunciate faults.
• These alarm windows, although effective at attracting the operator’s attention, provide limited information and are impractical when a lot ofalarms are needed.
• In current designs, the hardwired windows alert the operator of the general occurrence of an important fault while further details areprovided by the annunciation CRTs.
• The annunciation data can now be manipulated as any batch data system to prioritize the display of alarms as well as to logically group thealarm messages, allow unique summaries to be prepared and to link the alarms to necessary follow-up operating or maintenance actions.
• During a plant upset (such as a reactor trip or stepback) minor alarms (i.e. low priority) are inhibited from being displayed on the CRT -only major (i.e. high priority) alarms are presented until the upset has cleared.
• This prevents the CRT from being ‘flooded’ with messages during critical recovery periods while allowing the operator to respond to thosealarms which are more important for station operations.
• However, all alarms with their time of occurrence and the unique alarm reference number are all saved to disc. At the operator’s request, a
summary of all existing alarms on a system or total plant basis can be displayed and this summary can be reviewed on the CRT or printedout for further review or documentation purposes.

IAEA - CANDU I&C Lesson #3 DCC FeaturesSNERDI, Shanghai
Page 3 - 2 - 10
GRAPHICAL TREND DISPLAYS
• Graphical trends display the status and change of a parameter in a continuous analog manner with respect to a selected time frame andmagnitude scaling.
• Historic data may also be retrieved from disc storage to review a previous operating event. The operator specifies the time period of interestand the scale range for the display and a static display of the request is prepared.
• Different variables in the graphical trends are identified by colour to assist the operator’s discrimination.
• Parameters can be set up by default to have pre-selected ranges and time servicing or those attributes can be uniquely set.
• Similarly, the option of dummy variables is provided so that the operator can link any parameter to that dummy trend.
• Parameters can also be specified as part of the automatic historical logging process (so that previous performance can be assessed) or as atemporary parameter (i.e. not historical) so that viewing the trend is only possible if that parameter has been selected for display.
BAR CHARTS
• Up to sixteen signals can be displayed on a bar chart, each having an identification code, scale values, alarm limits, current value andunits.
• This approach allows high density displays of multiple similar parameters from which any variance can very easily be seen.

IAEA - CANDU I&C Lesson #3 DCC FeaturesSNERDI, Shanghai
Page 3 - 2 - 11
OTHER DISPLAYS
• A variety of special purpose displays are unique to particular systems and operating conditions. For some displays, the data processingcapabilities of the computer system provide information not normally available with conventional instrumentation.
• For instance, a dynamic plot of the reactivity control system operating point relates the reactor power control error to the average liquidzone level on an X-Y display to show the action points for initiating the various control mechanism operations - this provides an easy tounderstand overall reactivity control mechanism coordination.
• Similarly, a plant block schematic diagram with superimposed operating data provides an overall plant condition status indication withnavigation icons to allow direct access to the associated subsystem displays.
• CRT plant displays can be assessed by operators in an on-going manner so that operational feedback can be used to modify existing displaysor to create new ones to achieve an enhanced operations performance.
• Such a plant-wide summary display also provides an understandable navigation approach to allow the operator to quickly and convenientlyselect major system displays from one central coordinating display so as to maintain unit status continuity knowledge.

IAEA - CANDU I&C Lesson #3 DCC FeaturesSNERDI, Shanghai
Page 3 - 2 - 12
CANDU DCC Assignment
1. Explain the term dual-redundant by referencing the Master/Standby DCC configuration as a practical example.
2. Make a simple sketch to show how interfacing relays can be used to ensure that only one computer (the one identified as the present Mastercomputer) can be connected to the field output device while the standby computer is disconnected by this same logic.
3. Explain briefly how the provision of a data cross-check feature between two computers can help the operator to very quickly recognize apotential problem condition.
4. What is the function of a ‘watch-dog’ timer in a digital control application?
5. Why can the variation of a parameter in a triplicated measurement system be recognized and identified as a problem much more easily than isthe case in a duplicated measurement system?
6. Why is it important to display the computer-in-control identification at all times for a redundant computer system?
7. What purpose would a two key sequence (i.e. enter key and execute key) serve when made as a requirement to complete a control data entryaction? If this is a good idea for control data entries. why not make it a requirement for all operator data entires?
8. Provide an illustrative list of five (5) CRT display types that can be provided for operators and briefly describe their main features.
9. What information do you think is essential to be included in a CRT alarm message? Explain the four or five key information features that youwould recommend as being essential to efficiently advise an operator of a potential problem situation. How should this information be presentedto best help the operator understand the new situation?

IAEA - CANDU I&C Lesson #3 DCC FeaturesSNERDI, Shanghai
Page 3 - 2 - 13
CANDU DCC Assignment – sample answers
1. Explain the term dual-redundant by referencing the Master/Standby DCC configuration as a practical example. Dual-redundant is a designstrategy to provide two completely functional devices, either of which is capable of performing the assigned mission. Should one device fail, theother would be able to assume control providing uninterrupted automatic action.
2. Make a simple sketch to show how interfacing relays can be used to ensure that only one computer (the one identified as the present Mastercomputer) can be connected to the field output device while the standby computer is disconnected by this same logic. The key idea here is tohave the designated Master actively enable its devices (so use N.O. configuration for these) while the standby passively allows connection (souse N.C. configuration there). If the Master is enabled (N.O. contact will close) and the standby is disabled (N.C. contact will close) – allowingthe circuit connecting the Master DCC to be completed to the field.
3. Explain briefly how the provision of a data cross-check feature between two computers can help the operator to very quickly recognize apotential problem condition. Usually, there should be good agreement between the values obtained for both computers –so if differences insimilar parameters on two computers are recognized, then this is one indicator that a potential problem exists – perhaps the measurement isdifferent due to testing or maintenance (and it shouldn’t be), or a ground fault has changed the reading, or a transmitter fault, or Inputconversion problem etc - in any event, such a discrepancy should be investigated.
4. What is the function of a ‘watch-dog’ timer in a digital control application? The watch-dog timer is a separate (from the computer) counterwhich can keep track of execution cycle durations and independently disconnect that computer if the time threshold is not achieved – in thisway, the plant operation is guarded against stuck routines or processors that would otherwise prevent expected loop servicing.
5. Why can the variation of a parameter in a triplicated measurement system be recognized and identified as a problem much more easily than isthe case in a duplicated measurement system? In a duplicated system, if there is not good agreement between two indicators we only know thatthere is a problem but we do not know which parameter is the most trustworthy without making further inference comparisons. In a triplicatedsystem, if one parameter drifts away, the other two will be in good agreement and so we can use a majority agreement rule and immediatelyknow that the one which has drifted is the problem parameter.

IAEA - CANDU I&C Lesson #3 DCC FeaturesSNERDI, Shanghai
Page 3 - 2 - 14
6. Why is it important to display the computer-in-control identification at all times for a redundant computer system? This information should bedisplayed so that the operator knows that information read or entered to a computer that is not in control will not effect plant operations. Thiscan be a problem if for example the operator entered a manual command and was expecting to see plant response when in fact no change ismade to the operating unit.
7. What purpose would a two key sequence (i.e. enter key and execute key) serve when made as a requirement to complete a control data entryaction? If this is a good idea for control data entries. why not make it a requirement for all operator data entries? The two key sequence requiresthat the operator actively confirms the entry of a desired change so that inputs are not casually made. This provides an error catching step to besure that the operator, for example, does want to raise power at a particular rate.
8. Provide an illustrative list of five (5) CRT display types that can be provided for operators and briefly describe their main features. Plantoverview display, system display, device status, point data, trend display, annunciation summary, bar chart display.
9. What information do you think is essential to be included in a CRT alarm message? Explain the four or five key information features that youwould recommend as being essential to efficiently advise an operator of a potential problem situation. How should this information be presentedto best help the operator understand the new situation?The parameter, the limit exceeded, the system name or identification number, the time & date, any procedural cross references.