Embed Size (px)
Citation preview

Les enjeux de l’urbanisation du monde
Jean-Jacques HELLUIN – Mars 2008

1 - L’urbanisation du monde, un phénomène :- mal connu, - mal décrit, mal analysé- mal aimé…mais cela change peut- être ?
2 - Un rapide état des lieux de l’urbanisation du monde- quelques données fondamentales- le défi majeur des 40 prochaine années
3 - L’urbanisation comme moteur de la croissance économique- urbanisation et croissance économique vont ensemble- les villes comme lieux de lutte contre la pauvreté
4 – La croissance économique comme le moyen de rendre les villes durables ?- villes et courbes de Kuznet environnementales : ça marche ?- une course-poursuite est engagée entre croissance des revenus, croissance de la population urbaine, et croissance de l’espace consommé
5 - Quelques débats (anciens et nouveaux) qui ne font que commencer ....- qui parle ? Les acteurs de l’urbain au niveau mondial- importance de l’aide au developpement et d’une approche positive et systémique de la ville en développement- les défis des infrastructures, de la forme urbaine, du changement climatique (le combat sera gagné – ou perdu – dans les villes) et des inégalités socio-spatiales
Jean-Jacques HELLUIN - Mars 2008

1 - L’urbanisation du monde, un phénomène :
- mal connu, - mal décrit, mal analysé- mal aimé…mais cela change peut-être ?
Exemples de problèmes avec les données urbaines
• Dans le rapport statistique 2006 des Nations Unies, pour 20 pays Africains il n’ya pas eu de recensements depuis 1993
• Confusions courantes dans les notions, par exemple entre urbanisation (taux et processus) et croissance urbaine (nombre absolu)
• Les bases de données comparatives sur les villes au niveau mondial sont peu nombreuses et assez peu fiables (d’ou l’initiative en cours de la Banque Mondiale)
• La difficulté fondamentale de la délimitation de la ville ou du fait urbain

0
5
10
15
20
25
30
35
0 5 10 15 20 25 30 35
1973 pour 2000
2003 pour 2000
Tokyo
MexicoSao Paulo
Dhaka
New-York
Graphique : Helluin, 2008Données : UN 1973 – 2006 ; Sattherwaite, 2007
Population des grandes villes : les erreurs de prévision de l’ONU

Exemples de variabilité du nombre d’habitants des villes en fonction de la définition utilisée

Source : Columbia University in the City of New York, 2005. Center for International Earth Science Information NetworkGridded Population of the World : http://beta.sedac.ciesin.columbia.edu/gpw/
Une nouvelle approche / les données par grille du Earth Institute (Columbia Univ.)


Quelques idées faussescourantes sur l’urbanisation...
- L’urbanisation serait la cause du sous-développement dans certainspays
- Les politiques et stratégies urbaines seraient coûteuses et non productives
- Il faut arrêter “l’exode rural”, par tous les moyens (ex: permis d’habiteren ville)
- Les politiques agricoles sont des stratégies endogènes capables d’initierle processus de développement alors que les politiques urbaines sontexogènes et ne peuvent initier le développement
- “Il est clair que l’échelle et la profondeur de la pauvreté urbaine sonthautement sous-representees dans de nombreuses statistiquespubliques et pour certains chercheurs – une des raisons étant le mauvais usage des seuils de pauvreté pour les populations urbaines”(Satterthwaite, David (2004), The Under-estimation of Urban Poverty in Low and Middle-Income Nations, IIED Working Paper 14 on Poverty Reduction in Urban Areas, IIED, London, 69 pages.)

Source : Ravallion, Chen, Sangraula. New Evidence on the Urbanization of Global Poverty . World Bank Policy Research Working Paper 4199, April 2007.
Poverty is becoming more urban over time (e.g. the urban share of the $1 a day poor is rising at about 0.6% points per year over 1993=2002, though these findings hold up less well for the $2 day line.On the whole, urbanization has played a positive role in overall poverty reduction by providing new opportunities to rural migrants and through second-round impacts of urbanization for those who remain in rural areas. Future projections indicate increases in urban poverty, but globally the majority of the poor will still be found rural areas for some decades to come (~2040 for the $1 per day line, ~2080 for the $2 per day line).

Le biais anti-urbainChez les intellectuelsDans les institutions internationales
Most influencal work on urban bias : Lipton, Michael (1977), Why Poor People Stay Poor – Urban Bias in World Development, Temple Smith,London. While the reality is more a “middle- and upper-income group, large-city bias” (Hardoy and Satterthwaite, 1989)

Paul Delouvrier, leading planner of the Paris Region
Chez les planificateurs (texte de Bernard Marchand, WB 2007)
Dans les écoles
Dans les politiques publiques (Allaire , PhD, 2007, p. 102)
Le biais anti-urbain - 2

Stratégie urbaine de la Banque Mondiale
Affiche de Cities Alliance
Africités 2006
•« en Afrique Sub-Saharienne, les villes sont à l’origine de plus de 80 % de la croissance économique ; plus de 80 % des créations d’emploi sont le fait du secteur informel ; et l’urbanisation est l’un des principaux moteurs de la modernisation de l’agriculture et de la croissance des revenus en milieu rural »Christine Kessides dans le rapport intitulé “The Contributions of Urban Development to Economic Growth and Poverty Reduction in Sub-Saharan Africa”, (2004)
Mais de nouveaux discours commencent à se faire entendre…

2 - Un rapide état des lieux de l’urbanisation du monde

Des faits sans précédents :
• Le rythme d’urbanisation• La taille et le nombre des grandes villes• Les nations riches avaient la plupart de la
population urbaine du Monde –Maintenant c’est le contraire


Urban Rural Population Growth to 2030 Low and Middle Income vs. High Income CountriesSource: National Research Council. 2003. Cities Transformed: Demographic Change and Its Implications for the Developing World. Panel on Urban Population Dynamics, M.R.

With an annual urban growth rate of 1.8 per cent, nearly double that projected for the total population (1 per cent), the world’s urban population is expected to increase from 3.2 billion in 2005 to 4.9 billion in 2030, when 60 per cent of the global population is expected to live in urban areas.
Source : UN – World Urbanization Prospect: The 2005 revision population database

Distribution of Urban Population Growth to 2015 by City Size
Source : Annez, Huet, Peterson. World Bank 2007- Operational Lessons for the Urban Century: Urban Infrastructure Funds in World Bank Lending Operations 1979-2006

Source : UN – World Urbanization Prospect: The 2005 revision population database
Average size of the world’s largest 100 cities, 1800, 1850, 1900, 1950 and 2000

Source : David Satterthwaite, The transition to a predominantly urban world and its underpinnings. IIED, 2007

NORTH AMERICA
LATIN AMERICA
AFRICA
EUROPE
ASIALa croissance urbaine selon les régions du
monde
Source : David Satterthwaite, The transition to a predominantly urban world and its underpinnings. IIED, 2007


3 - L’urbanisation commemoteur nécessaire de la croissance économique


Source : Commission on growth and development 2008. www.growthcommission.org
Chine et Inde : une forte croissance implique des changements structurels

Changes in the proportion of GDP from industry and services, of the labour force working in industry and services and of the population in urban areas, 1950–2005 Low and middle income nations
Data : World Bank, WDI

Source : Commission on growth and development 2008. www.growthcommission.org
Dans tous les pays à forte croissance (>7%) dans les 15 dernières années, la croissance vient des villes
Pays à forte croissance…

Source : Commission on growth and development 2008. www.growthcommission.org
Pour les pays à forte croissance, les gains de productivité sont dans les villes
-La productivité industrielle surpasse de loin la productivité agricole- Les migrations du rural vers l’urbain sont excellentes pour la croissance

Differences in per capita GDP of metro regionsAnd their national level (2002)Source : OECD Territorial Reviews: competitive cities in the global economy, 2006Note : OECD average refers to the average of OECD metro regions

Skills in Metro-regions and their national average (2001)Percentage differences of populationwith tertiary education
(sample of 56 metro regions)Source : OECD Territorial Reviews: competitive cities in the global economy, 2006

Source : OECD Territorial Reviews: competitive cities in the global economy, 2006
There is a positive correlation between metro-regions’ size and income, especially when they concentrate over 20% of national GDP but this correlation becomes negative at around 6-7 million, suggesting diseconomies of agglomeration due to congestion and other related costs.

Les sans-emploi sont souvent concentrés dans les villes
Source : European Union – Urban Audit 2004

4 – La croissance économiquecomme moyen de rendre les villes durables ?

Environmental Kuznet Curve (EKC)
References: - Kahn, Matthew E. Green Cities – Urban growth and the environment – Brookings institution, 2006.- Hilton and Levinson, 1998
Indicateur de“Pollution”au sensgénéral
Indicateur de richesse moyenneex: PIB / habitant
Temps
Échelle spatiale
Graphique : JJ HELLUIN - 2008
Une courbe influencée par : les prix, la technologie, les régulationsPrincipales critiques : irréversibilités , externalités trans-frontières

Source : Allaire, PhD 2007, page 121

Source : Global Environment Outlook – GeO4 - UNEP 2007
1987 2004
Concentration annuelle moyenne en polluants (ug/m3)

Source : European Union – Urban Audit Perception Survey – 2004300 min respondents per city (95% confidence interval between 2 to 5 %)

Seuil EKCChangement Climatique(20 k$ ?)
Seuil EKC pour problèmes localisés(6 a 8 k$)

Une course poursuite est engagée entre :
croissance des revenus moyens,
croissance de la population urbaine, et
croissance de l’espace consommé


LyonParis
Marseille

5 - Quelques défis et débats àvenir ....

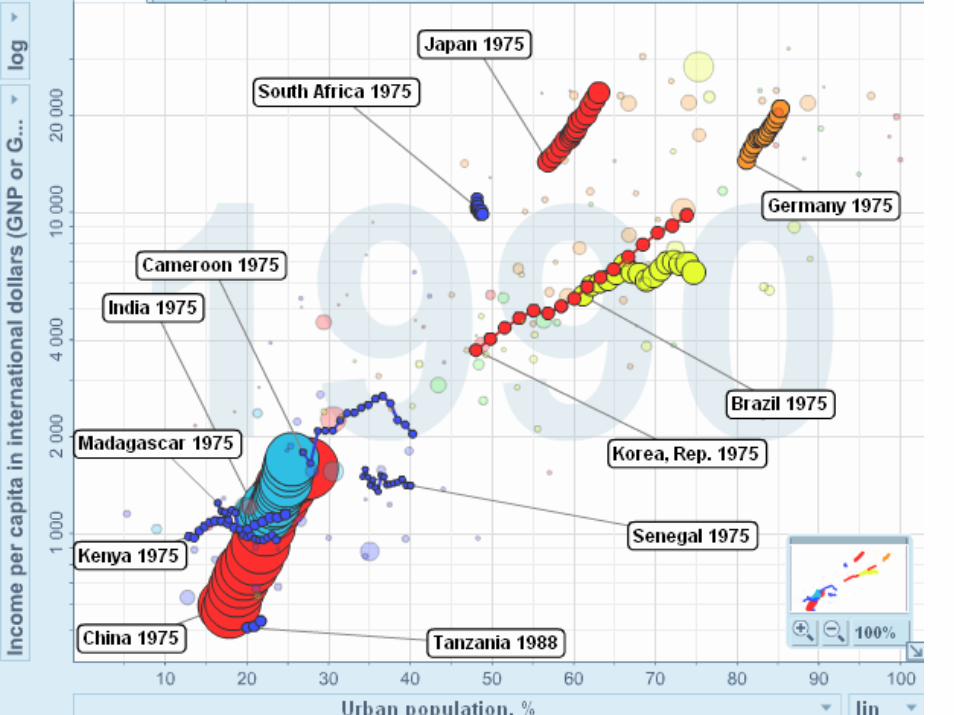
Qui parle ? Les acteurs de l’urbain au niveaumondial
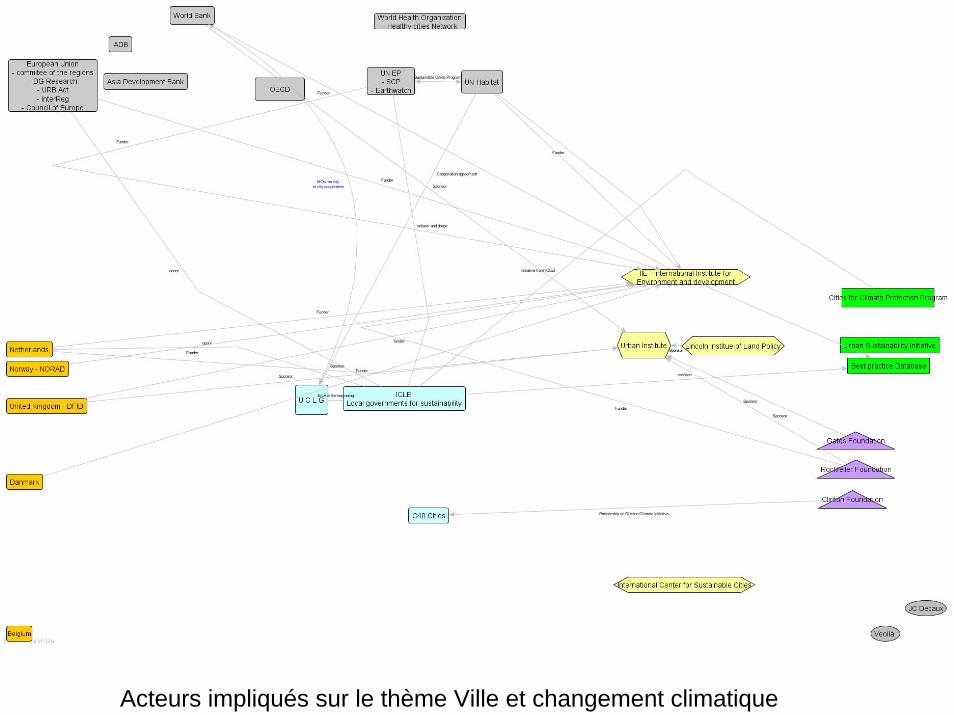
Acteurs impliqués sur le thème Ville et changement climatique

L’importance de l’aide au developpement
et d’une approche positive et systémique de la ville en développement
A – le défi des infrastructures

L’importance de l’investissement dans les infrastructures urbaines :
A condition d’etre fait avec un engagement massif surplusieures décennies, c’est sans doute une condition indispensable pour que les villes du Sud parviennent(plus rapidement) au seuil des EKC

Aide au developpementpar secteur
Source : OCDEwww.oecd.org/dac/stats/dac/dcrannex.

B – le défi de la forme urbaine

Pourquoi influencer la structure spatiale d’une ville?- transports- environnement- accès aux emplois par les pauvres
Peut-on l’influencer ? Oui, via :-les régulations foncières (COS; taille de parcelle mini, UGB…) mais attention aux effets pervers- les investissements en infrastructures- la fiscalité

Une des raisons pour lesquelles la forme compte...
From Bertaud, 2004 : the spatial organization of cities: deliberate outcome or unforeseen consequence ?
3.00 Km 5.71km
6.00 Km 7.28 Km
5.09 Km 6.75 Km
Distance moyenne au centre :
Distance moyenneà des points aléatoires

Quand on laisse faire….
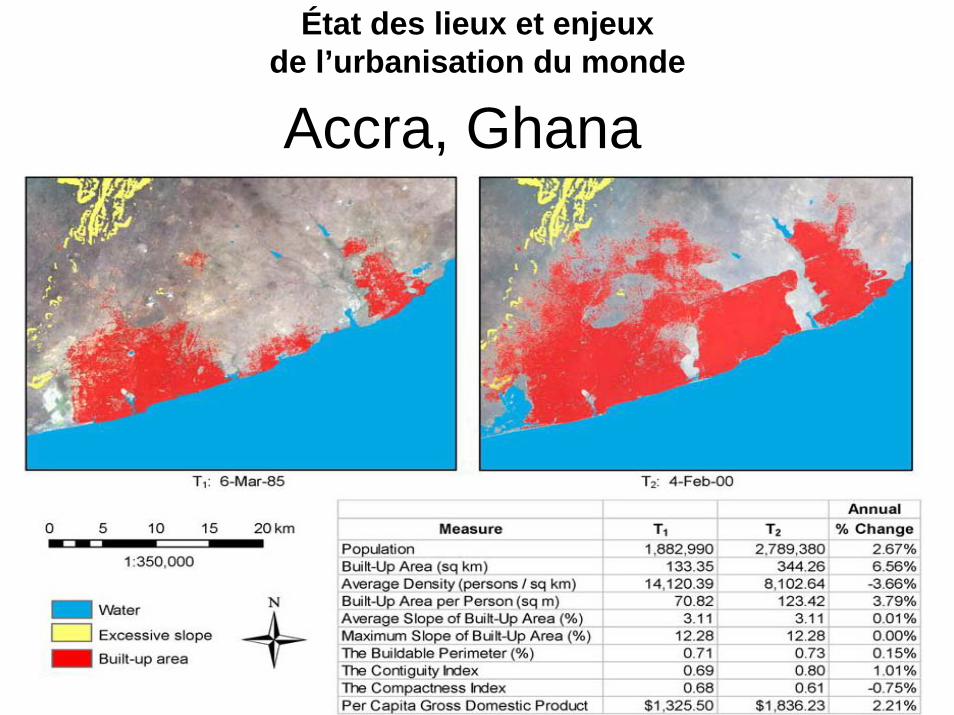
Accra, Ghana
État des lieux et enjeux de l’urbanisation du monde

Source : Global Environment Outlook – GeO4 - UNEP 2007

Pourtant d’autres modèles sont possibles….

Red pixels denote urban land use as defined by both the USGS and the Bureau of the Census
Two hundred years of urban growth for the Baltimore-Washington region
Source : The Baltimore-Washington Regional Collaboratory Land-Use History Research Program by Timothy W. Foresman –biology.usgs.gov/luhna/chap5.html

From Bertaud, 2004 : the spatial organization of cities: deliberate outcome or unforeseen consequence ?


Mais attention aux erreurs dans l’intervention publique…

From : World Bank study – Alain Berthaud presentation, WB, March 2008
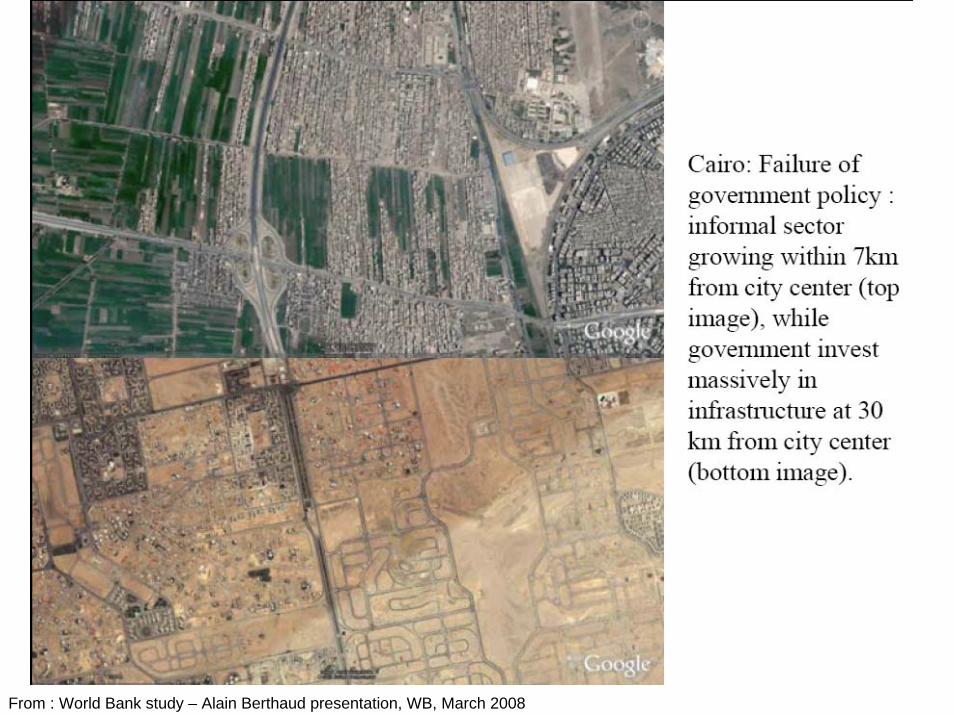
From : World Bank study – Alain Berthaud presentation, WB, March 2008

(Alain Berthaud on land markets)


Berthaud 2008 – FAR in Downtown Singapore varies between 2 to 25

C – le défi des villes face au changement climatique

010,000,00020,000,00030,000,00040,000,00050,000,00060,000,00070,000,00080,000,00090,000,000
China
IndiaJa
panIndo
nesia
United
Stat
es of
Ameri
caBan
glade
shViet
Nam
Thail
and
Egypt
Netherl
ands
Brazil
Philippin
es
United
King
domMya
nmarNige
ria Italy
Argen
tina
German
yMala
ysia
Mexico
World : 360 million people live in URBAN LECZ (6 % of the world population)274 million people live in RURAL LECZ (4.5 % of the world population)
Countries with highest urban population living in low elevation coastal zone (LECZ)l
Graphic and calculation : JJ HELLUIN, 2007Data : Center for International Earth Science Information Network (CIESIN), Columbia University. Low Elevation Coastal Zone (LECZ) Urban-Rural Estimates, Global Rural-Urban Mapping Project (GRUMP), Alpha Version. Palisades, NY: Socioeconomic Data and Applications Center (SEDAC), Columbia University. Available at http://sedac.ciesin.columbia.edu/gpw/lecz. (downloaded 11/22/2007).
CLIMATE CHANGE : WE WILL WIN, OR LOOSE, IN THE CITIES
Urban Pop in LECZ

31,239,883
238,186,343
2,546,549
40,321,00822,833,999 21,401,771
0
50,000,000
100,000,000
150,000,000
200,000,000
250,000,000
300,000,000
Africa Asia Australiaand NewZealand
Europe LatinAmerica
NorthAmerica
Regions and their urban population living in low elevation coastal zone (LECZ)l
Graphic and calculation : JJ HELLUIN, 2007Data : Center for International Earth Science Information Network (CIESIN), Columbia University. Low Elevation Coastal Zone (LECZ) Urban-Rural Estimates, Global Rural-Urban Mapping Project (GRUMP), Alpha Version. Palisades, NY: Socioeconomic Data and Applications Center (SEDAC), Columbia University. Available at http://sedac.ciesin.columbia.edu/gpw/lecz. (downloaded 11/22/2007).
Urban Pop in LECZ

MASDAR CITY : first zero-carbon, zero-waste city ?
The initiative is headed by the Abu Dhabi Future Energy Company. Initiated in 2006, the project is estimated to take some 10 years to complete, with the first phase complete and habitable in 2009. The city will rely entirely on solar energy, with a sustainable, zero-carbon, zero-waste ecology. It will cost $US22 billion to build and be home to 50,000 people and 1,500 businesses.The city is intended to cover six square kilometers, with no point further than 200 m from a public transport link, housing energy, science and technology communities. The city will cover 6 km² and include housing, commercial areas, a university, and the headquarters of the Future Energy Company.
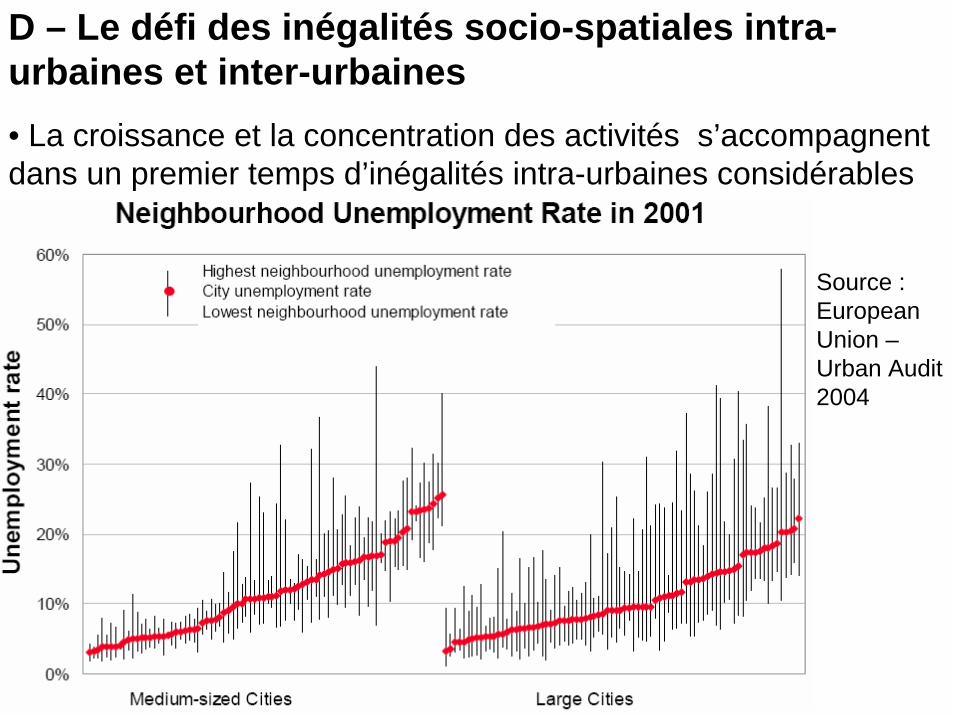
D – Le défi des inégalités socio-spatiales intra-urbaines et inter-urbaines• La croissance et la concentration des activités s’accompagnent dans un premier temps d’inégalités intra-urbaines considérables
Source : European Union –Urban Audit 2004

• Mais aussi d’inégalités inter-urbaines entre villes du Nord qui franchissent le seuil des EKC et villes du Sud qui pourraient nejamais les franchir sans une aide efficace

Power-Point complet téléchargeable sur
www.urbanres.net
Puis LIBRARY
Puis Other FILES