Embed Size (px)
Citation preview

Kidney International, Vol. 59 (2001), pp. 1114–1120
DIALYSIS – TRANSPLANTATION
Leptin is a negative acute phase protein in chronichemodialysis patients
BURL R. DON, LAURA M. ROSALES, NATHAN W. LEVINE, WILLIAM MITCH,and GEORGE A. KAYSEN
Division of Nephrology, Department of Medicine University of California Davis Medical Center, Sacramento, and Departmentof Veterans Affairs Northern California Health Care System, Mather, California; and Renal Research Institute, Division ofNephrology, Department of Medicine, Emory University, Atlanta, Georgia, USA
Leptin is a negative acute phase protein in chronic hemodialysis predictor of morbidity and mortality in this populationpatients. [1–3]. Depending on the parameter measured, the preva-
Background. Hypoalbuminemia strongly predicts death in lence of malnutrition in the chronic dialysis populationhemodialysis patients and results from both inflammation andranges from 10 to 54% [4–8]. This has been substantiatedmalnutrition. One potential link between malnutrition and in-by a growing body of evidence linking poor nutritionalflammation is appetite suppression triggered by inflammation.
Leptin is secreted by adipose tissue and suppresses appetite, status in the dialysis population with increased morbidityand it is also a positive acute phase protein in the rat. Factored and mortality. Clinicians, using hypoalbuminemia asfor body weight, leptin is known to be increased in hemodialysis
their principal nutritional marker, have recognized forpatients, but its relationship to inflammation is unknown.many years that their malnourished dialysis patients hadMethods. We examined the relationship between spontane-
ously occurring activation of the acute phase response and a poorer prognosis, and serum albumin appeared to beleptin levels in 29 chronic hemodialysis patients. Serum samples the most significant marker of mortality in patients withwere obtained three times weekly for six weeks and then renal failure [9].monthly from 29 chronic hemodialysis patients, and the levels
Recently, it has been recognized that a substantialof the positive acute phase proteins [C-reactive protein (CRP),number of patients with end-stage renal disease havea1-acid glycoprotein (a1 AG), serum amyloid A, ceruloplas-
min] and the negative acute phase proteins (albumin and trans- serologic evidence of an activated inflammatory stateferrin) as well as leptin and interleukin-6 (IL-6) were measured. [10]. Moreover, evidence of inflammation may be as im-
Results. Positive and negative acute phase proteins wereportant or more important than protein intake in causingevaluated at the maximum CRP (mean, 9.42 6 1.14 mg/dL)hypoalbuminemia [11]. It has long been known that albu-and minimum values (mean, 0.41 6 0.09 mg/dL). When CRP
was elevated, leptin levels were significantly reduced, as were min synthesis is effectively and rapidly reduced duringthe negative acute phase proteins albumin and transferrin. Se- inflammation leading to hypoalbuminemia [12]. In addi-rum amyloid A, ceruloplasmin, a1 acid glycoprotein, and IL-6 tion, clinical wasting is not the unique province of malnu-were all significantly increased at the maximum CRP level,
trition. This is illustrated by the fact that consumptioncompatible with general activation of the acute phase response.was the term applied in the last century to patients withThe change in leptin correlated negatively with the change in
CRP (R 5 0.437, P 5 0.018), as did changes in albumin (R 5 tuberculosis, which is the clinical prototype of chronic0.620, P , 0.001). inflammation. As we better understand the association
Conclusions. Leptin is not increased as a consequence ofbetween patient outcomes and nutritional status, whatinflammation in hemodialysis patients, but behaves as a nega-is emerging is an understanding that there is an interplay,tive rather than as a positive acute phase protein. Inflammation
is unlikely to reduce appetite in dialysis patients through a interdependence, and interaction between caloric andleptin-mediated mechanism. protein intake and the inflammatory state in patients
with chronic renal failure; together, they contribute toProtein and calorie (energy) malnutrition is common both a wasting syndrome and increased morbidity and
in patients with end-stage renal disease and is a powerful mortality.One potential relationship between malnutrition and
inflammation in patients with end-stage renal diseaseKey words: inflammation, albumin, C-reactive protein, cytokines, in-terleukin-6, ceruloplasmin, a1-acid glycoprotein. is appetite suppression triggered by the inflammatory
response [13]. The link between inflammation and an-Received for publication May 26, 2000
orexia may be through the hormone leptin. Leptin, aand in revised form September 6, 2000Accepted for publication September 14, 2000 15 kD protein secreted by adipose tissue, suppresses
appetite and increases energy expenditure, playing a ho- 2001 by the International Society of Nephrology
1114
Don et al: Leptin and acute phase proteins 1115
meostatic role in maintaining body composition [14]. In of these values was used for calculations. Serum amyloidA concentrations were measured by ELISA using a kitaddition, leptin functions as a positive acute phase pro-
tein in experimental animals, being positively regulated obtained from Hemagen (Hemagen Diagnostics Incor-porated, Waltham, MA, USA), serum IL-6 levels byat the mRNA level by the cytokines, tumor necrosis
factor-a (TNF-a) and interleukin-1 (IL-1) [15–17]. Since ELISA (R&D Systems, Minneapolis, MN, USA), andserum leptin concentrations by ELISA DSL (Diagnosticsserum leptin levels are markedly increased in patients
with chronic renal failure [18, 19], activation of the in- Systems Laboratories Inc., Webster, TX, USA).flammatory response in this patient population may be
Statistical analysisresponsible, in part, for increased leptin levels.We recently noted that the levels of acute phase pro- Differences between serum concentrations of each of
the proteins measured coinciding with the peak andteins may vary by orders of magnitude in a single patientover short time periods [20]. These large changes pro- trough value for CRP were analyzed by Student t test
for paired data for normally distributed data and byvided the opportunity to establish whether there was arelationship between spontaneously occurring activation Wilcoxon signed rank test for non-normally distributed
data. The difference between the peak and trough valueof the acute phase response and changes in serum leptinlevels in dialysis patients. for CRP (DCRP) was calculated, as was the difference
between the value for each of the other proteins of inter-est coinciding with those values of CRP. These differ-
METHODSences were then the D for each protein that corresponded
Patient selection with the difference in CRP values (DCRP). The correla-tion between the change in the concentration of eachPatients at the University of California Davis Medical
Center (Sacramento, CA, USA), Beth Israel Medical protein with the changes in CRP (DCRP) was analyzedby linear regression.Center (New York, NY, USA), and Emory University
Medical Center (Atlanta, GA, USA) were recruited toparticipate in an ancillary longitudinal study of the rela-
RESULTStionship of the levels of acute phase proteins to serum
The age range for the 29 patients participating in thisalbumin concentration. The study was approved by thestudy was 19 to 75 years, with a median age of 60 years.Institutional Review Boards at each institution.Nineteen patients were men. Twelve patients had diabe-During the first six weeks of observations, predialysistes mellitus, and 16 patients were African American. Theblood samples were obtained weekly. Following that pe-body mass index ranged from 15.94 to 32.61 kg/m2, withriod, each protein was measured monthly on serum ob-a median value of 23.31 kg/m2.tained from predialysis samples. The sampling period
The average number of episodes in which the CRPranged from 7 to 28 months (median 18.5 months). Sam-level was greater than 1.0 mg/dL was 9.4 6 1.2 per patientples having the maximum and minimum C-reactive pro-per year. The mean maximum CRP concentration fortein (CRP) levels in blood previously obtained from 29the group was 9.42 6 1.14 mg/dL, and the minimumconsecutive patients with end-stage renal disease onconcentration was 0.41 6 0.09 mg/dL. These were sig-chronic hemodialysis were chosen for measurement ofnificantly different by experimental design (P , 0.0001).leptin and both negative (albumin, transferrin) and posi-The positive acute phase proteins, serum amyloid A (Fig.tive [serum amyloid A (SAA), a1-acid glycoprotein (a11A) and the cytokine IL-6 (Fig. 1B) were also signifi-AG), ceruloplasmin) acute phase proteins and one of thecantly greater during the period when CRP was maximal.cytokines that regulates them (IL-6)]. The time intervalSimilarly, the minor acute phase proteins, ceruloplasminbetween maximum and minimum CRP levels varied(Fig. 2A) and a1 AG (Fig. 2B), were also significantlyfrom 7 to 392 days (median 147 days). The body massgreater during the period when CRP was maximal. Byindex (kg/m2) was calculated for each patient using thecontrast, leptin decreased significantly (Fig. 3A), as didheight and weight obtained the day that the maximumthe concentrations of the known negative acute phaseand minimum CRP values were noted.proteins albumin (Fig. 3B) and transferrin (Fig. 3C) dur-
Laboratory methods ing the period when CRP was maximal.There was a positive correlation between the changesSerum albumin was measured in duplicate using bro-
in CRP at maximum and minimum concentrationsmocresol green. Serum transferrin, CRP, a1-acid glyco-(DCRP) and changes in SAA at the same time pointsprotein, and ceruloplasmin were each measured with(DSAA; Fig. 4A). A similar positive correlation was ob-rate nephelometry using a Beckman Array automatedserved between the changes in CRP at maximum andnephelometer (Beckman Instruments, Fullerton, CA,minimum levels and the changes in ceruloplasmin (Fig.USA) [21]. All nephelometric measurements were made
in duplicate in each of two optical systems. The average 4B), a1 AG (Fig. 4C), and IL-6 (Fig. 5). In contrast,

Don et al: Leptin and acute phase proteins1116
Fig. 1. Serum amyloid A (SAA; A) and in-terleukin-6 (IL-6; B) levels at minimum andmaximum levels of C-reactive protein (CRP).Both SAA and IL-6 increased significantlywhen CRP increased as analyzed by Wilcoxonsigned rank test.
Fig. 2. Ceruloplasmin (A) and a1-acid glyco-protein (a1 AG) (B) levels at minimum andmaximum levels of CRP. Both ceruloplasminand a1 AG increased significantly when CRPincreased as analyzed by paired t test.
Fig. 3. Leptin (A), albumin (B), and trans-ferrin (C ) at minimum and maximum levelsof CRP. All three proteins decreased signifi-cantly when CRP increased as analyzed byWilcoxon signed rank test (leptin) and pairedt test (albumin and transferrin).

Don et al: Leptin and acute phase proteins 1117
Fig. 4. Regression analysis comparing thechanges in CRP levels (DCRP) with changesin serum amyloid A (DSAA; mg/mL; A), ceru-loplasmin (mg/dL; B) and a1-acid glycopro-tein (a1 AG; mg/dL; C ). There is a significantpositive correlation between changes in CRPlevels and these three positive acute phaseproteins.
animal [22], investigators have sought to link the an-orexia and wasting associated with several chronic ill-nesses, including chronic renal failure, to abnormalitiesin leptin metabolism. Serum leptin levels are markedlyelevated in patients with chronic renal failure comparedwith healthy adults matched for gender and body massindex [18, 23, 24]. From these studies, a number of obser-vations have been made regarding leptin metabolism inpatients with chronic renal failure. First, there is an in-verse correlation between leptin levels and glomerularfiltration rate in patients with chronic renal insufficiency[25, 26]. Furthermore, the ratio of leptin to total fat issignificantly greater in renal failure patients comparedwith normal control subjects [19]. A major cause of theelevated leptin levels in renal failure is reduced renalclearance [24, 27], but other factors such as hyperinsulin-emia [28] and inflammation [29] have been implicated
Fig. 5. Regression analysis comparing the changes in IL-6 (pg/mL) in augmenting leptin secretion in renal failure.with changes in CRP levels (mg/dL). There is a significant positiveExperimental and clinical studies have demonstratedcorrelation between changes in IL-6 with changes in CRP (r 5 0.509;
P , 0.005). that inflammatory cytokines can stimulate leptin synthe-sis and secretion. The administration of TNF-a, IL-1 orendotoxin in experimental animals produces a promptincrease in serum leptin levels and leptin mRNA expres-there was a negative correlation between the changes insion in adipose tissue [15, 17]. In cancer patients, infusionCRP and changes in leptin, albumin, and transferrin (Fig.of either interleukin 1a [30] or TNF-a [31] has been6 A–C, respectively).shown to increase serum leptin levels, and in controlThere was no significance difference in body masssubjects and patients with type 2 diabetes mellitus, theindex between the periods of high and low CRP levelslevels of soluble TNF-a receptor (a sensitive indicator(24.37 6 1.26 vs. 24.35 6 1.33 kg/m2). There was also noof TNF-a activity) are correlated with leptin levels [32].effect of the time interval between when the samplesThus, these observations suggest that the anorexia seenwere drawn and the change in leptin levels.in both acute and chronic inflammatory diseases may bedue to increased leptin synthesis and secretion.
DISCUSSION During the last 10 years, several investigators haveshown that a significant percentage of chronic hemodial-Since the discovery of leptin in 1994 as an important
factor influencing appetite and energy expenditure in ysis and peritoneal dialysis patients have increased levels
Don et al: Leptin and acute phase proteins1118
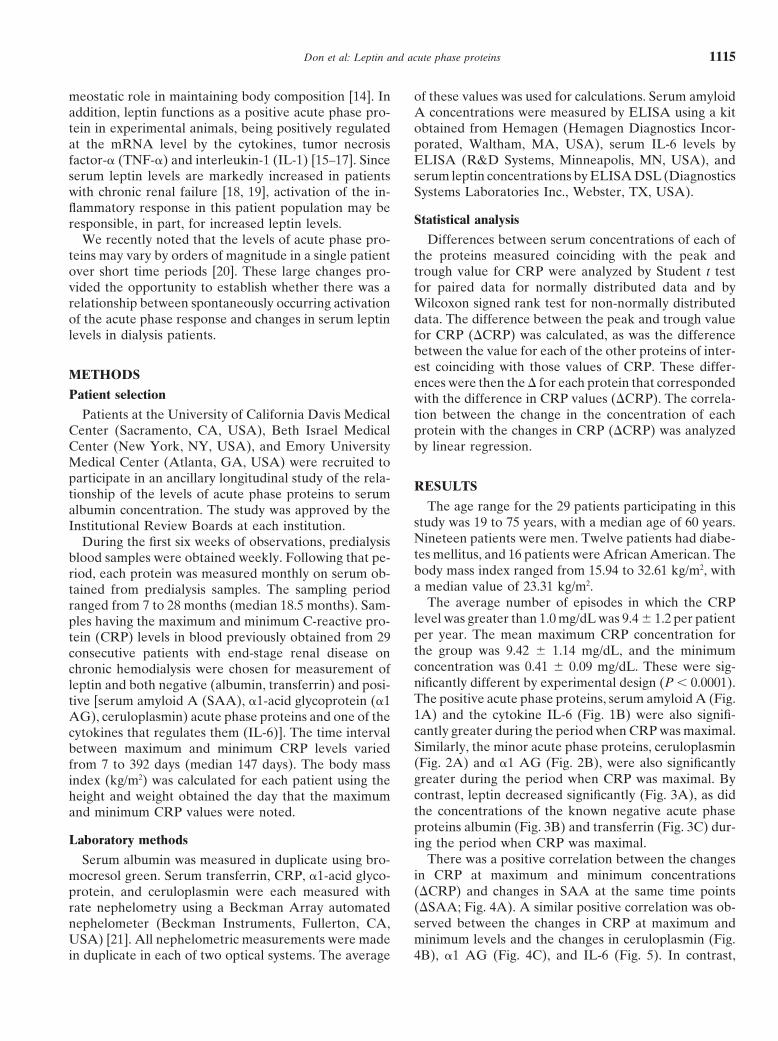
Fig. 6. Regression analysis comparing thechanges in CRP levels (DCRP; mg/dL) withchanges in leptin (ng/mL; A), albumin (g/dL;B), and transferrin (mg/dL; C). There is a sig-nificant negative correlation between changesin CRP levels and changes in these three pro-teins.
of inflammatory mediators, including IL-1, IL-6, and and changes in CRP levels at maximum and minimumvalues. In short, leptin responds like a negative acuteTNF-a, suggesting that the systemic inflammatory re-
sponse is an important part of the clinical physiology phase protein, rather than a positive acute phase proteinin the presence of inflammation.of chronic dialysis patients [10, 33, 34]. The emerging
concept is that many patients with chronic renal failure A review of the literature reveals conflicting conclu-sions regarding the effect of inflammation on leptin. Infu-have chronic intermittent activation of the systemic
inflammatory response [35]. This leads to a complex com- sion of cytokines has been shown to augment leptin levelsin experimental animals and in patients. In a cross-sec-bination of physiologic, immunologic, and metabolic ef-
fects, termed the acute phase response. IL-1 and TNF-a tional study of chronic peritoneal dialysis patients,Heimburger et al noted a positive correlation betweenstimulate the production of the positive acute phase pro-
teins, which include CRP, SAA, ferritin, haptoglobin, serum leptin concentration and serum TNF-a levels [40].The latter report emphasizes the limits of cross-sectionalcomplement 3 and a1 AG [36]. Cytokines can also inhibit
the synthesis of proteins (negative acute phase proteins), studies. In contrast, Landt et al [41] and Parry et al [42]failed to find any correlation between serum leptin levelsincluding albumin and transferrin. That serum albumin
is a negative acute phase protein supports the contention and CRP in peritoneal dialysis patients. In a study byNorfors et al, the expression of mRNA for the leptinthat hypoalbuminemia is actually a marker of inflamma-
tion rather than malnutrition. In fact, Bergstrom et al gene was greater in chronic renal failure patients withCRP levels more than 25 mg/dL [25]; however, serumnoted that CRP was a more powerful predictor of mortal-
ity for hemodialysis patients than hypoalbuminemia (ab- leptin levels were not significantly increased. Finally, ina crossover study design examining dialyzer membranestract; J Am Soc Nephrol 6:573A, 1995). This observation
has been confirmed by Zimmerman et al [37] and Yeun biocompatibility, Coyne et al found no correlation be-tween leptin and TNF-a levels in eight chronic hemodial-et al [38], and the relationship holds for IL-6 [39].
Based on our longitudinal observation that chronic ysis patients [43]. In other chronic inflammatory condi-tions such as inflammatory bowel disease [44], therehemodialysis patients have intermittent activation of the
acute phase response [20] and the experimental data appears to be no relationship between disease activityand leptin levels, thus confirming the observation thatsuggesting that inflammatory cytokines stimulate leptin
synthesis and secretion, we measured serum leptin levels unlike exogenous administration of cytokines, endoge-nous inflammation does not appear to be associated withat maximum and minimum points of activation of the
acute phase response, as assessed by serum CRP levels. stimulation of leptin secretion. Indeed, changes in serumleptin levels in patients with inflammatory bowel diseaseSerum leptin levels were significantly lower when CRP
levels were at maximum levels. The pattern of the leptin can be explained by changes in body mass index ratherthan disease activity [45].levels noted at the peak and nadir of CRP levels was
similar to that observed with the negative acute phase What other factors could explain why activation ofthe acute phase response is associated with a reductionproteins, albumin and transferrin. In addition, there was
also a negative correlation between the changes in leptin in leptin levels? One possibility is insulin-like growth
Don et al: Leptin and acute phase proteins 1119
research service of the United States Department of Veterans Affairs,factor (IGF-1), since malnutrition and inflammation arein part by a grant from Dialysis Clinics Incorporated, and in part byboth associated with low levels of IGF-1 and administra- the Renal Research Institute.
tion of IGF-1 will increase serum leptin levels in chronicReprint requests to Burl R. Don, M.D., Division of Nephrology,renal failure patients [46]. There is also a positive correla-
University of California Davis Medical Center, 4150 V Street, Suitetion between leptin and IGF-1 levels in peritoneal dial-3500, Sacramento, California 95817, USA.
ysis patients (abstract; Bergstrom, J Am Soc Nephrol E-mail: [email protected]:316A, 1999). Thus, the lower levels of leptin that weobserved during activation of the acute phase response REFERENCESmay be related to concomitant decreased levels of IGF-1.
1. Hakim RM, Levin N: Malnutrition in hemodialysis patients. AmDespite the observation that leptin levels are increased J Kidney Dis 21:125–137, 2000in patients with chronic renal failure, there are no studies, 2. Kopple JD: Pathophysiology of protein-energy wasting in chronic
renal failure. J Nutr 129:247S–251S, 1999to date, that have shown direct evidence that leptin3. Mitch WE, Maroni BJ: Factors causing malnutrition in patientscauses the anorexia and malnutrition associated with this with chronic uremia. Am J Kidney Dis 33:176–179, 1999
disorder. The indirect studies that have investigated this 4. Thunberg BJ, Alagiri PS, Cestero RV: Cross-sectional and longi-tudinal nutritional measurements in maintenance hemodialysis pa-question have presented conflicting results. Young et altients. Am J Clin Nutr 34:2005–2112, 1981noted that hemodialysis patients with the highest leptin–
5. Schoenfeld PY, Henry RR, Laird NM, et al: Assessment of nutri-to–fat ratio had the lowest protein intake as measured tional status of the national cooperative dialysis study population.by dietary history [19]. A similar relationship between Kidney Int 23(Suppl 13):80–88, 1983
6. Marckmann P: Nutritional status of patients on hemodialysis anddietary protein intake assessed by dietary history andperitoneal dialysis. Clin Nephrol 29:75–78, 1988leptin levels was observed in children with chronic renal 7. Cianciaruso B, Brunori G, Kopple JD, et al: Cross-sectional com-
failure [47]. In a cross-sectional study performed in parison of malnutrition in continuous ambulatory peritoneal dial-ysis patients. Am J Kidney Dis 26:475–486, 1995chronic hemodialysis patients, Johansen et al found a
8. Dwyer JT, Cunniff PJ, Maroni BJ, et al: The hemodialysissignificant negative correlation between blood leptin(HEMO) pilot study: Nutrition program and participant character-
concentration and the protein catabolic rate, which is istics at baseline. J Ren Nutr 8:11–20, 19989. Lowrie EG, Lew NL: Death risk in hemodialysis patients: Thean indirect measure of protein intake calculated from
predictive value of commonly measured variables and evaluationdialysis urea removal using serum urea levels [48]. Inof death rate differences between facilities. Am J Kidney Discontrast, Parry et al observed that there was no correla- 15:458–482, 1990
tion between leptin levels and dietary protein intake in 10. Pereira BJ, Shapiro L, King AJ, et al: Plasma levels of IL-1 beta,TNF alpha and their specific inhibitors in undialyzed chronic renalperitoneal dialysis patients [42], and Merabet et al foundfailure, CAPD and hemodialysis patients. Kidney Int 45:890–896,that there was no correlation between leptin levels and 1994
weight loss [18]. In addition, several studies have not 11. Yeun JY, Kaysen GA: Acute phase proteins and peritoneal dialy-sate albumin loss are the main determinants of serum albumin inobserved any correlation between leptin levels and se-peritoneal dialysis patients. Am J Kidney Dis 30:923–927, 1997rum albumin concentration in renal failure patients (ab-
12. Moshage HJ, Janssen JAM, Franssen JH, et al: Study of thestract; Manno et al, J Am Soc Nephrol 10:292A, 1999) molecular mechanisms of decreased liver synthesis of albumin in
inflammation. J Clin Invest 79:1635–1641, 1987[41, 42]. Finally, we found that higher leptin levels were13. Bergstrom J: Mechanisms of uremic suppression of appetite. J Rennot associated with hypoalbuminemia, and we did not
Nutr 9:129–132, 1999observe any significant changes in body mass index be- 14. Friedman JM, Halaas JL: Leptin and the regulation of weight intween the high and low leptin values. A recent prelimi- mammals. Nature 395:763–770, 1998
15. Grunfeld C, Zhao C, Fuller J, et al: Endotoxin and cytokinesnary study failed to show any relationship between fat-induce expression of leptin, the ob gene product, in hamsters.free mass and body mass index and leptin levels in either J Clin Invest 97:2152–2157, 1996
hemodialysis or peritoneal dialysis patients (abstract; 16. Kirchgessner TG, Uysal KT, Wiesbrock SM, et al: Tumor necro-sis factor-a contributes to obesity-related hyperlipidemia by regu-Manno et al, J Am Soc Nephrol 10:292, 1999).lating leptin release from adiopocytes. J Clin Invest 100:2777–2782,Our results do not support the hypothesis that in-1997
flammation-induced anorexia is a consequence of in- 17. Sarraf P, Frederich RC, Turner EW, et al: Multiple cytokinescreased leptin levels in dialysis patients. It seems more and acute inflammation raise mouse leptin levels: Potential role
in inflammatory anorexia. J Exp Med 185:171–176, 1997likely that TNF-a causes a direct suppression of appetite18. Merabet E, Dagogo-Jack S, Coyne DW, et al: Increased plasma[49]. Since TNF-a can stimulate protein catabolism when leptin concentration in end-stage renal disease. J Clin Endocrinol
injected into experimental animals [50, 51], we propose Metab 82:847–850, 199719. Young GA, Woodrow G, Kendall S, et al: Increased plasmathat should inflammation affect appetite, then it does so
leptin/fat ratio in patients with chronic renal failure: A cause ofby the direct action of cytokines affecting both somaticmalnutrition? Nephrol Dial Transplant 12:2318–2323, 1997
and visceral protein pools directly rather than through 20. Kaysen GA, Dubin JA, Muller HG, et al: The acute phase re-a leptin mediated pathway. sponse varies with time and predicts serum albumin in a longitudi-
nal study of hemodialysis patients: The HEMO Study Group. Kid-ney Int 58:346–352, 2000ACKNOWLEDGMENTS
21. Beckman Instructions 015-248545-F. Brea, CA, Beckman Instru-ments, Inc., November 11, 1994This work was supported in part by a grant from the National
Institutes of Health RO1 DK 50777, MO1-RR 00039, in part by the 22. Zhang Y, Proenca R, Maffei M, et al: Positional cloning of the

Don et al: Leptin and acute phase proteins1120
mouse ob gene and its human homologue. Nature 372:425–432, 37. Zimmermann J, Herrlinger S, Pruy A, et al: Inflammation en-hances cardiovascular risk and mortality in hemodialysis patients.1994Kidney Int 55:648–658, 199923. Heimburger O, Lonnqvist F, Danielsson A, et al: Serum immuno-
38. Yeun JY, Levine RA, Mantadilok V, et al: C-reactive proteinreactive leptin concentration and its relation to the body fat contentpredicts all cause and cardiovascular mortality in hemodialysisin chronic renal failure. J Am Soc Nephrol 8:1423–1430, 1997patients. Am J Kidney Dis 35:469–476, 200024. Sharma K, Considine RV, Michael B, et al: Plasma leptin is partly
39. Bologa RM, Levine DM, Parker TS, et al: Interleukin-6 predictscleared by the kidney and is elevated in hemodialysis patients.hypoalbuminemia, hypocholesterolemia, and mortality in hemodi-Kidney Int 51:1980–1985, 1997alysis patients. Am J Kidney Dis 32:107–114, 199825. Nordfors L, Lonnqvist F, Heimburger O, et al: Low leptin gene
40. Heimburger O, Wang T, Lonnqvist F, et al: Peritoneal clearanceexpression and hyperleptinemia in chronic renal failure. Kidneyof leptin in CAPD patients: Impact of local insulin administration.Int 54:1267–1275, 1998Nephrol Dial Transplant 14:723–727, 199926. Perez Fontan M, Rodriguez-Carmona A, Cordido F, et al: Hy-
41. Landt M, Parvin CA, Dagogo-Jack S, et al: Leptin eliminationperleptinemia in uremic patients undergoing conservative manage-in hyperleptinaemic peritoneal dialysis patients. Nephrol Dialment, peritoneal dialysis, and hemodialysis: A comparative analy-Transplant 14:732–737, 1999sis. Am J Kidney Dis 34:824–831, 1999
42. Parry RG, Johnson DW, Carey DG, et al: Serum leptin correlates27. Sharma K, Considine RV: The Ob protein (leptin) and the kidney.with fat mass but not dietary energy intake in continuous ambula-Kidney Int 53:1483–1487, 1998tory peritoneal dialysis patients. Perit Dial Int 18:569–575, 199828. Stenvinkel P, Heimburger O, Lonnqvist F: Serum leptin concen-
43. Coyne DW, Dagogo-Jack S, Klein S, et al: High-flux dialysistrations correlate to plasma insulin concentrations independent oflowers plasma leptin concentration in chronic dialysis patients. Ambody fat content in chronic renal failure. Nephrol Dial TransplantJ Kidney Dis 32:1031–1035, 199812:1321–1325, 1997
44. Hoppin AG, Kaplan LM, Zurakowski D, et al: Serum leptin in29. Schwartz MW, Baskin DG, Bukowski TR, et al: Specificity of children and young adults with inflammatory bowel disease. J Pedi-leptin action on elevated blood glucose levels and hypothalamic atr Gastroenterol Nutr 26:500–505, 1998neuropeptide Y gene expression in ob/ob mice. Diabetes 45:531– 45. Ballinger A, Kelly P, Hallyburton E, et al: Plasma leptin in535, 1996 chronic inflammatory bowel disease and HIV: Implications for
30. Janik JE, Curti BD, Considine RV, et al: Interleukin 1a increases the pathogenesis of anorexia and weight loss. Clin Sci (Colch)serum leptin concentrations in humans. J Clin Endocrinol Metab 94:479–483, 199882:3084–3086, 1997 46. Fouque D, Juillard L, Lasne Y, et al: Acute leptin regulation in
31. Zumbach MS, Boehme MWJ, Wahl P, et al: Tumor necrosis factor end-stage renal failure: The role of growth hormone and IGF-1.increases serum leptin levels in humans. J Clin Endocrinol Metab Kidney Int 54:932–937, 199882:4080–4082, 1997 47. Daschner M, Tonshoff B, Blum WF, et al: Inappropriate eleva-
32. Mantzoros CS, Moschos S, Avramopoulos I, et al: Leptin concen- tion of serum leptin levels in children with chronic renal failure:trations in relation to body mass index and the tumor necrosis European Study Group for Nutritional Treatment of Chronic Re-factor-a system in humans. J Clin Endocrinol Metab 82:3408–3413, nal Failure in Childhood. J Am Soc Nephrol 9:1074–1079, 19981997 48. Johansen KL, Mulligan K, Tai V, et al: Leptin, body composition
33. Docci D, Bilancioni R, Baldrati L, et al: Elevated acute phase and indices of malnutrition in patients on dialysis. J Am Socreactants in hemodialysis patients. Clin Nephrol 34:88–91, 1990 Nephrol 9:1080–1084, 1998
34. Libetta C, De Nicola L, Rampino T, et al: Inflammatory effects 49. Yen S-S, Schuter MW: Geriatric cachexia: The role of cytokines.of peritoneal dialysis: Evidence of systemic monocyte activation. Am J Clin Nutr 70:183–197, 1999Kidney Int 49:506–511, 1996 50. Tracey KJ, Wei H, Manogue KR, et al: Cachectin/tumor necrosis
35. Bistrian BR: Role of systemic inflammatory response syndrome factor induces cachexia, anemia and inflammation. J Exp Medin the development of protein-calorie malnutrition in ESRD. Am 167:1211–1227, 1998J Kidney Dis 32:S113–S117, 1998 51. Bendtzen K: Interleukin 1, interleukin 6 and tumor necrosis factor
36. Kaysen GA: Inflammation nutritional state and outcome in end in infection, inflammation and immunity. Immunol Lett 19:183–191,1988stage renal disease. Miner Electrolyte Metab 25:242–250, 1999