Embed Size (px)
Citation preview

C
onsu
mer
Dis
cre
tionary
M
ala
ysi
a
1.04
June 25, 2019
THIS REPORT HAS BEEN PREPARED BY MAYBANK INVESTMENT BANK BERHAD
SEE PAGE 46 FOR IMPORTANT DISCLOSURES AND ANALYST CERTIFICATIONS
PP16832/01/2013 (031128)
Desmond Ch'ng, ACA [email protected] (603) 2297 8680
Jade Tam [email protected] (603) 2297 8687
Leong Hup International (LHIB MK)
A Pure Poultry Play
An integrated poultry player with regional presence
Leong Hup provides exposure to one of the largest and most regionally
diversified poultry producers in ASEAN, with a presence in Malaysia,
Singapore, Indonesia, Vietnam and the Philippines. Its 2017 market share
of annual feedmill production was 10.5% in Malaysia, 5.5% in Indonesia
and 4.0% in Vietnam. As for livestock production, Leong Hup is the
largest poultry producer in Malaysia. It also ranks among the top three
poultry producers in Indonesia and Vietnam while in Singapore, it
commands the largest market share of slaughtered poultry. We initiate
coverage with a BUY and a TP of MYR1.37.
Resilience and growth through diversity
Leong Hup’s fully integrated operations lend to operational efficiencies
through economies of scale, product diversification and resilience
through economic cycles. Its regional diversity, meanwhile, offers it
much opportunity for organic growth outside Malaysia, particularly in
under-penetrated markets such as Vietnam and the Philippines.
Moreover, its operational and geographical diversity contributes to
earnings stability and scalability as well as a leading edge in an industry
with significant barriers to entry.
3-year net profit CAGR of 14%
We estimate a 3-year (FY18-FY21E) core net profit CAGR of 14%, driven
by a 3-year revenue CAGR of 7% and an expansion in operating profit
margin to 9.4% in FY21E from 8% in FY18. We forecast feedmill revenue
to expand at a 3-year CAGR of 13% driven primarily by capacity
expansion and higher utilization rates, while livestock revenue is
expected to grow at a steady pace of 3% p.a. on the back of stable
consumption growth.
Target price of MYR1.37
Our TP of MYR1.37 pegs its earnings to the 2020 weighted average PER of
its regional peers of 17x. Leong Hup’s 2-year (FY18-FY20E) net profit
CAGR of 14.3% compares favourably against its regional peer average of
13.4%, as does its PEG of just 1x at the current share price of MYR1.04,
relative to its peer average of 1.4x.
Share Price MYR 1.04
12m Price Target MYR 1.37 (+32%)
BUY
Price Performance
88
90
92
94
96
98
100
0.95
1.00
1.05
1.10
1.15
1.20
1.25
May-19 May-19 May-19 Jun-19 Jun-19 Jun-19
Leong Hup Int'l - (LHS, MYR)
Leong Hup Int'l / Kuala Lumpur Composite Index - (RHS, %)
-1M -3M -12M
Absolute (%) (1) na na
Relative to index (%) (6) na na
Source: FactSet
FYE Dec (MYR m) FY17A FY18A FY19E FY20E FY21E
Revenue 5,501 5,747 6,137 6,600 7,094
EBITDA 583 655 778 844 919
Core net profit 193 225 260 294 331
Core EPS (sen) 5.3 6.2 7.1 8.0 9.1
Core EPS growth (%) 5.5 16.8 15.7 12.8 12.6
Net DPS (sen) 0.0 0.0 2.1 2.4 2.7
Core P/E (x) na na 14.6 12.9 11.5
P/BV (x) na na 2.2 1.9 1.7
Net dividend yield (%) na na 2.1 2.3 2.6
ROAE (%) 15.4 15.0 17.0 15.8 15.9
ROAA (%) 4.4 4.8 5.0 5.0 5.1
EV/EBITDA (x) 10.2 9.4 7.8 7.3 6.8
Net gearing (%) (incl perps) 103.0 108.3 75.1 67.6 58.3
Consensus net profit - - 247 272 308
MKE vs. Consensus (%) - - 5.5 8.1 7.4
Company Description
Statistics 52w high/low (MYR) 3m avg turnover (USDm) Free float (%) Issued shares (m) Market capitalisation
Major shareholders: 52.8% 9.0%
3,650
5.1
The company is an integrated poultry player with operations across Malaysia, Singapore, Indonesia, Vietnam and the Philippines
Emerging Glory Clarinden Investments
na/na
27.4
MYR3.8B USD915M
June 25, 2019 2
Leong Hup International
Value Proposition
Leong Hup International Bhd (Leong Hup) is one of the
largest, fully integrated producers of poultry, egg and
livestock feeds in ASEAN, with a presence in Malaysia,
Singapore, Indonesia, Vietnam and the Philippines.
Its 2017 market share of annual production of livestock
feed was estimated to be 10.5% in Malaysia, 5.5% in
Indonesia and 4.0% in Vietnam.
It is the largest poultry producer in Malaysia with a
domestic market share of 27% in 2017. It also ranks among
the top three poultry producers in Indonesia and Vietnam
while in Singapore, it commands the largest market share
of slaughtered poultry.
FY18 revenue breakdown
Source: Company
Industry Drivers
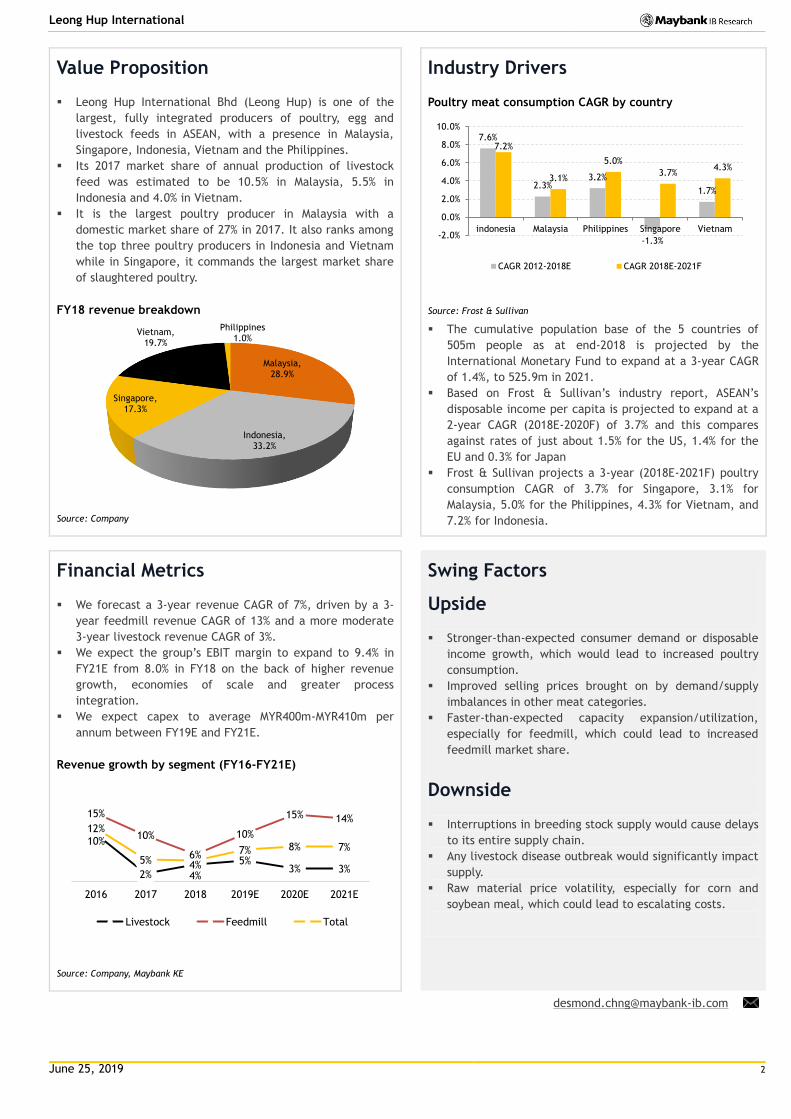
Poultry meat consumption CAGR by country
Source: Frost & Sullivan
The cumulative population base of the 5 countries of
505m people as at end-2018 is projected by the
International Monetary Fund to expand at a 3-year CAGR
of 1.4%, to 525.9m in 2021.
Based on Frost & Sullivan’s industry report, ASEAN’s
disposable income per capita is projected to expand at a
2-year CAGR (2018E-2020F) of 3.7% and this compares
against rates of just about 1.5% for the US, 1.4% for the
EU and 0.3% for Japan
Frost & Sullivan projects a 3-year (2018E-2021F) poultry
consumption CAGR of 3.7% for Singapore, 3.1% for
Malaysia, 5.0% for the Philippines, 4.3% for Vietnam, and
7.2% for Indonesia.
Financial Metrics
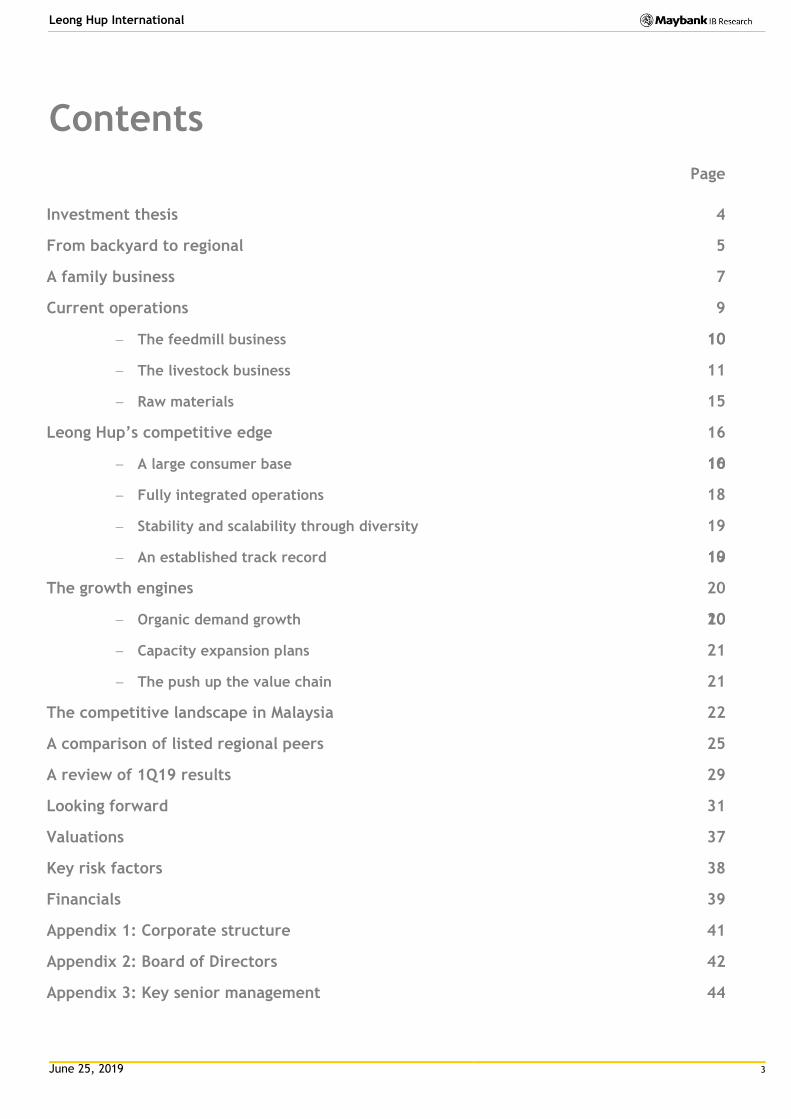
We forecast a 3-year revenue CAGR of 7%, driven by a 3-
year feedmill revenue CAGR of 13% and a more moderate
3-year livestock revenue CAGR of 3%.
We expect the group’s EBIT margin to expand to 9.4% in
FY21E from 8.0% in FY18 on the back of higher revenue
growth, economies of scale and greater process
integration.
We expect capex to average MYR400m-MYR410m per
annum between FY19E and FY21E.
Revenue growth by segment (FY16-FY21E)
Source: Company, Maybank KE
Swing Factors
Upside
Stronger-than-expected consumer demand or disposable
income growth, which would lead to increased poultry
consumption.
Improved selling prices brought on by demand/supply
imbalances in other meat categories.
Faster-than-expected capacity expansion/utilization,
especially for feedmill, which could lead to increased
feedmill market share.
Downside
Interruptions in breeding stock supply would cause delays
to its entire supply chain.
Any livestock disease outbreak would significantly impact
supply.
Raw material price volatility, especially for corn and
soybean meal, which could lead to escalating costs.
Malaysia, 28.9%
Indonesia, 33.2%
Singapore, 17.3%
Vietnam, 19.7%
Philippines 1.0%
7.6%
2.3% 3.2%
-1.3%
1.7%
7.2%
3.1%
5.0%
3.7% 4.3%
-2.0%
0.0%
2.0%
4.0%
6.0%
8.0%
10.0%
indonesia Malaysia Philippines Singapore Vietnam
CAGR 2012-2018E CAGR 2018E-2021F
10%
2% 4% 5%
3% 3%
15%
10%
6%
10%
15% 14% 12%
5%
4%
7% 8% 7%
2016 2017 2018 2019E 2020E 2021E
Livestock Feedmill Total
June 25, 2019 3
Leong Hup International
Contents
Page
Investment thesis 4
From backyard to regional 5
A family business 7
Current operations 9
The feedmill business 10
10
The livestock business 11
Raw materials 15
Leong Hup’s competitive edge 16
A large consumer base 10
16
Fully integrated operations 18
Stability and scalability through diversity 19
An established track record 10
19
The growth engines 20
Organic demand growth 10
20
Capacity expansion plans 21
The push up the value chain 21
The competitive landscape in Malaysia 22
A comparison of listed regional peers 25
A review of 1Q19 results 29
Looking forward 31
Valuations 37
Key risk factors 38
Financials 39
Appendix 1: Corporate structure 41
Appendix 2: Board of Directors 42
Appendix 3: Key senior management 44

June 25, 2019 4
Leong Hup International
Investment thesis
Introduction
Leong Hup group is not only the largest poultry producer in Malaysia, but it is
also, in our opinion, one of the most vertically and geographically diversified. Its
activities comprise both upstream and downstream operations that range from
feedmill production to the rearing of day-old chicks (DOCs) and Broiler chickens,
egg layering and processed chicken products. Geographically, the group has since
expanded its reach into the Singapore, Indonesia, Vietnam and Philippine
markets. It is with this expansion that Leong Hup today is one of the largest fully
integrated producers of poultry, eggs and livestock feeds in Southeast Asia.
Competitive edge
Leong Hup’s fully integrated operations lend to operational efficiencies through
economies of scale, product diversification and resilience through economic
cycles. Its regional diversity, meanwhile, offers it much opportunity for organic
growth outside Malaysia, particularly in under-penetrated markets such as
Vietnam and the Philippines. Moreover, we believe that its operational and
geographical diversity contributes to earnings stability and scalability as well as a
leading edge in an industry with significant barriers to entry. Finally, it helps that
the group has a long-established track record in the business and a single focus
on the production of poultry.
The earnings growth drivers
We forecast a 3-year (FY18-FY21E) core net profit CAGR of 14%, driven
principally by a) capacity expansion and increased investments into under-
penetrated markets such as Vietnam and the Philippines, b) organic growth in
demand for chicken and eggs in the five ASEAN countries that Leong Hup
operates in, driven by population growth and income expansion, and c) the push
up the value chain through greater integration of downstream and upstream
activities as more feedmills are built, as well as the shift in production towards
owned rather than contract farms.
Risk factors
Risk factors include a) possible disruptions to activities if proper certification
requirements for its farms and hatchers in both Malaysia and Indonesia are not
met; b) interruptions in its breeding stock supply from global suppliers such as
Cobb-Vantress and Aviagen; c) an outbreak of livestock disease (eg. Avian
Influenza) in any of Leong Hup’s operating countries, which could be detrimental
to the group’s profitability; d) raw material (primarily corn and soybean meal)
price volatility; and e) dependence on foreign workers.
Valuations
We value Leong Hup at MYR1.37, pegging its earnings to the 2020 weighted
average PER of its regional peers of 17x. Leong Hup’s 2-year (FY18-FY20E) net
profit CAGR of 15.3% compares favourably against its regional peer average of
13.4%, as does its PEG of just 1x at the current share price of MYR1.04, relative
to its peer average of 1.4x.
June 25, 2019 5
Leong Hup International
From backyard to regional
Backyard operations
Leong Hup has come a long way from the days of just rearing Broiler chickens in
the founding family’s backyard in Muar, Johor. This was back in the 1960s and it
was in 1972 that they opened up their first breeder farm. Leong Hup was
established in 1978. Over the years, the operations flourished and the family
business expanded to include more Broiler and breeder farms, feedmills,
slaughtering plants and food processing plants.
Was listed before
The expansion in business culminated in the listing of Leong Hup Holdings (LH
Holdings) on the Main Board of the KLSE on 29 Oct 1990. This was followed by the
listing of other entities within the group, over the following years:
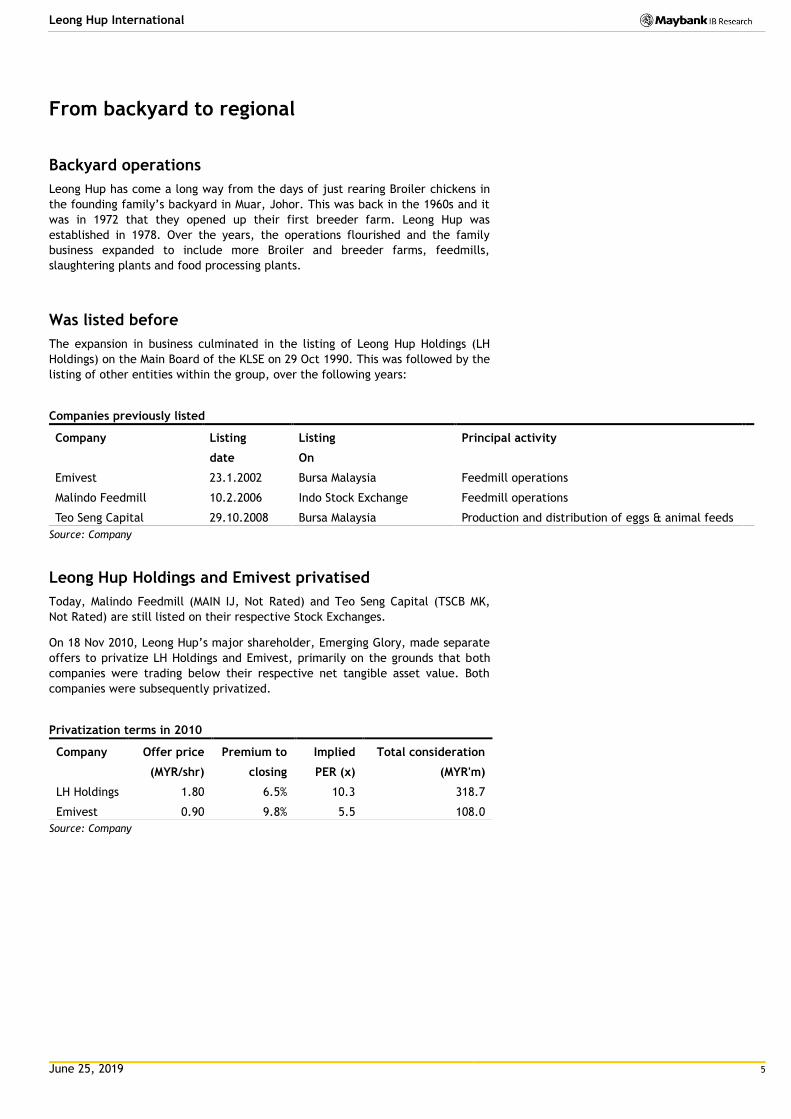
Companies previously listed
Company Listing Listing Principal activity
date On
Emivest 23.1.2002 Bursa Malaysia Feedmill operations
Malindo Feedmill 10.2.2006 Indo Stock Exchange Feedmill operations
Teo Seng Capital 29.10.2008 Bursa Malaysia Production and distribution of eggs & animal feeds
Source: Company
Leong Hup Holdings and Emivest privatised
Today, Malindo Feedmill (MAIN IJ, Not Rated) and Teo Seng Capital (TSCB MK,
Not Rated) are still listed on their respective Stock Exchanges.
On 18 Nov 2010, Leong Hup’s major shareholder, Emerging Glory, made separate
offers to privatize LH Holdings and Emivest, primarily on the grounds that both
companies were trading below their respective net tangible asset value. Both
companies were subsequently privatized.
Privatization terms in 2010
Company Offer price Premium to Implied Total consideration
(MYR/shr) closing PER (x) (MYR'm)
LH Holdings 1.80 6.5% 10.3 318.7
Emivest 0.90 9.8% 5.5 108.0
Source: Company

June 25, 2019 6
Leong Hup International
Has been expanding since then
Since privatization, the group has been in an expansion/transformation mode. It
has since:
Grown its Vietnam operations (first breeder farm was established in 2007)
into one of the largest integrated poultry producers in Vietnam;
Made inroads into the Philippines market with the commencement of its first
Breeder farm operations in 2016;
Acquired in FY17, the remaining 49% stake in Singapore-based Lee Say
Poultry Industrial, which is involved in the slaughtering, processing and sale
of fresh and frozen poultry.
Acquired in FY17, the remaining 25% stake in Singapore-based ES Food
Industries, which moves Leong Hup downstream to the processed food
market. This includes ready-to-eat and ready-to-cook products.
Since 2010, the group has invested much in expanding its production capacity:
In FY10, annual feedmill capacity was just 432k MT. This has since expanded
more than six-fold to 2.7m MT in FY17.
Leong Hup’s production volume in FYE Mar 2011 was approximately 130.4m
Broiler DOCs, 47.1m Broiler chickens and 635m table eggs. In FY17, Leong
Hup’s production of Broiler DOCs, Broiler chickens and eggs was about
456.1m, 99.1m and 1.74b, this representing an increase of about 250%, 111%
and 174% respectively.
The IPO
Leong Hup was listed on 16 May 2019 on Bursa Malaysia’ Main Market at an IPO
price of MYR1.10. Its IPO comprised an institutional and a retail offering of up to
937.5m shares, representing up to 25.7% of its enlarged share capital. The
institutional offering was of up to 687.5m Offer Shares and 152m Issue Shares,
while the retail offering was of 98m Issue Shares.
At the listing price of MYR1.10, the IPO raised a total of MYR1.03b – MYR756m
from the Offer Shares and MYR275m from the Issue Shares.
There is a 6-month moratorium from the date of listing, on Emerging Glory
(52.8% shareholding), Lau Joo Hong (0.68%) and Lau Joo Han (1.89%).
Proceeds to the group of MYR275m from the Issue Shares will be utilized as
follows:
Use of proceeds
(MYR'm) %
Capex 207.7 75.5%
Working capital 33.0 12.0%
IPO expenses 34.3 12.5%
Total 275.0 100.0%
Source: Company
June 25, 2019 7
Leong Hup International
A family business
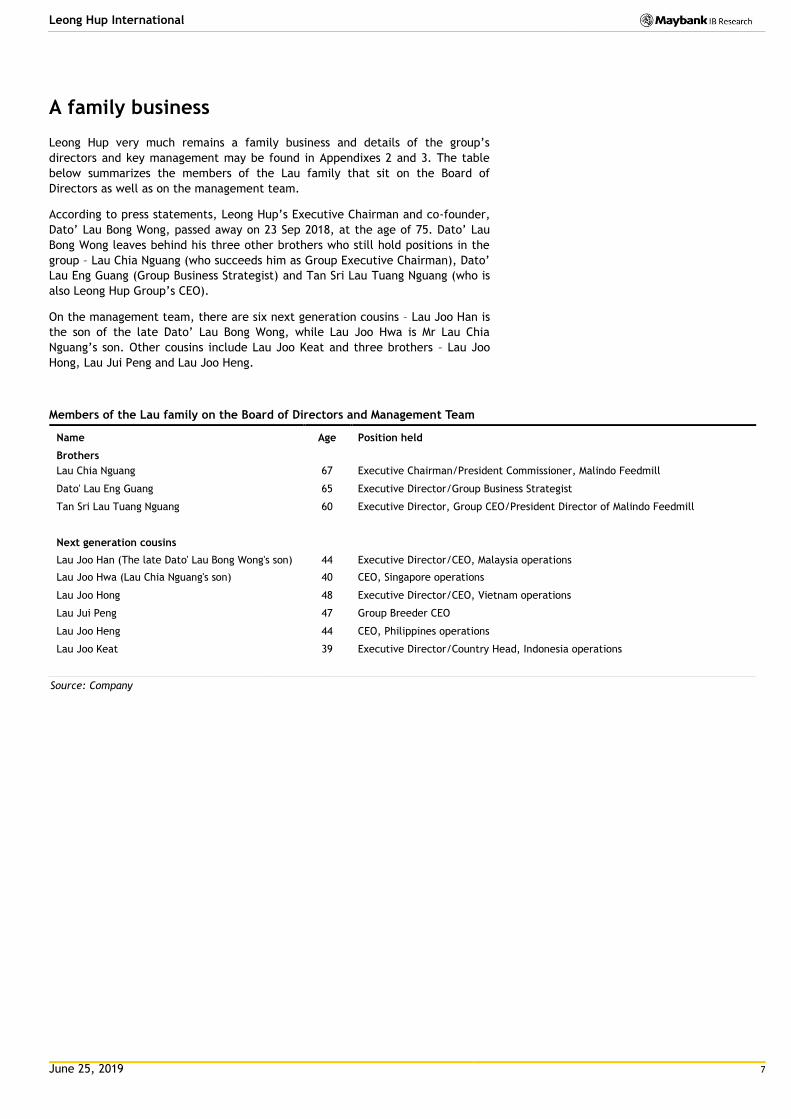
Leong Hup very much remains a family business and details of the group’s
directors and key management may be found in Appendixes 2 and 3. The table
below summarizes the members of the Lau family that sit on the Board of
Directors as well as on the management team.
According to press statements, Leong Hup’s Executive Chairman and co-founder,
Dato’ Lau Bong Wong, passed away on 23 Sep 2018, at the age of 75. Dato’ Lau
Bong Wong leaves behind his three other brothers who still hold positions in the
group – Lau Chia Nguang (who succeeds him as Group Executive Chairman), Dato’
Lau Eng Guang (Group Business Strategist) and Tan Sri Lau Tuang Nguang (who is
also Leong Hup Group’s CEO).
On the management team, there are six next generation cousins – Lau Joo Han is
the son of the late Dato’ Lau Bong Wong, while Lau Joo Hwa is Mr Lau Chia
Nguang’s son. Other cousins include Lau Joo Keat and three brothers – Lau Joo
Hong, Lau Jui Peng and Lau Joo Heng.
Members of the Lau family on the Board of Directors and Management Team
Name Age Position held
Brothers Lau Chia Nguang 67 Executive Chairman/President Commissioner, Malindo Feedmill
Dato' Lau Eng Guang 65 Executive Director/Group Business Strategist
Tan Sri Lau Tuang Nguang 60 Executive Director, Group CEO/President Director of Malindo Feedmill
Next generation cousins
Lau Joo Han (The late Dato' Lau Bong Wong's son) 44 Executive Director/CEO, Malaysia operations
Lau Joo Hwa (Lau Chia Nguang's son) 40 CEO, Singapore operations
Lau Joo Hong 48 Executive Director/CEO, Vietnam operations
Lau Jui Peng 47 Group Breeder CEO
Lau Joo Heng 44 CEO, Philippines operations
Lau Joo Keat 39 Executive Director/Country Head, Indonesia operations
Source: Company

June 25, 2019 8
Leong Hup International
Substantial shareholders – the Lau family
The table below shows the primary shareholders of Leong Hup. The two
substantial shareholders of Leong Hup are Emerging Glory and Clarinden
Investments with post-listing stakes of 52.8% and 9.0% respectively.
Emerging Glory is an investment holding company that is owned by the members
of the Lau family. Clarinden Investments is principally a private equity investor,
which acquired a 23% stake in Leong Hup on 9 Sep 2014. It is part of the Affinity
EPS group, which is one of the largest private equity firms in Asia, with over
USD15b in aggregate transaction value. It currently has two seats on Leong Hup’s
Board of Directors.
Substantial shareholders of Leong Hup post-listing
Emerging Glory 52.80%
Clarinden Investments 9.01%
Lau Joo Hong 0.68%
Lau Joo Han 1.89%
Lau Jui Peng 0.60%
Lau Joo Heng 0.60%
Lau Chia Nguang 1.45%
Dato' Lau Eng Guang 1.45%
Tan Sri Lau Tuang Nguang 1.57%
Lau Joo Keat 1.45%
71.50%
Source: Company
Substantial shareholders of Emerging Glory
Lau Joo Han 20%
Lau Chia Nguang 15%
Tan Sri Lau Tuang Nguang 15%
Dato' Lau Eng Guang 15%
HN Lau & Sons (HNL & S) 15%
CW Lau & Sons (CWL&S) 20%
100%
Source: Company
Substantial shareholders of HN Lau & Sons
Lau Hai Nguan 20%
Lau Joo Keat 20%
Lau Joo Hau 20%
Lau Joo Ping 20%
Lai Chong Koo 20%
100%
Source: Company
Substantial shareholders of CW Lau & Sons
Lau Joo Hong 36%
Lau Jui Peng 32%
Lau Joo Heng 32%
100%
Source: Company
June 25, 2019 9
Leong Hup International
Current operations
One of the largest integrated producers in Southeast Asia
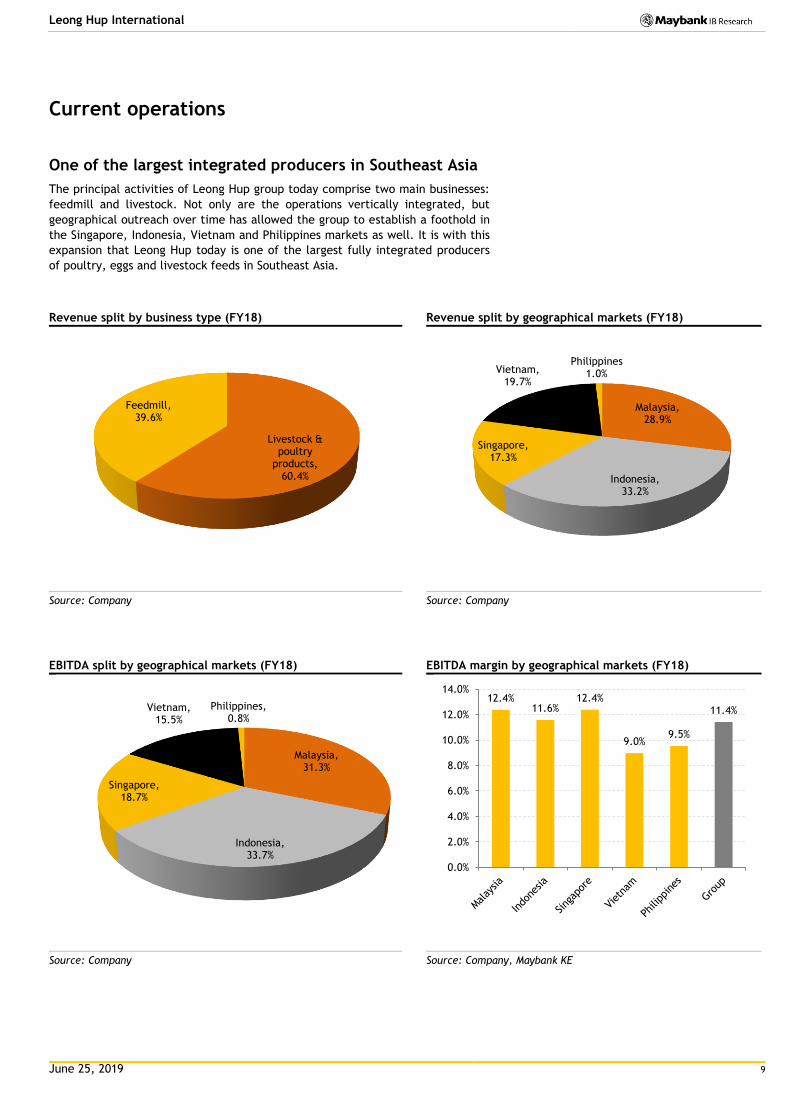
The principal activities of Leong Hup group today comprise two main businesses:
feedmill and livestock. Not only are the operations vertically integrated, but
geographical outreach over time has allowed the group to establish a foothold in
the Singapore, Indonesia, Vietnam and Philippines markets as well. It is with this
expansion that Leong Hup today is one of the largest fully integrated producers
of poultry, eggs and livestock feeds in Southeast Asia.
Revenue split by business type (FY18) Revenue split by geographical markets (FY18)
Source: Company Source: Company
EBITDA split by geographical markets (FY18) EBITDA margin by geographical markets (FY18)
Source: Company Source: Company, Maybank KE
Livestock & poultry
products, 60.4%
Feedmill, 39.6%
Malaysia, 28.9%
Indonesia, 33.2%
Singapore, 17.3%
Vietnam, 19.7%
Philippines 1.0%
Malaysia, 31.3%
Indonesia, 33.7%
Singapore, 18.7%
Vietnam, 15.5%
Philippines, 0.8%
12.4% 11.6%
12.4%
9.0% 9.5%
11.4%
0.0%
2.0%
4.0%
6.0%
8.0%
10.0%
12.0%
14.0%
June 25, 2019 10
Leong Hup International
The feedmill business
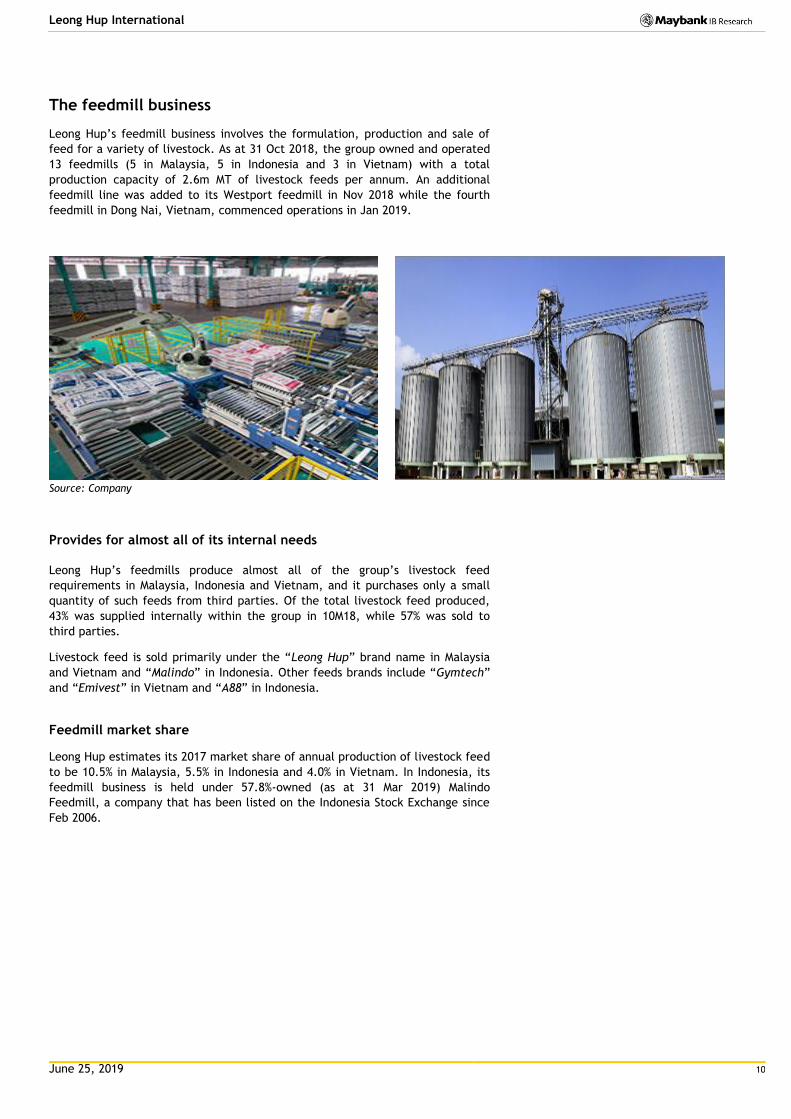
Leong Hup’s feedmill business involves the formulation, production and sale of
feed for a variety of livestock. As at 31 Oct 2018, the group owned and operated
13 feedmills (5 in Malaysia, 5 in Indonesia and 3 in Vietnam) with a total
production capacity of 2.6m MT of livestock feeds per annum. An additional
feedmill line was added to its Westport feedmill in Nov 2018 while the fourth
feedmill in Dong Nai, Vietnam, commenced operations in Jan 2019.
Source: Company
Provides for almost all of its internal needs
Leong Hup’s feedmills produce almost all of the group’s livestock feed
requirements in Malaysia, Indonesia and Vietnam, and it purchases only a small
quantity of such feeds from third parties. Of the total livestock feed produced,
43% was supplied internally within the group in 10M18, while 57% was sold to
third parties.
Livestock feed is sold primarily under the “Leong Hup” brand name in Malaysia
and Vietnam and “Malindo” in Indonesia. Other feeds brands include “Gymtech”
and “Emivest” in Vietnam and “A88” in Indonesia.
Feedmill market share
Leong Hup estimates its 2017 market share of annual production of livestock feed
to be 10.5% in Malaysia, 5.5% in Indonesia and 4.0% in Vietnam. In Indonesia, its
feedmill business is held under 57.8%-owned (as at 31 Mar 2019) Malindo
Feedmill, a company that has been listed on the Indonesia Stock Exchange since
Feb 2006.

June 25, 2019 11
Leong Hup International
Capacity and utilization rates
The table below sets out the production capacity and our tabulated utilization
rates, assuming 22 operational hours per day, an efficiency ratio of 80-90% and
deductions for scheduled maintenance. Utilization rates are calculated as actual
production divided by production capacity.
The production capacity for 10M18 below represents available capacity during
the ten-month period. The decline in utilization rates in 10M18 for Malaysia and
Vietnam was due to a substantial increase in production capacity.
Feedmill production capacity vs actual production & utilization rates (MT)
2017 10M2018
Pdtn cap
Actual pdtn
Util %
Pdtn cap
Actual pdtn
Util %
Malaysia 701,544 642,233 91.5 735,102 551,929 75.1
Indonesia 1,172,160 712,194 60.8 976,800 641,157 65.6
Vietnam 831,600 627,255 75.4 891,000 564,533 63.4
2,705,304 1,981,682 73.3 2,602,902 1,757,619 67.5
Source: Company
The livestock business
Leong Hup’s livestock business comprises:
the rearing of Grandparent stock (GPS) Day Old Chicks (DOCs) in order to
produce Parent stock (PS) DOCs and Broiler DOCs for internal use and
external sale, and the rearing and sale of Broiler chicken;
the rearing of PS Layer DOCs in order to produce Layer DOCs, and the rearing
of Layer chickens in order to produce eggs;
the rearing of PS Ducks in order to produce Broiler DODs, and the rearing and
sale of Broiler ducks; and
the distribution of fresh and processed downstream consumer food products.

June 25, 2019 12
Leong Hup International
DOCs, Broiler chickens and eggs sold in FY17 by region
Msia Indo Viet Spore Phil Total
No. of DOCs supplied (m) 175.2 240.9 36.3 30.7 4.9 488.0
No. of Broiler chickens (m) 56.9 16.3 20.8 11.6 1.4 107.0
Eggs sold (m) 1,287.8 53.4 384.9 - - 1,726.1
No. of DOCs supplied 36% 49% 7% 6% 1% 100%
No. of Broiler chickens 53% 15% 19% 11% 1% 100%
Eggs sold 75% 3% 22% 0% 0% 100%
Source: Company
241 farms and hatcheries
Across the region (Malaysia, Indonesia, Vietnam and the Philippines) and as of 31
Oct 2018, Leong Hup operates a total of 241 farms and hatcheries, and engages
656 contract farms for its poultry business. It also operates six slaughtering
plants across three countries – Malaysia, Indonesia and Singapore.
Distribution of farms owned and contracted as at 31 Oct 2018
GPS PS Broiler Layer Layer PS DOD Hatcheries Total Contract Total Slaughter
DOC DOC chicken DOC chicken & Broiler duck
own farms farms
Plants#
Malaysia 6 19 44 3 25* 11 8 116 19 135 1
Indonesia 4 24 29 2 1 1 18 79 326 405 1
Vietnam 0 4 0 1 3 0 1 9 303 312 0
Singapore^ 0 4 26 0 0 0 2 32 1 33 4
Philippines 0 2 2 0 0 0 1 5 7 12 0
Total 10 53 101 6 29 12 30 241 656 897 6
Source: Company
* All of the Malaysia Livestock Business’ Layer chicken farms are owned and operated by Teo Seng Group
^ All of the Singapore Livestock Business’ farms and hatcheries are located in Malaysia. All of the Singapore Livestock Business’ slaughtering
plants are located in Singapore.
# 1 slaughter plant in Malaysia and 3 in Singapore are for Broiler chickens, while two (in Indonesia and Singapore respectively) are for Broiler
ducks.
June 25, 2019 13
Leong Hup International
The contract farms
Leong Hup’s contract farms accounted for 9% of revenue in FY17. In Malaysia,
Broiler and Layer DOCs are sold to these farms and fully reared Broiler chickens
and Layer chickens are repurchased at a pre-agreed price. In Indonesia, Vietnam
and the Philippines, Leong Hup does not supply livestock but pays these contract
farms a fee for rearing Broiler and Layer DOCs on its behalf.
Largest poultry producer in Malaysia
Leong Hup is the largest integrated poultry producer in Malaysia, with a domestic
market share in 2017 of 27% by annual supply of DOCs. Of the Broiler chickens
produced in Malaysia in 10M18, it slaughtered about 3% in its local slaughtering
plant, transported 24% to Singapore for slaughtering and sold the remainder to
wholesalers, wet market traders and third-party slaughtering plants.
Its egg production division is housed under 28.4%-owned Teo Seng Capital (TSC).
TSC has 25 Layer chicken farms, all of which are in Johor. In 2017, Leong Hup
had the second highest annual production of eggs in Malaysia, among the public
listed integrated poultry companies domestically.
In Malaysia, there are 11 farms designated for its Duck Production operations,
but this division contributed to less than 2% of the group’s revenue from the
Malaysian livestock business in 10M18.
Third largest poultry producer in Indonesia
With over 20 years of experience in poultry production, Leong Hup, through
57.8%-owned Malindo Feedmill, is the third largest integrated poultry producer in
Indonesia, with a 7% market share in 2017 by annual supply of DOCs.
With no slaughter plants for Broiler chickens, all of its Broiler chickens are sold
to external third parties. Meanwhile, the group has since ventured downstream
through Malindo Food Delight, into the production of processed food products.
These are marketed under brands such as “Sunny Gold”, “Ciki Wiki” and “Sobat”.
Other activities in Indonesia include a) egg production and b) duck production.
Second largest poultry producer in Vietnam
Leong Hup has been operating in Vietnam for just over 11 years but it is today
the second largest integrated poultry producer in Vietnam, with an estimated
domestic market share of 13% by annual supply of DOCs in 2017.
The group does not have slaughtering or food processing operations in Vietnam
and all Broiler chicken produced are sold to external third parties. Eggs are
produced at its own layer farms and contract layer farms in the country and all
eggs produced are sold in Vietnam.
The group also has a pharmaceutical plant in Vietnam which produces and
supplies antibiotics, vitamins and disinfectants for livestock. With 148 products
on the market, 49% of the medication is sold externally to third parties, while
the balance is consumed internally.

June 25, 2019 14
Leong Hup International
Largest market share of slaughtered poultry in Singapore
Due to high land cost, farms owned by the group’s Singapore livestock division
are located in Malaysia. This division focuses on the slaughtering and distribution
of Broiler chicken, with a domestic market share of 45.3% as at end-2017, based
on the number of live chickens imported from Malaysia.
In 10M18, 60% of its Broiler chicken was sourced from the group’s Malaysian
livestock business while the balance was purchased from third parties.
Slaughtered chicken accounted for about 33% of the FY17 revenue of its
Singapore livestock business and about 57% of its Broiler chickens slaughtered in
Singapore are halal. 12% of the Singapore livestock business’ FY17 revenue was
derived from the sale of Broiler DOCs and live Broiler chicken.
Another 25% of the Singapore livestock business’ FY17 revenue was derived from
its trading and storage operations, whereby through Leong Hup Distribution, the
group sells and distributes frozen food products (chicken, beef, lamb and
seafood) purchased from third parties in the US, Brazil, Argentina and Australia.
The sale of chilled swine contributed to 16% of the revenue of its Singapore
livestock business in FY17. The swine business was fully divested as of 30 June
2018 and the group no longer sells any swine or swine-related products.
The business in the Philippines is in its infancy stage
Leong Hup’s Philippines business commenced in 2015 and is in its infancy stage.
All livestock feed requirements are purchased from third parties because the
group does not have feedmills there, nor does it have slaughtering nor egg
production facilities at present.
June 25, 2019 15
Leong Hup International
Raw materials
Feedmill business
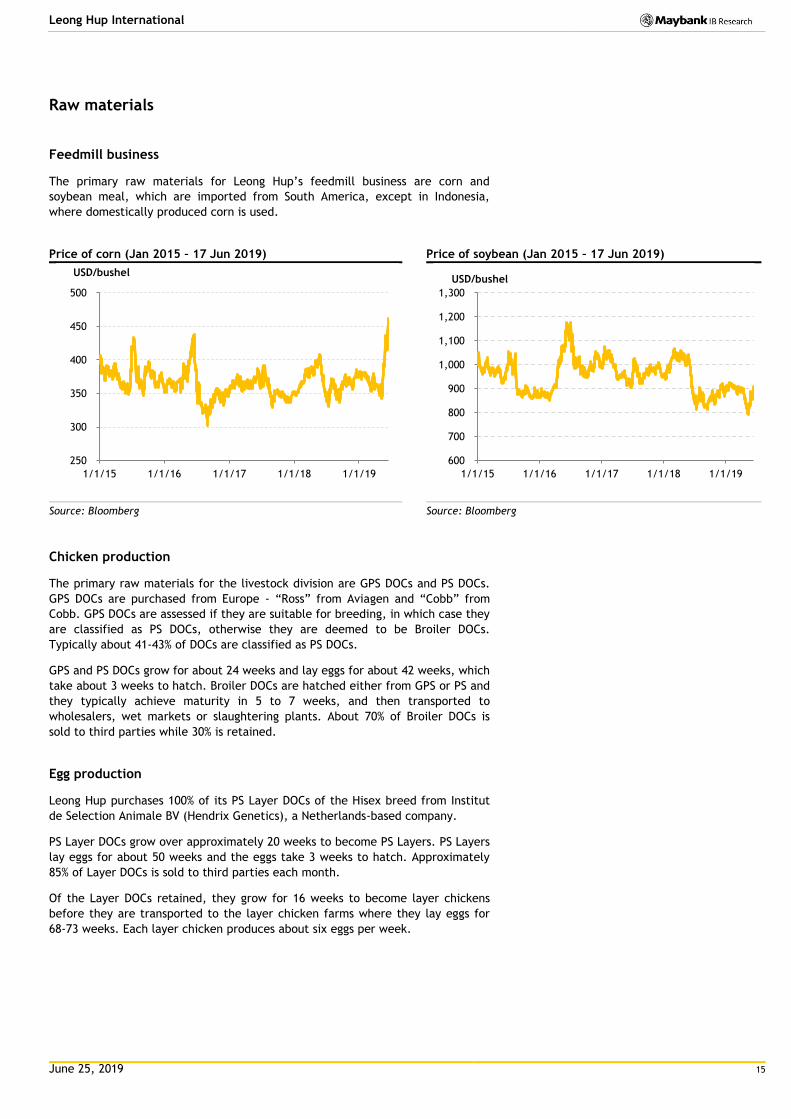
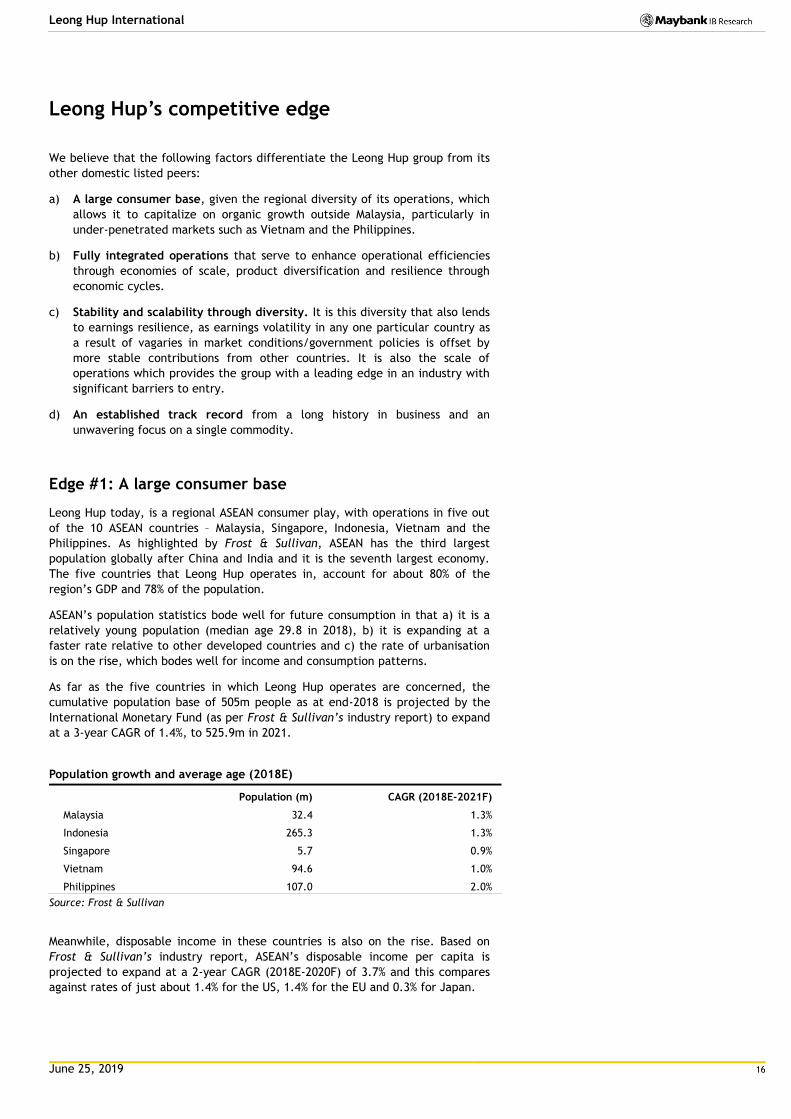
The primary raw materials for Leong Hup’s feedmill business are corn and
soybean meal, which are imported from South America, except in Indonesia,
where domestically produced corn is used.
Price of corn (Jan 2015 – 17 Jun 2019) Price of soybean (Jan 2015 – 17 Jun 2019)
Source: Bloomberg Source: Bloomberg
Chicken production
The primary raw materials for the livestock division are GPS DOCs and PS DOCs.
GPS DOCs are purchased from Europe - “Ross” from Aviagen and “Cobb” from
Cobb. GPS DOCs are assessed if they are suitable for breeding, in which case they
are classified as PS DOCs, otherwise they are deemed to be Broiler DOCs.
Typically about 41-43% of DOCs are classified as PS DOCs.
GPS and PS DOCs grow for about 24 weeks and lay eggs for about 42 weeks, which
take about 3 weeks to hatch. Broiler DOCs are hatched either from GPS or PS and
they typically achieve maturity in 5 to 7 weeks, and then transported to
wholesalers, wet markets or slaughtering plants. About 70% of Broiler DOCs is
sold to third parties while 30% is retained.
Egg production
Leong Hup purchases 100% of its PS Layer DOCs of the Hisex breed from Institut
de Selection Animale BV (Hendrix Genetics), a Netherlands-based company.
PS Layer DOCs grow over approximately 20 weeks to become PS Layers. PS Layers
lay eggs for about 50 weeks and the eggs take 3 weeks to hatch. Approximately
85% of Layer DOCs is sold to third parties each month.
Of the Layer DOCs retained, they grow for 16 weeks to become layer chickens
before they are transported to the layer chicken farms where they lay eggs for
68-73 weeks. Each layer chicken produces about six eggs per week.
250
300
350
400
450
500
1/1/15 1/1/16 1/1/17 1/1/18 1/1/19
USD/bushel
600
700
800
900
1,000
1,100
1,200
1,300
1/1/15 1/1/16 1/1/17 1/1/18 1/1/19
USD/bushel
June 25, 2019 16
Leong Hup International
Leong Hup’s competitive edge
We believe that the following factors differentiate the Leong Hup group from its
other domestic listed peers:
a) A large consumer base, given the regional diversity of its operations, which
allows it to capitalize on organic growth outside Malaysia, particularly in
under-penetrated markets such as Vietnam and the Philippines.
b) Fully integrated operations that serve to enhance operational efficiencies
through economies of scale, product diversification and resilience through
economic cycles.
c) Stability and scalability through diversity. It is this diversity that also lends
to earnings resilience, as earnings volatility in any one particular country as
a result of vagaries in market conditions/government policies is offset by
more stable contributions from other countries. It is also the scale of
operations which provides the group with a leading edge in an industry with
significant barriers to entry.
d) An established track record from a long history in business and an
unwavering focus on a single commodity.
Edge #1: A large consumer base
Leong Hup today, is a regional ASEAN consumer play, with operations in five out
of the 10 ASEAN countries – Malaysia, Singapore, Indonesia, Vietnam and the
Philippines. As highlighted by Frost & Sullivan, ASEAN has the third largest
population globally after China and India and it is the seventh largest economy.
The five countries that Leong Hup operates in, account for about 80% of the
region’s GDP and 78% of the population.
ASEAN’s population statistics bode well for future consumption in that a) it is a
relatively young population (median age 29.8 in 2018), b) it is expanding at a
faster rate relative to other developed countries and c) the rate of urbanisation
is on the rise, which bodes well for income and consumption patterns.
As far as the five countries in which Leong Hup operates are concerned, the
cumulative population base of 505m people as at end-2018 is projected by the
International Monetary Fund (as per Frost & Sullivan’s industry report) to expand
at a 3-year CAGR of 1.4%, to 525.9m in 2021.
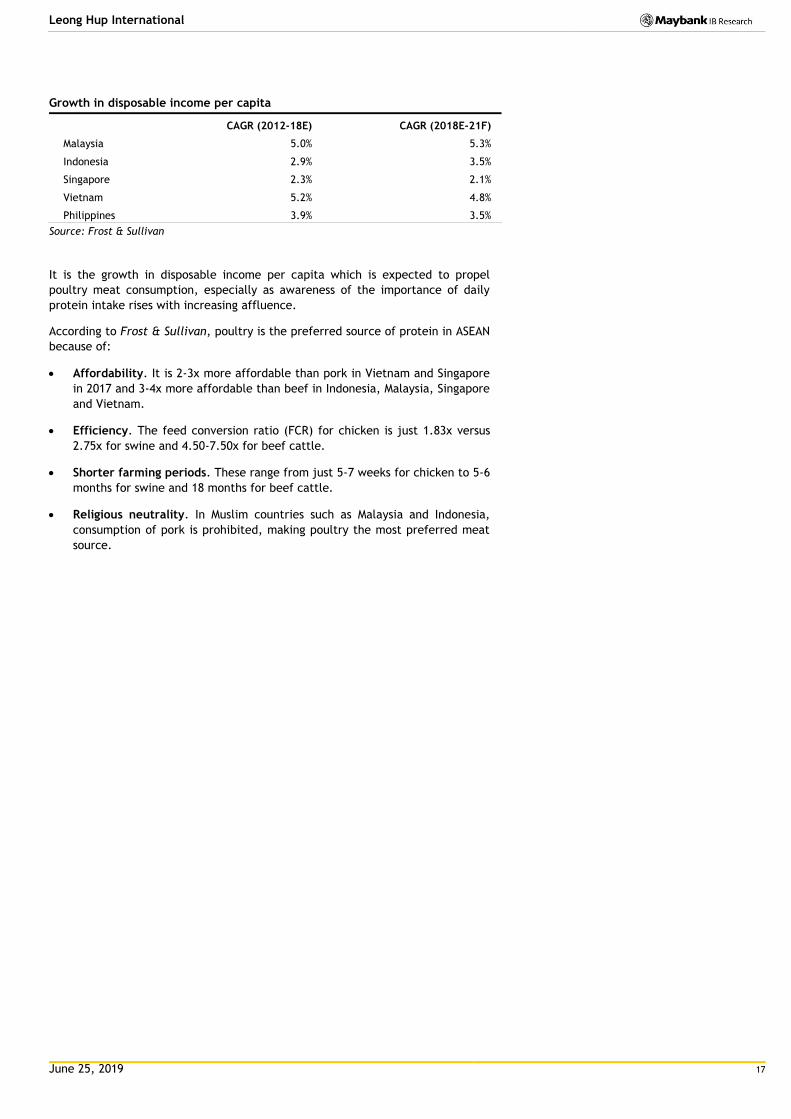
Population growth and average age (2018E)
Population (m) CAGR (2018E-2021F)
Malaysia 32.4 1.3%
Indonesia 265.3 1.3%
Singapore 5.7 0.9%
Vietnam 94.6 1.0%
Philippines 107.0 2.0%
Source: Frost & Sullivan
Meanwhile, disposable income in these countries is also on the rise. Based on
Frost & Sullivan’s industry report, ASEAN’s disposable income per capita is
projected to expand at a 2-year CAGR (2018E-2020F) of 3.7% and this compares
against rates of just about 1.4% for the US, 1.4% for the EU and 0.3% for Japan.
June 25, 2019 17
Leong Hup International
Growth in disposable income per capita
CAGR (2012-18E) CAGR (2018E-21F)
Malaysia 5.0% 5.3%
Indonesia 2.9% 3.5%
Singapore 2.3% 2.1%
Vietnam 5.2% 4.8%
Philippines 3.9% 3.5%
Source: Frost & Sullivan
It is the growth in disposable income per capita which is expected to propel
poultry meat consumption, especially as awareness of the importance of daily
protein intake rises with increasing affluence.
According to Frost & Sullivan, poultry is the preferred source of protein in ASEAN
because of:
Affordability. It is 2-3x more affordable than pork in Vietnam and Singapore
in 2017 and 3-4x more affordable than beef in Indonesia, Malaysia, Singapore
and Vietnam.
Efficiency. The feed conversion ratio (FCR) for chicken is just 1.83x versus
2.75x for swine and 4.50-7.50x for beef cattle.
Shorter farming periods. These range from just 5-7 weeks for chicken to 5-6
months for swine and 18 months for beef cattle.
Religious neutrality. In Muslim countries such as Malaysia and Indonesia,
consumption of pork is prohibited, making poultry the most preferred meat
source.
June 25, 2019 18
Leong Hup International
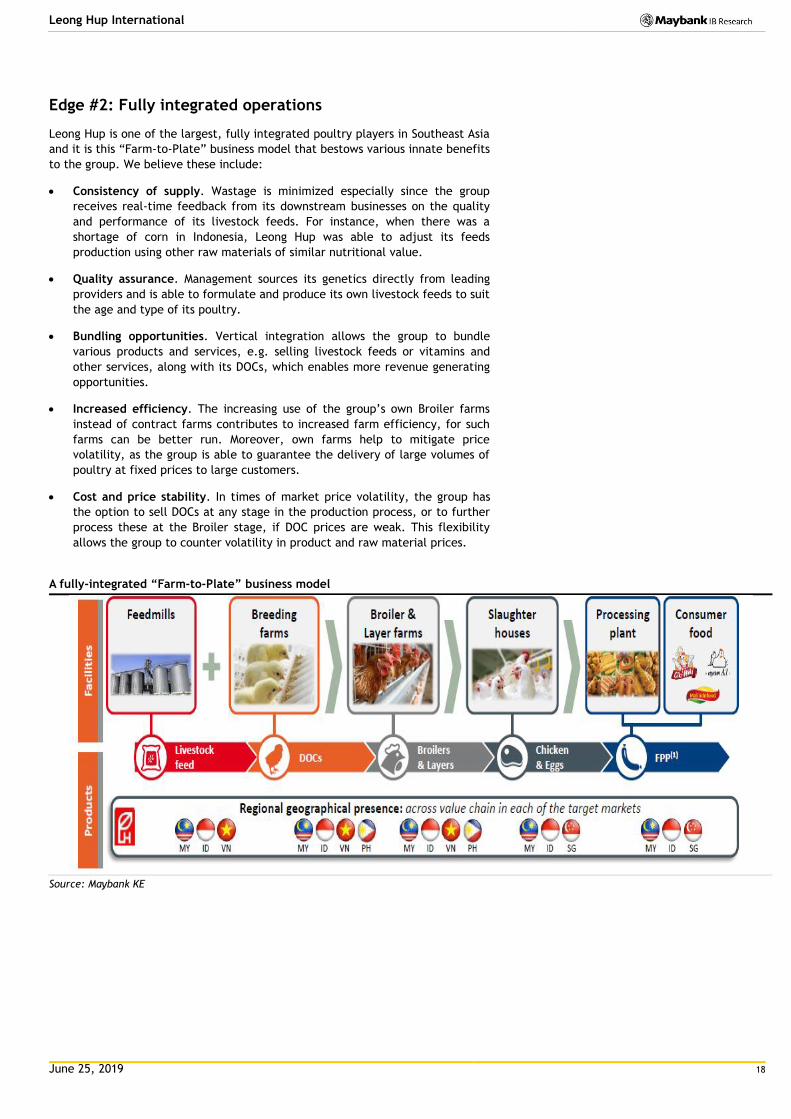
Edge #2: Fully integrated operations
Leong Hup is one of the largest, fully integrated poultry players in Southeast Asia
and it is this “Farm-to-Plate” business model that bestows various innate benefits
to the group. We believe these include:
Consistency of supply. Wastage is minimized especially since the group
receives real-time feedback from its downstream businesses on the quality
and performance of its livestock feeds. For instance, when there was a
shortage of corn in Indonesia, Leong Hup was able to adjust its feeds
production using other raw materials of similar nutritional value.
Quality assurance. Management sources its genetics directly from leading
providers and is able to formulate and produce its own livestock feeds to suit
the age and type of its poultry.
Bundling opportunities. Vertical integration allows the group to bundle
various products and services, e.g. selling livestock feeds or vitamins and
other services, along with its DOCs, which enables more revenue generating
opportunities.
Increased efficiency. The increasing use of the group’s own Broiler farms
instead of contract farms contributes to increased farm efficiency, for such
farms can be better run. Moreover, own farms help to mitigate price
volatility, as the group is able to guarantee the delivery of large volumes of
poultry at fixed prices to large customers.
Cost and price stability. In times of market price volatility, the group has
the option to sell DOCs at any stage in the production process, or to further
process these at the Broiler stage, if DOC prices are weak. This flexibility
allows the group to counter volatility in product and raw material prices.
A fully-integrated “Farm-to-Plate” business model
Source: Maybank KE

June 25, 2019 19
Leong Hup International
Edge #3: Stability and scalability through diversity
Unlike most other domestic listed poultry players that are single-country
focused, we believe that Leong Hup’s size and regional diversity serves it well. It
is the only poultry producer to be concurrently present in Malaysia, Singapore,
Indonesia, Vietnam and the Philippines.
It is this geographical spread that lends to greater resilience against country
specific risks such as domestic competition, regulatory risk, price volatility or
under-performance in any particular market. This spread also helps to somewhat
shield the group against location specific risks such as pandemics, livestock
diseases and fire hazards.
It is this vast operational knowledge and best practices from existing operations
that the group employs to achieve scalability in new markets. For instance, in
Vietnam, where it commenced its breeder farm operations and Broiler DOC
production in 2007, revenue growth has been exponential and annual revenues
have since crossed the MYR1b mark in less than 10 years.
These practices are being replicated in the Philippines market which is still in its
infancy stage and nascent poultry markets that could be considered in the future
include Cambodia.
Edge #4: An established track record
Leong Hup’s history dates back to 1978 and that the Lau family is very much
entrenched in the operations of the group ensures that the knowledge and
experience garnered over the years is retained. Moreover, each of the overseas
operations is currently managed by a nephew/son of the founders, thus ensuring
that the best practices in Malaysia are duplicated within the region.
It is with its experience and established track record that the group has:
Access to quality genetics through its strong relationships with high-quality
genetics companies such as Cobb and Aviagen.
Gained vast knowledge of the compliance requirements of each jurisdiction’s
food and agriculture authorities. These include requirements pertaining to a)
the import of raw materials, b) state influence on pricing and supply of
DOCs, c) certification requirements for farms and slaughterhouses and other
licensing requirements.
Complied with strict quality and compliance standards in the countries
where it operates. Its facilities are certified according to international
standards such as ISO FSMS, HACCP and Food Safety Partners. Where
required, in countries such as Malaysia and Indonesia, Leong Hup has
obtained Halal certification.
Built-up long-established relationships with customers that value its
consistency in supply and quality.
June 25, 2019 20
Leong Hup International
The growth engines
Looking forward, we expect Leong Hup’s earnings growth over the next few years
to be propelled primarily by factors such as:
e) Organic growth in demand for chicken and eggs in the five ASEAN countries
that Leong Hup operates in, which in turn, will be driven by population
growth and income expansion.
f) Capacity expansion and increased investments into under-penetrated
markets such as Vietnam and the Philippines as well as ongoing investments
in the more mature markets such as Malaysia and Indonesia.
g) The push up the value chain through greater integration of downstream and
upstream activities as more feedmills are built, as well as the shift in
production towards owned rather than contract farms. More closed houses
are also expected to be built to ensure better control over the quality of the
chickens produced. These moves should serve to further enhance cost
efficiencies and margins for the group.
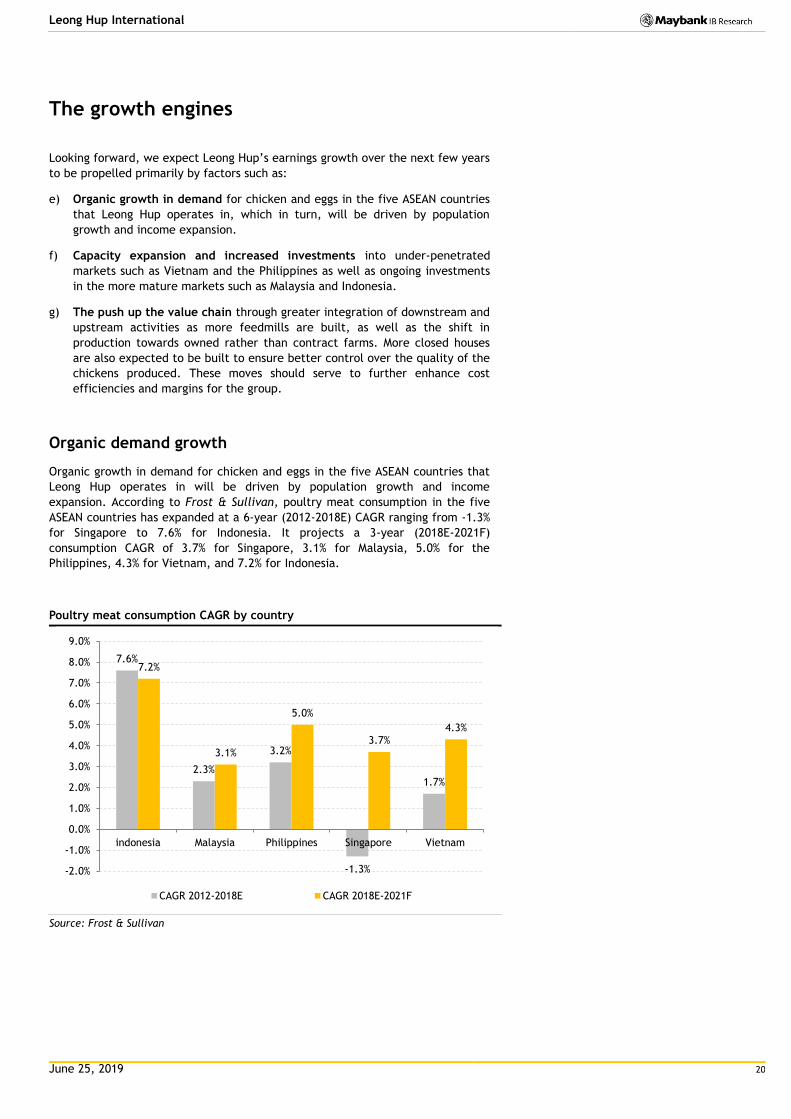
Organic demand growth
Organic growth in demand for chicken and eggs in the five ASEAN countries that
Leong Hup operates in will be driven by population growth and income
expansion. According to Frost & Sullivan, poultry meat consumption in the five
ASEAN countries has expanded at a 6-year (2012-2018E) CAGR ranging from -1.3%
for Singapore to 7.6% for Indonesia. It projects a 3-year (2018E-2021F)
consumption CAGR of 3.7% for Singapore, 3.1% for Malaysia, 5.0% for the
Philippines, 4.3% for Vietnam, and 7.2% for Indonesia.
Poultry meat consumption CAGR by country
Source: Frost & Sullivan
7.6%
2.3%
3.2%
-1.3%
1.7%
7.2%
3.1%
5.0%
3.7% 4.3%
-2.0%
-1.0%
0.0%
1.0%
2.0%
3.0%
4.0%
5.0%
6.0%
7.0%
8.0%
9.0%
indonesia Malaysia Philippines Singapore Vietnam
CAGR 2012-2018E CAGR 2018E-2021F

June 25, 2019 21
Leong Hup International
Capacity expansion plans
75.5% of the IPO proceeds i.e. MYR207.7m, has been earmarked for capex in
Malaysia (MYR40.7m), Vietnam (MYR47m) and the Philippines (MYR120m).
In Malaysia, the proceeds will be allocated to the expansion of its closed-house
Broiler farms. In Vietnam, the proceeds will go towards the expansion of its Dong
Nai feedmill plant. It will also go towards new equipment and machineries across
its three feedmill plants and the expansion of its livestock farms. In the
Philippines, the first feedmill plant (240,000 MT per annum) is expected to
commence construction in 3Q19 and is scheduled to complete in 4Q20.
The push up the value chain
The push up the value chain serves to improve overall margins and profitability
and this can be achieved through the following strategies:
Integrating downstream and upstream operations. In Malaysia and
Indonesia, the feedmills can cater fully to internal requirements, providing
better feed quality control and quicker response to raw material price
changes by adjusting the feed mix. The construction of Vietnam’s fourth
feedmill plant is almost completed and plans are afoot to expand the
capacity of the existing plants. The first feedmill plant in the Philippines is
to be constructed by 2020.
The replacement of contract farms with owned farms. Leong Hup does rely
quite a bit on contract farms for its livestock, particularly in countries such
as Indonesia, Vietnam and the Philippines. The table below sets out the
percentage of owned-to-contract farms within the group. With the gradual
shift towards owned farms, Leong Hup will be able to better control the
quality of production while cutting back on middlemen costs.
Owned farms versus contract farms
Owned farms Contract farms Total % owned
Malaysia 116 19 135 86%
Indonesia 79 326 405 20%
Vietnam 9 303 312 3%
Singapore 32 1 33 97%
Philippines 5 7 12 42%
Total 241 656 897 27%
Source: Company
The replacement of open farms with closed farms. Closed farms essentially
allow for better control over the quality of chicken and minimise the risk of
infection from external sources.
Investments in automation processes for better efficiencies and margins.
Leong Hup’s feedmills in Malaysia are fully automated while for its livestock
business, most of its farms employ close-house systems which are
environmentally controlled to optimize growth rates, health and mortality
rates. Moves are afoot to automate the feedmills in Indonesia and Vietnam
as well.
June 25, 2019 22
Leong Hup International
The competitive landscape in Malaysia
The following is a cursory examination of some of Leong Hup’s domestically listed
peers. Competitors include CAB Cakaran, CCK Consolidated, DBE Gurney
Resources, Lay Hong, LTKM, PWF Consolidated, QL Resources, Sinmah Capital and
TPC Plus, all of which are NOT RATED except QL Resources (QLG MK, SELL, TP:
6.00). The information below is derived from publicly available sources such as
financial statements, annual reports and/or the respective companies’ websites.
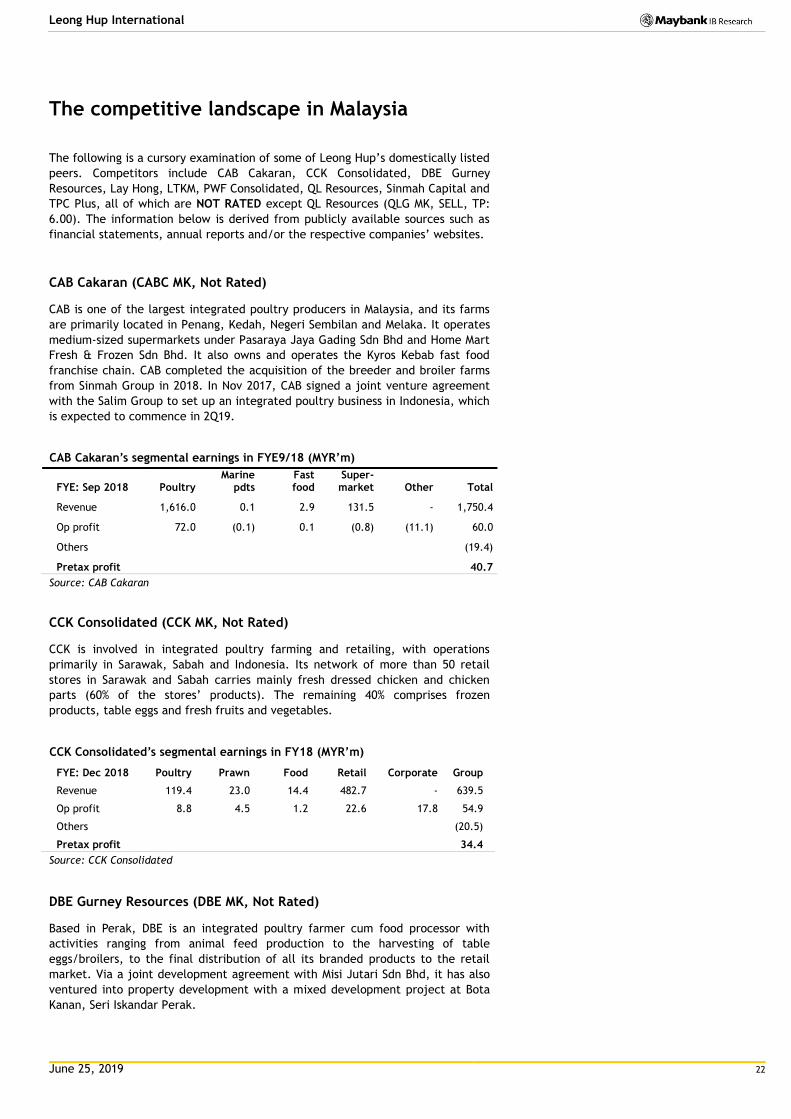
CAB Cakaran (CABC MK, Not Rated)
CAB is one of the largest integrated poultry producers in Malaysia, and its farms
are primarily located in Penang, Kedah, Negeri Sembilan and Melaka. It operates
medium-sized supermarkets under Pasaraya Jaya Gading Sdn Bhd and Home Mart
Fresh & Frozen Sdn Bhd. It also owns and operates the Kyros Kebab fast food
franchise chain. CAB completed the acquisition of the breeder and broiler farms
from Sinmah Group in 2018. In Nov 2017, CAB signed a joint venture agreement
with the Salim Group to set up an integrated poultry business in Indonesia, which
is expected to commence in 2Q19.
CAB Cakaran’s segmental earnings in FYE9/18 (MYR’m)
FYE: Sep 2018 Poultry Marine
pdts Fast food
Super-market Other Total
Revenue 1,616.0 0.1 2.9 131.5 - 1,750.4
Op profit 72.0 (0.1) 0.1 (0.8) (11.1) 60.0
Others (19.4)
Pretax profit
40.7
Source: CAB Cakaran
CCK Consolidated (CCK MK, Not Rated)
CCK is involved in integrated poultry farming and retailing, with operations
primarily in Sarawak, Sabah and Indonesia. Its network of more than 50 retail
stores in Sarawak and Sabah carries mainly fresh dressed chicken and chicken
parts (60% of the stores’ products). The remaining 40% comprises frozen
products, table eggs and fresh fruits and vegetables.
CCK Consolidated’s segmental earnings in FY18 (MYR’m)
FYE: Dec 2018 Poultry Prawn Food Retail Corporate Group
Revenue 119.4 23.0 14.4 482.7 - 639.5
Op profit 8.8 4.5 1.2 22.6 17.8 54.9
Others
(20.5)
Pretax profit
34.4
Source: CCK Consolidated
DBE Gurney Resources (DBE MK, Not Rated)
Based in Perak, DBE is an integrated poultry farmer cum food processor with
activities ranging from animal feed production to the harvesting of table
eggs/broilers, to the final distribution of all its branded products to the retail
market. Via a joint development agreement with Misi Jutari Sdn Bhd, it has also
ventured into property development with a mixed development project at Bota
Kanan, Seri Iskandar Perak.
June 25, 2019 23
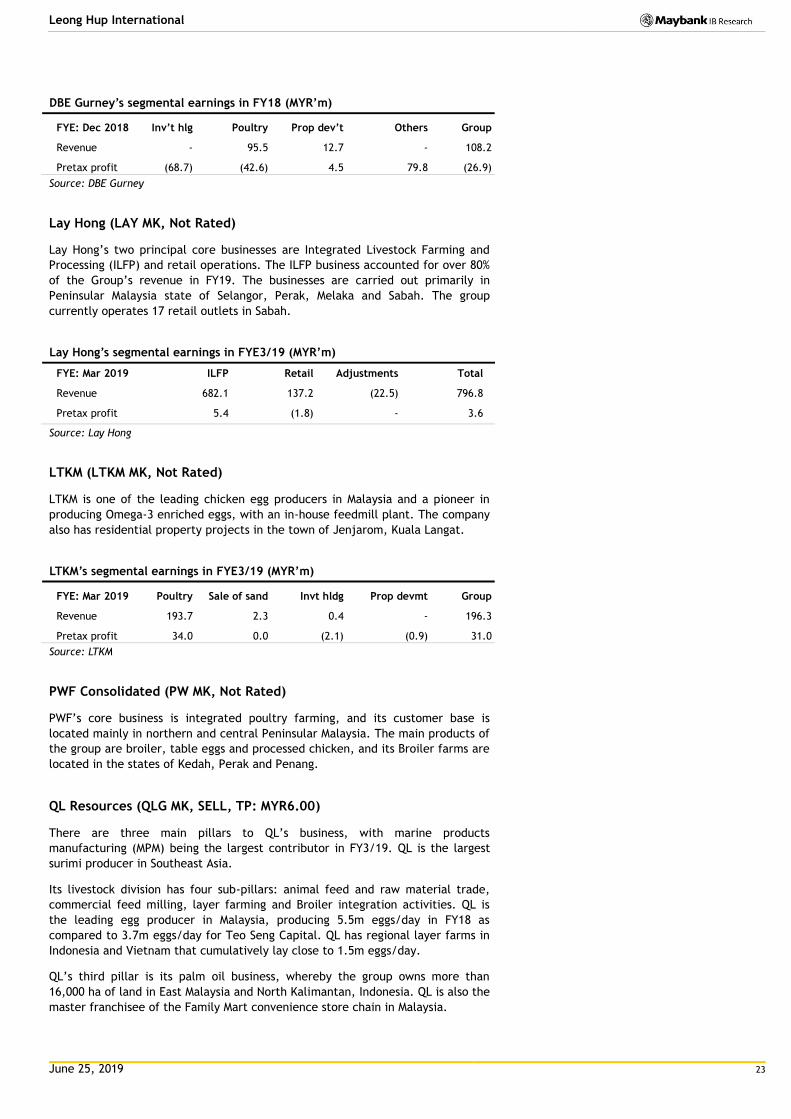
Leong Hup International
DBE Gurney’s segmental earnings in FY18 (MYR’m)
FYE: Dec 2018 Inv’t hlg Poultry Prop dev’t Others Group
Revenue - 95.5 12.7 - 108.2
Pretax profit (68.7) (42.6) 4.5 79.8 (26.9)
Source: DBE Gurney
Lay Hong (LAY MK, Not Rated)
Lay Hong’s two principal core businesses are Integrated Livestock Farming and
Processing (ILFP) and retail operations. The ILFP business accounted for over 80%
of the Group’s revenue in FY19. The businesses are carried out primarily in
Peninsular Malaysia state of Selangor, Perak, Melaka and Sabah. The group
currently operates 17 retail outlets in Sabah.
Lay Hong’s segmental earnings in FYE3/19 (MYR’m)
FYE: Mar 2019 ILFP Retail Adjustments Total
Revenue 682.1 137.2 (22.5) 796.8
Pretax profit 5.4 (1.8) - 3.6
Source: Lay Hong
LTKM (LTKM MK, Not Rated)
LTKM is one of the leading chicken egg producers in Malaysia and a pioneer in
producing Omega-3 enriched eggs, with an in-house feedmill plant. The company
also has residential property projects in the town of Jenjarom, Kuala Langat.
LTKM’s segmental earnings in FYE3/19 (MYR’m)
FYE: Mar 2019 Poultry Sale of sand Invt hldg Prop devmt Group
Revenue 193.7 2.3 0.4 - 196.3
Pretax profit 34.0 0.0 (2.1) (0.9) 31.0
Source: LTKM
PWF Consolidated (PW MK, Not Rated)
PWF’s core business is integrated poultry farming, and its customer base is
located mainly in northern and central Peninsular Malaysia. The main products of
the group are broiler, table eggs and processed chicken, and its Broiler farms are
located in the states of Kedah, Perak and Penang.
QL Resources (QLG MK, SELL, TP: MYR6.00)
There are three main pillars to QL’s business, with marine products
manufacturing (MPM) being the largest contributor in FY3/19. QL is the largest
surimi producer in Southeast Asia.
Its livestock division has four sub-pillars: animal feed and raw material trade,
commercial feed milling, layer farming and Broiler integration activities. QL is
the leading egg producer in Malaysia, producing 5.5m eggs/day in FY18 as
compared to 3.7m eggs/day for Teo Seng Capital. QL has regional layer farms in
Indonesia and Vietnam that cumulatively lay close to 1.5m eggs/day.
QL’s third pillar is its palm oil business, whereby the group owns more than
16,000 ha of land in East Malaysia and North Kalimantan, Indonesia. QL is also the
master franchisee of the Family Mart convenience store chain in Malaysia.

June 25, 2019 24
Leong Hup International
QL Resources’ segmental earnings in FY3/19 (MYR’m)
FYE: Mar 2019 MPM Palm oil Livestock Total
Revenue 1,007.9 303.1 2,302.3 3,613.3
Pretax profit 153.3 20.4 98.6 272.3
Source: QL Resources
Sinmah Capital (SINM MK, Not Rated)
Sinmah is involved in the manufacture and sale of animal feeds, Broiler contract
farming, trading of Broilers and DOCs and poultry biologicals. The other principal
activity of the group is housing development in Melaka.
Sinmah Capital’s segmental earnings in FY18 (MYR’m)
FYE: Dec 2018 Poultry Property Others Group
Revenue 347 26 (192) 180.9
Pretax profit/(loss) (83) 1 47 (35.1)
Source: Sinmah Capital
TPC Plus (TPC MK, Not Rated)
Principally engaged in the production and sale of table eggs and feeds, mainly in
the southern region of Peninsular Malaysia.
TPC Plus’ segmental earnings in FY18 (MYR’m)
FYE: Dec 2018 Livestock Feed Others Group
Revenue 134.9 77.8 0.3 213.1
Segment results (0.2) 7.5 1.1 8.4
Others (4.0)
Pretax profit 4.5
Source: TPC Plus
A comparison of peer financials
Company FY Revenue (MYR'm) Net profit (MYR'm) Net gearing (x) ROAE (%)
end 2018 2017 2018 2017 2018 2018
Leong Hup Dec 5,747 5,501 186 193 1.1 15.0%
CAB Cakaran Sep 1,750 1,492 30 58 0.6 7.3%
CCK Consolidated Dec 639 616 26 29 0.1 10.6%
DBE Gurney Resources Dec 108 112 (28) (20) 0.0 (39.1%)
Lay Hong * Mar 797 848 7 27 0.7 2.1%
LTKM * Mar 196 175 21 2 0.2 8.8%
PWF Consolidated Dec 352 347 15 20 0.4 5.0%
QL Resources * Mar 3,613 3,263 225 203 0.5 12.1%
Sinmah Capital Dec 181 300 (39) 15 0.2 (38.0%)
Teo Seng Capital Dec 490 424 30 3 0.5 11.5%
TPC Plus Dec 213 114 3 (0) 0.5 3.9%
Source: Respective companies’ financial statements, Maybank KE * Data is for FYE3/18 and FYE3/19

June 25, 2019 25
Leong Hup International
A comparison of listed regional peers
As per Frost & Sullivan’s industry report, of the public-listed poultry companies
in Leong Hup’s countries of operation as at end-Dec 2017, only Charoen
Pokhpand Foods PCL (CP Foods; CPF TB, BUY, TP: THB31.50), Japfa Ltd (Japfa;
JAP SP, BUY, TP: SGD0.93) and QL Resources operate in at least two of the
countries of focus for Leong Hup.
Apart from Frost & Sullivan, the information pertaining to Leong Hup’s regional
peers is derived from publicly available sources such as financial statements,
annual reports and/or the respective companies’ corporate websites.
Focusing on CP Group and Japfa, some of the comparatives as at end-2017, as
provided by Frost & Sullivan are as follows:
Market share comparison between Leong Hup (LH), CP Group and Japfa, 2017
LH CP Japfa
Malaysia
Feedmill 10.5% 5.2% NP
DOCs supplied 27.1% 7.7% NP
Indonesia
Feedmill 5.5% 30.9% 20.6%
DOCs supplied 7.0% 37.2% 20.5%
Vietnam
Feedmill 4.0% 17.1% 4.4%
DOCs supplied 12.7% 31.0% 9.8%
Source: Frost & Sullivan NP = not present
Revenue contribution by country, 2017
LH CP Japfa
Indonesia 31.7% 35.5% 74.2%
Malaysia 28.8% - -
Singapore 19.8% - -
Vietnam 19.2% 12.5% 9.5%
China - 25.7% -
Others 0.5% 26.3% 16.3%
100.0% 100.0% 100.0%
Source: Frost & Sullivan

June 25, 2019 26
Leong Hup International
Charoen Pokhpand Foods PCL (CPF TB, BUY, TP: THB31.50)
Listed on the Thailand Stock Exchange, CP Foods is a food giant in the region,
with integrated agro-industrial and food businesses not just in Thailand, but
globally as well, encompassing swine, Broiler, layer, duck, shrimp and fish. Its
businesses span 16 countries from Thailand to Russia to the UK and the US. In
ASEAN, the group has livestock businesses in Thailand, Malaysia, Cambodia,
Vietnam, Laos and the Philippines. In 2017, the group derived 30% of its sales
from domestic sales in Thailand, 6% from Thai exports and 64% from its
international operations. CP Foods also holds a 34% stake in CP All (CPALL TB,
BUY, TP: THB86.00), which is the 7-Eleven franchisee in Thailand.
CP Foods’ segmental revenue in FY18 (MYR’m)
FYE: Dec 2018 Feed Farm Food Total
Thailand 6,284 10,620 5,736 22,640
China 14,844 2,469 804 18,116
Vietnam 3,502 6,568 292 10,361
Others 4,454 8,524 4,571 17,550
Total revenue 29,084 28,181 11,403 68,668
Source: CP Foods, Maybank KE Exchange rate used: 1MYR:THB7.89
Japfa Ltd (JAP SP, BUY, TP: SGD0.93)
Headquartered in Singapore and listed on the Singapore Stock Exchange, Japfa
specializes in producing dairy, protein staples (poultry, beef, swine &
aquaculture) and packaged food. Its upstream activity comprises animal feed
production, and the breeding of dairy cattle, poultry, beef cattle, swine and
aquaculture.
Its midstream activities include milking, poultry farming, beef feedlots, swine
fattening and aquaculture commercial farming. Downstream activities comprise
branded dairy products and branded consumer food.
The group’s operations span across Indonesia, Vietnam, Myanmar, India and
China. Its poultry feed and poultry breeding operations are located in all these
countries except for China, where the focus is on cattle feed, breeding and
milking operations.
Japfa Ltd’s segmental earnings in FY18 (MYR’m)
FYE: Dec 2018 Animal Animal Dairy Consumer Others Group
protein protein
food
Indonesia Others
Revenue
10,052
2,496
1,708
871
66
15,193
Pretax profit
906
120
183
(83)
(78)
1,047
Source: Japfa Ltd, Maybank KE Exchange rate used: 1USD:MYR4.30
Other listed regional peers (list is not comprehensive) include:
PT Charoen Pokhpand Indonesia Tbk,
Japfa Ltd’s 52.4%-owned PT Japfa Comfeed Indonesia,
PT Sierad Produce,
Lee Feed Mill PLC, and
GFPT Ltd
June 25, 2019 27
Leong Hup International
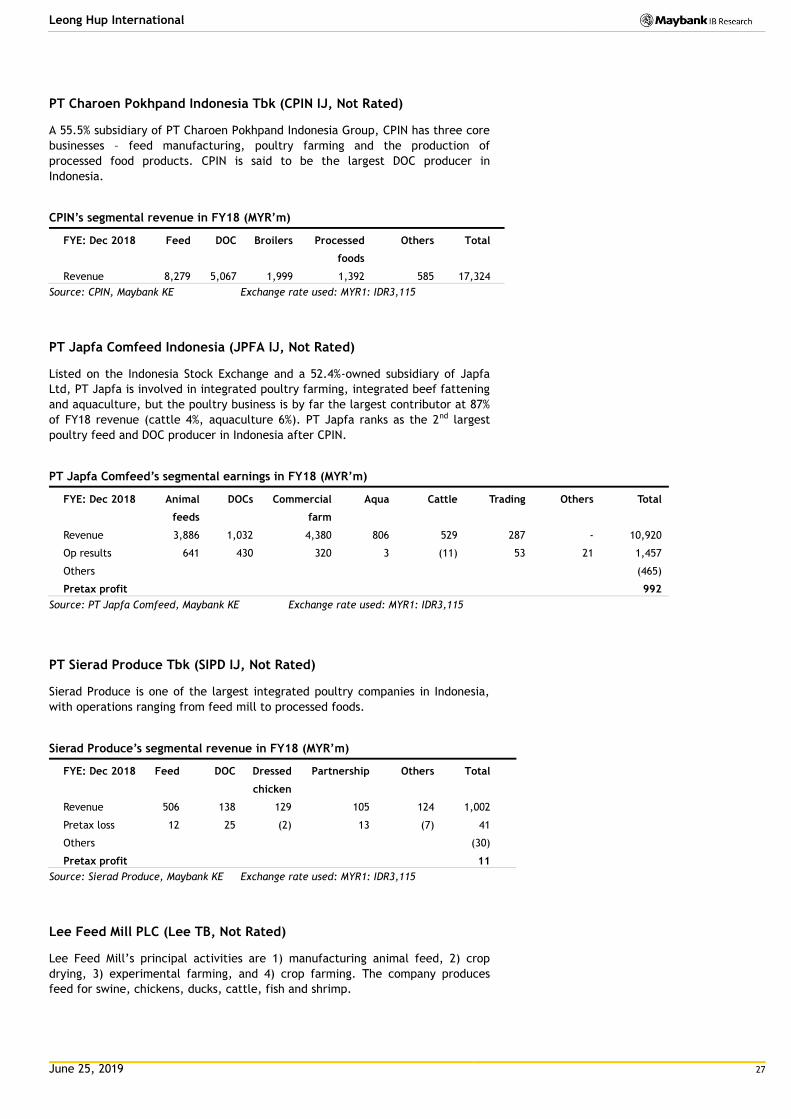
PT Charoen Pokhpand Indonesia Tbk (CPIN IJ, Not Rated)
A 55.5% subsidiary of PT Charoen Pokhpand Indonesia Group, CPIN has three core
businesses – feed manufacturing, poultry farming and the production of
processed food products. CPIN is said to be the largest DOC producer in
Indonesia.
CPIN’s segmental revenue in FY18 (MYR’m)
FYE: Dec 2018 Feed DOC Broilers Processed Others Total
foods
Revenue 8,279 5,067 1,999 1,392 585 17,324
Source: CPIN, Maybank KE Exchange rate used: MYR1: IDR3,115
PT Japfa Comfeed Indonesia (JPFA IJ, Not Rated)
Listed on the Indonesia Stock Exchange and a 52.4%-owned subsidiary of Japfa
Ltd, PT Japfa is involved in integrated poultry farming, integrated beef fattening
and aquaculture, but the poultry business is by far the largest contributor at 87%
of FY18 revenue (cattle 4%, aquaculture 6%). PT Japfa ranks as the 2nd largest
poultry feed and DOC producer in Indonesia after CPIN.
PT Japfa Comfeed’s segmental earnings in FY18 (MYR’m)
FYE: Dec 2018 Animal DOCs Commercial Aqua Cattle Trading Others Total
feeds
farm
Revenue 3,886 1,032 4,380 806 529 287 - 10,920
Op results 641 430 320 3 (11) 53 21 1,457
Others (465)
Pretax profit 992
Source: PT Japfa Comfeed, Maybank KE Exchange rate used: MYR1: IDR3,115
PT Sierad Produce Tbk (SIPD IJ, Not Rated)
Sierad Produce is one of the largest integrated poultry companies in Indonesia,
with operations ranging from feed mill to processed foods.
Sierad Produce’s segmental revenue in FY18 (MYR’m)
FYE: Dec 2018 Feed DOC Dressed Partnership Others Total
chicken
Revenue 506 138 129 105 124 1,002
Pretax loss 12 25 (2) 13 (7) 41
Others (30)
Pretax profit 11
Source: Sierad Produce, Maybank KE Exchange rate used: MYR1: IDR3,115
Lee Feed Mill PLC (Lee TB, Not Rated)
Lee Feed Mill’s principal activities are 1) manufacturing animal feed, 2) crop
drying, 3) experimental farming, and 4) crop farming. The company produces
feed for swine, chickens, ducks, cattle, fish and shrimp.
June 25, 2019 28
Leong Hup International
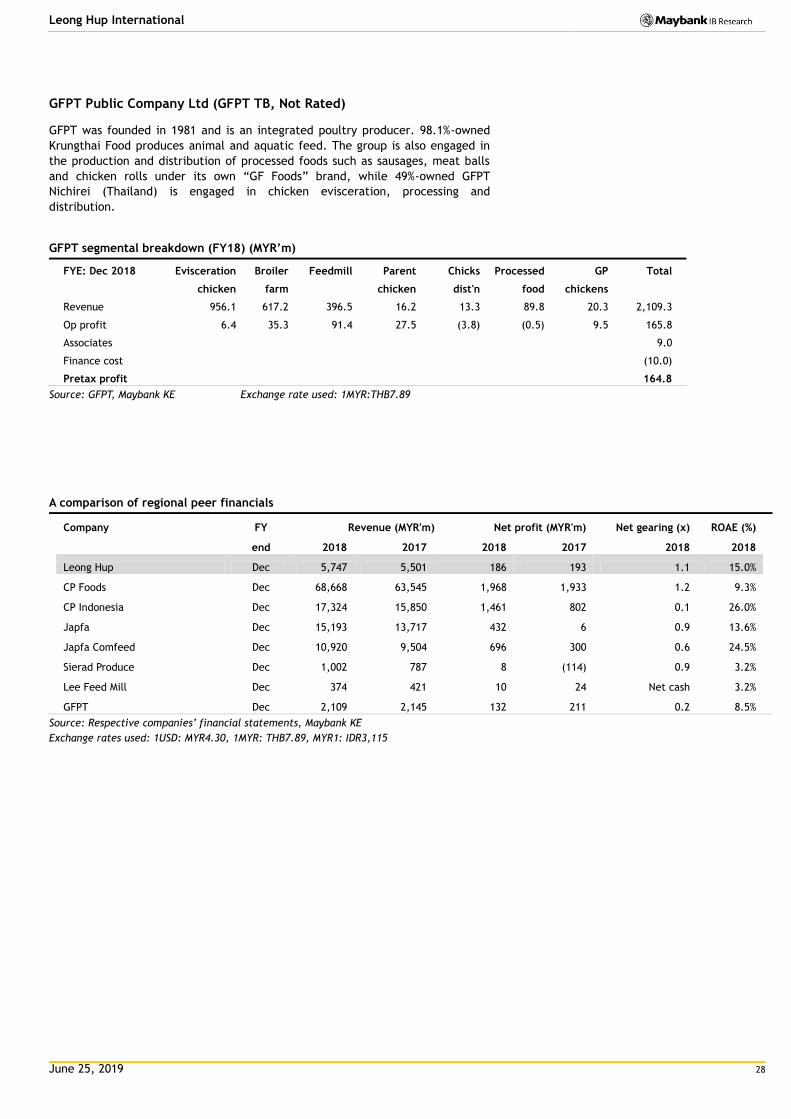
GFPT Public Company Ltd (GFPT TB, Not Rated)
GFPT was founded in 1981 and is an integrated poultry producer. 98.1%-owned
Krungthai Food produces animal and aquatic feed. The group is also engaged in
the production and distribution of processed foods such as sausages, meat balls
and chicken rolls under its own “GF Foods” brand, while 49%-owned GFPT
Nichirei (Thailand) is engaged in chicken evisceration, processing and
distribution.
GFPT segmental breakdown (FY18) (MYR’m)
FYE: Dec 2018 Evisceration Broiler Feedmill Parent Chicks Processed GP Total
chicken farm
chicken dist'n food chickens
Revenue 956.1 617.2 396.5 16.2 13.3 89.8 20.3 2,109.3
Op profit 6.4 35.3 91.4 27.5 (3.8) (0.5) 9.5 165.8
Associates
9.0
Finance cost
(10.0)
Pretax profit
164.8
Source: GFPT, Maybank KE Exchange rate used: 1MYR:THB7.89
A comparison of regional peer financials
Company FY Revenue (MYR'm) Net profit (MYR'm) Net gearing (x) ROAE (%)
end 2018 2017 2018 2017 2018 2018
Leong Hup Dec 5,747 5,501 186 193 1.1 15.0%
CP Foods Dec 68,668 63,545 1,968 1,933 1.2 9.3%
CP Indonesia Dec 17,324 15,850 1,461 802 0.1 26.0%
Japfa Dec 15,193 13,717 432 6 0.9 13.6%
Japfa Comfeed Dec 10,920 9,504 696 300 0.6 24.5%
Sierad Produce Dec 1,002 787 8 (114) 0.9 3.2%
Lee Feed Mill Dec 374 421 10 24 Net cash 3.2%
GFPT Dec 2,109 2,145 132 211 0.2 8.5%
Source: Respective companies’ financial statements, Maybank KE
Exchange rates used: 1USD: MYR4.30, 1MYR: THB7.89, MYR1: IDR3,115

June 25, 2019 29
Leong Hup International
A review of 1Q19 results
Year end: Dec (MYR'm) 1Q19 1Q18 % YoY
Revenue 1,506.4 1,346.4 12%
Other income 6.2 9.3 (33%)
Operating expenses (1,311.9) (1,204.8) 9%
EBITDA 200.6 150.9 33%
Dep’n & amortization (52.9) (49.0) 8%
EBIT 147.7 101.8 45%
Finance costs (32.9) (24.5) 34%
Share of associate profits 0.0 0.1 (63%)
Pretax profit 114.9 77.4 48%
Tax (24.6) (16.4) 50%
MI (29.7) (8.3) 256%
Net profit 60.6 52.7 15%
EBITDA margin 13.3% 11.2%
EBIT margin 9.8% 7.6%
Pretax profit margin 7.6% 5.8%
Net profit margin 4.0% 3.9%
Tax rate 21.4% 21.2%
Source: Company
Revenue breakdown
FY Dec (MYR m) 1Q19 1Q18 % YoY
Livestock & poultry products 859.7 837.2 3%
Feedmill 643.6 506.7 27%
Others 3.1 2.5 23%
Total revenue 1,506.4 1,346.4 12%
Malaysia 442.2 394.3 12%
Singapore 193.3 271.3 (29%)
Vietnam 293.2 249.4 18%
Indonesia 563.4 420.5 34%
Philippines 14.1 10.9 30%
Total revenue 1,506.4 1,346.4 12%
Source: Company
EBITDA breakdown
FY Dec (MYR m) 1Q19 1Q18 % YoY
Livestock & poultry products 118.9 94.5 26%
Feedmill 85.2 62.5 36%
Others (3.5) (6.1) (43%)
Total EBITDA 200.6 150.9 33%
EBITDA margin
Livestock & poultry products 13.8% 11.3%
Feedmill 13.2% 12.3%
Total 13.3% 11.2%
Source: Company
June 25, 2019 30
Leong Hup International
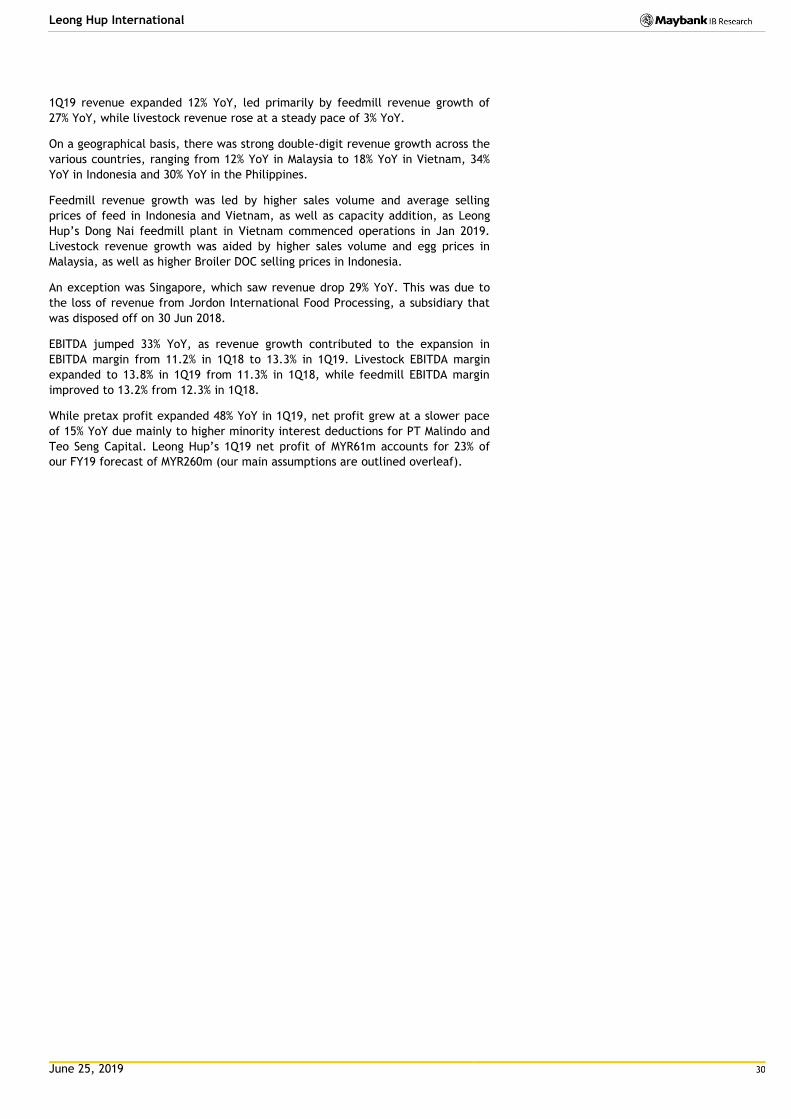
1Q19 revenue expanded 12% YoY, led primarily by feedmill revenue growth of
27% YoY, while livestock revenue rose at a steady pace of 3% YoY.
On a geographical basis, there was strong double-digit revenue growth across the
various countries, ranging from 12% YoY in Malaysia to 18% YoY in Vietnam, 34%
YoY in Indonesia and 30% YoY in the Philippines.
Feedmill revenue growth was led by higher sales volume and average selling
prices of feed in Indonesia and Vietnam, as well as capacity addition, as Leong
Hup’s Dong Nai feedmill plant in Vietnam commenced operations in Jan 2019.
Livestock revenue growth was aided by higher sales volume and egg prices in
Malaysia, as well as higher Broiler DOC selling prices in Indonesia.
An exception was Singapore, which saw revenue drop 29% YoY. This was due to
the loss of revenue from Jordon International Food Processing, a subsidiary that
was disposed off on 30 Jun 2018.
EBITDA jumped 33% YoY, as revenue growth contributed to the expansion in
EBITDA margin from 11.2% in 1Q18 to 13.3% in 1Q19. Livestock EBITDA margin
expanded to 13.8% in 1Q19 from 11.3% in 1Q18, while feedmill EBITDA margin
improved to 13.2% from 12.3% in 1Q18.
While pretax profit expanded 48% YoY in 1Q19, net profit grew at a slower pace
of 15% YoY due mainly to higher minority interest deductions for PT Malindo and
Teo Seng Capital. Leong Hup’s 1Q19 net profit of MYR61m accounts for 23% of
our FY19 forecast of MYR260m (our main assumptions are outlined overleaf).
June 25, 2019 31
Leong Hup International
Looking forward
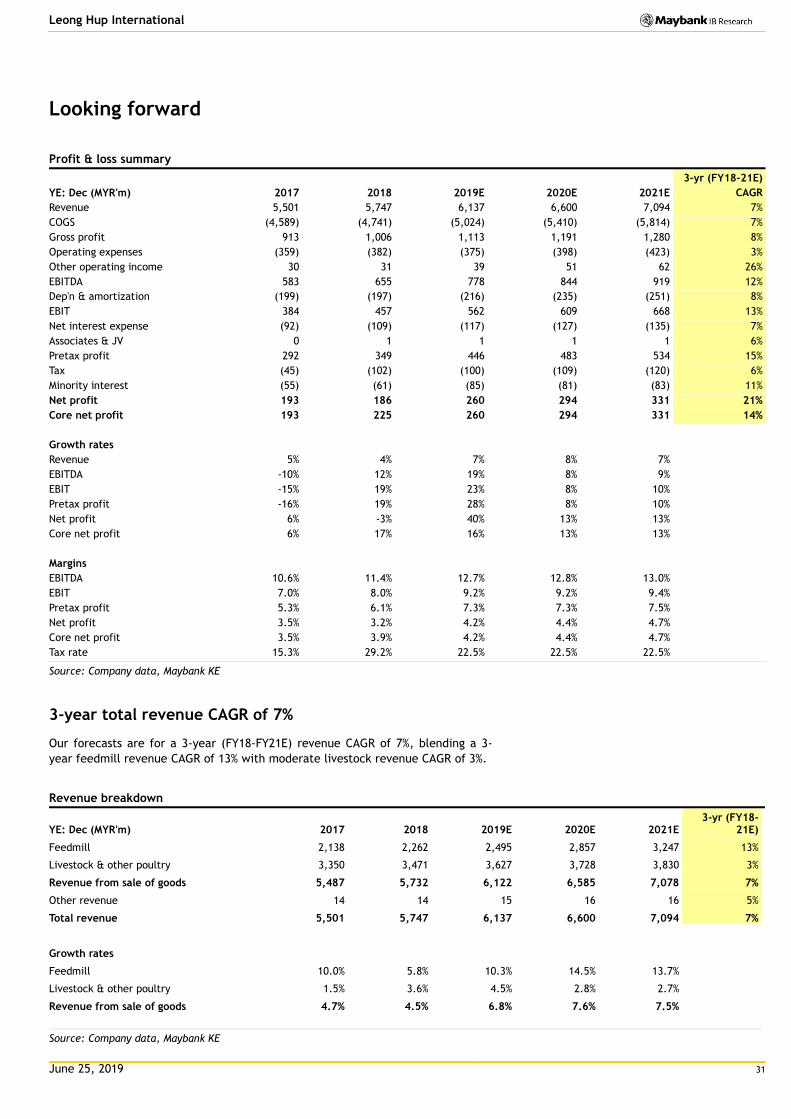
Profit & loss summary
YE: Dec (MYR'm) 2017 2018 2019E 2020E 2021E
3-yr (FY18-21E)
CAGR
Revenue 5,501 5,747 6,137 6,600 7,094 7%
COGS (4,589) (4,741) (5,024) (5,410) (5,814) 7%
Gross profit 913 1,006 1,113 1,191 1,280 8%
Operating expenses (359) (382) (375) (398) (423) 3%
Other operating income 30 31 39 51 62 26%
EBITDA 583 655 778 844 919 12%
Dep'n & amortization (199) (197) (216) (235) (251) 8%
EBIT 384 457 562 609 668 13%
Net interest expense (92) (109) (117) (127) (135) 7%
Associates & JV 0 1 1 1 1 6%
Pretax profit 292 349 446 483 534 15%
Tax (45) (102) (100) (109) (120) 6%
Minority interest (55) (61) (85) (81) (83) 11%
Net profit 193 186 260 294 331 21%
Core net profit 193 225 260 294 331 14%
Growth rates
Revenue 5% 4% 7% 8% 7%
EBITDA -10% 12% 19% 8% 9%
EBIT -15% 19% 23% 8% 10%
Pretax profit -16% 19% 28% 8% 10%
Net profit 6% -3% 40% 13% 13%
Core net profit 6% 17% 16% 13% 13%
Margins
EBITDA 10.6% 11.4% 12.7% 12.8% 13.0%
EBIT 7.0% 8.0% 9.2% 9.2% 9.4%
Pretax profit 5.3% 6.1% 7.3% 7.3% 7.5%
Net profit 3.5% 3.2% 4.2% 4.4% 4.7%
Core net profit 3.5% 3.9% 4.2% 4.4% 4.7%
Tax rate 15.3% 29.2% 22.5% 22.5% 22.5%
Source: Company data, Maybank KE
3-year total revenue CAGR of 7%
Our forecasts are for a 3-year (FY18-FY21E) revenue CAGR of 7%, blending a 3-
year feedmill revenue CAGR of 13% with moderate livestock revenue CAGR of 3%.
Revenue breakdown
YE: Dec (MYR'm) 2017 2018 2019E 2020E 2021E 3-yr (FY18-
21E)
Feedmill 2,138 2,262 2,495 2,857 3,247 13%
Livestock & other poultry 3,350 3,471 3,627 3,728 3,830 3%
Revenue from sale of goods 5,487 5,732 6,122 6,585 7,078 7%
Other revenue 14 14 15 16 16 5%
Total revenue 5,501 5,747 6,137 6,600 7,094 7%
Growth rates
Feedmill 10.0% 5.8% 10.3% 14.5% 13.7%
Livestock & other poultry 1.5% 3.6% 4.5% 2.8% 2.7%
Revenue from sale of goods 4.7% 4.5% 6.8% 7.6% 7.5%
Source: Company data, Maybank KE
June 25, 2019 32
Leong Hup International
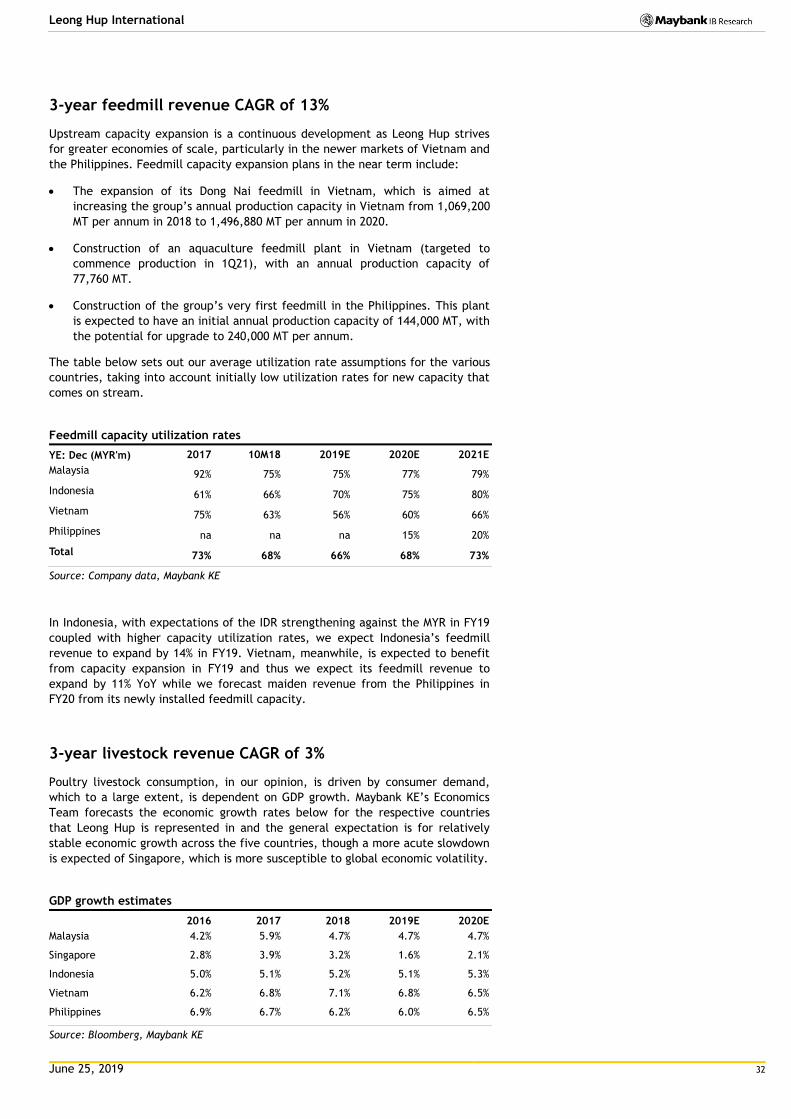
3-year feedmill revenue CAGR of 13%
Upstream capacity expansion is a continuous development as Leong Hup strives
for greater economies of scale, particularly in the newer markets of Vietnam and
the Philippines. Feedmill capacity expansion plans in the near term include:
The expansion of its Dong Nai feedmill in Vietnam, which is aimed at
increasing the group’s annual production capacity in Vietnam from 1,069,200
MT per annum in 2018 to 1,496,880 MT per annum in 2020.
Construction of an aquaculture feedmill plant in Vietnam (targeted to
commence production in 1Q21), with an annual production capacity of
77,760 MT.
Construction of the group’s very first feedmill in the Philippines. This plant
is expected to have an initial annual production capacity of 144,000 MT, with
the potential for upgrade to 240,000 MT per annum.
The table below sets out our average utilization rate assumptions for the various
countries, taking into account initially low utilization rates for new capacity that
comes on stream.
Feedmill capacity utilization rates
YE: Dec (MYR'm) 2017 10M18 2019E 2020E 2021E
Malaysia 92% 75% 75% 77% 79%
Indonesia 61% 66% 70% 75% 80%
Vietnam 75% 63% 56% 60% 66%
Philippines na na na 15% 20%
Total 73% 68% 66% 68% 73%
Source: Company data, Maybank KE
In Indonesia, with expectations of the IDR strengthening against the MYR in FY19
coupled with higher capacity utilization rates, we expect Indonesia’s feedmill
revenue to expand by 14% in FY19. Vietnam, meanwhile, is expected to benefit
from capacity expansion in FY19 and thus we expect its feedmill revenue to
expand by 11% YoY while we forecast maiden revenue from the Philippines in
FY20 from its newly installed feedmill capacity.
3-year livestock revenue CAGR of 3%
Poultry livestock consumption, in our opinion, is driven by consumer demand,
which to a large extent, is dependent on GDP growth. Maybank KE’s Economics
Team forecasts the economic growth rates below for the respective countries
that Leong Hup is represented in and the general expectation is for relatively
stable economic growth across the five countries, though a more acute slowdown
is expected of Singapore, which is more susceptible to global economic volatility.
GDP growth estimates
2016 2017 2018 2019E 2020E
Malaysia 4.2% 5.9% 4.7% 4.7% 4.7%
Singapore 2.8% 3.9% 3.2% 1.6% 2.1%
Indonesia 5.0% 5.1% 5.2% 5.1% 5.3%
Vietnam 6.2% 6.8% 7.1% 6.8% 6.5%
Philippines 6.9% 6.7% 6.2% 6.0% 6.5%
Source: Bloomberg, Maybank KE
June 25, 2019 33
Leong Hup International
As a commodity, however, poultry sales volume is also impacted by
uncontrollable issues such as the demand/supply of other competing livestock,
disease outbreaks, etc, which lead to much fluctuation in selling prices and sales.
In Malaysia, Broiler DOC and chicken prices were relatively stable in 2018, down
a marginal 5% YoY during the year, based on publicly available data. Egg prices,
however, spiked in 2H18 due largely to the incidence of chicken deaths due to
animal disease and rose about 8% YoY on average during the year. In the first five
months of 2019, indications are that DOC and Broiler chicken prices are about 5-
6% lower YoY but egg prices are about 18% higher YoY.
In Indonesia, selling prices (based on publicly available data) rebounded in 2018
from weakness in 2017, and average Broiler DOC and chicken prices were 16% and
32% higher YoY during the year. In the first five months of 2019, Broiler chicken
prices are about 11% lower YoY, but DOC prices are still about 25% higher YoY.
Broiler chicken prices may be supported in the near term by culling activity, in
our view. In the medium term, the Government’s decision to lift the grandparent
stock import quota by 11% for 2019 could add to medium term supply and soften
prices.
In Vietnam, poultry prices improved in 2018 and were up approximately 10% YoY
amid the recovery in swine prices, which suffered in the previous two years when
China restricted swine imports from Vietnam. Prices in the first five months of
2019 have generally been softer YoY by about 4%, by our estimates. African swine
fever from China has spread to Vietnam and according to recent press reports,
has spread to farms in 58 of the country’s 63 provinces, and resulted in the
culling of more than 2.5m swine to-date. The effects have yet to be felt on
chicken prices, but this could still be a potential price catalyst, in our view.

June 25, 2019 34
Leong Hup International
Primary cost components & profit margins
We forecast an improvement in the group’s EBIT margin to 9.4% in FY21 from
8.0% in FY18, driven by: (i) revenue growth, (ii) relatively stable raw material
costs and (iii) the replacement of contract farms with owned farms, which allows
management to better control quality and improve efficiencies.
Leong Hup’s primary cost components and our assumptions are detailed below,
with inventory and employee costs accounting for about 78% of total revenue.
Inventory costs comprise mainly the purchase of raw materials such as corn,
soybean meal, packaging materials, vitamins, livestock feed additives, animal
vaccines, GPS DOCs and PS DOCs.
Profit margins & cost components
YE: Dec (MYR'm) 2017 2018 2019E 2020E 2021E
EBIT margin 7.0% 8.0% 9.2% 9.2% 9.4%
Cost components
Inventory costs (3,835) (4,042) (4,253) (4,484) (4,784)
Employee costs (504) (524) (552) (617) (677)
Dep’n/amortization (199) (197) (216) (235) (251)
Utilities (131) (137) (135) (147) (158)
Maintenance costs (62) (74) (76) (81) (86)
Transport (80) (91) (84) (90) (99)
Other expenses (346) (358) (328) (389) (432)
As % of revenue
Inventory costs 70% 70% 69% 68% 67%
Employee costs 9% 9% 9% 9% 10%
Dep’n/amortization 4% 3% 4% 4% 4%
Utilities costs 2% 2% 2% 2% 2%
Maintenance costs 1% 1% 1% 1% 1%
Transport costs 1% 2% 1% 1% 1%
Other expenses 6% 6% 5% 6% 6%
Source: Company data, Maybank KE
By our estimates, corn and soybean meal account for about 19% and 18% of total
inventory cost, with livestock costs making up the balance. Our FY19 forecast
assumes a 5% YoY increase in average corn prices and stable soybean meal prices.
Corn prices have spiked in recent weeks due to delayed planting caused by wet
weather and the risk is that this could prolong. Nevertheless, as we understand,
Leong Hup typically buys forward by about 2-3 months so we would expect a
lagged effect. Moreover, raw material cost increases are typically passed through
in the form of livestock price increases, given that feed profit is typically cost
plus in nature. Currency wise, our forecasts assume an average USD/MYR of 4.14
in FY19 versus 4.04 in FY18 and 4.26 in FY17.
Corn & soybean meal prices (USD/bushel)
YE: Dec (USD/bushel) 2017 2018 2019E 2020E 2021E
Corn 3.59 3.68 3.87 3.87 3.87
Soybean 9.76 9.32 9.32 9.32 9.32
USD/MYR 4.26 4.04 4.14 4.14 4.14
Source: Bloomberg, Maybank KE
June 25, 2019 35
Leong Hup International
Tax rates distorted by deferred tax
Leong Hup’s effective tax rate was a low 15% in FY17 due to the recognition of
MYR29m worth of deferred tax credits, the bulk of which related to tax
incentives given to PT Malindo by the Ministry of Finance in Indonesia for
conducting the revaluation of certain asset classes. The higher tax rate of 29% in
FY18 takes into consideration the reversal of some of these deferred tax credits.
Moving forward, we have imputed a more normalized effective tax rate of 22.5%,
which is lower than Malaysia’s corporate tax rate of 24% due to ongoing tax
incentives in Vietnam from capacity expansion.
3-year core net profit CAGR of 14%
Taking the above assumptions and estimates into consideration, we expect
earnings growth to be robust over the next two years, projecting core net profit
growth of 16% in FY19 (1Q19: +15% YoY) and 13% in FY20 and 21 respectively.
This translates to a 3-year core net profit CAGR of 14%. The variance between
our FY18 reported and core net profit of MYR38.7m was due to one-off expenses
incurred in FY18. These include, among others, a one-off provision relating to a
dispute between Malindo Feedmill and the Indonesian Directorate General of
Customs and Excise on the qualification of VAT exemption, and an accrual for IPO
expenses.
30% dividend payout
Leong Hup’s management targets a dividend payout ratio of 30% (of net profit)
moving forward and this is what we have assumed in our forecasts.
Capex plans
Leong Hup’s capex was about MYR400m in FY18 and we expect capex to average
MYR400m-MYR410m per annum between FY19 and FY21. Feedmill capacity
expansion aside, capex will also be spent on new Broiler and Layer farms across
the regional countries, with the aim of (i) replacing contract farms with the
group’s own farms as well as (ii) substituting open farms with closed farms.
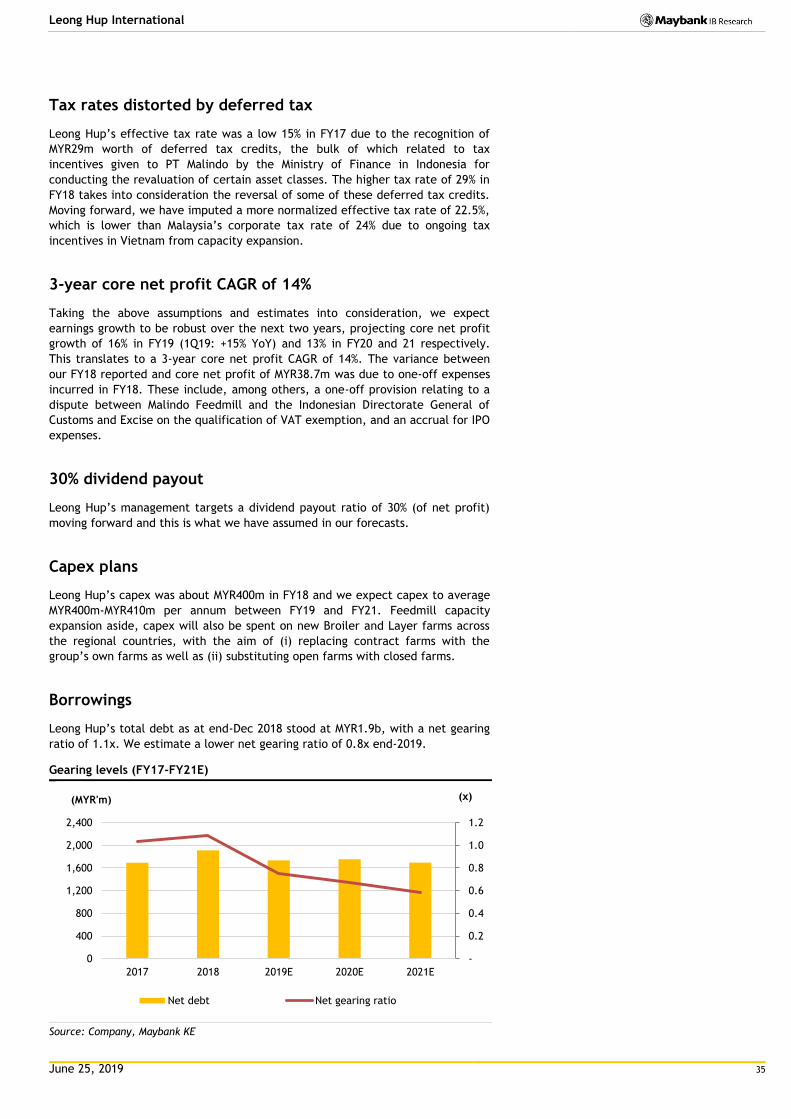
Borrowings
Leong Hup’s total debt as at end-Dec 2018 stood at MYR1.9b, with a net gearing
ratio of 1.1x. We estimate a lower net gearing ratio of 0.8x end-2019.
Gearing levels (FY17-FY21E)
Source: Company, Maybank KE
-
0.2
0.4
0.6
0.8
1.0
1.2
0
400
800
1,200
1,600
2,000
2,400
2017 2018 2019E 2020E 2021E
(x) (MYR'm)
Net debt Net gearing ratio
June 25, 2019 36
Leong Hup International
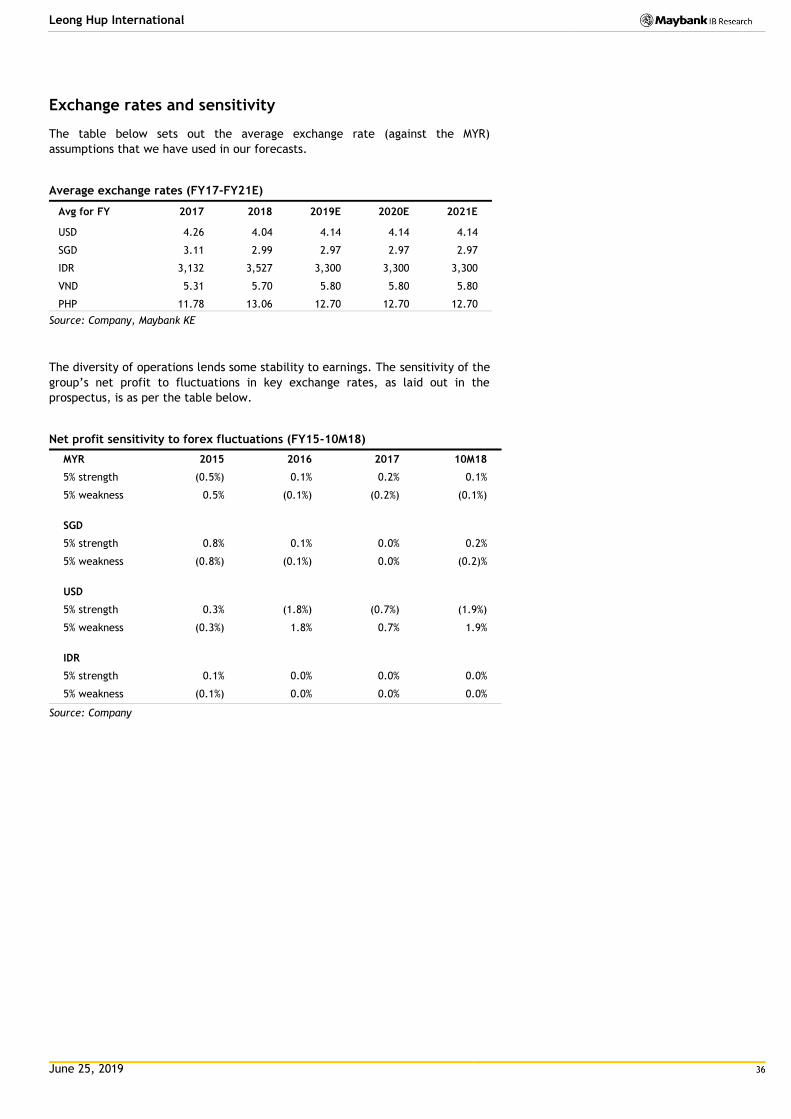
Exchange rates and sensitivity
The table below sets out the average exchange rate (against the MYR)
assumptions that we have used in our forecasts.
Average exchange rates (FY17-FY21E)
Avg for FY 2017 2018 2019E 2020E 2021E
USD 4.26 4.04 4.14 4.14 4.14
SGD 3.11 2.99 2.97 2.97 2.97
IDR 3,132 3,527 3,300 3,300 3,300
VND 5.31 5.70 5.80 5.80 5.80
PHP 11.78 13.06 12.70 12.70 12.70
Source: Company, Maybank KE
The diversity of operations lends some stability to earnings. The sensitivity of the
group’s net profit to fluctuations in key exchange rates, as laid out in the
prospectus, is as per the table below.
Net profit sensitivity to forex fluctuations (FY15-10M18)
MYR 2015 2016 2017 10M18
5% strength (0.5%) 0.1% 0.2% 0.1%
5% weakness 0.5% (0.1%) (0.2%) (0.1%)
SGD
5% strength 0.8% 0.1% 0.0% 0.2%
5% weakness (0.8%) (0.1%) 0.0% (0.2)%
USD
5% strength 0.3% (1.8%) (0.7%) (1.9%)
5% weakness (0.3%) 1.8% 0.7% 1.9%
IDR
5% strength 0.1% 0.0% 0.0% 0.0%
5% weakness (0.1%) 0.0% 0.0% 0.0%
Source: Company

June 25, 2019 37
Leong Hup International
Valuations
Favouring a PER valuation methodology
With the expansion plans that it has in the pipeline, we project robust earnings
growth for Leong Hup in the near future, with a projected 3-year core net profit
CAGR of 14%. Taking this growth trajectory into consideration, we believe that a
PER valuation methodology would be the most appropriate to value the stock.
Target price of MYR1.37
In deriving our target price of MYR1.37 for Leong Hup, we have pegged its
earnings to the 2020 weighted average PER of its regional peers of 17x. This
basket comprises five listed poultry/livestock companies in ASEAN. We have
excluded valuations of its domestic peer, QL Resources, as only 40% of the
latter’s earnings is derived from the livestock business.
Leong Hup’s 2-year (FY18-FY20E) net profit CAGR of 14.3% compares favourably
against its regional peer average of 13.4%, as does its PEG of just 1x at the
current share price of MYR1.04, relative to its peer average of 1.4x.
The target PER multiple of 17x implies an 11% discount to CP Foods which, based
on the forecasts of MKE’s Thai consumer analyst, trades at a prospective FY20E
PER of 19x. CP Food’s premium largely reflects its larger market cap and its
estimated 2-year (FY18-20E) net profit CAGR of 27% versus 14% for Leong Hup
(based on our estimates).
Between CP Foods and Japfa, CP Foods is a better regional comparable to Leong
Hup, in our view. Japfa’s revenue contributions are not as geographically
diversified and more susceptible to single country risk, since more than 65% of
Japfa’s revenue is derived from Indonesia. Moreover, its 2-year forward net
profit CAGR averages just 2% (based on consensus).
Regional and domestic peer comparisons
Stock Shr px * Mkt cap PER (x)
PER (x)
P/B (x)
P/B (x)
2-yr CAGR
2-yr PEG
ROAE (%)
ROAE (%)
Net yield (%)
(Local) (MYR) CY19F CY20F CY19F CY20F (%) (x) CY19F CY20F CY19F
Leong Hup 1.04 3,796 14.6 12.9 2.2 1.9 14.3 1.0 17.0 15.8 2.1
CP Foods ^ 28.50 32,470 22.4 19.3 1.4 1.3 27.5 0.8 7.6 8.2 2.4
CP Indo 4,450 21,060 19.3 17.5 3.4 3.0 (4.2) (4.6) 18.3 17.8 2.3
Japfa Ltd 0.56 3,112 7.9 7.3 0.7 0.7 2.3 3.5 11.5 11.3 2.0
Japfa Comfeed 1,465 4,958 9.3 8.3 1.5 1.4 (2.0) (4.6) 16.8 17.5 3.3
GFPT 17.00 2,820 14.9 13.7 1.6 1.5 22.4 0.7 10.6 10.7 1.9
Regional wtd avg 64,420 19.3 17.0 2.0 1.8 13.4 1.4 12.1 12.3 2.4
* Prices as at 21 June 2019, Leong Hup price as at 24 June 2019
Source: Bloomberg, Maybank KE
^ CP Foods forecast based on Maybank KE’s estimates
June 25, 2019 38
Leong Hup International
Key risk factors
Obtaining proper business certifications
Leong Hup is still in the midst of obtaining the relevant Certificate of Complete
and Compliance (CCC) for the right to occupy any building or part thereof for all
its 137 farms and hatcheries in Malaysia. Similarly, in Indonesia, local regulations
require a Certificate of Feasible Function for the right to occupy and utilise a
building but as of Mar 2019, 70 of the buildings under Malindo Group have yet to
obtain proper land use certification. Without proper compliance to certification
requirements, Leong Hup’s Malaysian and Indonesian operations are at the risk of
being halted with possible penalties.
Interruptions in breeding stock supply
Leong Hup imports its entire Broiler breeding stock (GPS DOCs) from its suppliers,
Cobb-Vantress and Aviagen. Given the limited number of breeders available
worldwide, if either Cobb-Vantress or Aviagen is unable to supply GPS DOCs to
Leong Hup for commercial reasons or because of an adverse event in their own
businesses, this could adversely affect the group’s smooth supply of GPS DOCs
which in turn, will slow its supply of PS DOCs for its breeding business, ultimately
causing delays to its entire supply chain.
Livestock disease outbreak
An outbreak of livestock disease (eg. Avian Influenza) in any of the group’s
operating countries could be detrimental to profitability as all the birds within an
infected area must be culled to ensure that the virus remains in the containment
zone. Additionally, any disease outbreak could affect consumer sentiment,
decreasing demand for poultry food products for an extended period of time as a
precautionary measure. Leong Hup does not have insurance coverage against
losses resulting from livestock disease as such policies are scarce and not
customary in its country of operations.
Raw material price volatility
Corn and soybean meal are commodities that are heavily used in the feedmill
business. Leong Hup imports the majority of both its corn and soybean meal
requirements. Hence, as both corn and soybean meal is traded on the
international market, it is vital for management to monitor fluctuations in price
and availability to manage its raw material costs.
Dependence on foreign workers
Poultry farming is labour intensive. As at 30 Jun 2018, 49.8% of Leong Hup’s
employees in Malaysia were foreign workers from Indonesia, Nepal and
Bangladesh while 56.6% employees in Singapore were from Malaysia, China and
Indonesia. Day-to-day operations may be disrupted should there be any changes
in labour regulations or difficulties in recruiting foreign workers.
Interests of controlling shareholder
Emerging Glory is a controlling shareholder and through its ability to influence
the election of Leong Hup’s Directors, it will have control over matters
concerning the group. There is no guarantee that its interests would be aligned
with those of other shareholders of the group.
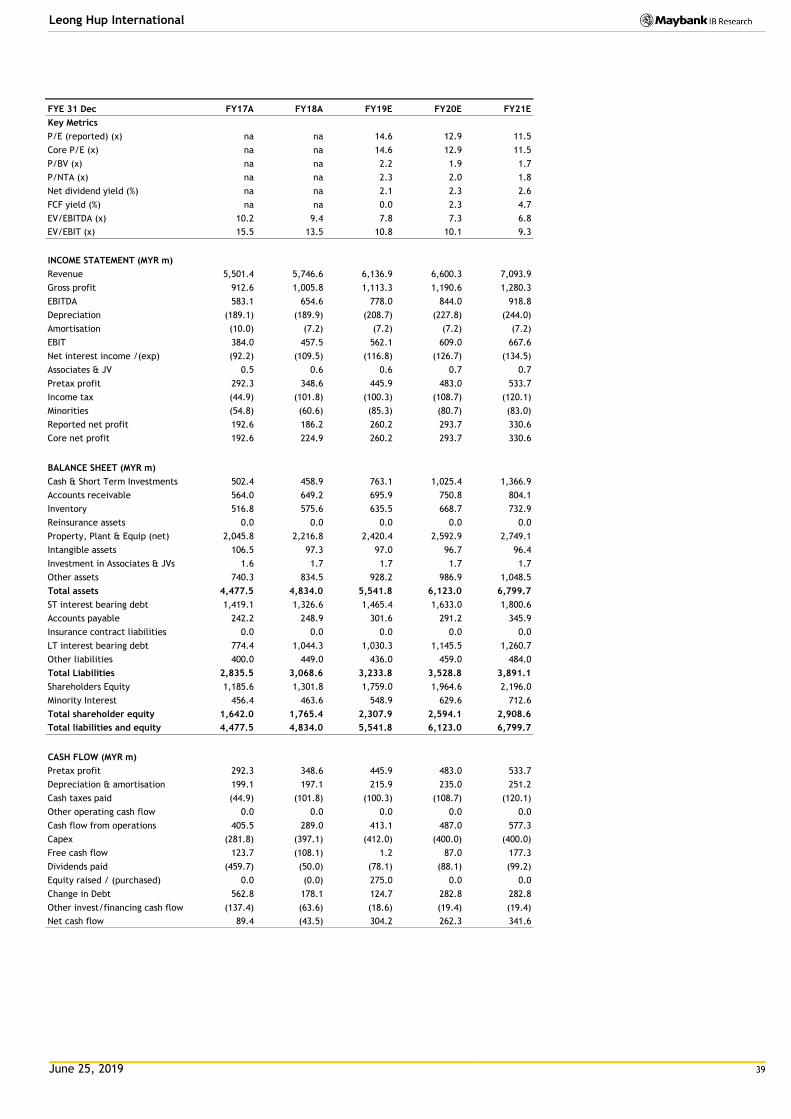
June 25, 2019 39
Leong Hup International
FYE 31 Dec FY17A FY18A FY19E FY20E FY21E
Key Metrics
P/E (reported) (x) na na 14.6 12.9 11.5
Core P/E (x) na na 14.6 12.9 11.5
P/BV (x) na na 2.2 1.9 1.7
P/NTA (x) na na 2.3 2.0 1.8
Net dividend yield (%) na na 2.1 2.3 2.6
FCF yield (%) na na 0.0 2.3 4.7
EV/EBITDA (x) 10.2 9.4 7.8 7.3 6.8
EV/EBIT (x) 15.5 13.5 10.8 10.1 9.3
INCOME STATEMENT (MYR m)
Revenue 5,501.4 5,746.6 6,136.9 6,600.3 7,093.9
Gross profit 912.6 1,005.8 1,113.3 1,190.6 1,280.3
EBITDA 583.1 654.6 778.0 844.0 918.8
Depreciation (189.1) (189.9) (208.7) (227.8) (244.0)
Amortisation (10.0) (7.2) (7.2) (7.2) (7.2)
EBIT 384.0 457.5 562.1 609.0 667.6
Net interest income /(exp) (92.2) (109.5) (116.8) (126.7) (134.5)
Associates & JV 0.5 0.6 0.6 0.7 0.7
Pretax profit 292.3 348.6 445.9 483.0 533.7
Income tax (44.9) (101.8) (100.3) (108.7) (120.1)
Minorities (54.8) (60.6) (85.3) (80.7) (83.0)
Reported net profit 192.6 186.2 260.2 293.7 330.6
Core net profit 192.6 224.9 260.2 293.7 330.6
BALANCE SHEET (MYR m)
Cash & Short Term Investments 502.4 458.9 763.1 1,025.4 1,366.9
Accounts receivable 564.0 649.2 695.9 750.8 804.1
Inventory 516.8 575.6 635.5 668.7 732.9
Reinsurance assets 0.0 0.0 0.0 0.0 0.0
Property, Plant & Equip (net) 2,045.8 2,216.8 2,420.4 2,592.9 2,749.1
Intangible assets 106.5 97.3 97.0 96.7 96.4
Investment in Associates & JVs 1.6 1.7 1.7 1.7 1.7
Other assets 740.3 834.5 928.2 986.9 1,048.5
Total assets 4,477.5 4,834.0 5,541.8 6,123.0 6,799.7
ST interest bearing debt 1,419.1 1,326.6 1,465.4 1,633.0 1,800.6
Accounts payable 242.2 248.9 301.6 291.2 345.9
Insurance contract liabilities 0.0 0.0 0.0 0.0 0.0
LT interest bearing debt 774.4 1,044.3 1,030.3 1,145.5 1,260.7
Other liabilities 400.0 449.0 436.0 459.0 484.0
Total Liabilities 2,835.5 3,068.6 3,233.8 3,528.8 3,891.1
Shareholders Equity 1,185.6 1,301.8 1,759.0 1,964.6 2,196.0
Minority Interest 456.4 463.6 548.9 629.6 712.6
Total shareholder equity 1,642.0 1,765.4 2,307.9 2,594.1 2,908.6
Total liabilities and equity 4,477.5 4,834.0 5,541.8 6,123.0 6,799.7
CASH FLOW (MYR m)
Pretax profit 292.3 348.6 445.9 483.0 533.7
Depreciation & amortisation 199.1 197.1 215.9 235.0 251.2
Cash taxes paid (44.9) (101.8) (100.3) (108.7) (120.1)
Other operating cash flow 0.0 0.0 0.0 0.0 0.0
Cash flow from operations 405.5 289.0 413.1 487.0 577.3
Capex (281.8) (397.1) (412.0) (400.0) (400.0)
Free cash flow 123.7 (108.1) 1.2 87.0 177.3
Dividends paid (459.7) (50.0) (78.1) (88.1) (99.2)
Equity raised / (purchased) 0.0 (0.0) 275.0 0.0 0.0
Change in Debt 562.8 178.1 124.7 282.8 282.8
Other invest/financing cash flow (137.4) (63.6) (18.6) (19.4) (19.4)
Net cash flow 89.4 (43.5) 304.2 262.3 341.6
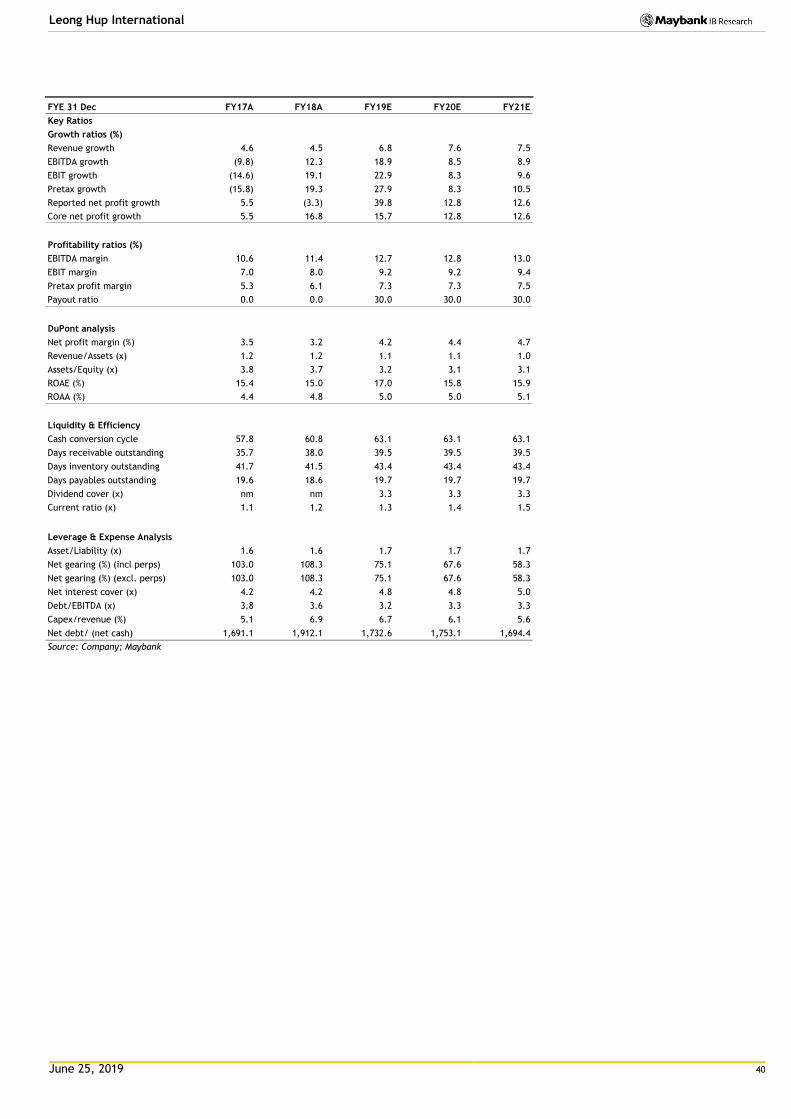
June 25, 2019 40
Leong Hup International
FYE 31 Dec FY17A FY18A FY19E FY20E FY21E
Key Ratios
Growth ratios (%)
Revenue growth 4.6 4.5 6.8 7.6 7.5
EBITDA growth (9.8) 12.3 18.9 8.5 8.9
EBIT growth (14.6) 19.1 22.9 8.3 9.6
Pretax growth (15.8) 19.3 27.9 8.3 10.5
Reported net profit growth 5.5 (3.3) 39.8 12.8 12.6
Core net profit growth 5.5 16.8 15.7 12.8 12.6
Profitability ratios (%)
EBITDA margin 10.6 11.4 12.7 12.8 13.0
EBIT margin 7.0 8.0 9.2 9.2 9.4
Pretax profit margin 5.3 6.1 7.3 7.3 7.5
Payout ratio 0.0 0.0 30.0 30.0 30.0
DuPont analysis
Net profit margin (%) 3.5 3.2 4.2 4.4 4.7
Revenue/Assets (x) 1.2 1.2 1.1 1.1 1.0
Assets/Equity (x) 3.8 3.7 3.2 3.1 3.1
ROAE (%) 15.4 15.0 17.0 15.8 15.9
ROAA (%) 4.4 4.8 5.0 5.0 5.1
Liquidity & Efficiency
Cash conversion cycle 57.8 60.8 63.1 63.1 63.1
Days receivable outstanding 35.7 38.0 39.5 39.5 39.5
Days inventory outstanding 41.7 41.5 43.4 43.4 43.4
Days payables outstanding 19.6 18.6 19.7 19.7 19.7
Dividend cover (x) nm nm 3.3 3.3 3.3
Current ratio (x) 1.1 1.2 1.3 1.4 1.5
Leverage & Expense Analysis
Asset/Liability (x) 1.6 1.6 1.7 1.7 1.7
Net gearing (%) (incl perps) 103.0 108.3 75.1 67.6 58.3
Net gearing (%) (excl. perps) 103.0 108.3 75.1 67.6 58.3
Net interest cover (x) 4.2 4.2 4.8 4.8 5.0
Debt/EBITDA (x) 3.8 3.6 3.2 3.3 3.3
Capex/revenue (%) 5.1 6.9 6.7 6.1 5.6
Net debt/ (net cash) 1,691.1 1,912.1 1,732.6 1,753.1 1,694.4
Source: Company; Maybank
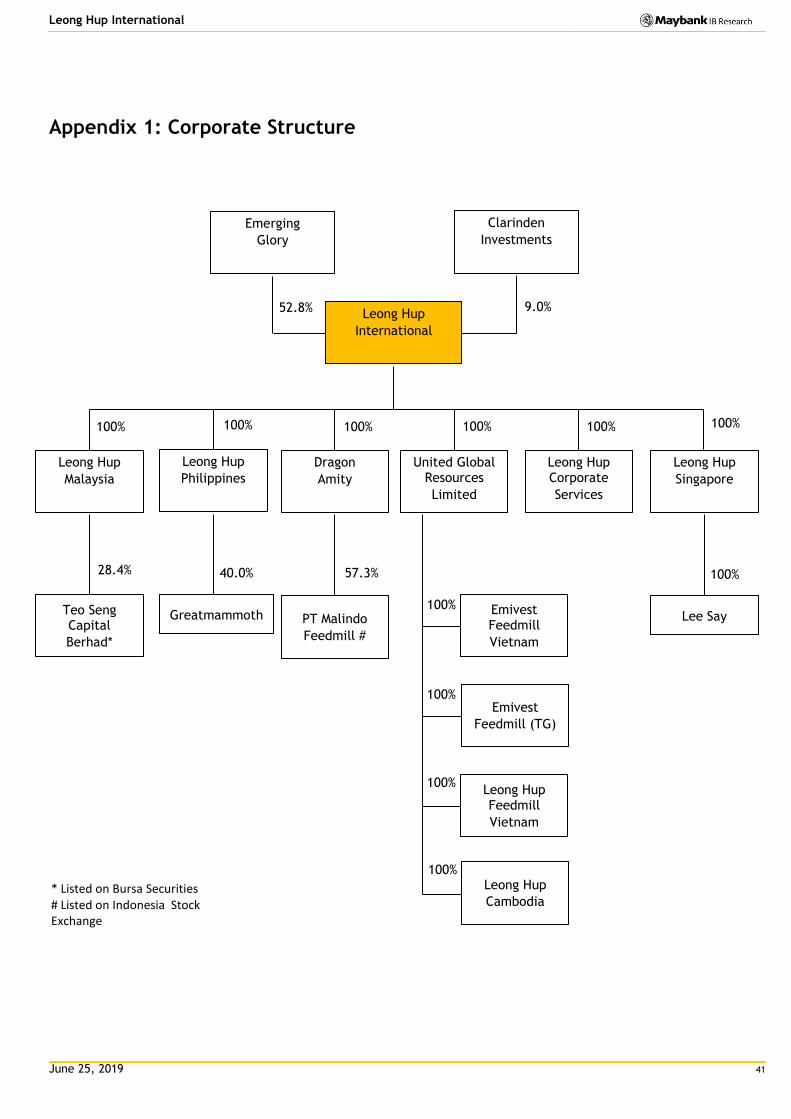
June 25, 2019 41
Leong Hup International
Appendix 1: Corporate Structure
* Listed on Bursa Securities # Listed on Indonesia Stock Exchange
Emerging Glory
Clarinden Investments
Leong Hup International
Leong Hup Malaysia
Dragon Amity
Leong Hup Corporate
Services
Leong Hup Philippines
United Global Resources
Limited
100%
100%
100%
100%
9.0% 52.8%
100%
100%
PT Malindo Feedmill #
57.3%
Teo Seng Capital Berhad*
28.4%
Emivest Feedmill
Vietnam
Emivest
Feedmill (TG)
Leong Hup Feedmill
Vietnam
Leong Hup
Cambodia
Greatmammoth
40.0%
100% 100% 100% 100%
Leong Hup Singapore
Lee Say
100%
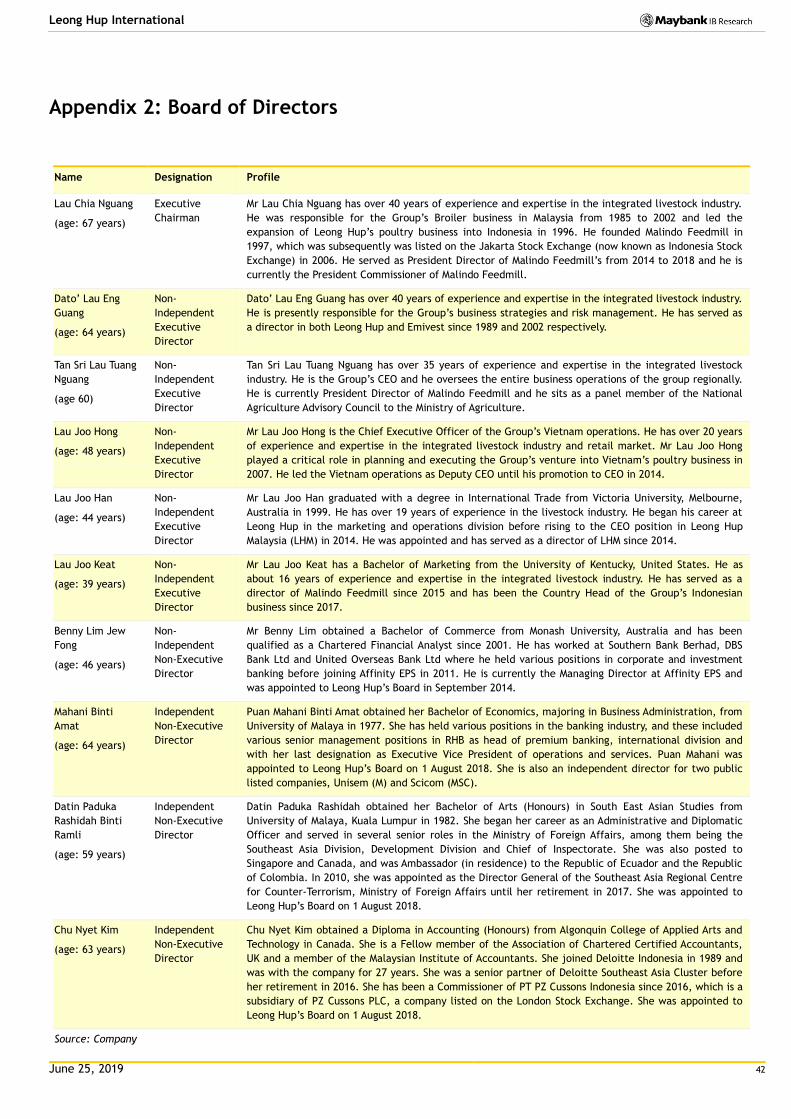
June 25, 2019 42
Leong Hup International
Appendix 2: Board of Directors
Name Designation Profile
Lau Chia Nguang
(age: 67 years)
Executive
Chairman
Mr Lau Chia Nguang has over 40 years of experience and expertise in the integrated livestock industry.
He was responsible for the Group’s Broiler business in Malaysia from 1985 to 2002 and led the
expansion of Leong Hup’s poultry business into Indonesia in 1996. He founded Malindo Feedmill in
1997, which was subsequently was listed on the Jakarta Stock Exchange (now known as Indonesia Stock
Exchange) in 2006. He served as President Director of Malindo Feedmill’s from 2014 to 2018 and he is
currently the President Commissioner of Malindo Feedmill.
Dato’ Lau Eng
Guang
(age: 64 years)
Non-
Independent
Executive
Director
Dato’ Lau Eng Guang has over 40 years of experience and expertise in the integrated livestock industry.
He is presently responsible for the Group’s business strategies and risk management. He has served as
a director in both Leong Hup and Emivest since 1989 and 2002 respectively.
Tan Sri Lau Tuang
Nguang
(age 60)
Non-
Independent
Executive
Director
Tan Sri Lau Tuang Nguang has over 35 years of experience and expertise in the integrated livestock
industry. He is the Group’s CEO and he oversees the entire business operations of the group regionally.
He is currently President Director of Malindo Feedmill and he sits as a panel member of the National
Agriculture Advisory Council to the Ministry of Agriculture.
Lau Joo Hong
(age: 48 years)
Non-
Independent
Executive
Director
Mr Lau Joo Hong is the Chief Executive Officer of the Group’s Vietnam operations. He has over 20 years
of experience and expertise in the integrated livestock industry and retail market. Mr Lau Joo Hong
played a critical role in planning and executing the Group’s venture into Vietnam’s poultry business in
2007. He led the Vietnam operations as Deputy CEO until his promotion to CEO in 2014.
Lau Joo Han
(age: 44 years)
Non-
Independent
Executive
Director
Mr Lau Joo Han graduated with a degree in International Trade from Victoria University, Melbourne,
Australia in 1999. He has over 19 years of experience in the livestock industry. He began his career at
Leong Hup in the marketing and operations division before rising to the CEO position in Leong Hup
Malaysia (LHM) in 2014. He was appointed and has served as a director of LHM since 2014.
Lau Joo Keat
(age: 39 years)
Non-
Independent
Executive
Director
Mr Lau Joo Keat has a Bachelor of Marketing from the University of Kentucky, United States. He as
about 16 years of experience and expertise in the integrated livestock industry. He has served as a
director of Malindo Feedmill since 2015 and has been the Country Head of the Group’s Indonesian
business since 2017.
Benny Lim Jew
Fong
(age: 46 years)
Non-
Independent
Non-Executive
Director
Mr Benny Lim obtained a Bachelor of Commerce from Monash University, Australia and has been
qualified as a Chartered Financial Analyst since 2001. He has worked at Southern Bank Berhad, DBS
Bank Ltd and United Overseas Bank Ltd where he held various positions in corporate and investment
banking before joining Affinity EPS in 2011. He is currently the Managing Director at Affinity EPS and
was appointed to Leong Hup’s Board in September 2014.
Mahani Binti
Amat
(age: 64 years)
Independent
Non-Executive
Director
Puan Mahani Binti Amat obtained her Bachelor of Economics, majoring in Business Administration, from
University of Malaya in 1977. She has held various positions in the banking industry, and these included
various senior management positions in RHB as head of premium banking, international division and
with her last designation as Executive Vice President of operations and services. Puan Mahani was
appointed to Leong Hup’s Board on 1 August 2018. She is also an independent director for two public
listed companies, Unisem (M) and Scicom (MSC).
Datin Paduka
Rashidah Binti
Ramli
(age: 59 years)
Independent
Non-Executive
Director
Datin Paduka Rashidah obtained her Bachelor of Arts (Honours) in South East Asian Studies from
University of Malaya, Kuala Lumpur in 1982. She began her career as an Administrative and Diplomatic
Officer and served in several senior roles in the Ministry of Foreign Affairs, among them being the
Southeast Asia Division, Development Division and Chief of Inspectorate. She was also posted to
Singapore and Canada, and was Ambassador (in residence) to the Republic of Ecuador and the Republic
of Colombia. In 2010, she was appointed as the Director General of the Southeast Asia Regional Centre
for Counter-Terrorism, Ministry of Foreign Affairs until her retirement in 2017. She was appointed to
Leong Hup’s Board on 1 August 2018.
Chu Nyet Kim
(age: 63 years)
Independent
Non-Executive
Director
Chu Nyet Kim obtained a Diploma in Accounting (Honours) from Algonquin College of Applied Arts and
Technology in Canada. She is a Fellow member of the Association of Chartered Certified Accountants,
UK and a member of the Malaysian Institute of Accountants. She joined Deloitte Indonesia in 1989 and
was with the company for 27 years. She was a senior partner of Deloitte Southeast Asia Cluster before
her retirement in 2016. She has been a Commissioner of PT PZ Cussons Indonesia since 2016, which is a
subsidiary of PZ Cussons PLC, a company listed on the London Stock Exchange. She was appointed to
Leong Hup’s Board on 1 August 2018.
Source: Company
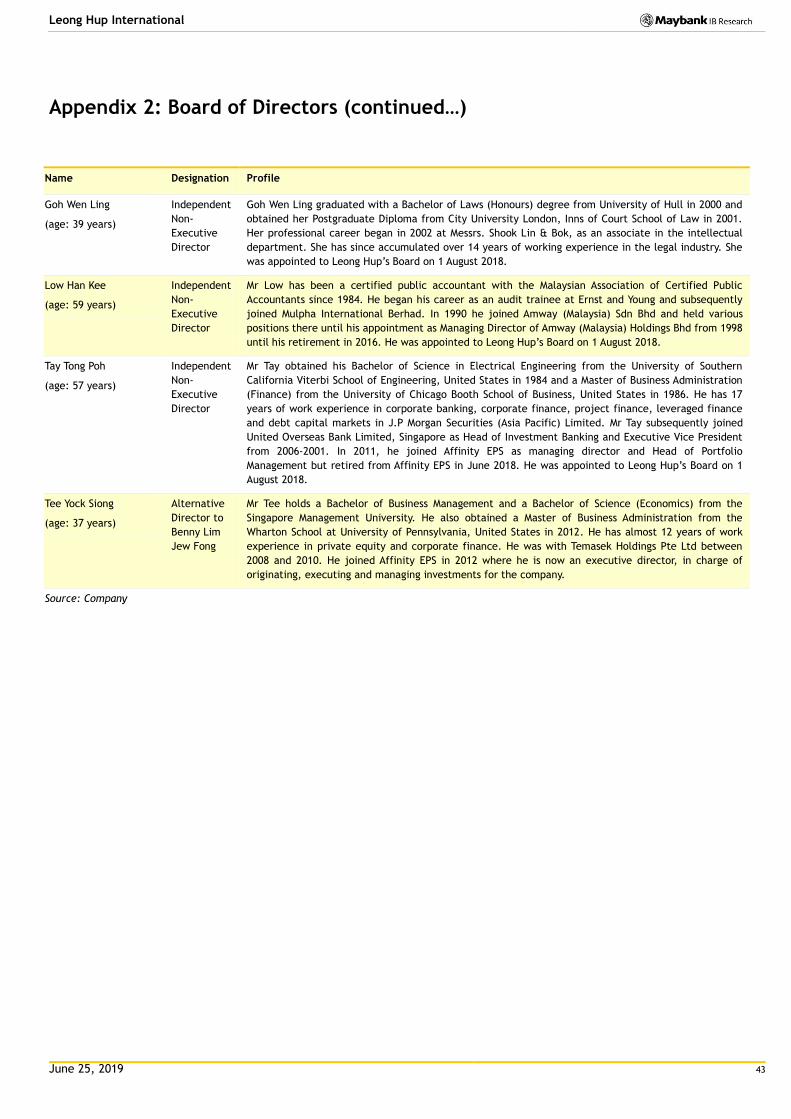
June 25, 2019 43
Leong Hup International
Appendix 2: Board of Directors (continued…)
Name Designation Profile
Goh Wen Ling
(age: 39 years)
Independent
Non-
Executive
Director
Goh Wen Ling graduated with a Bachelor of Laws (Honours) degree from University of Hull in 2000 and
obtained her Postgraduate Diploma from City University London, Inns of Court School of Law in 2001.
Her professional career began in 2002 at Messrs. Shook Lin & Bok, as an associate in the intellectual
department. She has since accumulated over 14 years of working experience in the legal industry. She
was appointed to Leong Hup’s Board on 1 August 2018.
Low Han Kee
(age: 59 years)
Independent
Non-
Executive
Director
Mr Low has been a certified public accountant with the Malaysian Association of Certified Public
Accountants since 1984. He began his career as an audit trainee at Ernst and Young and subsequently
joined Mulpha International Berhad. In 1990 he joined Amway (Malaysia) Sdn Bhd and held various
positions there until his appointment as Managing Director of Amway (Malaysia) Holdings Bhd from 1998
until his retirement in 2016. He was appointed to Leong Hup’s Board on 1 August 2018.
Tay Tong Poh
(age: 57 years)
Independent
Non-
Executive
Director
Mr Tay obtained his Bachelor of Science in Electrical Engineering from the University of Southern
California Viterbi School of Engineering, United States in 1984 and a Master of Business Administration
(Finance) from the University of Chicago Booth School of Business, United States in 1986. He has 17
years of work experience in corporate banking, corporate finance, project finance, leveraged finance
and debt capital markets in J.P Morgan Securities (Asia Pacific) Limited. Mr Tay subsequently joined
United Overseas Bank Limited, Singapore as Head of Investment Banking and Executive Vice President
from 2006-2001. In 2011, he joined Affinity EPS as managing director and Head of Portfolio
Management but retired from Affinity EPS in June 2018. He was appointed to Leong Hup’s Board on 1
August 2018.
Tee Yock Siong
(age: 37 years)
Alternative
Director to
Benny Lim
Jew Fong
Mr Tee holds a Bachelor of Business Management and a Bachelor of Science (Economics) from the
Singapore Management University. He also obtained a Master of Business Administration from the
Wharton School at University of Pennsylvania, United States in 2012. He has almost 12 years of work
experience in private equity and corporate finance. He was with Temasek Holdings Pte Ltd between
2008 and 2010. He joined Affinity EPS in 2012 where he is now an executive director, in charge of
originating, executing and managing investments for the company.
Source: Company

June 25, 2019 44
Leong Hup International
Appendix 3: Key Senior Management
Name Designation Profile
Tan Sri Lau
Tuang Nguang
(age: 60 years)
Group Chief
Executive Officer /
President Director of
Malindo Feedmill
Tan Sri Lau Tuang Nguang has over 35 years of experience and expertise in the integrated livestock
industry. He began his career in Leong Hup Poultry Farm Sdn Bhd in 1978 where he gained
experience operating GPS and breeder farms. As the Group’s CEO, he oversees the entire business
operations of the Group covering Malaysia, Singapore, Indonesia, Vietnam and Philippines.
Lau Chia
Nguang
(age: 67 years)
Executive Chairman /
President
Commissioner of
Malindo Feedmill
Mr Lau Chia Nguang has over 40 years of experience and expertise in the integrated livestock
industry. He was responsible for the Group’s Broiler business in Malaysia from 1985 to 2002 and led
the expansion of Leong Hup’s poultry business into Indonesia in 1996. He founded Malindo Feedmill
in 1997, which was subsequently was listed on the Jakarta Stock Exchange (now known as Indonesia
Stock Exchange) in 2006. He served as president director of Malindo Feedmill’s from 2014 to 2018
and he is currently the President Commissioner of Malindo Feedmill.
Dato’ Lau Eng
Guang
(age: 64 years)
Executive Director /
Group’s Business
Strategist
Dato’ Lau Eng Guang has over 40 years of experience and expertise in the integrated livestock
industry. He is presently responsible for the Group’s business strategies and risk management. He
has served as a director in both Leong Hup and Emivest since 1989 and 2002 respectively.
Lau Joo Hong
(age: 48 years)
Executive Director /
CEO of the Group’s
Vietnam operations
Mr Lau Joo Hong is the Chief Executive Officer of the Group’s Vietnam operations. He has over 20
years of experience and expertise in the integrated livestock industry and retail market. Mr Lau
Joo Hong played a critical role in planning and executing the Group’s venture into Vietnam’s
poultry business in 2007. He led the Vietnam operations as Deputy CEO until his promotion to CEO
in 2014.
Lau Joo Han
(age: 44 years)
Executive Director/
CEO of the Group’s
Malaysia operations
Mr Lau Joo Han graduated with a degree in International Trade from Victoria University, Melbourne,
Australia in 1999. He has over 19 years of experience in the livestock industry. He began his career
at Leong Hup in the marketing and operations division before rising to the CEO position in Leong
Hup Malaysia (LHM) in 2014. He was appointed and has served as a director of LHM since 2014.
Lau Joo Keat
(age: 39 years)
Executive Director /
Country Head of the
Group’s Indonesian
operations
Mr Lau Joo Keat has a Bachelor of Marketing from the University of Kentucky, United States. He as
about 16 years of experience and expertise in the integrated livestock industry. He has served as a
director of Malindo Feedmill since 2015 and has been the Country Head of the Group’s Indonesian
business since 2017.
Lau Jui Peng
(age: 47 years)
Group Breeder Chief
Executive Officer
Mr Lau Jiu Peng obtained a Bachelor’s degree in Business Administration from the Hawaii Pacific
University, United States. He began his career at Leong Hup Poultry Farm Sdn Bhd as the Head of
breeder operation in 1999 and worked at various roles within the company before he was promoted
to Chief Executive Officer in 2013.
Lau Joo Heng
(age: 44 years)
CEO of the Group’s
Philippines operations
Mr Lau Joo Heng obtained a Bachelor and Master’s degree in Finance from Western Michigan
University in the United States. Mr Lau began his career as a Risk Management Officer at Arab-
Malaysian Merchant Bank Berhad before he moved on to Evergrade Healthcare Products Sdn Bhd
and The Baker’s Cottage Sdn Bhd. Mr Lau joined the Group’s livestock business in 2015 where he
led the expansion of the livestock business to Philippines. He has since led the Group’s Philippines
operations.
Lau Joo Hwa
(age: 40 years)
CEO of the Group’s
Singapore operations
After graduating from Victoria University, Melbourne, Australia with a Bachelor of Business, Mr Lau
began his career as a marketing manager at Malindo Feedmill before rising to the Deputy Chief
Officer position where he was in charge of marketing and overall administration. He was
subsequently promoted to the CEO role of Singapore’s operations in 2017.
Chew Eng Loke
(age: 50 years)
Chief Financial
Officer
Mr Chew holds a Bachelor of Economics from Monash University, Australia and a Master of Business
Administration from University of Strathclyde, UK. He has previously held management and
financial roles at Ayamas Food Corporation Berhad, Texchem Resources Berhad, Ogawa Berhad and
AirAsia X Berhad etc. where he accumulated over 25 years of industry experience. He joined Leong
Hup as Chief Financial Officer on 1 March 2015.
Source: Company
June 25, 2019 45
Leong Hup International
Research Offices
REGIONAL
Sadiq CURRIMBHOY
Regional Head of Research & Economics (65) 6231 5836 [email protected]
WONG Chew Hann, CA
Regional Head of Institutional Research (603) 2297 8686 [email protected]
ONG Seng Yeow
Regional Head of Retail Research
(65) 6231 5839 [email protected]
ECONOMICS
Suhaimi ILIAS Chief Economist Malaysia | Philippines | China (603) 2297 8682 [email protected]
CHUA Hak Bin Regional Thematic Macroeconomist (65) 6231 5830 [email protected]
LEE Ju Ye Singapore | Thailand (65) 6231 5844 [email protected]
Linda LIU Singapore | Vietnam (65) 6231 5847 [email protected]
Dr Zamros DZULKAFLI (603) 2082 6818 [email protected]
Ramesh LANKANATHAN (603) 2297 8685 [email protected]
FX
Saktiandi SUPAAT Head of FX Research (65) 6320 1379 [email protected]
Christopher WONG (65) 6320 1347 [email protected]
Tan Yanxi (65) 6320 1378 [email protected]
Fiona LIM (65) 6320 1374 [email protected]
STRATEGY
Sadiq CURRIMBHOY
Global Strategist (65) 6231 5836 [email protected]
Willie CHAN
Hong Kong | Regional (852) 2268 0631 [email protected]
FIXED INCOME
Winson PHOON, ACA (65) 6812 8807 [email protected]
Se Tho Mun Yi (603) 2074 7606 [email protected]
MALAYSIA
WONG Chew Hann, CA Head of Research (603) 2297 8686 [email protected] • Strategy
Desmond CH’NG, ACA (603) 2297 8680 [email protected] • Banking & Finance
LIAW Thong Jung (603) 2297 8688 [email protected] • Oil & Gas Services- Regional
ONG Chee Ting, CA (603) 2297 8678 [email protected] • Plantations - Regional
Mohshin AZIZ (603) 2297 8692 [email protected] • Aviation - Regional • Petrochem
YIN Shao Yang, CPA (603) 2297 8916 [email protected] • Gaming – Regional • Media
TAN Chi Wei, CFA (603) 2297 8690 [email protected] • Power • Telcos
WONG Wei Sum, CFA (603) 2297 8679 [email protected] • Property
LEE Yen Ling (603) 2297 8691 [email protected] • Glove • Ports • Shipping • Healthcare
Ivan YAP (603) 2297 8612 [email protected] • Automotive • Semiconductor • Technology
Kevin WONG (603) 2082 6824 [email protected] • REITs • Consumer Discretionary
Adrian WONG, CFA
(603) 2297 8675 [email protected] • Constructions
Jade TAM
(603) 2297 8687 [email protected] • Consumer Staples
Mohd Hafiz HASSAN (603) 2082 6819 [email protected] • Building Materials • Small & Mid Caps
Amirah AZMI (603) 2082 8769 [email protected] • Media • Plantations
TEE Sze Chiah Head of Retail Research (603) 2082 6858 [email protected]
Nik Ihsan RAJA ABDULLAH, MSTA, CFTe (603) 2297 8694 [email protected]
SINGAPORE
Neel SINHA Head of Research (65) 6231 5838 [email protected] • Strategy • Industrials • SMID Caps – Regional
CHUA Su Tye (65) 6231 5842 [email protected] • REITs
Luis HILADO (65) 6231 5848 [email protected] • Telcos • Transport
LAI Gene Lih, CFA (65) 6231 5832 [email protected] • Technology • Healthcare
Thilan WICKRAMASINGHE (65) 6231 5840 [email protected] • Banks
SZE Jia Min (65) 6231 5845 [email protected] • Consumer
INDIA
Jigar SHAH Head of Research
(91) 22 4223 2632 [email protected]
• Strategy • Oil & Gas • Automobile • Cement
Neerav DALAL
(91) 22 4223 2606 [email protected]
• Software Technology • Telcos
Vishal PERIWAL
(91) 22 4223 2605
• Infrastructure
Kshitiz PRASAD
(91) 22 4223 2607
• Banks
INDONESIA
Isnaputra ISKANDAR Head of Research (62) 21 8066 8680 [email protected] • Strategy • Metals & Mining • Cement
Rahmi MARINA (62) 21 8066 8689 [email protected] • Banking & Finance
Aurellia SETIABUDI (62) 21 8066 8691 [email protected] • Property
Janni ASMAN (62) 21 8066 8687 [email protected] • Cigarette • Healthcare • Retail
Luthfi RIDHO (62) 21 8066 8690 [email protected] • Economics
PHILIPPINES
Minda OLONAN Head of Research (63) 2 849 8840 [email protected] • Strategy • Conglomerates
Katherine TAN (63) 2 849 8843 [email protected] • Banks • Conglomerates • Ports
Luis HILADO (65) 6231 5848 [email protected] • Telcos
Romel LIBO-ON (63) 2 849 8844 [email protected] • Property
Kayzer LLANDA (63) 2 849 8839 [email protected] • Utilities
THAILAND
Maria LAPIZ Head of Institutional Research Dir (66) 2257 0250 | (66) 2658 6300 ext 1399 [email protected] • Strategy • Consumer • Materials • Services
Teerapol Udomvej, CFA (66) 2658 6300 ext 1394 [email protected] • Healthcare
Ekachai TARAPORNTIP Head of Retail Research (66) 2658 5000 ext 1530 [email protected]
Sutthichai KUMWORACHAI Deputy Head (66) 2658 5000 ext 1400 [email protected] • Energy • Petrochem
Surachai PRAMUALCHAROENKIT (66) 2658 5000 ext 1470 [email protected] • Auto • Conmat • Contractor • Steel
Suttatip PEERASUB (66) 2658 5000 ext 1430 [email protected] • Media • Commerce
Termporn TANTIVIVAT (66) 2658 5000 ext 1520 [email protected] • Property
Jaroonpan WATTANAWONG (66) 2658 5000 ext 1404 [email protected] • Transportation • Small cap
Thanatphat SUKSRICHAVALIT (66) 2658 5000 ext 1401 [email protected] • Media • Electronics
Sorrabhol VIRAMETEEKUL Head of Digital Research (66) 2658 5000 ext 1550 [email protected] • Food, Transportation
Wijit ARAYAPISIT (66) 2658 5000 ext 1450 [email protected] • Strategist
Kritsapong PATAN (66) 2658 5000 ext 1310 [email protected] • Chartist
Apisit PATTARASAKOLKIAT (66) 2658 5000 ext 1405 [email protected] • Chartist
VIETNAM
LE Hong Lien, ACCA Head of Institutional Research (84 28) 44 555 888 x 8181 [email protected] • Strategy • Consumer • Diversified
LE Nguyen Nhat Chuyen (84 28) 44 555 888 x 8082 [email protected] • Oil & Gas
QUAN Trong Thanh (84 28) 44 555 888 x 8184 [email protected] • Banks
NGUYEN Thi Ngan Tuyen Head of Retail Research (84 28) 44 555 888 x 8081 [email protected] • Food & Beverage • Oil&Gas • Banking
TRUONG Quang Binh Deputy Head of Retail Research (84 28) 44 555 888 x 8087 [email protected] • Rubber Plantation • Tyres & Tubes • Oil & Gas
TRINH Thi Ngoc Diep (84 28) 44 555 888 x 8208 [email protected] • Technology • Utilities • Construction
NGUYEN Thi Sony Tra Mi (84 28) 44 555 888 x 8084 [email protected] • Port Operation • Pharmaceutical • Food & Beverage
NGUYEN Thanh Lam (84 28) 44 555 888 x 8086 [email protected] • Technical Analysis
June 25, 2019 46
Leong Hup International
APPENDIX I: TERMS FOR PROVISION OF REPORT, DISCLAIMERS AND DISCLOSURES DISCLAIMERS This research report is prepared for general circulation and for information purposes only and under no circumstances should it be considered or intended as an offer to sell or a solicitation of an offer to buy the securities referred to herein. Investors should note that values of such securities, if any, may fluctuate and that each security’s price or value may rise or fall. Opinions or recommendations contained herein are in form of technical ratings and fundamental ratings. Technical ratings may differ from fundamental ratings as technical valuations apply different methodologies and are purely based on price and volume-related information extracted from the relevant jurisdiction’s stock exchange in the equity analysis. Accordingly, investors’ returns may be less than the original sum invested. Past performance is not necessarily a guide to future performance. This report is not intended to provide personal investment advice and does not take into account the specific investment objectives, the financial situation and the particular needs of persons who may receive or read this report. Investors should therefore seek financial, legal and other advice regarding the appropriateness of investing in any securities or the investment strategies discussed or recommended in this report.
The information contained herein has been obtained from sources believed to be reliable but such sources have not been independently verified by Maybank Investment Bank Berhad, its subsidiary and affiliates (collectively, “MKE”) and consequently no representation is made as to the accuracy or completeness of this report by MKE and it should not be relied upon as such. Accordingly, MKE and its officers, directors, associates, connected parties and/or employees (collectively, “Representatives”) shall not be liable for any direct, indirect or consequential losses or damages that may arise from the use or reliance of this report. Any information, opinions or recommendations contained herein are subject to change at any time, without prior notice.
This report may contain forward looking statements which are often but not always identified by the use of words such as “ant icipate”, “believe”, “estimate”, “intend”, “plan”, “expect”, “forecast”, “predict” and “project” and statements that an event or result “may”, “will”, “can”, “should”, “could” or “might” occur or be achieved and other similar expressions. Such forward looking statements are based on assumptions made and information currently available to us and are subject to certain risks and uncertainties that could cause the actual results to differ materially from those expressed in any forward looking statements. Readers are cautioned not to place undue relevance on these forward-looking statements. MKE expressly disclaims any obligation to update or revise any such forward looking statements to reflect new information, events or circumstances af ter the date of this publication or to reflect the occurrence of unanticipated events.
MKE and its officers, directors and employees, including persons involved in the preparation or issuance of this report, may, to the extent permitted by l aw, from time to time participate or invest in financing transactions with the issuer(s) of the securities mentioned in this report, perform services for or solicit business from such issuers, and/or have a position or holding, or other material interest, or effect transactions, in such securities or options thereon, or other investments related thereto. In addition, it may make markets in the securities mentioned in the material presented in this report. One or more directors, officers and/or employees of MKE may be a director of the issue rs of the securities mentioned in this report to the extent permitted by law.
This report is prepared for the use of MKE’s clients and may not be reproduced, altered in any way, transmitted to, copied or distributed to any other party in whole or in part in any form or manner without the prior express written consent of MKE and MKE and its Representatives accepts no liability whatsoever for the actions of third parties in this respect.
This report is not directed to or intended for distribution to or use by any person or entity who is a citizen or resident of or located in any locality, state, country or other jurisdiction where such distribution, publication, availability or use would be contrary to law or regulation. This report is for distribution only under such circumstances as may be permitted by applicable law. The securities described herein may not be eligible for sale in all jurisdictions or to certain categories of investors. Without prejudice to the foregoing, the reader is to note that additional disclaimers, warnings or qualifications may apply based on geographical location of the person or entity receiving this report.
Malaysia Opinions or recommendations contained herein are in the form of technical ratings and fundamental ratings. Technical ratings may differ from fundamental ratings as technical valuations apply different methodologies and are purely based on price and volume-related information extracted from Bursa Malaysia Securities Berhad in the equity analysis.
Singapore This report has been produced as of the date hereof and the information herein may be subject to change. Maybank Kim Eng Research Pte. Ltd. (“Maybank KERPL”) in Singapore has no obligation to update such information for any recipient. For distribution in Singapore, recipients of this report are to contact Maybank KERPL in Singapore in respect of any matters arising from, or in connection with, this report. If the recipient of this report is not an accredited investor, expert investor or institutional investor (as defined under Section 4A of the Singapore Securities and Futures Act), Maybank KERPL shall be legally liable for the contents of this report, with such liability being limited to the extent (if any) as permitted by law.
Thailand Except as specifically permitted, no part of this presentation may be reproduced or distributed in any manner without the prior written permission of Maybank Kim Eng Securities (Thailand) Public Company Limited. Maybank Kim Eng Securities (Thailand) Public Company Limited (“MBKET”) accepts no liability whatsoeve r for the actions of third parties in this respect.
Due to different characteristics, objectives and strategies of institutional and retail investors, the research reports of MBKET Institutional and Retail Research Department may differ in either recommendation or target price, or both. MBKET Retail Research is intended for retail investors (http://kelive.maybank-ke.co.th) while Maybank Kim Eng Institutional Research is intended only for institutional investors based outside Thailand only.
The disclosure of the survey result of the Thai Institute of Directors Association (“IOD”) regarding corporate governance is made pursuant to the policy of t he Office of the Securities and Exchange Commission. The survey of the IOD is based on the information of a company listed on the Stock Exchange of Thailand and the market for Alternative Investment disclosed to the public and able to be accessed by a general public investor. The result, therefore, is from the perspective of a third party. It is not an evaluation of operation and is not based on inside information. The survey result is as of the date appearing in the Corporate Governance Report of Thai Listed Companies. As a result, the survey may be changed after that date. MBKET does not confirm nor certify the accuracy of such survey result.
The disclosure of the Anti-Corruption Progress Indicators of a listed company on the Stock Exchange of Thailand, which is assessed by Thaipat Institute, is made in order to comply with the policy and sustainable development plan for the listed companies of the Office of the Securities and Exchange Commission. Thaipat Institute made this assessment based on the information received from the listed company, as stipulated in the form for the assessment of Anti-corruption which refers to the Annual Registration Statement (Form 56-1), Annual Report (Form 56-2), or other relevant documents or reports of such listed company. The assessment result is therefore made from the perspective o f Thaipat Institute that is a third party. It is not an assessment of operation and is not based on any inside information. Since this assessment is only the assessment result as of the date appearing in the assessment result, it may be changed after that date or when there is any change to the relevant information. Nevertheless, MBKET does not confirm, verify, or certify the accuracy and completeness of the assessment result.
US This third-party research report is distributed in the United States (“US”) to Major US Institutional Investors (as defined in Rule 15a -6 under the Securities Exchange Act of 1934, as amended) only by Maybank Kim Eng Securities USA Inc (“Maybank KESUSA”), a broker-dealer registered in the US (registered under Section 15 of the Securities Exchange Act of 1934, as amended). All responsibility for the distribution of this report by Maybank KESUSA in the US shall be borne by Maybank KESUSA. This report is not directed at you if MKE is prohibited or restricted by any legislation or regulation in any jurisdiction from making it available to you. You should satisfy yourself before reading it that Maybank KESUSA is permitted to provide research material concerning investments to you under relevant legislation and regulations. All U.S. persons receiving and/or accessing this report and wishing to effect transactions in any security mentioned within must do so with: Maybank Kim Eng Securities USA Inc. 400 Park Avenue, 11th Floor, New York, New York 10022, 1-(212) 688-8886 and not with, the issuer of this report.

June 25, 2019 47
Leong Hup International
Disclosure of Interest
Malaysia: MKE and its Representatives may from time to time have positions or be materially interested in the securities referred to he rein and may further act as market maker or may have assumed an underwriting commitment or deal with such securities and may also perform or seek to perform investment banking services, advisory and other services for or relating to those companies. Singapore: As of 25 June 2019, Maybank KERPL and the covering analyst do not have any interest in any companies recommended in this research report. Thailand: MBKET may have a business relationship with or may possibly be an issuer of derivative warrants on the securities /companies mentioned in the research report. Therefore, Investors should exercise their own judgment before making any investment decisions. MBKET, its associates, directors, connected parties and/or employees may from time to time have interests and/or underwriting commitments in the securities mentioned in this report. Hong Kong: As of 25 June 2019, KESHK and the authoring analyst do not have any interest in any companies recommended in this research report. India: As of 25 June 2019, and at the end of the month immediately preceding the date of publication of the research report, KESI, authoring analyst or their associate / relative does not hold any financial interest or any actual or beneficial ownership in any shares or having any conflict of interest in the subject companies except as otherwise disclosed in the research report.
In the past twelve months KESI and authoring analyst or their associate did not receive any compensation or other benefits fr om the subject companies or third party in connection with the research report on any account what so ever except as otherwise disclosed in the research report.
MKE may have, within the last three years, served as manager or co-manager of a public offering of securities for, or currently may make a primary market in issues of, any or all of the entities mentioned in this report or may be providing, or have provided within the previous 12 months, significant advice or investment services in relation to the investment concerned or a related investment and may receive compensation for the services provided from the companies covered in this report.
OTHERS
Analyst Certification of Independence
The views expressed in this research report accurately reflect the analyst’s personal views about any and all of the subject securities or issuers; and no part of the research analyst’s compensation was, is or will be, directly or indirectly, related to the specific recommendations or views expressed in the report.
Reminder
Structured securities are complex instruments, typically involve a high degree of risk and are intended for sale only to sophisticated investors who are capable of understanding and assuming the risks involved. The market value of any structured security may be affected by changes in economic, financial and political factors (including, but not limited to, spot and forward interest and exchange rates), time to maturity, market conditions and volatility and the credit quality of any issuer or reference issuer. Any investor interested in purchasing a structured product should conduct its own analysis of the product and consult with its own professional advisers as to the risks involved in making such a purchase.
No part of this material may be copied, photocopied or duplicated in any form by any means or redistributed without the prior consent of MKE.
UK This document is being distributed by Maybank Kim Eng Securities (London) Ltd (“Maybank KESL”) which is authorized and regulated, by the Financial Conduct Authority and is for Informational Purposes only. This document is not intended for distribution to anyone defined as a Retail Client under the Financial Services and Markets Act 2000 within the UK. Any inclusion of a third party link is for the recipients convenience only, and that the firm does not take any responsibility fo r its comments or accuracy, and that access to such links is at the individuals own risk. Nothing in this report should be considered as constituting legal, accounting or tax advice, and that for accurate guidance recipients should consult with their own independent tax advisers.
DISCLOSURES
Legal Entities Disclosures Malaysia: This report is issued and distributed in Malaysia by Maybank Investment Bank Berhad (15938- H) which is a Participating Organization of Bursa Malaysia Berhad and a holder of Capital Markets and Services License issued by the Securities Commission in Malaysia. Singapore: This report is distributed in Singapore by Maybank KERPL (Co. Reg No 198700034E) which is regulated by the Monetary Authority of Singapore. Indonesia: PT Maybank Kim Eng Securities (“PTMKES”) (Reg. No. KEP-251/PM/1992) is a member of the Indonesia Stock Exchange and is regulated by the Financial Services Authority (Indonesia). Thailand: MBKET (Reg. No.0107545000314) is a member of the Stock Exchange of Thailand and is regulated by the Ministry of Finance and the Securities and Exchange Commission. Philippines: Maybank ATRKES (Reg. No.01-2004-00019) is a member of the Philippines Stock Exchange and is regulated by the Securities and Exchange Commission. Vietnam: Maybank Kim Eng Securities Limited (License Number: 117/GP-UBCK) is licensed under the State Securities Commission of Vietnam. Hong Kong: KESHK (Central Entity No AAD284) is regulated by the Securities and Futures Commission. India: Kim Eng Securities India Private Limited (“KESI”) is a participant of the National Stock Exchange of India Limited and the Bombay Stock Exchange and is regulated by Securities and Exchange Board of India (“SEBI”) (Reg. No. INZ000010538). KESI is also registered with SEBI as Category 1 Merchant Banker (Reg. No. INM 000011708) and as Research Analyst (Reg No: INH000000057) US: Maybank KESUSA is a member of/ and is authorized and regulated by the FINRA – Broker ID 27861. UK: Maybank KESL (Reg No 2377538) is authorized and regulated by the Financial Conduct Authority.
June 25, 2019 48
Leong Hup International
Definition of Ratings
Maybank Kim Eng Research uses the following rating system
BUY Return is expected to be above 10% in the next 12 months (excluding dividends)
HOLD Return is expected to be between - 10% to +10% in the next 12 months (excluding dividends)
SELL Return is expected to be below -10% in the next 12 months (excluding dividends)
Applicability of Ratings
The respective analyst maintains a coverage universe of stocks, the list of which may be adjusted according to needs. Investment ratings are only applicable to the stocks which form part of the coverage universe. Reports on companies which are not part of the coverage do not carry investment ratings as we do not actively follow developments in these companies.
June 25, 2019 49
Leong Hup International
Malaysia Maybank Investment Bank Berhad
(A Participating Organisation of
Bursa Malaysia Securities Berhad)
33rd Floor, Menara Maybank,
100 Jalan Tun Perak,
50050 Kuala Lumpur
Tel: (603) 2059 1888;
Fax: (603) 2078 4194
Singapore Maybank Kim Eng Securities Pte Ltd
Maybank Kim Eng Research Pte Ltd
50 North Canal Road
Singapore 059304
Tel: (65) 6336 9090
London Maybank Kim Eng Securities
(London) Ltd
PNB House
77 Queen Victoria Street
London EC4V 4AY, UK
Tel: (44) 20 7332 0221
Fax: (44) 20 7332 0302
New York Maybank Kim Eng Securities USA
Inc
400 Park Avenue, 11th Floor
New York, New York 10022,
U.S.A.
Tel: (212) 688 8886
Fax: (212) 688 3500
Stockbroking Business:
Level 8, Tower C, Dataran Maybank,
No.1, Jalan Maarof
59000 Kuala Lumpur
Tel: (603) 2297 8888
Fax: (603) 2282 5136
Hong Kong Kim Eng Securities (HK) Ltd
28/F, Lee Garden Three,
1 Sunning Road, Causeway Bay,
Hong Kong
Tel: (852) 2268 0800
Fax: (852) 2877 0104
Indonesia PT Maybank Kim Eng Securities
Sentral Senayan III, 22nd Floor
Jl. Asia Afrika No. 8
Gelora Bung Karno, Senayan
Jakarta 10270, Indonesia
Tel: (62) 21 2557 1188
Fax: (62) 21 2557 1189
India Kim Eng Securities India Pvt Ltd
2nd Floor, The International,
16, Maharishi Karve Road,
Churchgate Station,
Mumbai City - 400 020, India
Tel: (91) 22 6623 2600
Fax: (91) 22 6623 2604
Philippines Maybank ATR Kim Eng Securities Inc.
17/F, Tower One & Exchange Plaza
Ayala Triangle, Ayala Avenue
Makati City, Philippines 1200
Tel: (63) 2 849 8888
Fax: (63) 2 848 5738
Thailand Maybank Kim Eng Securities
(Thailand) Public Company Limited
999/9 The Offices at Central World,
20th - 21st Floor,
Rama 1 Road Pathumwan,
Bangkok 10330, Thailand
Tel: (66) 2 658 6817 (sales)
Tel: (66) 2 658 6801 (research)
Vietnam Maybank Kim Eng Securities Limited
4A-15+16 Floor Vincom Center Dong
Khoi, 72 Le Thanh Ton St. District 1
Ho Chi Minh City, Vietnam
Tel : (84) 844 555 888
Fax : (84) 8 38 271 030
Saudi Arabia In association with
Anfaal Capital
Villa 47, Tujjar Jeddah
Prince Mohammed bin Abdulaziz
Street P.O. Box 126575
Jeddah 21352
Tel: (966) 2 6068686
Fax: (966) 26068787
South Asia Sales Trading Kevin Foy
Regional Head Sales Trading
Tel: (65) 6636-3620
US Toll Free: 1-866-406-7447
North Asia Sales Trading Andrew Lee
Tel: (852) 2268 0283
US Toll Free: 1 877 837 7635
Indonesia Iwan Atmadjaja [email protected] (62) 21 8066 8555
London Greg Smith [email protected] Tel: (44) 207-332-0221
New York James Lynch [email protected] Tel: (212) 688 8886
India Sanjay Makhija [email protected] Tel: (91)-22-6623-2629
Philippines Keith Roy [email protected] Tel: (63) 2 848-5288
www.maybank-ke.com | www.maybank-keresearch.com


![Chip Hup Hup Kee Construction Pte Ltd v …...Chip Hup Hup Kee Construction Pte Ltd v Ssangyong Engineering & Construction Co Ltd [2008] SGHC 159 Case Number :OS 894/2008, SUM 3242/2008](https://img.dokumen.tips/doc/110x75/5f506197ca2a9b0ea678cdbf/chip-hup-hup-kee-construction-pte-ltd-v-chip-hup-hup-kee-construction-pte-ltd.jpg)