Embed Size (px)
Citation preview

1
Length of the Last MileDelays and Hurdles in NREGA Wage Payments
LibTech India | November 2020
Foreword by Jean Drèze

2
3
Length of the Last MileDelays and Hurdles in NREGA Wage Payments
LibTech India | November 2020
Foreword by Jean Drèze
4
© 2020 Azim Premji University.
This publication may be reproduced by any method without fee for teaching or nonprofit purposes. The publication shall not be used for commercial purposes. Rights are reserved under Creative Common Licence. Any derivative works shall also be protected under the same license. Rights are reserved under Creative Common Licence: Attribution + Non-Commercial + Share Alike. For copying in any other circum-stances, or for re-use in other publications, or for translation or adaptation, prior written permission must be obtained from the publisher.
Download from: http://libtech.in/length-of-the-last-mile/
Disclaimer: The analysis and opinions expressed in this publication are those of the author(s) and may not represent the view of the University.

5
I am not your data, nor am I your vote bank,I am not your project, or any exotic museum object,I am not the soul waiting to be harvested,Nor am I the lab where your theories are tested,I am not your cannon fodder, or the invisible worker,or your entertainment at India habitat center,I am not your field, your crowd, your history,your help, your guilt, medallions of your victory
Abhay Xaxa

6
Table of Contents
Abstract ............................................................................................... 03
Foreword ............................................................................................ 04
About LibTech India .......................................................................... 07
Team members .................................................................................. 08
Acknowledgements ................................................................... 10
Data Summary ................................................................................... 12
Introduction ....................................................................................... 17NREGA in Times of COVID-19 ................................................................... 19
1. NREGA: Background and Context ................................................. 22Financial Inclusion ................................................................................... 24
NREGA Wage Payments Over the Years ................................................. 26
2. Length to the Last Mile ................................................................... 30Delays in wages payments in our sample .............................................. 34
3. Research Questions for the Survey ................................................ 35
4. Methodology ................................................................................... 36Hardship Scores ....................................................................................... 40

1
5. Limitations of the Survey ............................................................... 42
6. Findings ........................................................................................... 44Demographic and household details ..................................................... 44
Disbursement Agencies ........................................................................... 48
Dimensions of challenges assessed ......................................................... 51
Awareness and Access to information ............................................... 52
Information about wages ................................................................... 55
Time and cost related challenges ....................................................... 57
Transparency ....................................................................................... 64
Commissions ....................................................................................... 69
Aadhaar and Biometric related challenges ...................................... 70
Hardships ................................................................................................... 75
Reported Hardships ............................................................................ 76
Rejected Payments ................................................................................... 84
Awareness among people with Rejected Payments ......................... 88
Hardships among by workers with Rejected Payments ................... 90
Grievance Redressal .................................................................................. 91
Grievances among those facing hardship .......................................... 93
Grievances Registered ......................................................................... 95
Time and Costs of Filing Complaints ................................................. 98
Preference of Payment Disbursement Agencies .................................... 99
Preference of payment disbursement agency for bank users .......... 99
Preference of payment disbursement agency for CSP/BC users .... 100
Preference of disbursement agency for PO users ............................ 101
Transaction Verification ......................................................................... 102
2
7. Recommendations ........................................................................ 106Job Card Registration and Work Demand ............................................. 107
Transparency on Cash Transfers ............................................................. 108
Reduction of Time and Cost per transaction ......................................... 110
CSPs/BCs .................................................................................................. 110
Accountability ......................................................................................... 112
Rejected Payments .................................................................................. 113
Grievance Redressal ................................................................................ 114
8. Appendices ..................................................................................... 115A.1 Data Cleaning & Missing Value Imputation .................................... 115
A.2 Robustness Checks for Reported Hardship Scores .......................... 121
A.2.1 Exploratory & Confirmatory Factor Analysis (CFA) .................. 126
A.2.2 Multiple Factor Analysis (MFA) ................................................ 135
Annexure ............................................................................................ 141
Endnotes ............................................................................................ 142
Bibliography ...................................................................................... 143

3
Abstract
LibTech India has been working in numerous states on various aspects of the Mahatma
Gandhi National Rural Employment Guarantee Act (NREGA) for almost a decade.
This report is built on our collective experience regarding NREGA wage payments.
Through a 3 state survey, we focus on the last mile challenges faced by workers in
accessing their wages after the wages have been credited to the workers’ bank or
postal accounts. Delays in wage payments are usually higher in the second half of each
financial year due to rationing of funds for NREGA. To focus on the last mile challenges
when funds crunch is not the main concern, we conducted this survey in the first half
of the financial year 2018-19. The survey was conducted in one block each of Andhra
Pradesh (AP) and Rajasthan (RJ) and 2 blocks of Jharkhand (JH). We interviewed 1947
workers and asked about their experience concerning four payment disbursement
agencies -- Banks, Customer Service Points (CSPs)/Business Correspondents (BCs), Post
Offices, and ATMs. Post offices were prevalent only in Andhra Pradesh. We examine
and discuss the following aspects: workers’ awareness about some banking norms,
access to information, hardships in accessing wages, transparency & accountability of
disbursement agencies, issues concerning payments that get rejected and the workers’
experience of using grievance redressal systems. Although the sampling was purposive,
experience suggests that our results and statistical estimates are likely to be consistent
across the respective states. We create average hardship scores of individuals for each
payment disbursement agency. We use confirmatory factor analysis and multiple factor
analysis scores to check for robustness of average hardship scores. The respondents
from the AP block reported less hardship, on average, compared to the blocks in RJ
and JH. Workers from the JH blocks report the highest hardship. Countrywide, roughly
one in twenty wage payment transactions get rejected due to technical errors such
as incorrect account number or incorrect linking of Aadhaar with bank accounts. We
pay close attention to rejected payments and assess the difficulty faced by workers
once their wages get rejected. We make several recommendations, categorised by
issues, to strengthen NREGA workers’ rights. This report is an attempt to document
the perspective of the workers in accessing their own wages. We hope that through
the report, policy makers, practitioners, academics, and other civil society members
can collectively understand the challenges workers face at the last mile to access their
wages. For such a collective understanding to work effectively, it is critical to involve the
workers in designing service delivery approaches. This is likely to enhance participatory
democracy and improve transparency and accountability of the government.
4
Foreword
It was a telling experience, in the last few years, to meet so many workers, pensioners
and others in rural Jharkhand who had the greatest possible difficulties in accessing
their meagre payments from the banking system. Some were waiting for payments
that, unbeknown to them, had been rejected for arcane technical reasons. Others were
bewildered by the requirements of “Qwicy”, as e-KYC is known in rural Jharkhand.
Others still had been cheated by unscrupulous business correspondents or other
intermediaries. And many had to wait for weeks or months for payments that are due to
them within days as a matter of legal right.
These hurdles have been particularly devastating for the National Rural Employment
Guarantee Act (NREGA), the focus of this report. Wage payment issues have plagued
NREGA ever since the transition from cash-in-hand to bank and post-office payments
in 2009. For one thing, payment is often delayed well beyond the 15-day period within
which they are supposed to be paid under the Act. It is not that delays were unknown
before 2009, but they were relatively short, and also, workers had ways to demand action
since the delays – if any – were generally caused by local authorities. This changed after
the transition to bank payments: delays became much longer (initially at least), and the
payment system became more and more centralised, depriving workers of any means of
control over it.
This is not to say that the transition to bank payments was wrong. Direct payment to
workers’ bank accounts is a useful safeguard against corruption. But the transition
from cash-in-hand to bank payments caused serious problems. Ideally, the transition
problems should have attenuated over time, giving way to a reasonably reliable and
timely payment system. Unfortunately, the modalities of bank payments kept changing,
creating periodic waves of new transition problems for many years. In some states,
cash-in-hand was successively replaced with post-office payments followed by bank
payments, payment through a specific bank, Direct Benefit Transfer (DBT) and Aadhaar
Payment Bridge System (APBS) payments – I am skipping some intermediate steps.
Each time the payment system was re-jigged, workers had to run from pillar to post
to adjust to the new modalities (for instance, by opening a new account, or linking it
with Aadhaar) and face another round of hurdles. Ten years after bank payments were
introduced, the central government is still unequal to the task of ensuring reliable wage
payments within 15 days.

5
The imposition of Aadhaar on NREGA was a turning point in this sobering story. When
the NREGA wage payment system moved to Aadhaar-based payments such as DBT and
APBS, a new generation of payment problems emerged. One of them was the problem
of “rejected payment”: as mentioned in the report, nearly Rs 5,000 crore of NREGA wage
payments were rejected during the last five years. Other Aadhaar-related problems
include diverted payments (money being sent to a wrong account) and blocked
payments (money being inaccessible to the worker, e. g. for lack of compliance with
e-KYC). Predictably enough, payment problems were especially common in the poorer,
less well-governed states, where they had a tremendous discouragement effect on rural
workers. In Jharkhand, whenever we enquire about their interest in NREGA work, rural
workers often say something like “Bhugtan sahi naheen hota hai to kya fayda?” (without
proper payment, what is the point?).
To be fair, some serious work has been done in the last few years to resolve the payment
issues, and significant progress has been made towards timely and reliable payment.
Nevertheless, major problems persist. For instance, payment rejection rates are still
hovering around 4-5%, much as before. Funds also continue to dry up around the end
of the financial year, holding up wage payments for weeks or even months at a time.
Further, NREGA workers still face many problems in extracting money from their bank
accounts.
The survey presented in this report is full of valuable insights into these “last-mile”
problems. It is startling, for instance, to learn that 40 per cent of Customer Service Point
(CSP) users in the sample have experienced biometric authentication problems (at
least one failure in the last five transactions). Similarly, an astonishing 25 per cent of the
respondents reported instances of being informed (by sms or otherwise) of a wage credit
of which they found no trace when they checked their account at the bank. To access
their wages, almost half of NREGA workers have to make multiple visits to the bank or
payment agency. This is all the more alarming as “a majority of the workers have to travel
to the block to collect their wages”, contrary to the common assumption that doorstep
payment has become the norm in rural India. Even at the block level, people are often
deprived of simple services such as updating of bank passbooks. Last but not least, the
report sharply brings out that NREGA workers are as bereft as ever of effective grievance
redressal facilities. Instead, they experience a harrowing “normalisation of hardships”.

6
In short, we are still very far from financial inclusion in the full sense of the term –
accessible, convenient and effective banking services for everyone. The report is a
useful antidote to some of the techno-utopian delusions that have flourished on this in
recent years. A good example is the Indian government’s Economic Survey 2015, which
promises “wiping every tear from every eye” with the so-called JAM trinity and even
concludes that “nirvana today seems within reach”. Five years after this rosy prediction,
poor people are still struggling to navigate the banking system.
The authors, of course, are not opposed to the use of advanced technology in NREGA or
other social programmes. But they advocate technological innovations that further the
rights of rural workers rather than corporate interests – liberation technology. This is a
powerful idea, with a wide range of possible applications.
The report, thus, is not just about fixing glitches in the NREGA payment system but
also about putting the issue in a new perspective. It will be of much interest to anyone
concerned with the future of employment guarantee and the rights of rural workers. The
concluding recommendations offer rich pointers for research, policy and action. Hats off
to the LibTech India team for this very enlightening study.
Jean Drèze
21 July 2020

7
About LibTech India
In 2012-13, during our work in Ghattu Mandal of Mahabubnagar district of undivided
Andhra Pradesh, a worker told us that she had worked in NREGA many months ago
and had not received her payment. We looked at the official data to discover that the
state had released the payment, but the intermediary had not paid her. We looked for
other such cases in programme data and found hundreds of such cases. We found that
payment intermediaries took 17 days on average for disbursed payments instead of 4
days as mandated and 13 percent of payments were hoarded for more than 45 days.
Human interactions helped us see data in a new way, while data helped us understand
the problem in a new light. Such conversations prompted us to study the NREGA wage
payments process in depth.
Since then, LibTech India has been engaging with workers, civil society organisations,
and the government on public services delivery at large and the NREGA in particular.
Inspired by the Right to Information (RTI) movement, LibTech is comprised of engineers,
activists, and social scientists and has been interested in improving transparency and
accountability of public service delivery in India. Effective transparency is a difficult task,
especially in this age of ever-increasing information. In our partnerships with different
groups, we leverage digital technologies to improve how citizens obtain information
about public programmes.
LibTech was started by Vivek S. when he was at Stanford University. Subsequently, the
team partnered with Collaborative Research and Dissemination (CORD) to expand
the nature and scope of work in many states in India. Vivek continues to be the main
anchor all of LibTech's efforts. We work closely with various civil society organisations
in the states of Andhra Pradesh, Telangana, Jharkhand, Bihar, Rajasthan among others.
Working in the grassroots helps us understand the bottlenecks and issues faced by
civilians in accessing their rights and entitlements. Very often the problems faced by
individuals are of a systemic nature and so it becomes important to identify the scale
of such issues. To understand the scale of the issues faced, we crawl (electronically read
and process data from a website) public data and use such dynamic transaction level
data to identify implementation bottlenecks. Further, the resolution of such issues may
require a variety of actions from every stakeholder - civilians, civil society groups and
the government alike. For such actions to have a meaningful impact, just disseminating
bits of information (soochna) might not be enough. What is required is actionable

8
Team members
LibTech India Convener
Vivek Srinivasan
The LibTech India Team
Alla Kowsalya, Anuradha De, Anushka Kale, Ashok Danavath, B. D. S. Kishore, Chakrad-
har Buddha, Kuruva Venkateswarlu, Laavanya Tamang, Lakshmanarao Korra, J. M. Konda
Babu, Ranadheer Malla, Mayank Rungta, Palle Ajay, Pangi Krishna Rao, Rajat Kumar,
Rajendran Narayanan, Rajesh Golani, Sabhil Nath Paikra, Sakina Dhorajiwala, Suguna
Bheemarasetti, V. Rameshbahu, Vanthala Bhaskar Rao, Venkat Krishna Kagga
Survey Design
Anuradha De, Chakradhar Buddha, Rajendran Narayanan, Sakina Dhorajiwala
Technology and Data Access
Mayank Rungta, Rajesh Golani and Ranadheer Malla
information (jaankari). Thus our efforts have been to work with people, identify the
scale of issues, identify the relevant jaankari based on a combination of field work and
public data crawling/analysis and take it back to the people, to the partner civil society
group and to the government. It requires an understanding of concrete problems that
people face in each context, a strategy on which issues could be reasonably tackled in a
given context, and an assessment of what role information can play in a role in this social
process.
Our focus over the years has been on NREGA, although we have worked on an array
of social security programmes such as the National Food Security Act (NFSA), old age
pensions, maternity entitlements, among others. This report is the culmination of some
of our work over the years on the last mile challenges that people face when they receive
cash transfers from the government, particularly NREGA wages. It presents the findings
of the “People’s Experience of Government to Citizen Payments” survey carried out in
three Indian states of Andhra Pradesh (AP), Jharkhand (JH) and Rajasthan (RJ) between
September to November 2018.

9
Andhra Pradesh Surveyors
Appalanaidu, Atchumnaidu, Ayyappa, Balaji, Chanti, Chiranjeevi, Eswar, Laala,
Nagaraju, Paidiraju, Sai, Sekhar and Siva sai ganesh
Coordinators: B. Manoj, Chakradhar Buddha, Kuruva Venkateswarlu, Ranadheer Malla
and S.Jayant
Jharkhand Surveyors:
Abhimanyu Giri, Abrenciya Lakra, Anuj Kumar Gupta, Anup Kumar, Bikash Kumar
Bhuiyan, Mahesh Singh, Pratibha Gaikwad, Rahul Kumar Singh, Ramesh Kumar Mahto,
Renuka Tirkey, Sachin Kumar, Sulesh Gaikwad, Sunil Kumar Khushwaha, Upendra Kumar
Coordinators: Natasha D'cruz, Rajendran Narayanan, Sabhilnath Paikra,
Sakina Dhorajiwala and Sumer Sharma
Rajasthan Surveyors:
Asha, Ganpat Singh, Gita Kanwar, Hemalatha, Jagdeesh, Kamal Kumar, Kirti, Manisha
Kumari, Pravin Singh, Priyanka Panwar, Shravan Singh, Simran Vyas, Shyam and Vikram
Singh
Coordinators: Ranadheer Malla, Saila Sri Kambhatla and Sakina Dhorajiwala
Report Design:
Krithika Santhosh Kumar, Kshiraja Krishnan, Tejas Pande
Authors of the Report
Rajendran Narayanan
[email protected] | 9620318492
Sakina Dhorajiwala
[email protected] | 9833419391
Sailasri Kambhatla
[email protected] | 9791433810
Contact LibTech India
Twitter: @LibtechIndia
Website: www.libtech.in

10
Acknowledgements
We are immensely grateful to the hundreds of workers across the states for being
patient and giving us their valuable time during the survey. The workers provided
critical political and philosophical insights that so often do not make it to the dominant
discourse on policy making and implementation. Their cooperation with the field
surveyors remains invaluable to the project and the team.
The NREGA frontline functionaries, i.e., the Gram Rozgar Sahayak (Field Assistant
in Andhra Pradesh) and the Computer Operators in each block serve as the primary
interface between the workers and the government. Interviews with the frontline
functionaries of Basia, Butchayyapeta, Jawaja and Manika were highly illuminating. We
are grateful for their time and patience during the interviews, often late after working
hours.
We are indebted to the team of surveyors across the states who have painstakingly
executed the work. They upheld the ethics of informed consent and respected workers’
time and interests. Some surveyors in Jharkhand had to leave before the survey was
completed. At such a critical juncture, the following people from the Manika Sahayata
Kendra lent unconditional support and ensured the completion of the survey: Dilip
Rajak, Nanhku Singh, Pachati Singh, Rajeshwar Singh, and Rajendra. Many thanks to
them for promptly stepping in to help.
We would also like to express our gratitude to the networks of civil society organisations
who helped immensely during the process of the survey: Mazdoor Kisaan Shakti
Sangathan (MKSS), School for Democracy (SFD), The Social Work & Research Centre
(SWRC) - Jawaja, Rajasthan Asangathit Mazdoor Union - Jawaja, Professional Assistance
for Development Action (PRADAN) - Jharkhand, Multi Arts Association (MAA) -
Jharkhand and NREGA Sahayta Kendra - Manika & Basia, Jharkhand. We thank Gurjeet
Singh of the Social Audit Unit of Jharkhand for providing valuable support.
Special thanks are in order for James Herenj, Shankar Singh, PS Ajay Kumar for giving us
and the enumerators valuable state specific insights.

11
We would like to thank the team at Collaborative Research & Dissemination (CORD)
for providing administrative support and providing important inputs during the data
analysis and writing of the report. In particular, we would like to thank Anuradha De,
Upasak Das and Mohit Sharma for detailed comments on the methodology. And,
to Sanjeev Kumar for catering to all our administrative requests promptly. Special
thanks to the entire CORD team for letting some of us stay many days and nights while
writing this report. The report would not have been possible without the CORD team’s
abundant hospitality.
Arjun Jayadev, Karuna Mutthaiah, and Vineet Bhambhu gave constructive suggestions
regarding the structure of the analysis and the context of the report. We are grateful
to Debmalya Nandy and Anjor Bhaskar for their suggestions on the recommendations
made in this report.
The survey would not have been possible without the invaluable research assistance of
Saila Sri Kambhatla and Ranadheer Malla. We would like to thank Anushka Kale, Ajay
Palle and Laavanya Tamang for helping with creatives in the final draft of the report.
This work has been generously supported by a grant from the Research Centre of the
Azim Premji University (APU). The team at APU, in particular Varghese Antony, went
beyond their responsibilities and provided immense timely support throughout the
phase of this work.
We would also like to acknowledge the patient work of Kshiraja Krishnan,Tejas Pande,
Krithika Santhosh Kumar for designing this report.
Finally, we would like to thank Jean Drèze for his valuable comments on the drafts. His
guidance and insights have been instrumental in shaping our work not only during this
project but over the past so many years.

12
Data SummaryWe present a data summary of the challenges workers face while trying to access their
wages from payment disbursement agencies. The data consists of responses, statistical
estimates & predictions of 1947 NREGA workers from the states of Andhra Pradhesh
(AP), Jharkhand (JH) and Rajasthan (RJ). The disbursement agencies include banks,
CSPs/BCs, ATMs & Post Offices (only in AP). We have divided the findings into 7 sections:
• Awareness, Access to Information & Location of Payment Disbursement agency
• Transparency & Accountability
• Aadhaar & Biometric Related
• Time & Cost to Access
• Rejected Payments
• Grievance Redressal
• Recommendation
Awareness, Access to Information & Location of Payment Disbursement Agency • Around 65 percent of the respondents in AP, 50 percent in JH and about 97 percent in
RJ were unaware of the number of bank transactions they can do in a month.
• In JH and RJ blocks, roughly 1 in 2 people were unaware of the minimum bank
account balance required to keep the account active.
• 75 percent of all respondents did not know if bank branches other than the parent
bank branch could be used for financial transactions.
• Only 11 percent of workers receive SMS services to be informed about wage credit. 36
percent have to visit a bank just to find out if their wages have been credited.
• 25 percent of respondents reported that despite being informed about wage credit
(through any means), they went to the bank and found out that their wages were not
yet credited.
• Higher awareness amongst workers does not directly translate into lowering
hardship experiences
• There is better penetration of payment disbursement agencies in AP compared to
JH and RJ. Roughly two-thirds of the respondents in AP had access to disbursement
agencies in their own village and panchayat. For 69 percent in JH and 49 percent in
RJ the nearest payment disbursement agency was far away at the block.

13
Transparency & Accountability • While all the bank and post office users were issued a physical passbook, about 56
percent of all those who opened accounts at CSPs/BCs were not issued passbooks.
• 57 percent of the respondents reported that their passbooks do not always get
updated. This was most severe in RJ where about 69 percent reported that their
passbooks never get updated on withdrawals.
• More than two-thirds of the time, workers were denied the facility to update
passbooks due to overcrowding at banks or because bank officials asked workers to
come back later.
• 100 percent of the post-office users reported that their passbook always gets
updated on withdrawals.
• While a significant proportion in AP got receipts for withdrawals at CSP/BC, over 80
percent in JH and RJ did not get receipts at CSP/BC.
• Issues of network connectivity, faulty printers and overcrowding were the key
reasons for denial of receipts.
• One in three respondents had to pay commissions to the CSP/BC to withdraw wages.
This was highest in JH where 45 percent of the users reported to have been charged
for withdrawing wages.
Women in Jharkhand waiting with their children outside a particular Gramin bank. While the main gate of the bank was closed and they were requesting to get their passbooks updated through the small window.

14
Aadhaar and Biometric Related • An estimated 40 percent of CSP/BC users faced biometric authentication failure at
least once in their last 5 transactions.
• An estimated 7 percent reported that EACH of their last 5 transactions failed due to
biometric authentication issues at CSP/BCs.
• Roughly one in three respondents in RJ experienced difficulty in linking their
Aadhaar to the bank account. It was about one in 5 in Jharkhand and about one in 14
in AP.
Time and Cost • An estimated 42 percent in JH and 38 percent of people in RJ took more than 4 hours
to access wages from banks. In comparison, this was just 2 percent in AP.
• Approximately one in four respondents in JH and RJ spent 3 hours accessing wages
from CSP/BC. As opposed to that only 1 person in AP reported taking that long.
• An esimated 18 percent of bank users were denied wages and asked to visit
CSP/BC instead.
• The average cost incurred to visit post offices to withdraw wages is the lowest at Rs.
6. In comparison, it costs Rs. 31 to visit a bank, Rs. 11 for a CSP/BC & Rs. 67 for an ATM.
• Nearly 50 percent of ATM users reported that they had to visit the ATM again
because the machine did not dispense any cash
• About 45 percent of the bank users had to make multiple visits for their last
withdrawal while an esimated 40 percent of the CSP/BC users had to make multiple
visits due to transaction failures.
Rejected Payments • Rejected payments are those transactions that are stuck due to technical errors of
the payment system, bank account problems or data entry errors. Of the 249 people
in our sample with rejections 111 were from JH and 138 from RJ. At the time of the
survey, AP had negligible rejected payments. Workers don’t get these wages unless
the rejected payments are rectified.
• According to official figures, as of July 2020, in the last five years, about Rs. 4,800
crore worth of payments were rejected and about Rs. 1,274 crore worth is still
pending to be paid to workers.
15
• 63 percent of people in JH were not aware that their payment was rejected as
opposed to 25 percent in RJ.
• 77 percent of the respondents were unaware of the reason for their payments
being rejected. Unless the reasons are known, the rectification is not possible.
Consequently, all future NREGA wage payments to these individuals will continue to
be rejected.
• 70 percent of people with rejected payments have experienced very high or high
hardships at their respective payment agency. This indicates that people with re-
jected payments have to face a two fold problem. They not only face the brunt of the
payment rejection but also experienced greater hardship at their payment agency.
Grievance Redressal
• Normalisation of hardship implies that even severe violations of the Act are not
construed as legitimate grievances by workers. In the rare case, even when they did
recognise that the issue constituted a grievance, they seldom registered it officially.
• Overall about 546 (of 1947) respondents communicated their complaints - of which
about 94 percent did so verbally. The remaining 6 percent filed them in writing and
only 1 respondent among them filed the complaint online.
• Filing a complaint verbally has no official bearing and therefore it is equivalent to
not filing it at all.
• About 30 percent of the respondents in RJ and 24 percent in JH reported that they
had grievances but had not registered them.
• 79 percent of the complaints were about pending wages and partial wages received.
• 64 percent of the complaints (albeit verbally communicated) were communicated/
given to the Panchayat officials.
• 59 percent respondents who filed complaints across the states did not have them
satisfactorily resolved or resolved at all. Among those who said that their complaints
were not resolved at all, they were either told to wait for a few days or didn’t know
the status of their complaints.
16
Recommendations • In light of the COVID-19 crisis, increase the number of days of individual
entitlements, provide work on demand at the work site.
• Ensure timely payment of wages and payment of delay compensation for the full
extent of delay, i.e., till the wages are credited to the workers’ accounts. Wage slips
must be provided to every worker regularly at designated areas in the panchayat.
• There is an urgent need to increase bank branches in rural India and decentralise the
wage payments mechanisms.
• Information system design must be worker centric. Worker participation in
designing and rolling out information systems is critical. For instance, all information
from work demand to payments must be made available in each panchayat in
formats arrived at through consultation with workers.
• Ensure a Know Your Rights (KYR) framework (details in the Annexure) is prominently
displayed and implemented at every payment disbursement agency. Passbook
update facilities should be made available at every payment disbursement agency
including CSPs and BCs.
• Create strong accountability structures for EVERY intermediary in the disbursement
of wage payments including agencies such as UIDAI, NPCI, PFMS, Banks, and CSPs/
BCs. Each of these agencies should be brought within the ambit of social audits.
• Ensure timely coordination with various payment intermediaries to proactively
resolve issues of rejected payments.
• Any payment related interventions should be worker centric and must be piloted
with wide consultation with workers before rolling out.
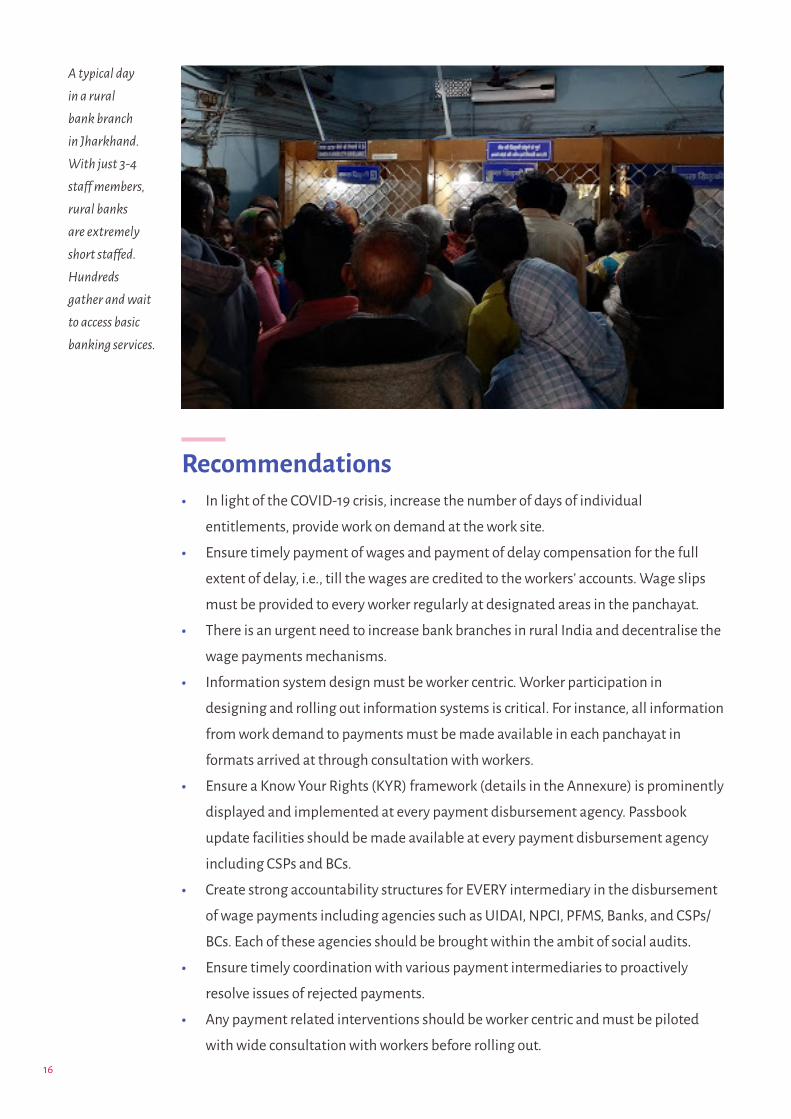
A typical day in a rural bank branch in Jharkhand. With just 3-4 staff members, rural banks are extremely short staffed. Hundreds gather and wait to access basic banking services.

17
Introduction Sheela Devi, a young woman from Latehar district of Jharkhand worked as a labourer on
construction sites and as a labourer in the Mahatma Gandhi National Rural Employment
Guarantee Act (NREGA) programme as well. She and her husband are both daily wage
labourers who depend only on their wages for their livelihood. Sheela had worked for
24 days in the financial year 2017-18 in the construction of a farm pond under NREGA.
She was entitled to Rs 4,032 as wages for this work. However, Sheela hadn't received the
wages until May 2018, when we met her for the first time. In this period Sheela had gone
to the bank several times inquiring about her payment and the repeated response she
got from the local State Bank of India branch was that her wages were not deposited
from the administration. The bank is located in the block about 10 kilometres from
Sheela's village. Depending on the day of the week, Sheela either had to walk all the
way for about an hour or walk some distance and then take an auto ride to the bank. The
response from the bank remained the same in multiple visits.
Sheela then contacted the NREGA Help Centre (Sahayata Kendra) in the block which is
run by local non-government volunteers who help workers understand and exercise their
rights. From the help centre the volunteers were able to track Sheela's work payment
on the NREGA online Management Information System (MIS). Her payment status on
the MIS was recorded as ‘credited.’ They asked Sheela to go and check in the bank and
preferably update her passbook for the sake of evidence. Not only was the response from
the bank unchanged in the subsequent visit, but the bank officials also refused to update
her passbook since there was no transaction in her account. It is common for banks to
refuse updating passbooks, especially when there are no new transactions in the bank
account.
Along with the LibTech team, the Help Centre gathered many cases where workers had
payment problems and alerted the local administration at the block. The taxonomy of
payments issues was mind-boggling even for a technically savvy urban crowd. In some
cases the local administration was culpable as it had not entered the work details on
the MIS. In other cases, the MIS reflected that the payment was ‘credited’ but reality,
like in Sheela’s case, was otherwise. The local administration was unable to accurately
verify the accounts to which many of these payments were actually credited. There
were several other egregious cases where the payment status on the MIS indicated that

18
the payment was ‘rejected.’ This is the equivalent of a ‘bounced cheque.’ The difference
is that here the recipient of this amount has no way to find out whom to contact and
how to rectify this problem. The local administration expressed helplessness. The
helplessness was largely due to the lack of capacity and authority in dealing with a
highly centralised payment architecture.
For Sheela, the deadlock needed resolution. The only available method was escalation.
We invited representatives from the state government to visit the block and investigate.
Sheela presented her case to the officials. The state officials instantly assumed that she
was lying and that she was acting to dupe the system. Visibly miffed by the officials’
reaction to her situation, she responded in a stern voice, that she wouldn't go through
the trouble of repeatedly visiting the block to get wages for work that she had not
earned. Our team followed up Sheela's case with the rural development department
and found that Sheela's wages were deposited into the account of another (completely
unrelated) person in the district headquarters in Latehar. That too in a completely
different bank; Punjab National Bank. The response on the part of the department was
that Sheela should go and recover the money from the person in Latehar which is at least
30 kilometers away from her village. The ordeal ensured that Sheela Devi discontinued
NREGA work.
Sheela's persistence is commendable. She stood her ground with the officials from the
bank, the local and state administration. She made visits, submitted numerous photo-
copies of documents to prove that she had indeed done the work but had not received
any wages. Sheela’s case poses deeper questions not just about the routine hardships
that people like her have to go through but also about the blind reliance on technology
fixes as the panacea for political and administrative issues.
Sheela’s testimony was pitted against the technological testimony of a column in a
database that said her wages were “Credited.” The fact that there was more faith in an
opaque technological process compared to the repeated words of a struggling individual
poses important questions about the foundations of technical systems in welfare
delivery. The burden of proof lay on an atomised individual seeking her right against
a complex power structure. For example, if the same incident were to happen to an
older and less aware/vociferous woman, who lived 30 kilometres from the nearest bank
branch, her experience would be very different. In this report, we attempt to capture
some of these challenges faced by workers in accessing their NREGA wages.

19
NREGA in Times of COVID-19This report is being released at a juncture that is globally unprecedented and certainly
so in the history of modern India. In response to the pandemic, the Government of India
(GoI) announced a nation-wide lockdown on 24th March, 2020. As we write this, in the
first week of July 2020, several states continue to be under some degree of lockdown.
As (Ray and Subramanian 2020) indicate, the government’s abrupt declaration is a
‘symptom of panic under pressure’ resulting in a massive humanitarian crisis. The 500
million unorganised labour force has faced the maximum brunt with non-payment
of wages, loss of employment, and hunger. According to the reports by the Stranded
Workers Action Network (SWAN), (Stranded Workers Action Network, 2020a) (Stranded
Workers Action Network, 2020b) around 50 percent of those who reached out to them
had less than one day of rations left and around 64 percent had less than Rs 100 when
they reached out. Similarly, a phone survey of over 5,000 households across several
states, (Kesar et al. 2020) shows that around two-thirds of the workforce in their sample
lost employment during lockdown.
The unemployment rates in 2019 were the worst since 1972.
For a country with an abysmal track record of reliable public health and insufficient
social protection measures, the government’s relief measures have been woefully
inadequate. On March 26th, the Finance Minister announced a relief package of Rs 1.7
trillion under the Pradhan Mantri Gareeb Kalyan Yojana (PMGKY). Among other things,
it stated that “Under PM Garib Kalyan Yojana, MNREGA wages would be increased
by Rs 20 with effect from 1 April, 2020. Wage increase under MNREGA will provide
an additional Rs 2,000 benefit annually to a worker.” However, this claim is grossly
misleading. On March 23rd 2020, the Ministry of Rural Development (Ministry of Rural
Development 2020) had issued a notification on wage rate increase. This notification is
a routine exercise done every year as an adjustment against inflation. In fact, as correctly
argued by (Drèze 2020), the prescribed increase as per this notification for 2020-21
is Rs 226. This is well above the increased NREGA wage of Rs 202 announced by the
Finance Minister. A second, enhanced batch of relief measures over five tranches were
announced by the Finance Minister on May 12th. Detailed analysis of the two batches
of announcements under PMGKY by Ray and Subramanian (2020) indicate that a large

20
part of the packages correspond to loans and liquidity infusions. The effective fiscal
stimulus is less than 2% of the GDP. This implies that the announcements fall well short
of cushioning the blow for the poor. As they state ‘this sort of strategy appears to be
somewhat unthinking, to put it mildly. Alternatively, it is a strategy conceived with only
some economic agents — principally business enterprises and tax assessees — in mind.’
The rural distress was severe well before the lockdown. Unemployment increased three
times for rural men and doubled for rural women between 2012 and 2018 as per the
Periodic Labour Force Survey (PLFS). The unemployment rates in 2019 were the worst
since 1972. The Consumption Expenditure Survey (CES) of 2017-18 was not released
by the government citing ‘data quality issues.’ As per leaked findings of the 2017-18
CES reports, the overall monthly per capita consumption expenditure fell by around 9
percent between 2012 and 2018; a first in four decades (Jha 2019). As per the National
Statistics Office reports from 2011 on consumer food price inflation, considering a
family of four, even for the richest 5 percent of the rural population, the expenditure on
cereals and pulses is less than Rs 2.50 per day per person (Seshadri 2019). To put this in
perspective, the cost of one egg is Rs 5 and one litre of milk is Rs 30. An analysis of the
CES of 2011-12 and the leaked findings of 2017-18 shows that the entire cross section of
rural India became significantly poorer between 2012 and 2019 (Subramanian 2019).
These statistics imply the continued slack in rural demand and scarily low consumption
levels in rural India were well underway before the onset of COVID-19.
On the other hand, as per the Oxfam Inequality Report (Oxfam India 2018) the wealth
of the richest one percent in India increased by Rs 20.91 lakh crore. This amount is
equivalent to the total budget of the Central Government in 2017-18, while the annual
budget of NREGA in 2020-21 is just Rs 60,000 crores with an additional Rs. 40,000
recently added as a relief measure during the COVID-19 lockdown. Even with this added
budget, the allocation of Rs 1 lakh crore, as a percent of the GDP is just around 0.48
percent. This is much less than the recommendation of 1.7 percent of the GDP by World
Bank economists (Murgai and Ravallion 2005) for the programme to run robustly in
normal times.
As per leaked findings of the 2017-18 CES reports, the overall monthly per capita consumption expenditure fell by around 9
percent between 2012 and 2018; a first in four decades (Jha 2019).

21
At a time when India is going through a severe economic tailspin, NREGA is an
important way to enhance social protection and thereby reduce the risks of the most
vulnerable. With the extended periods of lockdown the loss of employment is likely
to have pushed many more people to the margins. It is in these grim settings that
there is an urgent need to boost rural demand through employment generation by
strengthening the NREGA.
The Act has been plagued for the past few years with low budget allocations, massive
delays in payments, and low wage rates. Any research on its implementation, challenges
and efficacy would be incomplete without understanding the last mile delivery. As more
and more programmes are shifting to direct benefit transfers, with similar financial
infrastructures, we hope that this research is useful to understand some common
themes.
In this report particularly, the focus and emphasis is on the challenges and positives
of last mile delivery, i.e., what happens after the wages are credited to the workers’
bank account. Thus, we conducted the survey in three states with 1947 NREGA workers
and field functionaries like the block computer operators, bank officials and other
NREGA field staff. We begin this report with the Background and Context of NREGA
and financial inclusion. In Section 2, we discuss the funds flow process and the main
issues with the last mile delivery of NREGA payments. In Section 3, we present the
main questions of the last mile survey. In Section 4 we present the survey methodology
and present the limitations of the survey in Section 5. We present the main findings
of our 3 state survey in Section 6. Apart from basic demographic details about the
individuals, we tried to understand the payment agency they used to access their
wages - Banks, Post Offices, Customer Service Points (CSPs) or Business Correspondents
(BCs) and Automated Teller Machines (ATMs). We tried to understand the awareness
they had about their rights with respect to the disbursement agency of choice. For
the disbursement agency they used most commonly, we tried to understand their
experiences with respect to time taken, cost incurred, transparency, preference of
disbursement agency among others. We also focus on the issue of rejected payments
in NREGA and aspects of grievance redressal. We discuss some recommendations in
Section 7. The Appendices contain all the mathematical and statistical underpinnings
of some quantitative exercises done in Section 6. In the Annexure, we provide a minimal
‘Know Your Rights’ (KYR) framework that should be put up in every disbursement
agency. This is one way to ensure the workers are aware of their banking rights.

22
NREGA: Background and ContextIn the last two decades several rights-based legislations like the Right to Education
(RTE), the National Food Security Act (NFSA) among others have been introduced to
fructify our constitutional rights. The ‘Right to Life’ enshrined under Article 21 of the
Constitution of India includes in its ambit the 'Right to Work'. As the Supreme Court of
India has held in multiple cases, the ambit of ‘Right to Life’ is not limited to mere survival
but also includes the ‘right to live with human dignity’ 1 along with ‘right to livelihood’.2
In this regard, the National Rural Employment Guarantee Act (NREGA) is a landmark
legislation and a key aspect to enable the realisation of ‘Right to Life’ through ‘Right to
Work’. The Act as notified on 7th September, 2005, mandates 100 days of guaranteed
work to every rural household whose adult members are willing to do unskilled manual
work.
NREGA’s provisions amount to justiciable rights – the right to work on demand, the right
to unemployment allowance if work is not provided within 15 days, the right to payment
of wages within 15 days, right to a delay compensation if payments are delayed beyond
15 days, the right to minimum wages, mandatory social audits, essential worksite
facilities, among others. In addition to the worker-centric rights, the Act envisages relief
from ecological and agrarian distress. The relief objective is intended to be achieved
through the creation of long-term sustainable assets for water and soil conservation,
drought proofing, renovation of water bodies, rural connectivity, amongst others.
The universality of NREGA has allowed it to be widely accessible across the rural
population. Employment-Unemployment Survey data of National Sample Survey Office
(NSSO) indicates an eightfold increase in participation in public works between the
periods 2004-05 and 2009–10. In 2018-19, close to 80 million (8 crores) people worked
under NREGA. Overall, 1 out of 3 rural households had worked in the programme.
NREGA has particular significance for economic mobility amongst historically and
socially marginalised groups - Scheduled Castes (SC), Scheduled Tribes (ST) and women.
Every year, around 40 percent of households employed under NREGA belong to SC and
ST groups which constitute 30 percent of the rural population. The scheme has allowed
for ‘lower’ caste agricultural labourers to access wages higher than those arbitrarily
set by the ‘upper’ caste landlords otherwise. NREGA also provided an opportunity for
many women to enter the paid workforce. In the last five years, more than half of all the
NREGA work was done by women. With labour wages deposited directly in their bank
accounts, women’s financial autonomy and economic mobility had increased.
1

23
From a governance standpoint, the Act enshrined strong principles of transparency,
accountability, and democratic participation. The planning and decision of NREGA
works were to be taken at the Gram Sabhas and implemented through the Gram
Panchayats. The objective was to redistribute the power structures so that the poor
and the vulnerable get a stake in the decision making process. The experience of such
decentralised decision making however has been mixed.
Through the Management Information System (MIS), there has been a proactive
disclosure of information online about various aspects of NREGA. It is a transaction-
based, real-time system that is made available in the public domain. Most of the
processes in NREGA have been digitised, right from registration of work demand,
through work allotment, to finally getting wages for the completed works. The MIS
displays this information through online reports at various levels of disaggregation.
The sheer scale of information available on implementation is no mean achievement.
Individual worker details from around 2.5 lakh gram panchayats are available in the
NREGA MIS.
While it is impressive that all NREGA data is available in the public domain for scrutiny,
its accessibility to workers remains a serious challenge. Mandatory proactive disclosure
of information is a legal mandate under NREGA. However, critical information for
workers on work and wages remains confined to digital screens that impede last mile
information dissemination. While computerisation of all transactions may be useful,
implementation should not depend entirely on digitisation. The use of a real time
system has made it easier for officials to pass on the baton of accountability. One
should be mindful that an information system doesn’t directly translate into granting
legal rights. There are several ways in which the MIS has been used to scuttle workers’
rights (Dhorajiwala and Narayanan 2016; Aggarwal 2017; Nandy 2018). For instance,
unless work demand is registered on the MIS, it is not possible for a worker to seek work
under NREGA. A host of information about work done, payments under process and
payments credited is available on the MIS. However, the design and structure of the
MIS is administration-facing and not worker centric. The MIS should be transparent
for the workers, and not just for the officials. Further, the MIS also centralises control
and conceals the liabilities of the government. Centralisation has often caused several
cases of diverted payments (one person’s payments going to somebody else’s accounts)
(Narayanan, Dhorajiwala and Paikra 2017; Narayanan and Dhorajiwala 2019b), rejected
payments, and suspended payments to name a few. In this context, Dhorajiwala
(2018), Drèze (2018) and Nandy (2019) give examples of the manner in which workers’
accessibility has been compromised. Aadhaar based payments have been a tool for

24
centralisation. By arguing that the violations of ‘Right to Life’ due to imposition of
Aadhaar has gained scarce attention, Khera (2017) presents a detailed account of the
nature of exclusions arising in four different welfare programmes including NREGA. The
paper also demonstrates the misleading claims on ‘savings’ that the government has
routinely alluded to with respect to the Aadhaar project.
NREGA has also paved the way for financial inclusion in the country. NREGA payments
switched from cash payments to bank payments as early as 2008 (Vanaik & Siddhartha,
2008). This was done primarily to separate the paying and the implementing agencies. It
has been successful to some extent in reducing corruption, enabling financial inclusion
of the vulnerable, particularly women. However, as mentioned earlier, the direct transfer
of wages to bank accounts, without accountability norms of the various parties involved
in the cash transfer, is fraught with a host of problems for the workers.
Financial Inclusion
In the context of NREGA, it is important to understand the focus on financial inclusion
in the country. NREGA and efforts for financial inclusion have grown separately in the
country but have had an impact on each other to a great extent in rural India. Financial
inclusion has been a central preoccupation for many governments and policy makers
in India for decades, and gained momentum through NREGA. The effort and zeal that
has gone into this project is a remarkable achievement. Financial inclusion has to be
understood as an affirmative action against financial exclusion as there is a strong
correlation between financial exclusion and poverty. An early articulation of financial
exclusion was made by Leyshon and Thrift (1995) where they defined it as ‘those
processes that prevent poor and disadvantaged social groups from gaining access to
a financial system. It has important implications for uneven development because it
amplifies geographical differences in levels of income and economic development.’
1.1

25
Using bank branch data from the Reserve Bank of India (RBI), poverty headcount data
from the National Sample Survey, agriculture wage data, among other sources, Burgess
and Pande (2005) demonstrate that branch expansion into rural unbanked locations
significantly reduced poverty. With technological advances, the costs of running rural
banks will also be significantly lower now. Moreover, when the outcome is a significant
reduction in poverty due to more bank branches, any additional infrastructure costs
should be imperative from a policy perspective. There is also evidence indicating high
correlation between bank branches and increase in GDP of India (Iqbal and Sami 2017).
These necessarily point to a need to increasing rural bank penetration.
In 2013, the committee on ‘Comprehensive Financial Services for Small Businesses
and Low Income Households’ under the chairpersonship of Nachiket Mor submitted
a detailed report to the RBI. The terms of reference included ‘To frame a clear and
detailed vision for financial inclusion and financial deepening in India’ and ‘To lay down
a set of design principles that will guide the development of institutional frameworks
and regulation for achieving financial inclusion and financial deepening.’ Some of the
key recommendations outlined to be achieved by 1st January, 2016 were: (a) every
Indian should have a secure electronic bank account, (b) the number and distribution
of electronic payment access points would be such that every single resident would be
within a fifteen minute walking distance from such a point anywhere in the country.
Each such point would allow residents to deposit and withdraw cash to and from their
bank accounts and transfer balances from one bank account to another, in a secure
environment, (c) sufficient access to affordable formal credit, and (d) Right to Suitability.
The Mor Committee report also makes an astute, noteworthy comment: ‘While there
is no question that there is a continuing need to explore new ideas; learn from the
experiences of other nations; and benefit from new technologies; perhaps it is not the
best regulatory strategy to centrally pick one approach no matter how convincing it may
seem and to push the entire system in that particular direction to the exclusion of all
others. A better approach may instead be to articulate a clear vision; establish a set of
design principles; and then to permit all strategies, new and old, to flourish or to die out
based on their inherent strengths and weaknesses.’

26
NREGA Wage Payments Over the Years
In the earliest phase of NREGA, wage payments were made in cash through the Gram
Panchayat (GP) administration. The amounts would be received in the account of the
GP and disbursed in cash to workers in a public place for the works for which the GP was
the implementing agency. In the subsequent system a pay order with the names and
amounts of workers who had to be paid was created and the bank manager transferred
the money into the accounts of the workers. In 2008, state governments were specifically
instructed to open accounts for workers in banks and post offices to ensure that
the implementing agency is different from the payment agency (Ministry of Rural
Development 2008). Alternatively, payments were made from the Gram Panchayat in
the form of account payee cheques to workers. Exceptions for cash payments were to be
made only for places where the networks of banks or post offices were weak. In that case,
payments were to be made in the presence of a Payment Committee. The guidelines
have important markers to ensure that bank accounts for women are opened and
operated by them, so as to increase facilitation for women’s financial autonomy. They
also have many progressive instructions for states to ensure that nobody is excluded
from the programme due to payment related issues. Strict norms for transparency, such
as, payments to labourers in public, reading aloud of wage slips while making entries
in the job cards are also included. Additionally, the guidelines stress that, ‘As far as
possible, the design of Bank Passbooks should be such as to facilitate the monitoring of
NREGA payments, e.g. through matching of passbooks with Job Cards and/or Muster
Rolls.’ Consequently, workers themselves expressed preference for wage payments in
bank accounts (Adhikari and Bhatia 2010). However, they also caution that unless banks
are brought within the ambit of strict transparency and accountability norms of the Act,
NREGA workers will be at risk of being exploited.
1.2
Following the opening of new bank accounts, the NREGA MIS was purported to be a new
chapter in transparency of payments to workers. Drèze and Sen (2013) write ‘NREGA has
been a lively laboratory for anti-corruption efforts.’ All the details such as household
level information, work demand, work done, and payments due are entered on the
Paper records, wall paintings and wage slips had completely disappeared from the vocabulary of NREGA
officials and workers.

27
NREGASoft, a software developed by the National Informatics Centre (NIC). In this
backdrop in 2012, the Ministry of Rural Development (MoRD) introduced the electronic
fund management system (e-fms). E-fms would enable wage payments directly to the
workers’ bank accounts. In this system, the state government transferred money to
people whose banks had an internet-enabled network banking capability, popularly
called ‘core banking facility.’ Eventually, most banks have developed such a core banking
capability.
It was reiterated in the NREGA guidelines of 2013 (Ministry of Rural Development 2013),
that the implementing agency should be separated from the payment agency. A much
greater emphasis was paid on reducing delays in wage payments. Another important
aspect of the guidelines was the stress on transparency and communication with
workers. Distribution of wage slips, door to door contact programmes, wall paintings,
and sms to workers were suggested as a means to ensure that workers are informed.
Many of these provisions were progressive and worker centric. Figure 1.2(a) from the
NREGA operational guidelines (Ministry of Rural Development 2013) emphasises
informing workers about crediting of wages through SMS.
Figure 1.2(a):
SMS Alerts
for Important
events
Over the years, the emphasis on transparency of information for workers has been
reduced. Instead, the availability of information on the online MIS has become the
only channel of information for the field functionaries and workers alike. Based on our
continued engagement in Jharkhand and Rajasthan, the field functionaries have said
that if the worker had any questions about work or wage payments, they would ask the
computer operator in the block or inquire at the bank. Paper records, wall paintings and
wage slips had completely disappeared from the vocabulary of NREGA officials and
workers. In the years leading up to 2018, postal payments were slowly tapered off across
the country except for a few regions. The decline of post offices as payment agencies was
partially based on the reasoning that post offices did not have core banking capabilities
and so experienced many delays and corruption.
SMS Alerts for important events
The MIS should include mobile numbers on which SMS alerts of important events (in case the benefi-
ciary has agreed to list his number) would be automatically sent. This is to ensure that the workers are
proactively informed of various details of the implementation cycle. For instance, as and when wages are
credited to individual accounts of workers, an SMS alert would be generated by NREGASoft and sent to
the mobile number that has been furnished.

28
The NREGA payment systems have undergone further centralisation since 2016, when
the MoRD introduced the National electronic - fund management system (Ne-fms). The
Ne-fms enabled direct transfer of payments to workers from the central government
through a notional account of the Ministry of Finance. Ne-fms was rolled out in two
phases and was applicable to the entire country by October, 2016. The main objective
of introducing Ne-fms was to streamline funds flow and reduce delays in payments
to workers. The Ne-fms payments were undertaken through account based payments
(ACH/NACH)3 and Aadhaar based payments or the Aadhaar Payments Bridge System
(APBS). In account based payments, the bank account number, the IFSC and the name
of the account holder are used to identify and make the transfer. In Aadhaar based
payments, the 12 digit Aadhaar number is used as the financial address. While the
process of shifting towards Aadhaar based payments started in 2013, a major push came
from the government from 2014-15. This was a part of the National Democratic Alliance
(NDA) government’s flagship Jan dhan, Aadhaar, Mobile (JAM) trinity. In NREGA,
Aadhaar plays a role at three levels:
1. Seeding the Aadhaar numbers of the workers with the NREGA job card.
2. Making the payment through the Aadhaar Payment Bridge System (APBS), wherein
the Aadhaar is the financial address of the individual.
3. Withdrawing money from Customer Service Points (CSPs)/ banking kiosks or
through Business Correspondents (BCs) through Aadhaar based biometric
authentication. This requires the individual to seed their bank account with their
Aadhaar number. This is known as Aadhaar enabled Payment System (AePS).
The local government bodies at blocks were instructed to collect the Aadhaar, bank
account and job card details of workers and ensure that most workers were shifted on
to the APBS platform. In colloquial terms, the combination of the APBS and AePS has
come to be known as Direct Benefit Transfer (DBT). It is instructive to note that the
earlier systems such as e-fms and Ne-fms could also be referred to as DBTs, however for
field functionaries, DBT has become solely synonymous with Aadhaar based payments.
All the field functionaries we spoke with have told us that they had to meet strict
targets for Aadhaar seeding. Bank managers, Gram Rozgar Sahayaks (GRSs), computer
operators all confirmed that the seeding was done with fixed targets and that they were
pressurised if the targets weren’t met. The supposed rationale for shifting payments on
to APBS was to ensure that the money was transferred to the correct individual and the
delays in payments are reduced (see also Dhorajiwala and Wagner 2019; Dhorajiwala,
Drèze and Wagner 2019).

29
Figure 1.2(b) -
Ne-FMS Wage
Process Flow
As outlined, the NREGA wage payment process and other payment related measures
have gone through several changes over the years. Some of the steps taken have been
in the right direction. Corruption in bank payments reduced to some degree and the
scope of transparency and proactive disclosure increased through disbursal of wage
slips and reports on the MIS. The Global Findex Survey (World Bank 2017) estimates
that 80 percent of Indian adults now have a bank account. Personal bank accounts for
women and other vulnerable sections of society have led to an increase in their access
to financial institutions. The evolution in payment methods also simplified the payment
structure for the administration.
However, many of the changes brought about have also given rise to hardships and
confusion among workers. While an estimated 77 percent of women have bank accounts,
almost half of those are inactive (Kohli 2018). And delays in wage payments to workers
continues to haunt the programme. In the course of our work we have identified
multiple stages when delays occur (Narayanan, Dhorajiwala and Golani 2019). Under
the current system of payments, a successful payment could get delayed broadly at the
following three stages:
• Stage 1: At the state level, in getting the muster details uploaded and the Funds
Transfer Order (FTO) generated.
• Stage 2: At the central level, when the funds have to be released as per the FTOs and
transferred directly to the workers’ bank accounts.
• Stage 3: When there are delays while accessing wages earned after they are credited
in the respective accounts.
GP/block functionary generates e-pay order (FTO)
MNREGA Server
PFMS Server
PFMS fund release module MoRD release order
Accredited Bank Credits the Bank a/c of States in a State Sponsor Bank
Sponsor Bank debits the account to transfer the funds to workers by Sending file to NPCI
NPCI routes OR as per the directions of Dept. of Expenditure time to time the files to the Beneficiary bank for credit into workers account
MorD officials makes and sends release order to Accredited Banks
Beneficiary banks processes, credits and share the responses using NPCI route OR as per the directions of Dept. of Expenditure time to time to Sponsor bank along with IIN, a/c No and name of a/c holder
Sponsor Bank send response files to PFMS for all transactions (OFFUS/ONUS)
PFMS shares response files with NREGASoft
NIC-RD reflects the responses on NREGASoft
30
Stage 3 delays are not as easily quantifiable as stages 1 and 2. The third stage is more
precarious for workers than the first two because of its direct impact on workers.
Not only do the procedural delays hamper workers’ access to their wages but the
complexities involved often give rise to newer forms of hardships. Even if wages have
been deposited on time, workers may face problems while accessing them at the
disbursement agency. Some of the hardships experienced during the third stage delay
may include waiting in lines for several hours, losing wages due to high waiting time,
travelling in extreme weather conditions, having to give up spending time with children
or bearing opportunity cost while making multiple trips to the payment disbursal
agency. Over the years, delays in wage payments stood out as the most common
grievance for workers across many regions. Indeed Narayanan et al. (2017) demonstrate
that workers get discouraged to take up NREGA work due to delays in wage payments.
On a comparative note during our survey on last mile challenges, we have found a
positive deviation in AP. In AP, there were greater measures of transparency such as -
work done was updated in the workers’ job cards and wage slips were pasted on them.
We later found that such updates happened right before social audits are conducted. In
Butchayyapeta (our surveyed block) a social audit had concluded just before our survey.
Over the years, delays in wage payments stood out as the most common grievance for workers across many regions.
Length to the Last MileDelays in payment of wages have been the most central concern for NREGA workers.
As outlined in the previous section, from the workers’ perspective, the entire delay of
payment of wages can be split into three stages. To understand the delays in the first 2
stages, we conducted a detailed analysis of over 9 million NREGA wage transactions for
the Financial Year (FY) 2016-17 in 3446 randomly sampled panchayats across 10 states
(Narayanan, Dhorajiwala and Golani 2019). Stage 2 delays alone were more than 50 days.
We followed up with a similar analysis for the first two quarters of the FY 2017-18 and
found that only 32 percent of the payments were made on time (Narayanan, Dhorajiwala
and Golani 2018). However, Stage 3 delays can only be found through surveys as
information pertaining to delays in this stage is not captured in any existing data source.
2

31
For delays in stages 1 and 2, workers are entitled to a delay compensation -- a penalty --
payable by the central government in case the workers don’t receive their wages within
15 days of completion of work. As per the Act, the delay compensation (0.05 percent per
day of the wages earned) should be calculated based on delays in stage 1 plus delays in
stage 2. However, the MIS calculates only stage 1 delays and the delay compensation is
also calculated only corresponding to stage 1. When delay compensation is calculated
only for stage 1, we refer to it as partial delay compensation. The actual delay
compensation is the penalty amount for delays in stage 1 plus the penalty amount for
delays in stage 2. Consequently, when the states generate pay orders on time, and the
delay is solely due to the time taken by the Centre (stage 2) then no delay compensation
is being calculated in the MIS. In 47 per cent of the transactions analysed, only partial
delay compensation was calculated and no delay compensation was calculated for 32 per
cent of all the transactions analysed.
In response to a newspaper article (Narayanan, Dhorajiwala and Golani 2017) based on
the study of payment delays, the Department of Expenditure, Ministry of Finance, issued
a memorandum on August 21, 2017 titled ‘Note on Delay in Payments in MGNREGA.’
It was categorically stated in the memorandum that ‘the current rules do not compute
or compensate the delay in payments after the generation of FTOs [Fund Transfer
Orders]. It is true that between 10 and 15 lakh pay orders are issued on an average day
and delays are due to infrastructural bottlenecks, (un)availability of funds and a lack of
administrative compliance.’
Well Construction: An NREGA worksite in Jharkhand.

32
The matters concerning violations of NREGA, such as payment delays and under-
calculation of delay compensation thereof were heard by the Supreme Court of India
in the Swaraj Abhiyan vs Union of India in a writ petition (civil) number 857 of 2015.
The findings of that study highlighting the extent of underestimation of payout delays
were submitted to the Supreme Court (SC). The SC took cognizance of the findings,
and the final orders 4 dated May 18, 2018, state that ‘We also cannot countenance the
view advanced by the Central Government that it has no responsibility after the second
signature is placed on the FTO. The wages due to the worker in terms of Stage II above
must be transferred immediately and the payment made to the worker forthwith failing
which the prescribed compensation would have to be paid. The Central Government
cannot shy away from its responsibility or taking advantage of a person who has been
placed in the unfortunate situation of having to seek employment under the Act and
then not being paid wages for the unskilled manual labour within the statutorily
prescribed time. The State Governments and Union Territory Administrations may be at
fault, but that does not absolve the Central Government of its duty.’
Despite being reprimanded by the SC, the ministry has not reported the true extent of
delays and continues to renege its responsibility to compensate workers for the entire
duration of the delay. Table 2a shows the number of days taken to complete stage 1 and
stage 2 of the payment process in Jharkhand and Rajasthan from the earlier study.5 For
more details see Narayanan, Dhorajiwala and Golani (2019).
Delay (in days)
When FTO is delayed
When FTO generated within
15 days
Stage of payment
Stage 1
Stage 2
Stage 1
Stage 2
Jharkhand
46
13
--
--
Rajasthan
33
57
9
12
Table 2(a):
Stage 1
and Stage
2 Payment
Delays in
Jharkhand
and
Rajasthan

33
The issue of delays in wage payments cannot be seen only as a technical cash transfer
problem. One possible direct reason for inordinate delays in stage 2 is inadequate
funding for the programme. While the nominal budget for the programme has
increased, adjusting for inflation, the budget has actually decreased over the years. In
real terms, the budget allocation for 2019-20 is lower than that of 2010-11. Over the last
six years, on average, we have found that about 17 percent of each year’s allocation are
pending payments from previous years. This implies that funds dry up by the end of the
first half of each financial year, leading to high arrears carried forward to the next year.
Further, the inflation-adjusted budget allocation has been abysmally low leading to
the programme being implemented in half its capacity. Figure 2(b) shows the inflation-
adjusted budget over the years.
Narayanan and Pothula (2018) discuss other forms of funds truncation making NREGA a
supply driven programme thereby further exacerbating the delays in wage payments.
Figure 2(b):
Nominal
Revised
Allocation
vs. Inflated-
Adjusted
Allocation over
Financial Years
from 2010 to
2020
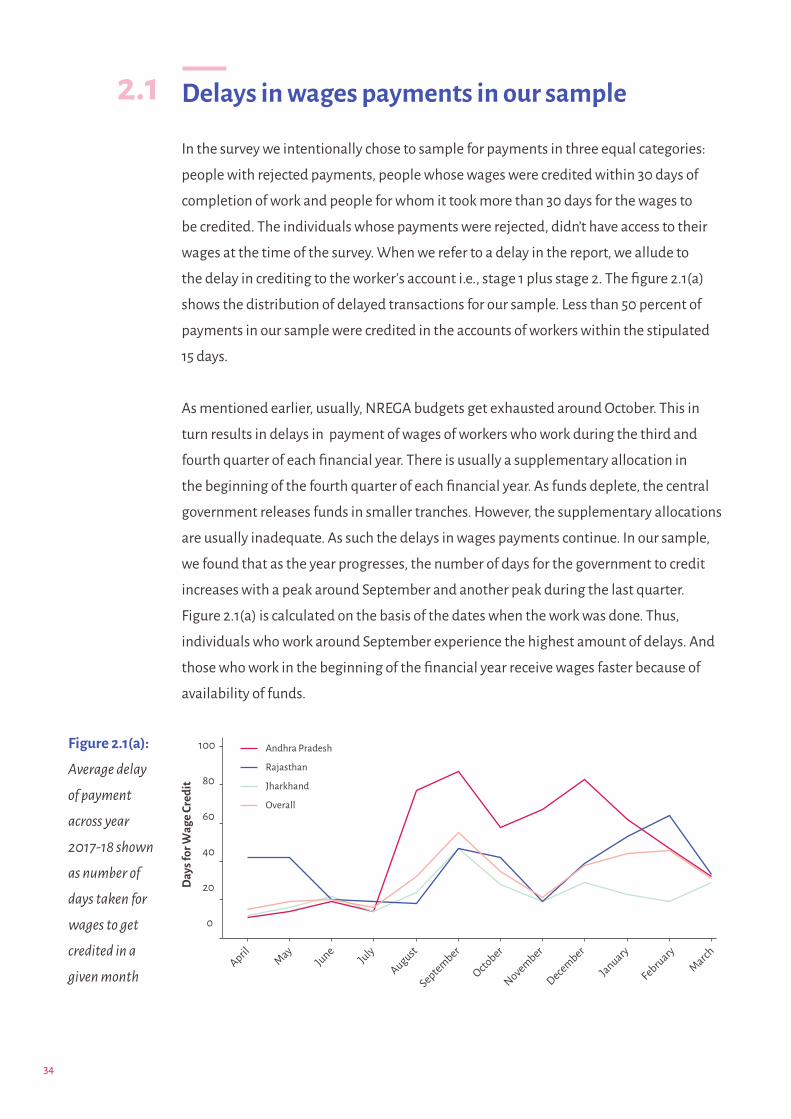
34
Delays in wages payments in our sample
In the survey we intentionally chose to sample for payments in three equal categories:
people with rejected payments, people whose wages were credited within 30 days of
completion of work and people for whom it took more than 30 days for the wages to
be credited. The individuals whose payments were rejected, didn’t have access to their
wages at the time of the survey. When we refer to a delay in the report, we allude to
the delay in crediting to the worker’s account i.e., stage 1 plus stage 2. The figure 2.1(a)
shows the distribution of delayed transactions for our sample. Less than 50 percent of
payments in our sample were credited in the accounts of workers within the stipulated
15 days.
As mentioned earlier, usually, NREGA budgets get exhausted around October. This in
turn results in delays in payment of wages of workers who work during the third and
fourth quarter of each financial year. There is usually a supplementary allocation in
the beginning of the fourth quarter of each financial year. As funds deplete, the central
government releases funds in smaller tranches. However, the supplementary allocations
are usually inadequate. As such the delays in wages payments continue. In our sample,
we found that as the year progresses, the number of days for the government to credit
increases with a peak around September and another peak during the last quarter.
Figure 2.1(a) is calculated on the basis of the dates when the work was done. Thus,
individuals who work around September experience the highest amount of delays. And
those who work in the beginning of the financial year receive wages faster because of
availability of funds.
2.1
Figure 2.1(a):
Average delay
of payment
across year
2017-18 shown
as number of
days taken for
wages to get
credited in a
given month
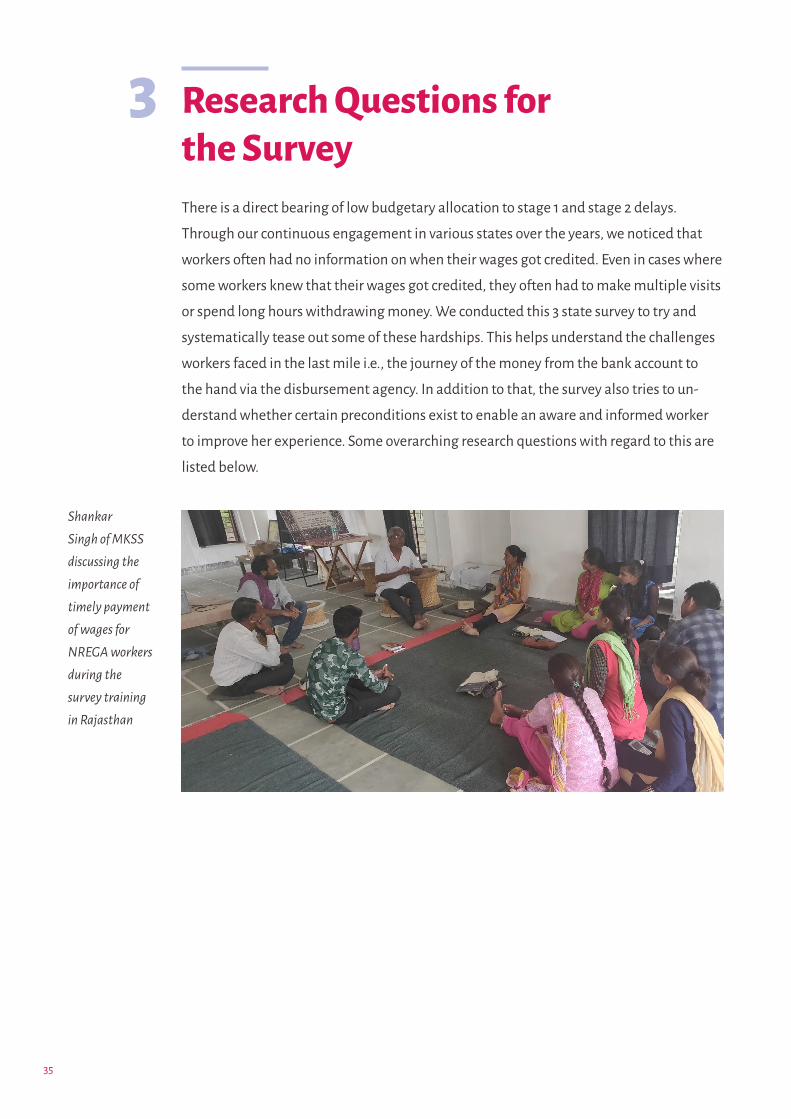
35
Research Questions for the SurveyThere is a direct bearing of low budgetary allocation to stage 1 and stage 2 delays.
Through our continuous engagement in various states over the years, we noticed that
workers often had no information on when their wages got credited. Even in cases where
some workers knew that their wages got credited, they often had to make multiple visits
or spend long hours withdrawing money. We conducted this 3 state survey to try and
systematically tease out some of these hardships. This helps understand the challenges
workers faced in the last mile i.e., the journey of the money from the bank account to
the hand via the disbursement agency. In addition to that, the survey also tries to un-
derstand whether certain preconditions exist to enable an aware and informed worker
to improve her experience. Some overarching research questions with regard to this are
listed below.
3
Shankar Singh of MKSS discussing the importance of timely payment of wages for NREGA workers during the survey training in Rajasthan

36
• What proportion of the payment transferred by the government actually reaches the
intended people?
• How long does it take for the money to reach the intended beneficiaries once it is
wire transferred by the government? In particular, we would like to quantify the
delays at each step of the payment process, and understand the process from the
perspective of the agents involved in it.
• What kinds of financial documentation do recipients have? Is it updated such that an
account holder could review her account at will?
• Are basic rights of account holders fulfilled in interactions with payment agencies?
• What kind of documentation do financial intermediaries maintain at the last mile?
What information is available in the public domain, and what challenges does it
create for transparency?
• Are there differences in performance between payment agencies. If yes, what factors
explain this difference, and what are some practices that could be adopted more
widely?
• Are there information security challenges in the transfer process that create
vulnerabilities to embezzlement?
MethodologyWe interviewed a total of 1947 NREGA workers in one block each of Andhra Pradesh
and Rajasthan and 2 blocks in Jharkhand. Along with the individual questionnaire for
workers, we conducted semi structured interviews with over 25 field functionaries.
The panchayat level field functionary responsible for the implementation of NREGA is
known as a Field Assistant (FA) in Andhra Pradesh and as a Gram Rozgar Sahayak (GRS)/
LDC in Rajasthan and Jharkhand. We spoke with some FAs, some GRSs and some LDCs.
In addition, we spoke with the programme officers and computer operators at the block,
and bank managers at local bank branches.
The worker questionnaire was structured to assess a few broad parameters; awareness
of basic banking rights, experience in withdrawing money from the various wage
disbursement agencies such as banks, banking correspondents and post office, and
access to grievance redressal procedures. Additionally, we conducted an audit of
payments (transaction verification) with the workers based on banking transactions that
4
37
we crawled from online reports. This included transactions of workers between 15 August
2017 to 14 August 2018 grouped by work name/scheme name to assess the following:
whether the worker has worked on that particular scheme, how many days of work she
has worked and how much money she has received. This also helped us understand the
difference between the official data and the ground reality.
The survey was conducted in Butchayyapeta block in Andhra Pradesh, Jawaja block in
Rajasthan and two blocks - Basia and Manika - in Jharkhand. All our discussions and
results are presented by referring to the state names instead of the names of blocks.
The blocks were chosen by convenience sampling based on the presence of credible
civil society organisations. Within each block, we randomly selected 14 panchayats
and within each panchayat we targeted to survey 42 randomly selected households.
Owing to fewer panchayats in each block in Jharkhand, we had to randomly sample
7 panchayats in each of the two blocks in Jharkhand. We also had some reserve
households to survey in each panchayat. As such, while we targeted to survey 1764
households, we ended up surveying 1947 households; 667 households in Andhra
Pradesh, 622 in Jharkhand and 658 in Rajasthan.
For each panchayat, 14 households were selected based on three categories: people with
rejected payments, people whose wages were credited within 30 days of completion
of work and people for whom it took more than 30 days for the wages to be credited. If
there were more than 14 people with rejected payments, then we randomly selected
14 such people and if there were fewer than 14 people with rejected payments then we
included all of them in our sample and the rest were selected equally from the other
two categories. There were no people with rejected payments in Andhra Pradesh so our
sample consisted of an equal number of people whose wages were credited within 30
days and those for whom it took longer than 30 days for the wages to be credited.
The rationale behind including all the rejected payments was because the challenges
faced by those with rejected payments are unique. Nationally, about one in 20
transactions get rejected. In the last five years, about Rs. 4,800 crore worth of payments
were rejected and about Rs. 1,274 crore worth is still pending to be paid to workers.
Rejections occur due to technical errors and the workers usually don’t know that their
payments were rejected. Very often, even the government field functionaries aren’t
aware of how to rectify rejected payments. Resolving rejections and obtaining wages
is extremely tedious for NREGA workers. On many occasions, people with rejected
payments drop out of the NREGA workforce altogether.

38
Since our objective was to assess the challenges faced by workers in the last mile, the
survey had to be conducted in the first half of the financial year when the funds crunch is
lower. The severity of issues faced by workers increases substantially in the second half of
each financial year. Conducting a last mile survey in the second half of the financial year
would paint a more severe picture. By doing the survey in the first half of the financial
year, what we present are realities when the programme implementation is purportedly
at its best. The survey was therefore conducted between September 2018 and
November 2018.
For missing and unclear values in the responses, we have used a novel imputation
strategy called Multiple Imputations Using Chained Equations (MICE). This imputation
strategy ensured that the data distribution of the imputed and the unimputed variables
are practically unaltered. Two to three variables had a high percentage of missing
values (~15-18 percent). To check the robustness of the calculated hardship scores
using imputed values, we removed the variables with highest missing values and
recalculated the hardship scores. The margin of error by removing the imputed values
was negligible. For sample size considerations, for the sake of clarity and consistency,
the reported statistics for the hardship variables are computed using imputed values.
Since imputation is involved for some variables, we clarify that what we report are
statistical estimates based on the survey and hence subject to some degree of variation.
In particular, this method predicts the most probable value for the missing variable
by learning from the features of the respondent and other respondents with similar
features. As such, the predicted estimates appear statistically reasonable owing to the
well tested robustness of the adopted methodology. The details of this approach and the
graphs showing the similarity in the distributions of imputed and unimputed data are
presented in the Appendix A.1.
Table 4(a) compares the some indicators from official data for the state and the chosen
blocks to broadly understand the representativeness of our survey sample.

39
Andhra Pradesh
SC Person Days (PD) as % total PD
ST PD as % total PD
Women PD as out of Total (%)
Average days of employment per HH
Average wage rate per day per person
Average cost per day per person (in Rs)
% payments generated within 3 days
Rajasthan
SC PD as % total PD
ST PD as % total PD
Women PD as out of Total (%)
Average days of employment per HH
Average wage rate per day per person
Average cost per day per person (in Rs)
% payments generated within 15 days
Jharkhand
SC PD as % total PD
ST PD as % total PD
Women PD as out of Total (%)
Average days of employment per HH
Average wage rate per day per person
Average cost per day per person (in Rs)
% payments generated within 15 days (stage 1)
Andhra Pradesh
21.98
10.47
53.75
146.77
95.82
Rajasthan
21.08
21.49
65.34
53.11
136.84
181.76
92.15
Jharkhand
11.05
28.68
37.33
41.03
167.98
256.07
95.12
Butchayyapeta
6.44
0.22
64.23
124.33
99.99
Jawaja
5.38
0.22
88.82
44.24
107.73
132.36
94.91
Basia block
4.51
58.64
41.55
33.48
167.85
209.24
96.89
Manika block
16.81
34.59
42.14
44.42
168.01
278.5
86.4
Table 4(a):
Comparison
between
state-level
and sample
proportion of
person days of
some NREGA
parameters for
various social
groups for FY
2017-18

40
Hardship Scores
Based on the experience of people with the wage disbursement agencies, we identified
some questions pertaining to reported and perceived hardships. Using these variables,
we created a hardship score for each respondent. The hardship scores are on a scale
between 0 and 1 where 0 means no hardship and 1 indicates hardship. Since each
question used to calculate this score was of a different variable type and had different
units of measurement, bringing them on a uniform scale was critical. Questions for this
included time taken to access money, cost incurred, difficulty in updating passbooks etc.
There are a total of 8 such questions pertaining to reported hardships for bank
payments. For each question we created a cut-off. For example, consider an individual
who is a bank user. If the person had to make multiple trips to the bank to access wages
for her last withdrawal then we assign a value of 1 indicating that she experienced
hardship on this question. Suppose further that this individual reported that she
experienced a hardship in 5 out of 8 questions then the reported hardship score for this
person is 5 divided by 8 or 0.625. We calculated such hardship scores for each respondent
for each disbursement agency. Collating these gives us the distribution of hardship
scores that can be spliced by disbursement agency and state.
This approach helped us compare the performance of states across different
disbursement agencies and also helped us compare the performance of different
disbursement agencies within each state. For example, we found that within Andhra
Pradesh, the reported hardships across respondents were lowest for postal payments.
Similarly, comparing the reported hardships for banks, we found that Andhra Pradesh
had the lowest average reported hardship, followed by Rajasthan. The highest average
reported hardship for bank payments was in Jharkhand. These were in synchrony with
our experiences of working in each of these states. We further divided the scores into
quartiles and came up with four categories of hardships - Low, Medium, High and Very
High. In general, the overall hardship levels in the surveyed block in Andhra Pradesh was
much lower compared to the surveyed blocks in Rajasthan and Jharkhand.
4.1

41
Three critical methodological questions with this approach need to be mentioned.
First, we lose some power by converting some questions such as time and cost into a
binary variable. To address this, we also report the distribution of time and cost in their
original measured units but a value on a 0-1 scale helps us in combining this with other
questions. The second concern would be that the cut-off for what constitutes a hardship
for some questions could be considered arbitrary. To this end, we performed robustness
checks by considering several cut-offs for hardship on a sliding scale. While the scores
themselves changed as a result, the pattern of reported hardships didn’t change. It is
reassuring that the measure of comparative hardship was invariant to the cut-off. Third,
simple average, rightly so, might not adequately capture all the dimensions of variation.
To this end, we created two other scores for hardships using two different techniques:
Confirmatory Factor Analysis (CFA) and Multiple Factor Analysis (MFA).
Factor scores using both these methods were calculated for each individual based
on the same set of questions. We ranked the individuals in ascending order of
their simple average hardship scores and also ranked them using the factor scores.
Suppose individuals with low simple average hardship scores also exhibit low factor
scores and individuals with high simple average hardship scores exhibit high factor
scores then the average hardship scores will have high correlation with factor scores.
The Rajasthan Survey team interviewing a NREGA worker about access to her wages.

42
In particular, we look at rank correlation of these scores which is a more stringent
measure of association. We statistically show that their rank correlations are very high
implying that using a simple average hardship score is as effective as using any of the
factor analysis techniques. The methodological details, robustness checks and the
corresponding results from the two different factor analysis techniques are presented in
the Appendices.
For the sake of clarity of presentation, we have used a simple average reported hardship
score in Section 6. That said, such reported hardship scores should not be considered
sacrosanct. They should, instead, be understood more as yardsticks and much like
indices such as the Gini coefficient, our score should be seen more as a measure of
comparison rather than something absolute.
Limitations of the SurveyFirst, the random sample of panchayats we surveyed are in one block in each state.
Owing to fewer panchayats per block in Jharkhand, we surveyed in two blocks
in Jharkhand. Therefore, it would not be prudent to draw conclusions about the
functioning of the programme in the entire state. However, we have been collectively
working on last mile challenges for nearly two decades so the findings and observations
from the surveyed block are similar to experiences of people across other blocks in the
respective states. Second, in this survey we do not accurately investigate infrastructural
issues such as problems due to network connectivity and electricity in accessing wages
through Customer Service Points (CSPs) and Banking Correspondents (BCs). These
are extremely important and have a direct bearing on the experiences of workers in
withdrawing wages. From our experience, biometric authentication failures, lack of
network connectivity and electricity have been huge bottlenecks. While we do try and
capture issues pertaining to biometric authentication failures, we have not captured the
other infrastructural issues. In a different ten survey on the workings of Common Service
Centres in Jharkhand (Sabhikhi, Lahoti and Narayanan 2019) that one of us was engaged
in, we highlighted the issues faced by people in accessing banking services due to lack of
internet and electricity.
Third, we attempted to tease out how NREGA workers interact with the grievance
redress mechanisms. What stood out, perhaps due to a routineness of hardships is the
general understanding of what constitutes a grievance. This is significantly different
5

43
from the perception of grievances expressed by the middle and affluent sections of the
society. Even when they experienced severe hardship, workers hesitated to categorise
it as a grievance (shikayat) fearing repercussions from the local officials. In few of the
villages we also noticed that middlemen had influence over the workers. In a couple of
cases after we began the interview, workers refused to continue the survey because they
were worried that they would lose work in the future if they spoke with us.
As with any quantitative survey there is the limitation of not being able to capture
some nuanced positive or negative experience. For instance, it was difficult to capture
some hardships since many of them seemed to have normalised these problems. It
was not unusual for people to wait long hours at the bank to withdraw their money
and repeated delays beyond 15 days for wage payments weren’t considered as reasons
to file grievances. This, even though not being paid within 15 days of completion of
work is a violation of the Act. In another case, in Barkadih panchayat in Manika block
in Jharkhand, the only bridge connecting the panchayat to the block was broken.
Consequently, people, including the surveyors had to carry their bikes and cross the river.
These issues present huge infrastructural bottlenecks for workers to go to the bank and
withdraw their wages. The survey fails to capture such core hurdles.
Surveyors
crossing
a river in
Jharkhand to
go to Barkadih
panchayat,
Manika block,
Jharkhand as
the bridge was
broken.
Despite the limitations outlined above, we hope that the survey results will throw light
on some of the experiences that people have at the last mile to access their money.
The last mile delivery is not considered when calculating the delays and evaluating the
effectiveness of any government programmes, particularly NREGA.
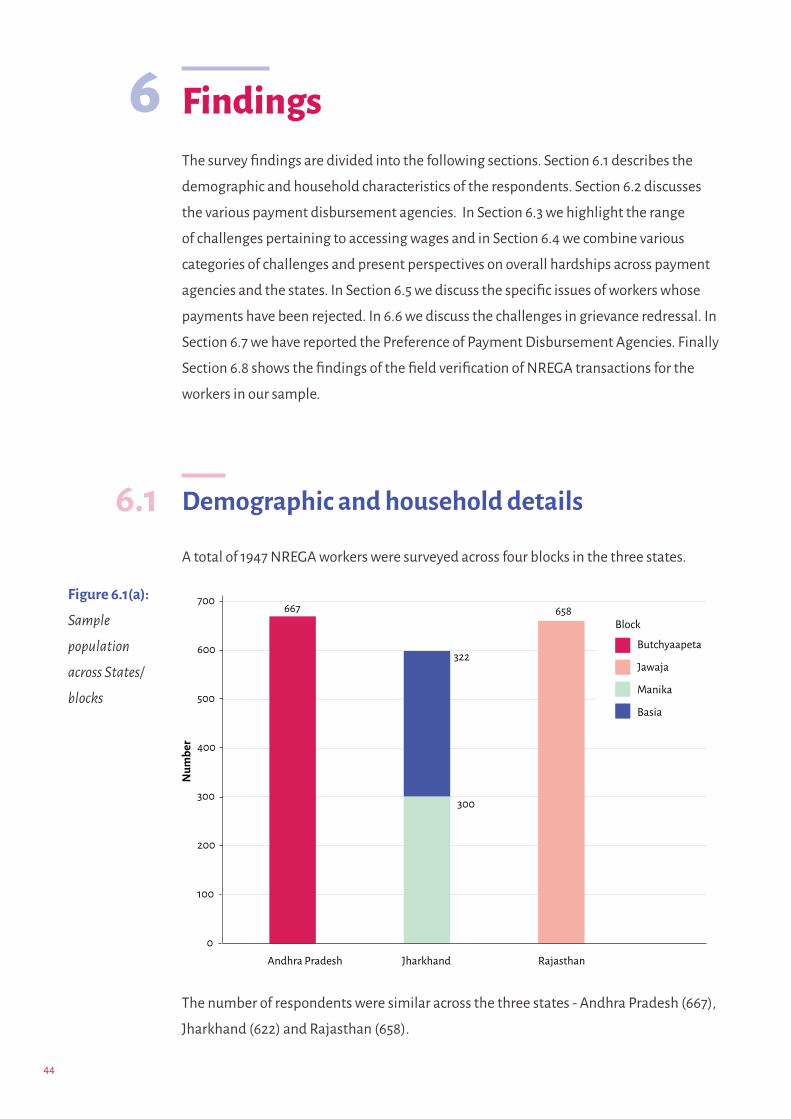
44
FindingsThe survey findings are divided into the following sections. Section 6.1 describes the
demographic and household characteristics of the respondents. Section 6.2 discusses
the various payment disbursement agencies. In Section 6.3 we highlight the range
of challenges pertaining to accessing wages and in Section 6.4 we combine various
categories of challenges and present perspectives on overall hardships across payment
agencies and the states. In Section 6.5 we discuss the specific issues of workers whose
payments have been rejected. In 6.6 we discuss the challenges in grievance redressal. In
Section 6.7 we have reported the Preference of Payment Disbursement Agencies. Finally
Section 6.8 shows the findings of the field verification of NREGA transactions for the
workers in our sample.
Demographic and household details
A total of 1947 NREGA workers were surveyed across four blocks in the three states.
6
6.1
The number of respondents were similar across the three states - Andhra Pradesh (667),
Jharkhand (622) and Rajasthan (658).
Figure 6.1(a):
Sample
population
across States/
blocks
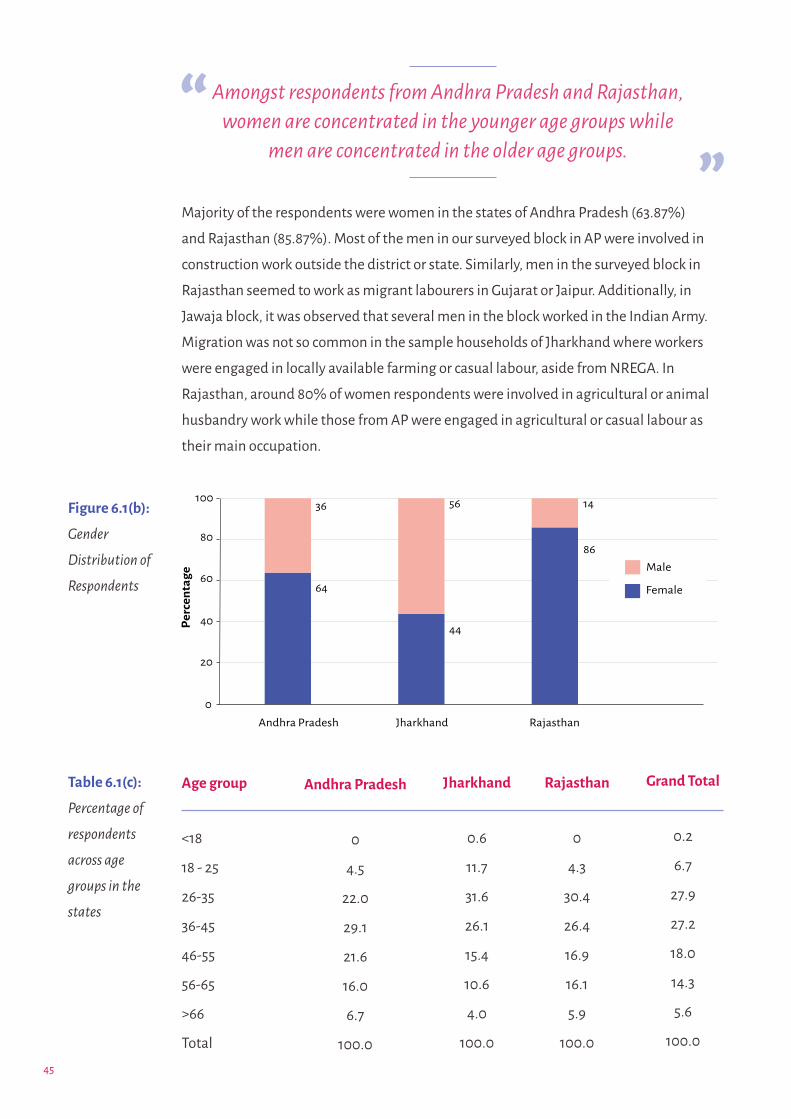
45
Majority of the respondents were women in the states of Andhra Pradesh (63.87%)
and Rajasthan (85.87%). Most of the men in our surveyed block in AP were involved in
construction work outside the district or state. Similarly, men in the surveyed block in
Rajasthan seemed to work as migrant labourers in Gujarat or Jaipur. Additionally, in
Jawaja block, it was observed that several men in the block worked in the Indian Army.
Migration was not so common in the sample households of Jharkhand where workers
were engaged in locally available farming or casual labour, aside from NREGA. In
Rajasthan, around 80% of women respondents were involved in agricultural or animal
husbandry work while those from AP were engaged in agricultural or casual labour as
their main occupation.
Figure 6.1(b):
Gender
Distribution of
Respondents
Age group
<18
18 - 25
26-35
36-45
46-55
56-65
>66
Total
Andhra Pradesh
0
4.5
22.0
29.1
21.6
16.0
6.7
100.0
Jharkhand
0.6
11.7
31.6
26.1
15.4
10.6
4.0
100.0
Rajasthan
0
4.3
30.4
26.4
16.9
16.1
5.9
100.0
Grand Total
0.2
6.7
27.9
27.2
18.0
14.3
5.6
100.0
Table 6.1(c):
Percentage of
respondents
across age
groups in the
states
Amongst respondents from Andhra Pradesh and Rajasthan, women are concentrated in the younger age groups while
men are concentrated in the older age groups.

46
There is also a notable difference in the participation of women and men across age
groups. Amongst respondents from AP and Rajasthan, women are concentrated in the
younger age groups while men are concentrated in the older age groups.
Caste
SC
ST
OBC
General
Others
Grand Total
Andhra Pradesh
9.4
0.0
51.1
38.8
0.6
100.0
Jharkhand
9.8
61.4
25.3
0
3.5
100.0
Rajasthan
6.5
1.4
91.0
0.5
0.6
100.0
Grand Total
8.7
20.3
57.0
13.6
0.4
100.0
Table 6.1(d):
Percentage of
respondents
across caste
groups in the
states
More than 90 percent of the respondents in the surveyed block in Rajasthan and
more than 50 percent of those surveyed in Andhra Pradesh belonged to the ‘Other
Backward Classes (OBC)’ . In Rajasthan, the Rawat caste group dominated those from
the OBC. Jharkhand’s respondents on the other hand, were largely Adivasis (ST). It is
also noteworthy that the respondents belonging to the ‘General’ category constituted
about 39 percent of our sample in AP while there were hardly any respondents from the
‘General’ category from Jharkhand and Rajasthan.
Religion
Hindu
Muslim
Christian
Sarna
Others
Grand Total
Andhra Pradesh
93.9
0.0
6.1
0.0
0.0
100.0
Jharkhand
59.3
4.5
14.4
21.8
0.0
100.0
Rajasthan
96.8
2.4
0.0
0.0
0.8
100.0
Grand Total
83.8
2.3
6.7
7.0
0.3
100.0
Table 6.1(e):
Distribution
of respondents
across religions
in the states

47
As Table 6.1(e) indicates, respondents of all the three regions were largely Hindus. A
notable proportion of Christian and Sarna population were observed in Jharkhand’s
blocks. A small proportion of Muslim respondents were found in blocks of Jharkhand
and Rajasthan. Jharkhand therefore had the most diverse respondents across religions
and caste groups. Details on education levels and main occupation of the sample
households are provided here in Tables 6.1(f) and 6.1(g).
As Table 6.1(f) on education levels indicate, roughly three-fourths of the surveyed
respondents in Andhra Pradesh lacked literacy. The surveyed block, Butchayyapeta,
has lower levels of literacy compared to other blocks in Andhra Pradesh. Similarly, a
significant proportion -- more than 60 percent -- of the respondents of Rajasthan lacked
basic literacy. Interestingly, close to one-fifth of all the NREGA workers interviewed
in Jharkhand had education levels beyond class 10 and about 3.5 percent of them had
studied beyond the twelfth grade. In comparison, the number of NREGA workers we
interviewed in Andhra Pradesh and Rajasthan who had studied beyond class 10 was
minuscule. This is interesting and perhaps reflects an overreliance on NREGA as an
employment opportunity for Jharkhand regardless of their education levels. It is not
common for people who have studied beyond class 12 to work on NREGA as a source of
employment.
Education levels
Illiterate
Literate (below primary)
class V
class VIII
class X
class XII
Above class XII
Grand Total
Andhra Pradesh
73.8
7.0
10.3
3.0
4.5
1.0
0.3
100.0
Jharkhand
40.1
14.9
11.5
15.5
9.5
5.0
3.5
100.0
Rajasthan
61.1
14.7
12.5
7.4
2.7
0.8
0.8
100.0
Grand Total
58.7
12.2
11.4
8.5
5.5
2.2
1.5
100.0
Table 6.1(f):
Level of
education
attained
amongst
respondents in
the states

48
Nature of Employment
Agriculture/Animal husbandry
Self-employment
Casual labour
Agriculture and casual labour
Regular employment (naukri)
Remittance, pension etc
Others
Grand Total
Andhra
Pradesh
18.9
3.7
25.2
51.1
0.0
1.0
0.0
100.0
Jharkhand
12.8
1.3
16.7
67.3
0.5
0.6
0.8
100.0
Rajasthan
8.4
1.1
7.0
81.0
0.3
1.1
1.2
100.0
Grand
Total
13.4
2.1
16.3
66.4
0.3
0.9
0.7
100.0
Table 6.1(g):
Main
occupation
of sample
households
across the
states
Respondents from each of the three states were largely agriculture or casual labourers,
or marginal farmers. This was also on expected lines as employment in casual labour is a
reasonable alternative for NREGA workers.
Disbursement Agencies
As outlined in Section 1.1 , the NREGA wages are electronically transferred to the
workers’ bank or postal accounts. In an attempt to facilitate financial inclusion and
improve last mile service delivery, additional disbursement agencies have been created.
In our survey, we interviewed workers across the following exhaustive disbursement
agencies.
6.2
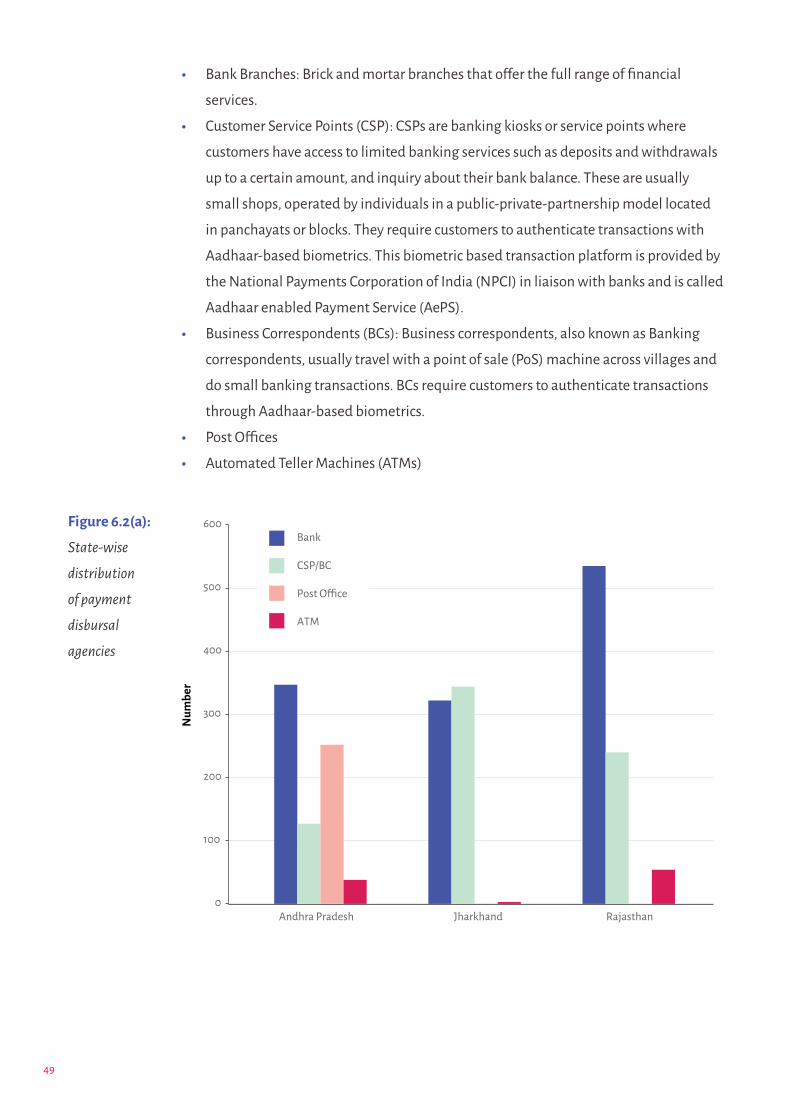
49
• Bank Branches: Brick and mortar branches that offer the full range of financial
services.
• Customer Service Points (CSP): CSPs are banking kiosks or service points where
customers have access to limited banking services such as deposits and withdrawals
up to a certain amount, and inquiry about their bank balance. These are usually
small shops, operated by individuals in a public-private-partnership model located
in panchayats or blocks. They require customers to authenticate transactions with
Aadhaar-based biometrics. This biometric based transaction platform is provided by
the National Payments Corporation of India (NPCI) in liaison with banks and is called
Aadhaar enabled Payment Service (AePS).
• Business Correspondents (BCs): Business correspondents, also known as Banking
correspondents, usually travel with a point of sale (PoS) machine across villages and
do small banking transactions. BCs require customers to authenticate transactions
through Aadhaar-based biometrics.
• Post Offices
• Automated Teller Machines (ATMs)
Figure 6.2(a):
State-wise
distribution
of payment
disbursal
agencies

50
Figure 6.2(a) shows the state-wise distribution of payment disbursement agencies.
Several respondents use more than one disbursement agency. However, all the
respondents have a primary agency that they access regularly for withdrawal of wages.
Figure 6.2(a) shows the cumulative number of workers using a particular payment
disbursement agency. For instance, if an individual primarily uses banks but also uses
CSP, it will reflect in the count of banks as well as CSP.
Banks are the main disbursement agency in each of the three states followed by CSP.
NREGA wages are disbursed through post offices only in Andhra Pradesh.
In Jharkhand, the usage of CSP and banks are comparable. Across the three states, the
usage of ATMs is not as widespread as other agencies. While 93 individuals reported that
they did indeed use the ATM, among them only 15 exclusively used the ATM to withdraw
their money.
Table 6.2(b) shows the distribution of disbursement agencies by the primary and
secondary choice of disbursement agency. And the shaded cells are the number of
respondents who use a single disbursement agency. That means, 889 people use only
banks, 319 use only the CSP and 15 individuals use the ATM exclusively and 252 use only
the post office.
The first column in Table 6.2(b) is the primary disbursement agency and the first row is
the secondary disbursement agency. Therefore, for 237 people, the bank is the primary
disbursement agency, but who also use the CSP sometimes. 56 people reported that
they use the bank as the primary disbursement agency but have also used the ATM
sometimes. Similarly, 157 respondents used CSP as their primary disbursement agency,
however they also went to the bank sometimes.
Primary Choice of Payment Disbursal Agency
Secondary Choice of Payment Disbursal Agency
Agency
Bank
CSP/BC
ATM
Post Office
Bank
889
157
22
0
CSP/BC
237
319
0
0
ATM
56
0
15
0
Post Office
0
0
0
252
Total
1182
476
37
252
1947Total
Table 6.2(b):
Distribution
of primary
disbursement
agencies
accessed by
respondents
across States*
* Regardless of the users’ primary disbursement agency, if they withdraw wages from any other disbursement agencies we have captured and reported their responses for both agencies.

51
Nationalised Bank
Co-operative Bank
Private Bank
Post Office
Regional Rural Bank
Missing Values
Overall
Andhra Pradesh
62
0.1
0.0
37.8
0.0
0.0
100.0
Jharkhand
71.7
2.9
0.3
0.0
24.3
0.8
100.0
Rajasthan
97.7
0.5
1.5
0.0
0.2
0.2
100.0
Grand Total
77.2
1.1
0.6
12.9
7.8
0.3
100.0
Table 6.2(c):
Percentage of
respondents
in each state
for each
disbursement
agency
Table 6.2(c) indicates that a significant majority of the respondents withdraw their
wages from a nationalised bank.
Dimensions of challenges assessed
A quarter of the questionnaire was focussed on understanding the experiences
of workers with banking systems concerning NREGA wages. The qualitative and
quantitative responses collected indicate the quality of services provided, and helped
us understand the consequences and hardships for workers when services fail. Digitised
banking systems introduced over the years were aimed at improving the efficiency of
public service delivery. While there are some positives like increased access, there are
shortfalls in the translation from intent to implementation. This section shows that
digital and banking services in and of themselves do not improve financial accessibility,
and, in fact, can hamper it in some cases. In the interaction between workers and
banking systems, the role of field functionaries was also explored. The dimensions of
challenges assessed are:
• Awareness and Access to Information
• Sources of Information Dissemination
• Time and Cost related factors
• Transparency & Accountability
• Commissions
• Aadhaar and biometric related challenges
6.3

52
Awareness and Access to informationA total of five questions were asked to respondents to capture the extent of awareness
regarding payment disbursement agencies: (1) Location of the bank branch (2) What is
the minimum balance to be maintained for the account to be operational (3) Is there a
minimum number of transactions to be done by the respondent in a given month (4) Is
the respondent entitled to use the bank account for purposes other than NREGA and
(5) Is the respondent allowed to withdraw wages from any other branch other than the
parent branch? The state-wise distribution of the responses to these five questions on
awareness is given in Figures 6.3.1(a).
From Figure 6.3.1(a), it appears that people were largely unaware about two aspects of
their banking rights - number of transactions that can be done per month and whether
other branches can be used to withdraw money from their bank accounts. On the other
hand, most people are aware of the bank branch location.
6.3.1
Figure
6.3.1(a):
Responses of
Awareness
on indicators
across states

53
The responses to awareness by states and gender are depicted in the figure below. It
appears from this figure that the awareness is independent of gender in each of the
three states.
Figure 6.3.1(c) shows the location of the payment disbursement agency. A majority
of the workers across the states have to travel to the block to collect their wages. In
Andhra Pradesh the disbursement agencies are equally spread between villages,
panchayats, and the block. As per the Committee on Comprehensive Financial Services
for Small Businesses and Low Income Households, “By January 1, 2016, the number and
distribution of electronic payment access points would be such that every single resident
would be within a fifteen minute walking distance from such a point anywhere in the
country” (Mor, Nachiket et al., 2013). However, we found that, barring a few exceptions,
the disbursement agencies were usually located at the block which are, on average, at
least an hour or more away from the villages.
By January 1, 2016, every resident of India would be within walking distance from a electronic payment access point.
Figure
6.3.1(b):
Awareness
across States
by Gender

54
Awareness and Hardships
Individuals facing hardships were categorised into low, medium, high and very
high based on their responses to certain questions. The hardships were then cross-
tabulated against the levels of awareness to see if having greater awareness results
in fewer hardships. We found no obvious relationship between awareness levels and
hardships. We clubbed the high and very high hardship categories and clubbed the low
and medium categories for this. If we just focus on the set of respondents with high
awareness scores (>=3 out of 5) and look at their hardships we found that in Andhra
Pradesh people with higher awareness face relatively less hardships. But in Jharkhand
and Rajasthan it is the contrary. The Figure 6.3.1(d) demonstrates this. One of the
possible reasons for this can be attributed to infrastructure limitations in Jharkhand and
Rajasthan, compared to Andhra Pradesh. Therefore, our findings in this context suggest
that higher awareness doesn’t automatically lead to better outcomes in terms of lower
hardships. An unexplored question is whether people with higher awareness of rights
and entitlements are also more aware of their perceptions of hardships.
25 percent of respondents reported that despite being informed about wage credit, wages were not yet credited.
Figure
6.3.1(c):
Location of
Disbursement
Agency

55
6.3.2 Information about wagesThe rise in technological advancements in public welfare delivery systems has increased
the importance of reliable and accessible information dissemination methods.
Method to find out about wage credit for bank users :
Figure 6.3.2 (a) shows the different ways in which workers find out if their wages
have been credited. For a majority of the workers, a visit to the disbursement agency
and information from the mate (a person from the village who acts as a link between
the field functionaries and the workers) were primary sources. There appeared to
be a contradiction regarding the source of information for wage credit between the
workers and field functionaries. The field functionaries said that most workers received
information about wages via SMS. We found in the survey that only about 11 percent of
bank users received wage credit information via SMS. For workers with multiple bank
accounts, we found a slightly greater dependency to visit the disbursement agency to
know which account the payment is credited to in comparison with individuals having a
single account.
Figure
6.3.1(d):
Hardship
among high
awareness
people
LibTech team
working with
workers and
civil society
groups on
identifying
payment
issues.

56
Reliable information is not enough:
Overall 25 percent of the respondents reported that despite being informed about wage
credit (through any means) they went to the bank and found out that their wages were
not yet credited. Therefore they would have to make multiple visits to the bank to access
their wages.
SMS for wage credits:
We tried to assess whether people who receive SMS are indeed able to access wages
quicker. Figure 6.3.2(b) indicates that about 20 percent of the total respondents received
an SMS when wages were credited to their account. Amongst these individuals, about 42
percent still had to make multiple visits to the disbursement agency (bank/CSP/BC/Post
Office) to access their wages. Moreover, the number of visits to the CSP/BC as observed in
the survey responses is an underestimate of the true number of visits. This is because the
survey considered repeated visits due to biometric issues alone. We did not capture the
number of visits required due to other key factors such as overcrowding, network issues,
and lack of electricity, recognized as other common reasons for rejection of withdrawal
at CSP/BC.
Figure
6.3.2(a):
Means of
finding out
about credit of
wages
Figure
6.3.2(b):
Wage
Information
via SMS and
number of
visits
0
250
500
750
SMS
Visit to the bank
Others

57
Figure 6.3.2(b) for each disbursement agency indicates a lack of association between
receiving information via SMS for wage credit and the number of visits made to the
bank. Nearly the same proportion of people had to make multiple visits whether or
not they received information via SMS. Indeed, for each disbursement agency, we
performed a chi-square test of independence and found that in each case, i.e., bank,
CSP and post office, the null hypothesis of independence couldn’t be rejected. In other
words, receiving SMSs doesn’t result in a reduction of the number of visits made to
the respective disbursement agency. This is possibly happening because the primary
modes of receiving information about wages being credited are through a visit to the
disbursement agency and/or by talking to a mate. Given the scarcity and unreliability
of the rural banking infrastructure, it is necessary to provide a reliable means of credit
information. It is critical to ensure that the disbursement infrastructure is able to cope
with the footfall.
Time and cost related challengesTime taken by Bank users:
There were a total of 1,204 bank users. The respondents were asked how much time it
takes for them to travel, wait at the disbursement agency, withdraw their payments and
return home. This is for a single visit to the bank. Many users had to make multiple visits
for a single withdrawal so these numbers are on the conservative side. An overwhelming
number of respondents from Andhra Pradesh took less than 1.5 hours. About 50 percent
of the respondents in Andhra Pradesh took one hour or more to access their wages from
their bank. About 50 percent of the respondents in Jharkhand and Rajasthan took more
than 3 hours to access their wages from the branch. For a significant 30 percent of the
respondents in Jharkhand, it took more than 5 hours while 30 percent of the respondents
in Rajasthan said that it took more than 4 hours to access wages from the banks. For
some people, it took more than 6 hours too. The panchayat sizes and the per capita bank
penetration in Andhra Pradesh is significantly better than Rajasthan and Jharkhand. The
average time taken by workers accessing various payment disbursement agencies across
the states are highlighted in the figure and the table below.
6.3.3
30% of the respondents in Jharkhand said it took more than 5 hours, and 30% in Rajasthan said it took more than
4 hours to access wages from the banks.

58
Time taken for withdrawals at different disbursement agencies:
The same question about total time taken to and from the disbursement agency
was asked to users of all four payment disbursement agencies. The time taken for
withdrawal at CSP/BC is better than that for banks. For 50 percent of CSP/BC users in
Andhra Pradesh, it took more than 1 hour to access wages. However, in Jharkhand and
Rajasthan, 50 percent of the CSP/BC users reported to have taken more than 2 hours to
access their wages. While for 30 percent of the respondents in Jharkhand and Rajasthan,
it took more than 3 hours to access their wages at the CSP/BC, the time taken by the
same proportion of people in Andhra Pradesh was still 1 hour. These are shown in Table
6.3.3(a)(ii).
Banks are usually located in the block and tend to be more crowded, hence it takes
longer for people to transact there. However, banks also offer important services like
updating of passbooks and hence are viewed to be more secure by users. Therefore, a
majority (~80 percent) bank users preferred to stick to banks for their payments and
about 35 to 40 percent CSP users in Jharkhand and Rajasthan also preferred banks
despite the longer hours spent transacting from banks. The reported numbers on time
taken appear to be lower than what the experience of having worked in these areas
indicate. For instance, in a 10 district survey of CSP of Jharkhand (Parthasarathy and
Narayanan 2019) conducted in 2018, it was found that, on average, it took about 5 hours
A bank branch with long queues of people waiting to transact.

59
for users to withdraw money from the CSP. Moreover, the aforementioned survey found
that respondents had to revisit about 3 times to withdraw their wages. The reasons for
revisits varied from lack of network connectivity, lack of electricity, overcrowding at CSPs
and biometric related failures.
Percentile
10
20
30
40
50
60
70
80
90
100
Overall
(n=1204)
60
60
95
120
120
180
210
250
360
720
Andhra Pradesh
(n=347)
30
30
60
60
60
90
120
120
180
300
Jharkhand
(n=322)
60
120
120
150
180
240
300
300
360
630
Rajasthan
(n=535)
60
120
120
150
180
186
240
300
404
720
Table 6.3.3(a)
(i): Percentiles
of Time taken
to-and-from
bank for
respondents
across the
states
Bank total time (in minutes)
Percentile
10
20
30
40
50
60
70
80
90
100
Overall
(n=713)
30
30
60
60
90
120
180
190
300
960
Andhra Pradesh
(n=127)
15
30
30
40
60
60
60
60
90
180
Jharkhand
(n=346)
30
60
60
90
120
152
180
240
300
960
Rajasthan
(n=240)
30
30
60
90
120
144
180
240
300
720
Table 6.3.3(a)
(ii): Percentiles
of Time taken
to-and-from
CSP/BC for
respondents
across the
states
CSP/BC total time (in minutes)

60
Multiple visits for withdrawals:
In many situations, workers often had to make multiple visits to the payment
disbursement agency to access their wages. Respondents from Andhra Pradesh
especially reported to have experienced this to a greater degree than the other two
states. As Table 6.3.3(c) shows, overall about 45 percent of the respondents had to make
multiple visits to the bank to withdraw their wages. While the time taken per visit to
the bank in Andhra Pradesh might be lower compared to the other two states, the fact
that more than 54 percent of them had to make multiple visits makes it difficult. In
Jharkhand and Rajasthan, roughly 40 percent of the respondents had to make multiple
visits. Since the time taken to access wages from banks in Jharkhand and Rajasthan are
quite high, multiple visits amplifies the hardship. For their last transaction, roughly 50
percent of post-office users had to make multiple visits.
Denial of withdrawal at banks:
Another reason for having to turn back from the bank without wages is that the bankers
often ask people to go to the CSP/BC to withdraw their wages because the bank is too
crowded or that they aren’t allowed to withdraw below a certain amount (Rs.5,000). This
was reported by about 18 percent of bank users. 7.4 percent of bank users also reported
that bank officials denied wages to them when it is crowded. Some respondents in
Jharkhand whose biometric authentication failed at the CSP, had to get a written
statement to this effect from the CSP owner. The users are then permitted to withdraw
from the bank upon showing the written statement to the bank officials.
Figure
6.3.3(b):
Disbursement
agency wise
average time
taken for
withdrawal

61
Coming back empty handed from CSP/ATM:
Questions to CSP/BC and ATM users were posed differently and so the figures may be
lower estimates for them. CSP users were asked if they had been denied wages due
to biometric authentication failures in the last five transactions. They may have been
asked to come back again for many other reasons such as no electricity or because the
CSP is too crowded. However, it gives us an estimate if the users had to make repeated
visits. 40 percent of the CSP users reported that they faced Aadhaar based biometric
authentication issues because of which they had to revisit the CSP/BC. This was,
surprisingly, highest in Andhra Pradesh where 72 percent of the users said that they had
to revisit more than once due to biometric issues. Roughly 35 percent of the respondents
in Jharkhand and about 30 percent of respondents in Rajasthan reported that they had
to make multiple visits to the CSP/BC owing to Aadhaar-based biometric authentication
failures.
Nearly half the ATM users reported that they had to visit the ATM again because the
machine did not dispense any cash. In the 10 district Common Service Centres survey in
Jharkhand, mentioned earlier, it was found that out of 401 respondents, 13 percent had
to revisit due to biometric issues. About 25 percent had to return owing to the CSC being
overcrowded and about 37 percent reported to have had to make multiple visits owing to
lack of network connectivity and electricity.
Percentage of respondents
who had to make multiple
visits for one withdrawal
Made multiple visits to bank for last transaction
Made multiple visits to CSP/BC due to biometric failure
Made multiple visits to ATM due to insufficient cash
Made multiple visits tothe post office for last transaction
Andhra
Pradesh
(in percent)
54.2
72.4
51.4
52.3
Jharkhand
(in percent)
38.8
35.3
100*
NA
Rajasthan
(in percent)
43.0
30
55.6
NA
Overall
(in percent)
45.1
40
55.3
52.3
Table 6.3.3(c):
Percentage of
respondents
who had to
make multiple
visits for one
withdrawal
* There were only 3 people who reported using the ATM in Jharkhand

62
Cost to visit the disbursement agency:
The respondents were asked how much it cost them to travel to and from the
disbursement agency for a single visit. Table 6.3.3 (d) shows the average cost reported
by users of different agencies. The numbers have been rounded to the nearest whole
number.Average Cost to and from
payment agency (in Rs.)
Bank
CSP
ATM
Post Office
Andhra
Pradesh
16
4
70
6
Jharkhand
53
22
22
Rajasthan
28
18
67
Overall
31
11
67
6
Table 6.3.3(d):
Average cost
to and from
payment
agency (in Rs.)
The average cost incurred to visit post offices to withdraw wages is the lowest among
all disbursement agencies but they are present only in Andhra Pradesh. 57.5 percent
of the post-office users incurred no cost to visit a post-office and even the average cost
for the rest of the respondents is only Rs. 6. From Table 6.3.3.(d), it seems that the cost
incurred to visit a CSP is lower than visiting banks for withdrawal. This suggests that
CSPs are a convenient alternative to banks in terms of both time and cost. In general,
for NREGA workers, a visit to the disbursement agency implies that they don’t get to
complete a day’s work that day. This, in turn, means that they don’t get their full daily
wages on the days that they visit the disbursement agency. Therefore, when a worker
has to make multiple visits to the disbursement agency to withdraw wages, the time and
cost incurred, in real terms, must account for that. For instance, the average travel cost
to go to a bank in Andhra Pradesh was Rs 16 per visit. If a worker has to make two trips,
then the cost incurred for one withdrawal for such a worker will be Rs 32. This is quite
significant in Jharkhand where for two trips a worker, on average, has to spend about Rs
100. Adding the lost daily minimum wages (at Rs 171) for the 2 visit days, this becomes Rs
342 and adding a modest amount of Rs 25 for food, this becomes Rs 392. So effectively, a
worker has to spend more than a third of her weekly NREGA wages just to withdraw her
weekly wages.
For NREGA workers, a visit to the disbursement agency implies that they don’t get to complete that day’s work, so
they don’t get their full daily wages on those days.

63
Figure 6.3.3(e) shows the ‘Actual time’ time taken. The product of the average time per
visit and the number of visits required for a worker to withdraw wages is what we call
‘Actual Time’. Similarly, the product of the average cost per visit and the number of visits
required for a worker to withdraw wages is called ‘Actual Cost’.
Similar to cost, there is a twofold increase in the amount of time taken to-and-from due
to repetition of visits made to the payment agency for the last transaction. The average
total time to-and-from post office is in fact more than doubled due to repetition of visits.
Amongst post office users, more than 50 percent of the workers had to make multiple
visits for their last withdrawal. The situation is similar for bank users where more than
40 percent of them had to make multiple visits for their last transaction. The increment
is similar for bank users. The average total time, along with the actual time which
accounts for multiple visits made, to-and-from the bank across the states is as shown in
the figure above. The average of actual time taken to withdraw from a bank for the last
transaction across the states is 6 hours. Even if we were to consider the amount of time it
takes for a single visit, the average time for bank visits across the states is equivalent to
almost half of a working day - 4 hours. This can also be interpreted as opportunity cost
worth half-a-day wages for the workers, who are commonly daily-wage earners.
Figure
6.3.3(e):
Actual time
taken on
average
to-and-from
Primary
Disbursement
Agency across
States

64
A total of 40% of the CSP/BC user respondents (286 respondents) claimed that they had
experienced biometric authentication failure at least once in their last five transactions.
The average number of hours spent by workers making more than one visit is shown
on the secondary axis to the left. This shows that for every worker who made multiple
visits to CSP/BC due to biometric authentication failure, they spent an additional 1.5 to 2
hours. The more the number of failures, the greater amount of time spent in travelling
back and forth for their wages.
TransparencyTransparency and accountability are fundamental prerequisites of a well functioning
democracy. This is especially critical when the rights of the marginalised are involved. In
the context of rural banking, there are several crucial factors characterising this. First, is
informed consent. The central government had made it peremptory for the workers to
link their Aadhaar with job cards and bank accounts. Risks associated with this weren’t
specified and so consent was more of a myth for the workers. Second, while the NREGA
workers contribute to production of information, they have no say in the methods of
information dissemination and information use. For example, the workers have no idea
why their payments get delayed and who is responsible when payments get delayed.
They are also unaware of their right to delay compensation when wages are not credited
to their account within 15 days of completion of work.
6.3.4
Figure
6.3.3(g):
No. of times
wages were
denied due
to biometric
authentication
failure and
average time
spent for each
transaction

65
57% of the respondents said that their passbooks don’t always get updated. In Rajasthan, 7 in 10 people said that
their passbooks are never updated on withdrawals. Around 37% of people across the three states reported that bank
officials refused to update their passbooks.
In terms of disbursement agencies, banks seem to have better accountability
frameworks compared to CSPs. Workers reposed more faith in banks compared to CSPs.
This, despite the fact that there are several conveniences of CSPs such as proximity to
the village.
Updation of passbooks in bank branches:
While nearly all respondents reported that they have passbooks, 57 percent of the
respondents reported that their passbooks do not always get updated. Details are in
Table 6.3.4 (a). This is largely from Jharkhand and Rajasthan. The scenario is most severe
in Rajasthan, where 7 in 10 people have reported that their passbooks never get updated
on withdrawals. Passbooks are key to increasing financial literacy. Survey responses
indicated that there were instances when banking officials themselves refused to update
passbooks. Roughly 37 percent of people across the three states reported that the update
of passbooks were denied by bank officials. Once again, responses from Jharkhand and
Rajasthan have higher rates of denial compared to Andhra Pradesh. Since passbooks are
the only way in which NREGA workers can keep track of their financial condition, it is
imperative that this is given importance and prioritised by banks.
Sign outside a bank in Andhra Pradesh: Internet is not working. account holders please cooperate. – Notice by BM

66
Passbook related issues
Passbook does not always get updated on withdrawal (in percent)
Bank officials refused to update passbook (in percent)
Andhra Pradesh
40.3
23.1
Jharkhand
54.3
43.2
Rajasthan
69.3
41.3
Overall
57.0
36.5
Table 6.3.4(a):
Passbook
related issues
across States
Reasons for denial of passbook update:
Figure 6.3.4(b) shows the reasons for denying update of passbooks of workers. As can be
seen, more than two-thirds of the time, banks being too crowded or officials asking the
workers to come back later were the primary reasons for denial of update of passbooks.
Around 14 percent of the time passbooks couldn’t be updated because either the
machine was defective or the printer was dysfunctional.
Over 80% of respondents in Jharkhand and Rajasthan never receive a receipt for bank transactions.
While 80% BC users in AP do not have passbooks, most of them get a receipt.
Figure
6.3.4(b):
Reasons for
refusing
passbook
update in
banks
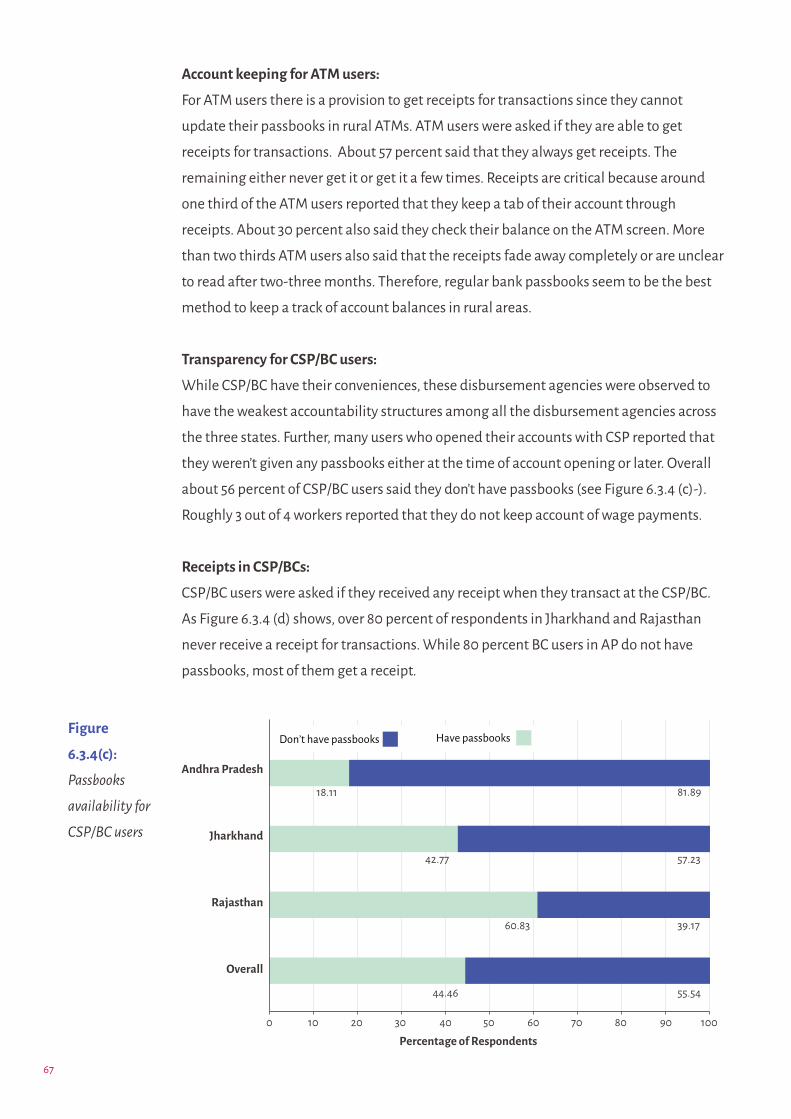
67
Account keeping for ATM users:
For ATM users there is a provision to get receipts for transactions since they cannot
update their passbooks in rural ATMs. ATM users were asked if they are able to get
receipts for transactions. About 57 percent said that they always get receipts. The
remaining either never get it or get it a few times. Receipts are critical because around
one third of the ATM users reported that they keep a tab of their account through
receipts. About 30 percent also said they check their balance on the ATM screen. More
than two thirds ATM users also said that the receipts fade away completely or are unclear
to read after two-three months. Therefore, regular bank passbooks seem to be the best
method to keep a track of account balances in rural areas.
Transparency for CSP/BC users:
While CSP/BC have their conveniences, these disbursement agencies were observed to
have the weakest accountability structures among all the disbursement agencies across
the three states. Further, many users who opened their accounts with CSP reported that
they weren’t given any passbooks either at the time of account opening or later. Overall
about 56 percent of CSP/BC users said they don’t have passbooks (see Figure 6.3.4 (c)-).
Roughly 3 out of 4 workers reported that they do not keep account of wage payments.
Receipts in CSP/BCs:
CSP/BC users were asked if they received any receipt when they transact at the CSP/BC.
As Figure 6.3.4 (d) shows, over 80 percent of respondents in Jharkhand and Rajasthan
never receive a receipt for transactions. While 80 percent BC users in AP do not have
passbooks, most of them get a receipt.
Figure
6.3.4(c):
Passbooks
availability for
CSP/BC users

68
The reasons for not getting receipts from CSP/BC varied from lack of network
connectivity, problems with the printer of the Point of Sale (PoS) machine, lack of
electricity or that the CSP was too crowded. 50 percent of the CSP users who did not
receive receipts (n=532) were usually not even given a reason. Moreover, roughly one in
four CSP users who got receipts reported that the print on the receipts don’t last beyond
2 months.
E-statements at CSPs:
According to the National Payments Corporation of India (NPCI) website,6 one of the
provisions of Aadhaar Enabled Payment Systems is for users to get a mini statement for
transactions of upto 6 months. However, 80 percent CSP users were unaware of these
provisions of such statements and hence had not asked for it. Only 20 percent users
across the three states (majority from AP) had ever received e-statements.
Transparency in postal payments:
Contrary to the experiences of bank and CSP/BC users, post-offices appeared to have
much better transparency systems. Nearly all postal users have passbooks and 100
percent of the post-office users reported that their passbook always gets updated on
withdrawals.
Figure
6.3.4(d):
Receipts on
withdrawals at
CSP/BC
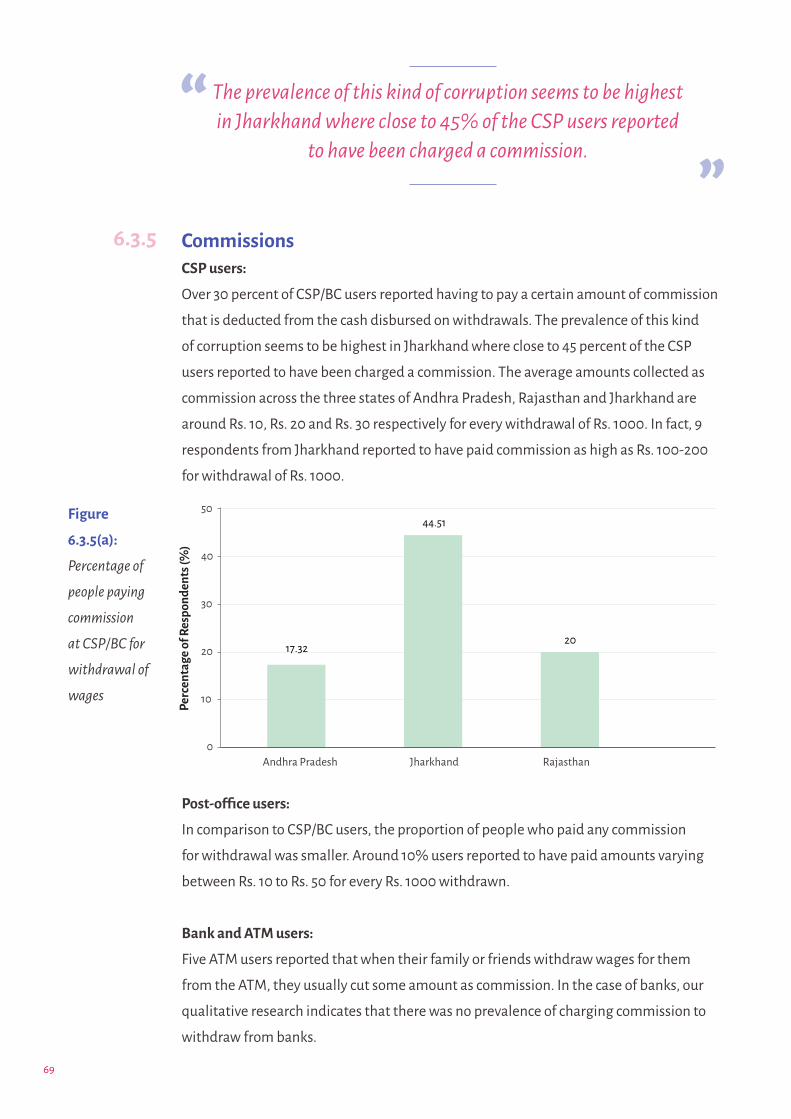
69
6.3.5 CommissionsCSP users:
Over 30 percent of CSP/BC users reported having to pay a certain amount of commission
that is deducted from the cash disbursed on withdrawals. The prevalence of this kind
of corruption seems to be highest in Jharkhand where close to 45 percent of the CSP
users reported to have been charged a commission. The average amounts collected as
commission across the three states of Andhra Pradesh, Rajasthan and Jharkhand are
around Rs. 10, Rs. 20 and Rs. 30 respectively for every withdrawal of Rs. 1000. In fact, 9
respondents from Jharkhand reported to have paid commission as high as Rs. 100-200
for withdrawal of Rs. 1000.
The prevalence of this kind of corruption seems to be highest in Jharkhand where close to 45% of the CSP users reported
to have been charged a commission.
Post-office users:
In comparison to CSP/BC users, the proportion of people who paid any commission
for withdrawal was smaller. Around 10% users reported to have paid amounts varying
between Rs. 10 to Rs. 50 for every Rs. 1000 withdrawn.
Bank and ATM users:
Five ATM users reported that when their family or friends withdraw wages for them
from the ATM, they usually cut some amount as commission. In the case of banks, our
qualitative research indicates that there was no prevalence of charging commission to
withdraw from banks.
Figure
6.3.5(a):
Percentage of
people paying
commission
at CSP/BC for
withdrawal of
wages
Perc
enta
ge of
Res
pond
ents
(%)

70
6.3.6 Aadhaar and Biometric related challengesIn the past few years, Aadhaar has increasingly been made mandatory for social welfare
programmes in India. While the process of shifting towards Aadhaar based payments
started in 2013, a major push came from the Government of India (GoI) from 2014-15.
This was a part of the government’s flagship JAM trinity. In NREGA, Aadhaar plays a role
at three levels:
1. Verification of Job Cards: Seeding the Aadhaar numbers of the workers with the
NREGA job card.
2. Directing Payment: Making the payment through the Aadhaar Payment Bridge
System (APBS), wherein the Aadhaar is the financial address of the individual.
3. Withdrawing Money: Withdrawing money from Customer Service Points (CSPs)/
(BCs) through Aadhaar based biometric authentication. This requires the individual
to seed their bank account with their Aadhaar number. This is known as Aadhaar
enabled Payment System (AePS).
For more details on the uses and processes related to Aadhaar payments in welfare, the
reader is referred to Dhorajiwala and Niklas (2019).
Here, we examined the experiences of NREGA workers from three aspects:
• Biometric related challenges
• Issues with linking Aadhaar to job cards and bank accounts
• Perception of workers about wage payments after introduction of Aadhaar.
Figure 6.3.6(a) depicts the proportion of people who have reported at least one Aadhaar-
related biometric failure while withdrawing money in the last 5 transactions from CSP/
BCs. Although the maximum biometric failures seemed to have occurred in Andhra
Pradesh (~75 percent), many of the responses were missing and those values were
imputed. It is the least in Rajasthan. Overall, about 42 percent of the people surveyed
reported that they faced at least one biometric failure in the last 5 transactions.
Nearly 30% of the respondents reported at least 3 failures in the last 5 transactions, and 7% reported that all of the
last 5 transactions failed due to biometric issues.
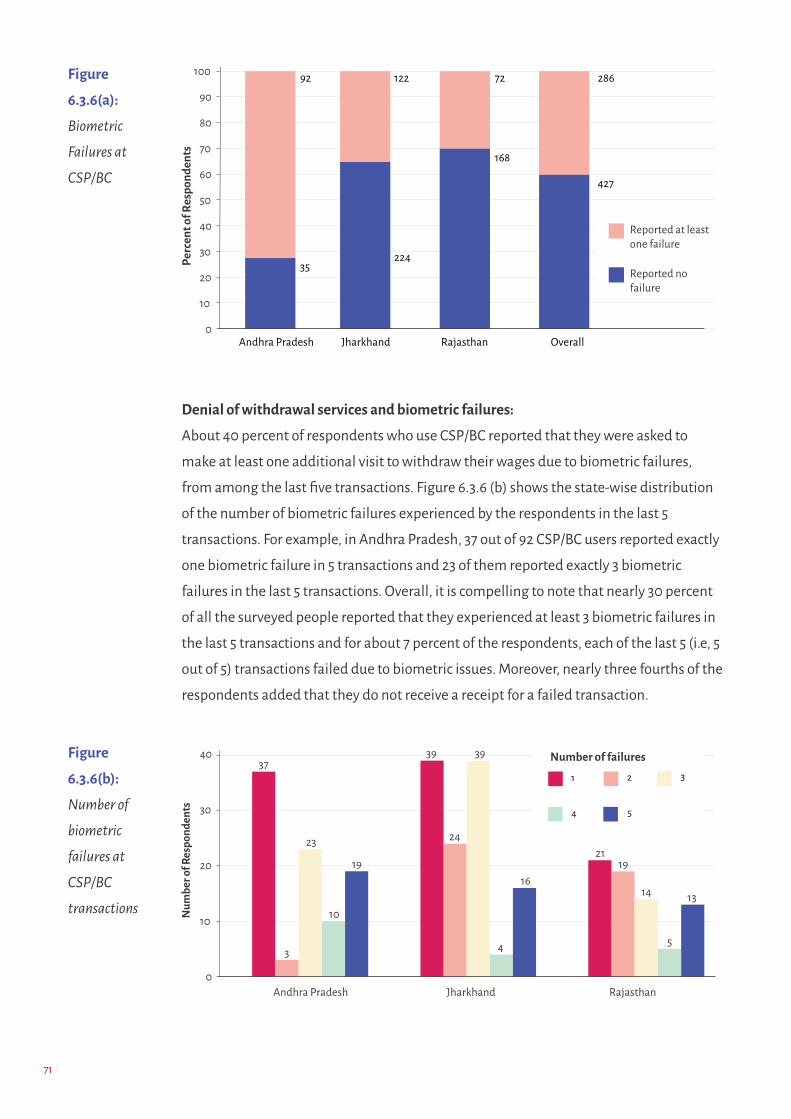
71
Denial of withdrawal services and biometric failures:
About 40 percent of respondents who use CSP/BC reported that they were asked to
make at least one additional visit to withdraw their wages due to biometric failures,
from among the last five transactions. Figure 6.3.6 (b) shows the state-wise distribution
of the number of biometric failures experienced by the respondents in the last 5
transactions. For example, in Andhra Pradesh, 37 out of 92 CSP/BC users reported exactly
one biometric failure in 5 transactions and 23 of them reported exactly 3 biometric
failures in the last 5 transactions. Overall, it is compelling to note that nearly 30 percent
of all the surveyed people reported that they experienced at least 3 biometric failures in
the last 5 transactions and for about 7 percent of the respondents, each of the last 5 (i.e, 5
out of 5) transactions failed due to biometric issues. Moreover, nearly three fourths of the
respondents added that they do not receive a receipt for a failed transaction.
Figure
6.3.6(a):
Biometric
Failures at
CSP/BC
Figure
6.3.6(b):
Number of
biometric
failures at
CSP/BC
transactions Num
ber o
f Res
pond
ents

72
Percent of people who
made multiple visits to link
Aadhaar with bank account
(Bank/CSP/BC users) and
postal account (PO users)
Percentage of users
Andhra
Pradesh
(n=594)
40.07
Jharkhand
(n=619)
23.26
Rajasthan
(n=640)
15.78
Overall
(n=1853)
26.07
Table 6.3.6(c):
Percent of
people who
made multiple
visits to link
Aadhaar to
bank or postal
account
These are telling numbers. As mentioned before each failure implies a revisit to the CSP/
BC which involves time and cost and also in many cases an opportunity cost of having
lost that day’s wages.
In contrast to the CSP/BC users, post office users reported far fewer instances of
biometric failures. About 15 percent of postal users reported at least one biometric
failure in the last five transactions. However, three fourths of postal users also reported
that they do not receive a receipt for the failed transaction.
Linking of Documents with Aadhaar: Workers were asked whether they had to make
multiple visits to link their job cards and bank accounts with Aadhaar. The Table 6.3.6(c)
shows that around one in four people had to make multiple visits to link their Aadhaar
number to job cards and bank accounts. This is for 1853 respondents who answered
this question.
We also asked the bank & CSP/BC users if they thought that the process of linking their
Aadhaar to their bank accounts was cumbersome. Table 6.3.6(d) shows that a sizable
majority of the respondents in Andhra Pradesh perceived no difficulty in linking their
Aadhaar to their bank accounts. However about 20-30 percent users in Jharkhand and
Rajasthan thought the process of linking was difficult. This question was not posed to
postal and ATM users.

73
Difficulty while linking Aadhaar
with NREGA bank account
Perceived NO difficulty(in percent)
Perceived difficulty(in percent)
Andhra
Pradesh
93.7
94.5
7.3
5.5
Jharkhand
81.4
80.3
18.6
19.7
Rajasthan
68
82.5
32
17.5
Payment
Disbursal
Agency
Bank
CSP/BC
Bank
CSP/BC
Table
6.3.6(d):
Experience
of perceived
difficulty in
submitting
documents to
link Aadhaar
with NREGA
bank account
Figure 6.3.6:
Percent of
respondents
who believed
Aadhar
provided
quicker access
to wages
(e): Across
payment
agencies;
(f): Across
States
The levels of difficulty for Bank and CSP/BC users reported in Jharkhand is about 2.5
times, and in Rajasthan about 4.5 times of what was observed in Andhra Pradesh. This
can be attributed to the difference in method and timeline of linking Aadhaar with
NREGA bank accounts in the 3 states. In Andhra Pradesh, Aadhaar linking happened
through dedicated campaigns that began at least three years before it happened in
Jharkhand and Rajasthan7. However, in case of Andhra Pradesh, the perception of the
repeated visits made for linking Aadhaar is not congruous to the reported difficulty.
Perc
enta
ge of
Res
pond
ents
(%)

74
One of the claims made by proponents of Aadhaar is that it will make welfare delivery
(including cash transfers)more efficient. From the survey, no causal claims can be made
on whether the introduction of Aadhaar has quickened access to wages. But we tried to
understand people’s perception about Aadhaar. In the block of Andhra Pradesh, there is
a perception among the majority of the respondents that they have started getting their
wages sooner after linking with Aadhaar. Across the states, Aadhaar implementation
was made peremptory to access wages. In other words, workers were not given a choice
about how to access their work and the dominant narrative was that “without Aadhaar
it is impossible to get work and subsequently wages”. The perceived benefits of Aadhaar
in this context was most observed in Andhra Pradesh, where 81.31 percent of total
respondents perceived to have quicker access to wages after linking NREGA wages
account with Aadhaar. In the similar context, a little over half of all the bank users and
about 57 percent of CSP/BC users perceived that their wages came quicker after linking
with Aadhaar. Overall, in Jharkhand and Rajasthan, about 63 percent and 41 percent
of the respondents respectively did not claim that Aadhaar provided quicker delivery
of wages. The inconsistency between the perception of wages coming quicker after
Aadhaar seeding and the reality of it is evident. In Andhra Pradesh, biometric systems
were introduced prior to the Aadhaar biometric project so respondents were unable
to distinguish between the earlier biometric system and the Aadhaar based biometric
authentication system. This might have led to some confounding effect of perception
versus reality. Second, there was a strong messaging by officials that wage credit would
become quicker after Aadhaar seeding. How much of the perception is clouded by the
messaging also remains unclear.
There is significant room for improvement in digitisation of services, in improving
people’s perceptions of services, while accounting for regional contexts of hardships.
In Andhra Pradesh, a dedicated third-party agency called AP Online used to address all
Aadhaar related problems during the linking period exclusively for postal payments. In
Jharkhand and Rajasthan, on the other hand, there was no dedicated personnel/agency
for Aadhaar-related resolutions. An MIS manager would help out with such issues,
along with other responsibilities they may have. Hence, while the hardships caused by
systemic changes may be common across states, the difference seems to lie in the focus
of resolutions adopted to address them.
75
6.4 Hardships
As discussed in the methodology section, for each respondent, based on some questions,
we have created a ‘hardship score.’ In this section, we discuss some findings based
on the calculated hardship scores. To reiterate, these scores shouldn’t be used as an
absolute measure of hardship but instead as a measure of comparative hardship across
states. Importantly, we would like to emphasise that this is neither meant to trivialise
the hardships faced by rural workers nor meant to only present realities in a bad light.
It is meant to signal the difficulties faced by a large section of the workers and think of
constructive steps to minimise that.
In addition to the time and cost they incur to make single or multiple visits, NREGA
workers often face humiliation by bank officials, travel in crowded buses in extreme
weather conditions and more importantly, forgo the daily wage they could have
otherwise earned during that visit period. In the last decade or so there has certainly
been a deeper penetration of roadways, mobile phones, banking services and to a
limited extent electricity and internet. However, increased access to rights, increased
accountability of officials have not happened at the same pace of such notions of
progress. Moreover, the assumption that more technology will necessarily lead to better
functioning of the programme has repeatedly stood out as a false assumption. On the
contrary, on many occasions, it has been used as a smokescreen to dilute workers’ rights
and government accountability.
One of the reasons to quantify some of the indicators on experiences of hardships is to
draw meaningful insights that can feed in for alteration towards better policy.
In this Section we discuss some aspects of hardships faced by the NREGA workers that
we surveyed. While some questions collected general information about banking rights,
there were questions that attempted to capture the actual reported hardships and other
questions tried to capture the perceptions of hardships. The choice of separating the
hardships into the categories of ‘reported’ and ‘perceived’ is intentional. For example,
if a worker has to make multiple trips to a bank to withdraw wages then that would
constitute a reported hardship. Whereas, if a worker feels that accessing wages has
become harder since the introduction of Aadhaar, then that would be a perception.
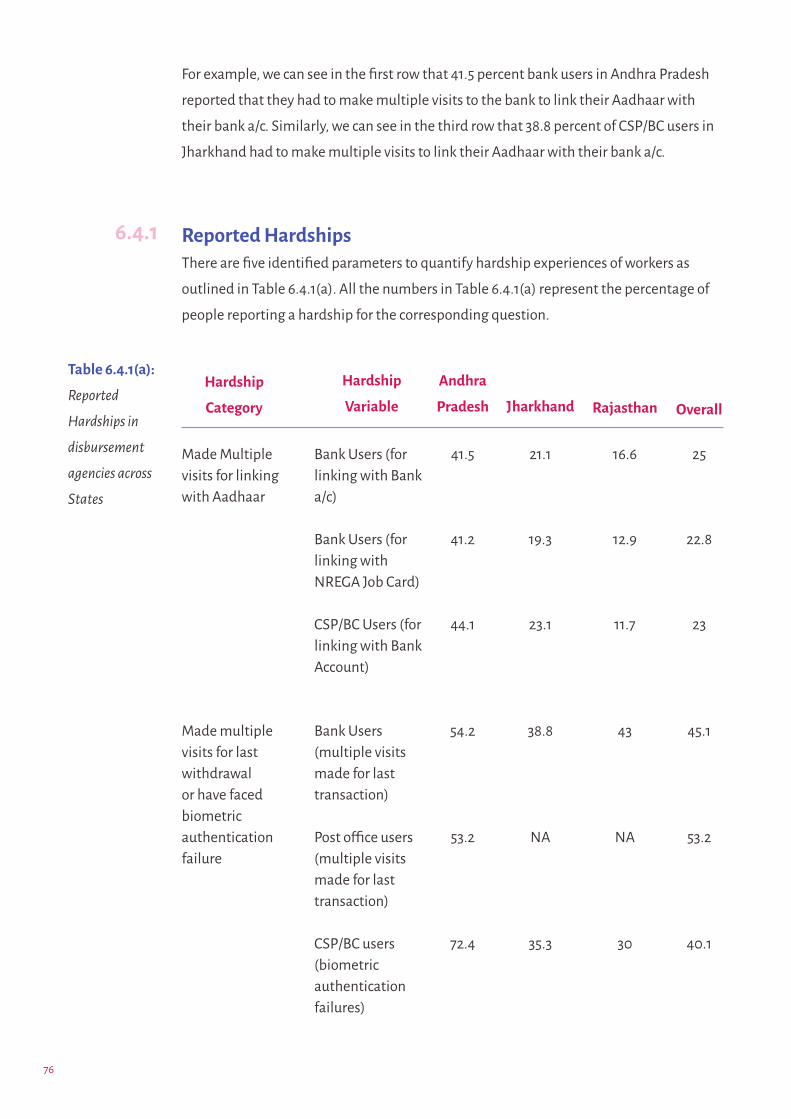
76
6.4.1
Table 6.4.1(a):
Reported
Hardships in
disbursement
agencies across
States
Made Multiple visits for linking with Aadhaar
Made multiple visits for last withdrawal or have faced biometric authentication failure
Hardship
Category
Bank Users (for linking with Bank a/c)
Bank Users (for linking with NREGA Job Card)
CSP/BC Users (for linking with Bank Account)
Bank Users (multiple visits made for last transaction)
Post office users (multiple visits made for last transaction)
CSP/BC users (biometric authentication failures)
41.5
41.2
44.1
54.2
53.2
72.4
Andhra
Pradesh Jharkhand
21.1
19.3
23.1
38.8
NA
35.3
Rajasthan
16.6
12.9
11.7
43
NA
30
Overall
25
22.8
23
45.1
53.2
40.1
For example, we can see in the first row that 41.5 percent bank users in Andhra Pradesh
reported that they had to make multiple visits to the bank to link their Aadhaar with
their bank a/c. Similarly, we can see in the third row that 38.8 percent of CSP/BC users in
Jharkhand had to make multiple visits to link their Aadhaar with their bank a/c.
Reported HardshipsThere are five identified parameters to quantify hardship experiences of workers as
outlined in Table 6.4.1(a). All the numbers in Table 6.4.1(a) represent the percentage of
people reporting a hardship for the corresponding question.
Hardship
Variable

77
Time to visit payment agency
Cost incurred to visit payment agency
Accountability and Transparency
Bank users (1 hour or more on an average)
Bank users (maximum time of 2 hours or more)
CSP/BC users (half an hour or more on an average)
Post Office users (1 hour or more on an average)
Bank users (greater than Rs.20)
CSP/BC users (greater than Rs.0)
Passbook does not always get updated on withdrawal at Bank
Passbook does not always get updated on withdrawal at Post Office
Bank official refused to update passbook
44.1
25.4
61.42
32.5
19.6
22.8
40.3
0
23.1
Andhra
Pradesh Jharkhand
89.4
73.3
86.7
NA
67.4
60.7
54.3
NA
43.2
Rajasthan
86.9
59.8
78.8
NA
35.1
62.5
69.3
NA
41.3
Overall
75.2
53.5
79.5
32.5
39.3
54.6
57
0
36.5
Hardship
Category
Hardship
Variable
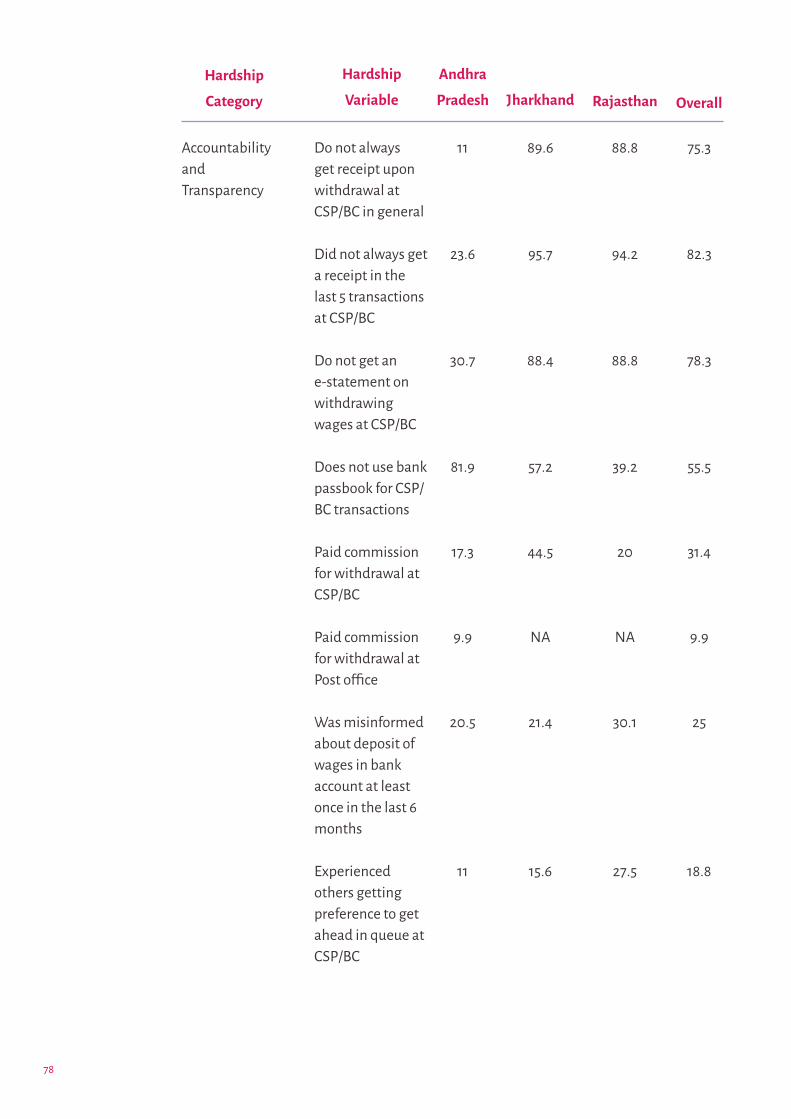
78
Accountability and Transparency
Do not always get receipt upon withdrawal at CSP/BC in general
Did not always get a receipt in the last 5 transactions at CSP/BC
Do not get an e-statement on withdrawing wages at CSP/BC
Does not use bank passbook for CSP/BC transactions
Paid commission for withdrawal at CSP/BC
Paid commission for withdrawal at Post office
Was misinformed about deposit of wages in bank account at least once in the last 6 months
Experienced others getting preference to get ahead in queue at CSP/BC
11
23.6
30.7
81.9
17.3
9.9
20.5
11
Andhra
Pradesh Jharkhand
89.6
95.7
88.4
57.2
44.5
NA
21.4
15.6
Rajasthan
88.8
94.2
88.8
39.2
20
NA
30.1
27.5
Overall
75.3
82.3
78.3
55.5
31.4
9.9
25
18.8
Hardship
Category
Hardship
Variable

79
Figure 6.4.1(b), known as a box plot, shows the distribution of reported hardships for
bank users across states on a 0-1 scale. As discussed in the Methodology section, the
maximum value of reported hardship is 1 implying that such a person has experienced
difficulty in every parameter depicted in Table 6.4.1(a) and the minimum value of
reported hardship is 0 implying that such a person has experienced no difficulty in any
parameter.
The red shaded part of the boxes in Figure 6.4.1(b) contains all the respondents whose
hardship score is between the 25th percentile and the 75th percentile. The horizontal
line inside each boxplot, shows the median hardship score for respondents of that
state. For instance, the median reported hardship for bank users of Andhra Pradesh is
0.33 while the median reported hardship for all the bank respondents of Jharkhand is
0.48 and that of Rajasthan is 0.44. The red shaded part of the boxplot for Jharkhand
is much broader and positioned higher compared to Andhra Pradesh and Rajasthan.
This indicates a wide variation among those in Jharkhand who faced high to very high
hardship compared to their counterparts in Andhra Pradesh and Rajasthan. In other
words, 50 percent of people in Andhra had a hardship score of more than 0.33 while 50
percent of those in Jharkhand had a hardship score of more than 0.48. But, compared to
Andhra Pradesh, there are many more in Jharkhand who experienced high to very high
hardship.
Figure
6.4.1(b):
Reported
Hardships for
Bank Users
Across States

80
State
Andhra Pradesh
Jharkhand
Rajasthan
Hardship Score for Banks
0.34
0.48
0.44
Table 6.4.1(c):
Average
Hardship Score
for Bank Users
The blue dots at the top of Andhra Pradesh and Rajasthan denote those people who
have had extremely high hardships and they represent outliers or anomalies compared
to the rest. For example, one such blue dot at the top of the box plot for respondents of
Rajasthan has a reported hardship of 1. This means that this person has experienced
difficulty in every parameter presented in Table 6.4.1(a).
Table 6.4.1(c) gives the average reported hardship score of bank users for each state.
Since the questions are the same across the three states, on a comparative scale, we can
say that the respondents of Andhra Pradesh faced least hardship in accessing wages
from banks, followed by Rajasthan. Respondents of Jharkhand, on average, reported the
highest hardships among these three states.
Figure
6.4.1(d):
Hardship
Scores for CSP/
BC users

81
The interpretation of box plots are the same as in the case for banks. However, from
Figure 6.4.1(d) it can be gleaned that the CSP/BC users of Andhra Pradesh face much
less hardship compared to their counterparts in Jharkhand and Rajasthan. Although in
absolute terms, the reported hardships are higher among CSP/BC users compared to
banks, the two disbursement agencies are not comparable based on these scores since
the questions used to calculate this are not the same.
The median hardship score for CSP/BC users in Andhra Pradesh is 0.4 while it is 0.6
for both Jharkhand and Rajasthan. Figure 6.4.1(e) also represents the distribution of
hardship scores across states for CSP/BC users.
It’s very clear from Figure 6.4.1(e) that the majority of the respondents from Andhra
Pradesh have lower reported hardships compared to their counterparts in Jharkhand
and Rajasthan. For example, the number of respondents to the right of a hardship score
of 0.50 is much more in Jharkhand and Rajasthan compared to Andhra Pradesh. Indeed,
this is also reflected in the average reported hardship for CSP/BC users for each state as
shown in Table 6.4.1.(f).
Figure
6.4.1(e)
Distribution
of Hardship
Scores for CSP/
BC users

82
State
Andhra Pradesh
Jharkhand
Rajasthan
Average Reported Hardship (CSP/BC)
0.38
0.60
0.54
Table 6.4.1(f):
Hardship scores
comparison for
CSP/BC users
We looked at the overall hardship scores based on the primary disbursement agency
of the respondent. For example, when a person uses both the bank & the CSP/BC but
the bank is her primary disbursement agency, we considered the hardship score from
the questions from the banking section. As such it can be seen that 6 in 10 people in
Jharkhand and Rajasthan blocks have experienced “High or Very High” hardship. And
a mere 5 in 100 people have “Low” hardship in Jharkhand. On the other hand, users in
Andhra Pradesh block had relatively better proportions of people distributed across the
degrees of hardship. 36 percent people experienced “High or Very High”, while 25 percent
people experienced “Low” hardship and about 40 percent respondents experienced
“Medium” hardship.
Since postal payments are prevalent only in Andhra Pradesh, we cannot get a
comparative picture on this disbursement agency across states. Figure 6.4.1(h) presents
the spread of the hardship scores of post office users of Andhra Pradesh. The dashed
vertical line in Figure 6.4.1(h) represents the median reported hardship for post office
users. The median reported hardship for post office users is 0.14 and the mean is 0.20.
Figure
6.4.1(g):
Degree of
hardship
for workers
with primary
disbursement
agency as
Bank or CSP/
BC across the
States

83
What we therefore see in Andhra Pradesh is that post office users face much less
hardship compared to the banks and CSP/BC users. This is significant and even more
so since payments through post offices are being phased out in Andhra Pradesh. A big
reason is perhaps accessibility and ubiquity of post offices across villages. Given it’s
a state institution, people tend to have more faith in them compared to individuals
disbursing money.
In order to see if there is any association between gender and hardship regardless of
the disbursement agency, we created a combined category of hardship. We then split
the combined hardship in two 4 bins (low, medium, high, and very high) based on the
quartiles of the hardship score distribution. We then spliced the data by gender and
state and the results are presented in Table 6.4.1(h). All the numbers in the table are in
percent. They exclude responses from the individuals who used the ATM as their primary
Figure 6.4.1
(h): Hardship
Scores for Post
Office users

84
6.5
disbursement agency. There does not seem to be any evident difference between the
genders in most hardship categories in any state. However, more women seem to face
‘very high’ hardship compared to men in the same category in Andhra Pradesh and
Jharkhand. There is no discernable difference between the hardship experience of men
and women in Rajasthan.
Hardship Category
Low
Medium
High
Very High
Female
35.5
39.7
11.7
13.1
Male
36.1
41.9
9.5
9.5
Table 6.4.1(h):
Percentage
of people
across varying
degrees of
hardship,
gender and
State
Andhra Pradesh Jharkhand Rajasthan(In Percent) (In Percent) (In Percent)
Female
4.4
29.3
19.4
46.5
Male
5.1
33.2
22.9
38.4
Female
9.7
30.6
25
33.6
Male
9.7
31.2
20.4
38.7
Rejected Payments
This section captures the issues of people whose payments were rejected. The payments
of about 13 percent of respondents in our sample were rejected. The total amount
unpaid to 249 workers due to rejected payments when we did the survey for the period
of one year was approximately Rs. 7.19 lakh. We have intentionally included respondents
whose payments were rejected to ensure that we captured challenges faced by them.
Those whose payments get rejected often have to undergo a long and cumbersome
process to retrieve their wages. The process of correction is unclear and takes months
before the issue is rectified. More importantly, the onus of identification of the problem
and rectification falls entirely on the worker for no fault of theirs.

85
Rejected payments are those transactions that are stuck due to technical errors of the
payment system or data entry errors by the administration. When a fund transfer order
is approved centrally, the wages either get ‘credited’ to the worker’s bank account or
get ‘rejected’. So, a rejected payment is a failed transaction. The NREGA MIS provides
numerous ‘error codes’ as to why payments are rejected. In practice, multiple error codes
can be mapped to three broad categories:
• Data entry errors by the local administration - such as incorrect account number/
Aadhaar number entered in the system.
• Bank account related issues - such as dormant accounts, joint accounts, closed
accounts
• Aadhaar related issues - delinking of Aadhaar from bank account due to mismatch of
names, non compliance of KYC norms, participant bank related issues.
While the error codes (rejection reasons) are mentioned on the MIS, the real reason
for the rejection can be understood only by someone who has a good knowledge of the
banking system and the MIS. Most commonly the block computer operator is the person
who has a grasp over the system. The digitisation of the entire NREGA process has made
computer operators become quite powerful making it hard for workers to reach out to
computer operators.
Members of the LibTech team with the members of Vikas Sahyog Kendra and NREGA workers in Palamu district, Jharkhand

86
We present a perplexing case of a woman from Rajasthan whose wage payments
were rejected due to the reason categorised in the MIS as ‘Inactive Aadhaar’. ‘Inactive
Aadhaar’ typically means that the Aadhaar of the account holder has been deseeded/
unmapped by NPCI from their mapper for various reasons. The ordinary Aadhaar - bank
linkage could still be intact because the bank’s database has the details of Aadhaar
and customer linkage. In other words, when the bank asks for you to link your Aadhaar
number it matches it with your customer identification number and stores it in their
database. Thus, despite that she could use biometric authentication (AePS) to transact
in her account, the deseeding/unmapping in the NPCI mapper means that any payment
directed to that particular Aadhaar number will fail.
We met Madhu Devi in November 2019 when we were working on the issue of rejected
payments in Bhim block of Rajsamand district. Madhu Devi had one bank account
in Bank of Baroda. Her account was closed due to a long period of inactivity. She was
advised to open a new account. She did so and linked her Aadhaar number with her bank
account as well.
Before we met her, Madhu had approached the village NREGA officials and had
complained to the NREGA mate. She had gone to the bank a few times too. Despite
having made multiple visits, she always returned with her case unresolved.
Between April 2019 to November 2019 she had earned wages worth Rs. 6793 - which
were never deposited in her bank account. We checked whether her account was active,
whether her name matched on the job card, bank account and Aadhaar card. In fact,
she was able to withdraw money through the AePS mechanism, which indicated that
her Aadhaar was correctly linked in the bank’s software. When all seemed fine, we
approached the bank branch where she held an account to enquire what was wrong with
her account. The bank checked her account and found that her Aadhaar was correctly
linked with her bank account and the latest status on their screen was ‘VERIFIED AND
MAPPED IN NPCI.’
We were perplexed as to why her payments continued to be rejected when everything
seemed fine at the end of the bank and in the NREGA software. The bankers suggested
that in such cases they either try to deseed the Aadhaar and try the whole linking and
mapping process again or simply advise the worker to open an account in another bank.
Rejected Payment Case Study: Madhu Devi’s payments were rejected due to ‘Inactive Aadhaar’.
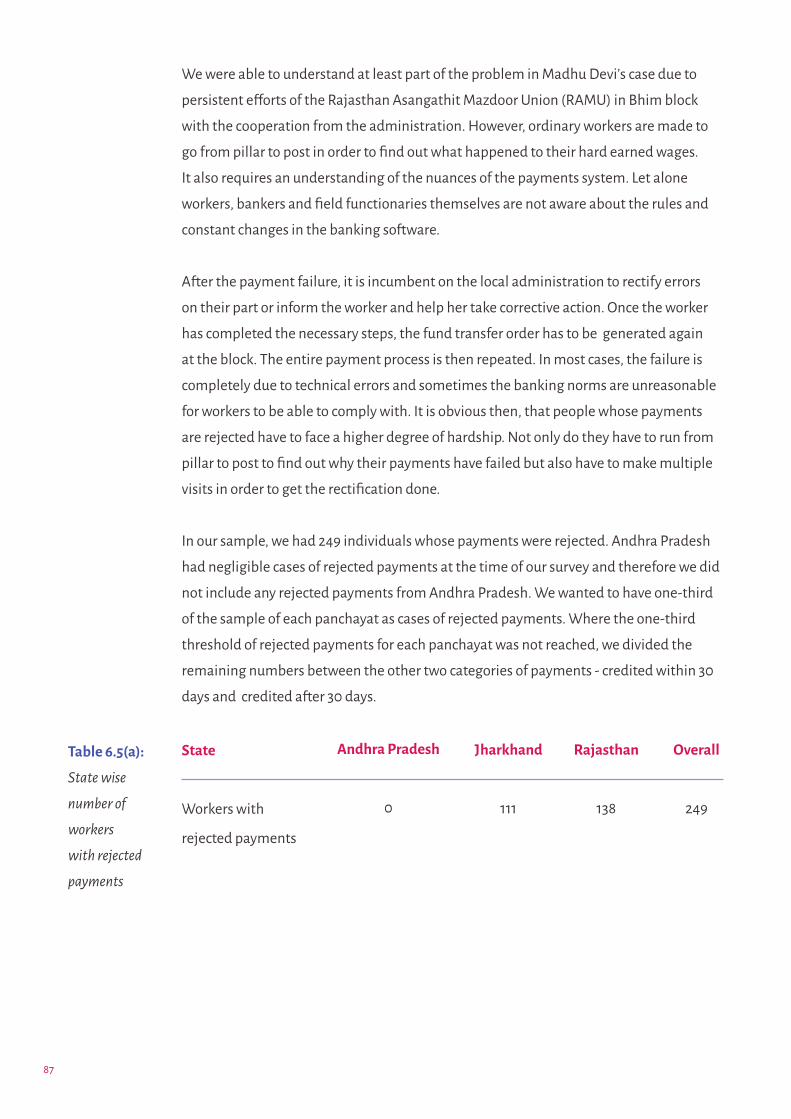
87
We were able to understand at least part of the problem in Madhu Devi’s case due to
persistent efforts of the Rajasthan Asangathit Mazdoor Union (RAMU) in Bhim block
with the cooperation from the administration. However, ordinary workers are made to
go from pillar to post in order to find out what happened to their hard earned wages.
It also requires an understanding of the nuances of the payments system. Let alone
workers, bankers and field functionaries themselves are not aware about the rules and
constant changes in the banking software.
After the payment failure, it is incumbent on the local administration to rectify errors
on their part or inform the worker and help her take corrective action. Once the worker
has completed the necessary steps, the fund transfer order has to be generated again
at the block. The entire payment process is then repeated. In most cases, the failure is
completely due to technical errors and sometimes the banking norms are unreasonable
for workers to be able to comply with. It is obvious then, that people whose payments
are rejected have to face a higher degree of hardship. Not only do they have to run from
pillar to post to find out why their payments have failed but also have to make multiple
visits in order to get the rectification done.
In our sample, we had 249 individuals whose payments were rejected. Andhra Pradesh
had negligible cases of rejected payments at the time of our survey and therefore we did
not include any rejected payments from Andhra Pradesh. We wanted to have one-third
of the sample of each panchayat as cases of rejected payments. Where the one-third
threshold of rejected payments for each panchayat was not reached, we divided the
remaining numbers between the other two categories of payments - credited within 30
days and credited after 30 days.
State
Workers with
rejected payments
Andhra Pradesh
0
Jharkhand
111
Rajasthan
138
Overall
249
Table 6.5(a):
State wise
number of
workers
with rejected
payments

88
While trying to understand the causes of rejections, field functionaries (including
bankers and local NREGA officials) were asked as to why payments were rejected.
They did not seem to have clarity about it. Some reasons they suggested were wrong
Aadhaar seeding, change in names and data entry errors by computer operators. And
when asked if they knew how to resolve these issues, they had some broad ideas of
resolution. It was a trial and error method in most cases. Many of the field functionaries
seemed to indicate that when workers have multiple bank accounts, it can cause more
complications.
No. of Bank Accounts
1
More than 1
Jharkhand
(in percent)
78.9
21.1
Rajasthan
(in percent)
75.4
24.6
Overall
(in percent)
77
23
Table 6.5(b):
State wise
number of
bank accounts
per worker
As Table 6.5(b) indicates, a significant proportion of respondents whose payments were
rejected own multiple bank accounts across the three states. Having multiple bank
accounts could mean that workers have confusion in identifying the bank account where
NREGA wages are supposed to be credited. And thus when wage payments are rejected,
they find it harder to identify which account to rectify. Even when the payments are
successful and a worker has multiple bank accounts, it can become difficult for the
worker to identify the bank account where NREGA payment is transferred.
Awareness among people with Rejected PaymentsWe tried to assess the awareness of the respondents as far as resolution of rejected
payments were concerned. For instance, we asked if they knew that their payments
were rejected, if they knew the reasons for rejection and the methods to rectify them.
Overall, we found that the awareness about rejected payment was low on all counts
and compared to those in Rajasthan people in Jharkhand had lower awareness on these
parameters. We present the details in this section.
One of the reasons for this is because respondents in Rajasthan had a colloquial term to
express the failure of payment “sitta rudi gayo” (money was cancelled). Therefore when
asked in the survey, about whether they were aware about rejections, they were able to
understand the difference between not receiving payments due to delays as opposed to
a rejection.
6.5.1

89
Awareness of Payment Rejection
Aware
Unaware
Overall
Jharkhand
41
70
111
Rajasthan
104
34
138
Overall
145
104
249
Table 6.5.1(a):
Number of
people aware
of payment
rejection
About 89% of the respondents did not know why their wage payments were rejected. Hence, they did not know
what measures to take in order to rectify these errors.
Figure 6.5.1(b) shows that among those who were aware of the fact that their payment
was rejected, they got the information from bank officials, the Gram Rozgar Sahayak
(GRS) and other workers from the village most commonly.
A relatively higher proportion (57 percent) knew about the bank account to which the
payment was attempted (77 percent in Rajasthan and only 32 percent in Jharkhand).
However, respondents did not seem to know why the payments were rejected and what
documents have to be used to rectify the error.
Table 6.5.1(c) shows the levels of awareness of rejection reasons. About 89 percent of
the respondents did not know the reason for the rejection of their wage payments. As a
corollary, they did not know what measures to take in order to rectify these errors.
Figure
6.5.1(b):
Source of
information
about payment
rejection

90
Knowledge of Rejection Reason
Aware
Vaguely Aware
Unaware
Jharkhand
(n = 111)
13.51
5.40
81.08
Rajasthan
(n = 138)
9.41
17.39
73.18
Overall
(n = 249)
11.24
12.04
76.70
Table 6.5.1(c):
Percent of
people who
had knowledge
of rejection
reasons
As Figure 6.5.1(d) shows, more than two-thirds of the respondents did not know what
documents to be submitted to rectify the errors.
It is important to note that even when the awareness levels about rejection are high,
people face enormous hardship in order to get the issue rectified. It is common to take
several months before the payment finally gets credited. Among those who knew, most
workers reported that they submitted the required documents to the GRS or at the block
office.
Hardships among by workers with rejected paymentsWe look at the reported hardship scores for those whose payments were rejected. It is
unsurprisingly higher compared to those whose payments weren’t rejected. As Figure
6.5.2(a) indicates, 70 percent of people with rejected payments have experienced high
to very high hardships at their respective payment agency. This indicates that people
with rejected payments have to face a two fold problem. They not only face the brunt of
the payment rejection but also experienced greater hardship at their payment agency.
The rectification process is long and arduous in most cases. The payment is stuck upto
months, and it takes several visits to the block office and bank for identifying the issues,
let alone resolving it. Workers have to submit copies of documents and seldom get an
assured response or written acknowledgement for their complaints.
6.5.2
Figure
6.5.1(d):
Awareness of
documents
required for
rectification
of problem of
rejection
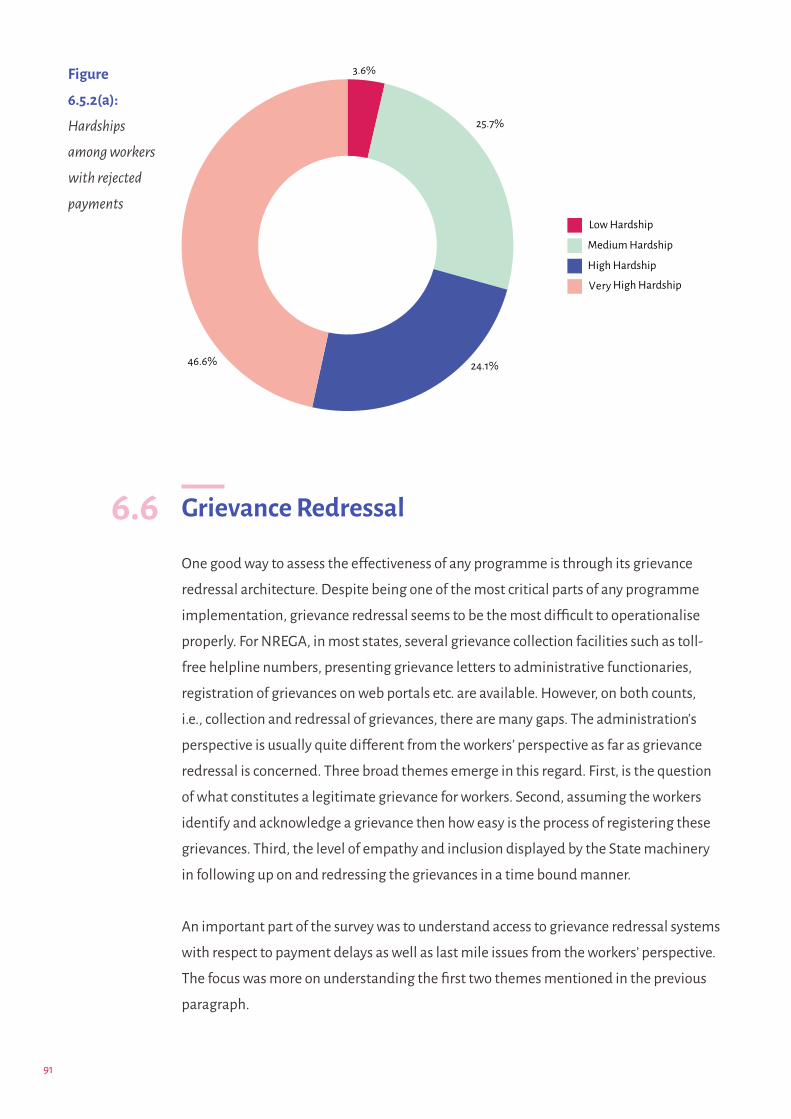
91
Grievance Redressal
One good way to assess the effectiveness of any programme is through its grievance
redressal architecture. Despite being one of the most critical parts of any programme
implementation, grievance redressal seems to be the most difficult to operationalise
properly. For NREGA, in most states, several grievance collection facilities such as toll-
free helpline numbers, presenting grievance letters to administrative functionaries,
registration of grievances on web portals etc. are available. However, on both counts,
i.e., collection and redressal of grievances, there are many gaps. The administration’s
perspective is usually quite different from the workers’ perspective as far as grievance
redressal is concerned. Three broad themes emerge in this regard. First, is the question
of what constitutes a legitimate grievance for workers. Second, assuming the workers
identify and acknowledge a grievance then how easy is the process of registering these
grievances. Third, the level of empathy and inclusion displayed by the State machinery
in following up on and redressing the grievances in a time bound manner.
An important part of the survey was to understand access to grievance redressal systems
with respect to payment delays as well as last mile issues from the workers’ perspective.
The focus was more on understanding the first two themes mentioned in the previous
paragraph.
6.6
Figure
6.5.2(a):
Hardships
among workers
with rejected
payments

92
Delays in wage payments have become so normalised that even if payments are
delayed by a month or more, workers don’t see it as a violation of their rights. People
do not perceive long queues and waiting time at the bank, biometric failures at
the CSP resulting in non-withdrawal of wages, or even the lack of passbooks or
updating mechanisms as legitimate grievances to register. Despite evident hardships,
the regularity of it has normalised the hardships to a large extent which makes
acknowledging something as a legitimate grievance in itself uncommon. As such,
although these complaints exist, they go unregistered.
Let us assume that a is worker is able to identify and acknowledge a grievance. The next
step is to be able to register it formally. Many people did not know where they could
possibly raise a complaint. Many of them were afraid to file a complaint against the field
functionary because they are often people from their village, or known to them. It is not
uncommon for the field functionaries or block officials to reprimand those who have
filed complaints. Even where toll-free helpline numbers were available, people haven’t
heard of them or haven’t found them useful. On many occasions, the person at the
call centre receiving the telephonic complaint may not know the local language of the
worker and/or may be asking too many questions. These create massive entry barriers for
workers to call and register their complaints. Unless there is active mediation by some
civil society organisations, grievance registration using web-based systems is difficult. As
for banks and CSPs, people did not know whom to approach about their complaints. It is
therefore not surprising that about one in five respondents overall, said that they had a
complaint but hadn’t registered it.
The Jharkhand Survey team speaking to the villagers about their work and informing them about their rights as part of NREGA

93
The final layer in the sequence of hurdles are formats. For the administration,
resolving grievances would be relatively easy if there are standardised formats for
collecting grievances. For the workers, many details in the desired format might be too
cumbersome. There are series of barriers that a worker has to face. Even in the rare case
that grievances do get registered, the state administration, on many occasions lacks
the capacity to redress them. Since wage payments are entirely the prerogative of the
central government, the state governments plead lack of ability to pay the workers.
For more complex issues pertaining to rejected payments, the state officials often lack
the technical capacity to understand the nature of the problem. But for the workers,
it’s simply a case of payment not received. In case it’s an issue pertaining to incorrect
Aadhaar mapping, then the resolution lies with the banks, UIDAI, and/or NPCI. MoRD
may not have the capacity for this. All these present a unique set of challenges for
grievance redressal in NREGA thereby jeopardising the workers’ right to be heard.
One possible explanation for a weak grievance redressal system is that the grievance
redressal and implementation authorities are the same.
In order to capture the reality, we had to probe a lot more to make the respondents
comfortable to discuss their complaints as we assured them anonymity. We also asked
them about the details of the complaint(s) filed in the last six months, to ensure that the
recall period is reasonable.
Grievances among those facing hardshipIn Figure 6.6.1(a) each horizontal bar is a level of hardship experienced by workers
categorised as Low, Medium, High and Very High. This is across payment agencies. Each
segment of the bar shows whether they registered their complaint and if so the mode
of doing so, i.e., written, verbal etc. It can be seen that 50 percent of those experiencing
High or Very High hardships said that they had no complaints. This points to the fact
that people do not recognise legitimate hardships as reasons to file official complaints.
However, the percentage of respondents who said that they have complaints but did
not register them increased significantly as the levels of hardships increased. This could
indicate that there are reasons that hinder workers from registering a grievance.
6.6.1
Of the respondents whose payments were rejected, nearly 30 % said they had a complaint but did not register it.
Only about 6.3% registered a written complaint.

94
Figure
6.6.1(a):
Grievance
Redressal
and Hardship
Scores
Figure
6.6.1(b): Rate
of Grievance
Registration
among those
with rejected
payments.

95
Rejected payments are legitimate and serious grievances. As mentioned earlier, for
workers with rejected payments unless the problem is correctly identified and rectified,
they would not get paid. Figure 6.6.1 (b) shows that only about 6.3 percent of those
whose payments were rejected registered a written complaint. Nearly 30 percent of
the respondents whose payments were rejected said they had a complaint but did not
register it.
This illustrates two important points:
a. People often didn’t recognise legitimate grievances
b. Even when they did recognise that the issue constituted a grievance, they seldom
registered it officially
Some of the causes for not registering complaints have been listed above. However,
even those who did register complaints often did so verbally instead of submitting it in
writing or online. Filing a complaint verbally has no official bearing and therefore it is
equivalent to not filing it at all. It is impossible to track the complaint because there is no
paper or digital acknowledgement of verbally filed complaints.
6.6.2
A worker had worked for 4 weeks but had received payments for only 1 week. Such delays in payments in the
first two quarters of the financial year is worrisome as delays usually set in the third quarter.
Grievances RegisteredOverall about 546 respondents communicated their complaints of which about 94
percent did so verbally. The remaining 6 percent filed them in writing and only 1
respondent among them filed the complaint online. As Figure 6.6.2(a) shows, about 30
percent of the respondents in Rajasthan and 24 percent in Jharkhand reported that they
had grievances but had not registered them.

96
Of the 546 individuals who communicated any complaints (including those filed
verbally), there were several who filed complaints about more than one issue. Most
complaints pertained to payments, and in particular, pending wage payments. For
example, a worker had worked for 4 weeks but had received payments for only 1 week.
Such delays in payments in the first two quarters of the financial year are worrisome as
delays usually set in the third quarter. Figure 6.6.2(b) shows the categories of complaints
that people had.
None of the 546 individuals with complaints had used the toll-free number or government helpline to
raise a complaint.
Figure
6.6.2(a):
Grievances by
States
Figure
6.6.2(b):
Categories of
Grievances

97
Filing a grievance typically would consist of submitting it in writing, online or on a
helpline. However, it is very common for people to verbally communicate to an official
that they have a certain grievance. When registering a complaint, a worker may discuss
individual problems (like a payment rejection). Sometimes, workers also go in groups,
submit a petition or an application together as a group. This usually happens in places
where labourers work in groups or there is some form of a workers collective. For
instance there have been stray instances of collectivisation seeking unemployment
allowance otherwise this is seldom paid. Table 6.6.2(c) shows that most workers who
filed complaints in Jharkhand and Rajasthan did so as individuals. In Andhra Pradesh,
however, most complaints were filed collectively.
Type of Complaint Filed
Individual
Collective
Both
Overall
Jharkhand
55
7
62
Rajasthan
92
56
3
151
Overall
263
242
41
546
Table 6.6.2(c):
Level at which
grievance is
registered.
Andhra Pradesh
116
179
38
333
Verbal complaints were mostly communicated to a panchayat official. The others to
whom workers raised their concerns were NREGA mates or middlemen. It is important
to note here that we had asked people if they had used the toll-free number to raise a
complaint. None of the 546 individuals with complaints had used the toll-free number or
government helpline to raise a complaint.
Level at which the
complaint was filed
To a Panchayat Official
To a Block Official
To a Payment Agency
NREGA Portal
State Grievance Redressal Portal
Toll Free Number/ Helpline
Others
Overall
Jharkhand
36
10
5
1
0
10
62
Rajasthan
90
17
1
0
44
152
Overall
351
32
26
5
2
0
130
546
Table
6.6.2(d):
Individual/
Collective
registration of
grievance.
Andhra Pradesh
226
5
21
5
0
76
333

98
80% of those who complained reported that they did not spend any money to follow-up on it. However, 57
respondents reported spending over Rs. 50 and 6 people spent more than Rs. 1000.
Most respondents who filed complaints across the states did not have them satisfactorily
resolved or resolved at all. Among those who said that their complaints were not
resolved at all, they were either told to wait for a few days or didn’t know the status of
their complaints. Very few (about 9 percent) knew the level at which their complaint was
pending.
Time and Costs of Filing ComplaintsAbout 64 percent (n=348) of the complainants had to follow-up two or more times to
resolve their complaints. This could mean asking the GRS on multiple occasions about
the status of the complaint or concern. Sometimes, people make multiple visits to the
Gram Panchayat bhavan and wait to speak to the GRS about their issue.
On a positive note, 80 percent of those who complained, reported that they did not
spend any money to follow-up on the complaint. However, about 57 respondents
said that they spent over Rs. 50 to follow-up on their complaints, with about 6 people
spending more than Rs. 1000 (possibly as a bribe or commission).
6.6.3
Figure
6.6.2(e):
Statewise
Grievance
Resolution

99
One third of the complainants (n=100), whose complaints were resolved (n=290) said
that it took more than 15 days for their complaint to be resolved. 3 people even said it
took up to 1 year for their complaint to be resolved. Among those complaints that were
pending to be resolved, about 50 percent (n=125) of the respondents were given an
ambiguous response “to wait for sometime”. And about 32 percent did not have any idea
about the status of their complaints.
Grievance registration and redressal remains an extremely weak link in the chain of
NREGA implementation. Making it easier for individuals to register grievances will go a
long way in ensuring workers continue to work through the programme, in addition to
significantly strengthening its implementation.
Preference of Payment Disbursement Agencies
Following a comprehensive analysis of workers’ experiences with different disbursement
agencies, they were asked what would be their preferred disbursement agency if they
had the choice of all of the existing agencies, i.e., banks, CSPs, BCs and Post Office.
Respondents were also given the choice of ‘no particular preference’ or ‘can’t say’ because
they have only ever used one agency.
Preference of payment disbursement agency for bank users
A majority of the bank users in Rajasthan and Jharkhand (~80 percent), preferred
to continue using banks for collecting wages while more than two-thirds in Andhra
Pradesh preferred to continue with banks. In general, there was a greater sense of trust
and security in accessing wages through banks in these states.
6.7
In Andhra Pradesh, about 90% of post-office users prefer continuing with currently used disbursement agencies.

100
Preference of payment disbursement agency for CSP/BC users
In Andhra Pradesh, there was a preference for CSP/BC if it was in their village. A greater
proportion of respondents (84 percent) from Andhra Pradesh preferred to continue
with BC in comparison with those who prefer to continue with banks (67 percent). In
Jharkhand and Rajasthan, 35 to 40 percent of the CSP/BC users would have preferred to
transact through a bank branch instead. Some of the main reasons to use CSPs instead
of banks is that banks in rural Jharkhand and Rajasthan are located in the block and they
tend to be over crowded. A 10 district survey of CSPs/BCs in Jharkhand, Sabhikhi, Lahoti,
and Narayanan (2019) show that about 37 percent of the 401 respondents had to revisit
CSP/BC owing to network/electricity problems. About 24 percent experienced over-
crowding and about 13 percent had to make repeated visits owing to biometric issues.
However, many CSPs are present at the panchayats making them more proximal to the
workers compared to banks. Further in many banks in Jharkhand, workers who want to
withdraw any amount below Rs.10,000 have been instructed to use CSPs.
Figure 6.7(a):
Preference
of payment
disbursement
agencies for
bank users.

101
Preference of disbursement agency for PO users
The preference of continuing with currently used disbursement agencies is the highest
amongst post-office users. In Andhra Pradesh, about 90 percent of post-office users
prefer continuing with it. The reasons for willingness to continue with post-office can
be inferred from the general lack of challenges amongst post-office users as compared
to bank or CSP/BC users. The field functionaries in Andhra Pradesh also suggested that
postal payments are preferred by the administration and workers alike. Postal agencies
have a wider reach and branch postal managers are known to villagers.
Figure 6.7(b):
Preference
for Payment
Agency for
CSP/BC users
Figure 6.7(c):
Preference
for Payment
Agency for
PO Users

102
A worker in Andhra Pradesh narrated her story to our team. She was in need of cash late
one night, because her husband had to be hospitalised. She went to the BPM’s house
late at night and he was able to disburse some cash to her. She exclaimed, “Will a bank
be ready to help me out that late at night? I prefer the post office for my wage payment
disbursal”.
In Basia and Manika blocks of Jharkhand, about 18% of the transactions seemed to be fake work
Transaction Verification
In addition to the questions on experiences of using different disbursement agencies,
we sought to verify if the transactions of wage payments as per online reports on the
NREGA MIS matched with workers’ testimonies. Each transaction corresponded to
works as per a single muster roll. For each worker in our sample, we downloaded all their
transactions between 15 August, 2017 and 14 August, 2018. The transaction verification
format included the following pre-filled fields obtained from official records: work name
(also called scheme), dates for work for that muster roll, the wages earned, the date on
which wages were credited, and the number of days of work. Workers were asked if they
worked on the scheme, how many days of work they did and the wages earned. While
this was done in consultation with the social audit teams of the states, the responses
have been treated as estimates.
Workers who did not work on a particular scheme as reported on the MIS: We observed
a wide variation between responses and the MIS data across the states. In Basia and
Manika blocks of Jharkhand, about 18 percent of the transactions seemed to be fake
work, whereas in Andhra Pradesh and Rajasthan they were 0.25 percent and 2.4 percent
respectively.
6.8

103
Difference in work days: Among those who claimed that they had genuinely worked on
particular schemes, they were asked how many days of work they completed for each
of them. The Table 6.8 (b) shows the difference in work days between what is there in
the MIS and what the respondent said. For example, if we look at row number three of
Table 6.8 (b), there were 7 transactions or 0.23 percent of the total transactions for which
the MIS showed a greater number of workdays by about 50 to 74 days compared to that
reported by workers. On the other hand, in about 16 percent of transactions, respondents
reported to have worked for a greater number workdays by about 1 to 25 days, when
compared to that reported on the MIS. This is worrisome since it means that, in reality,
people have worked but they won’t be paid as their completed work is not recorded
on the MIS. For 1694 transactions or 59 percent of transactions there was no difference
between the days worked as reported by the respondent and the MIS data.
Difference in Work Days
(respondent reported - MIS figures)
Less than -100
-99 to -75
-74 to -50
-49 to -25
-24 to 0
1 to 25
26 to 50
51 to 75
76 to 100
Percent of
Transactions
0.07
0.03
0.23
1.64
76.83
16.04
1.11
0.30
0.30
Row
Number
1
2
3
4
5
6
7
8
9
Table 6.8(b):
Discrepancy
of work days
between
MIS and the
workers’
response
Frequency of
Transactions
2
1
7
49
2294
479
33
9
9
Figure 6.8(a):
Percent of
Work Done
as per official
records
104
25% of the respondents reported that they received less money than was reported in their name as per the MIS
Difference in wages earned: In addition to the difference in work days, the respondents
were also asked how much money they have received for the work they have done. The
difference between the reported amount and the amount as per the MIS was calculated
to understand the extent of discrepancies.
In about 1425 (of 2810) of the transactions the difference was zero. Thus, in about 50
percent of the transactions, respondents received the full amount as per the MIS.
Table 6.8(c) shows the difference in the wages received by the respondents and what is
reported on the MIS.
For example, the row number 2 shows that for 12 transactions the difference was
between -10000 to - 8000. This means that the MIS reported that the wages for 12
transactions were paid but the respondents claimed that they were not paid and the
amount lies between Rs. 8000 to Rs. 10000. About 25 percent of the respondents
reported that they received less money than was reported in their name as per the MIS.
The numbers lie anywhere between Rs.500 to Rs. 10000. There could be several reasons
for this. Some of them are discussed below.
First, the workers were perhaps asked to work for a certain number of days and the
recorded attendance was lower. Second, fewer muster rolls were issued but work
happened without the issuance of muster rolls. These are common in many parts of
Jharkhand and Rajasthan where workers often work without looking at the physical copy
of the muster rolls. In fact, musters are routinely issued after completion of work. Third,
the workers’ money may have been wilfully deposited in the wrong account. This could
happen if the work is conducted by a contractor, which is illegal as per the Act. Fourth, the
workers’ money has been inadvertently diverted to a completely different or unknown
account due to errors in linking the Aadhaar card with the jobcard/ bank account. The
members of LibTech have documented a few such cases of diverted payments. We
document the case of a woman in Chhattisgarh when one woman’s NREGA wages were
deposited to another woman’s bank account (Narayanan, Dhorajiwala, and Paikra 2017).
And yet another particularly severe case of diverted payments in Jharkhand where
one woman had lost all her savings due to an error at a bank branch (Narayanan and
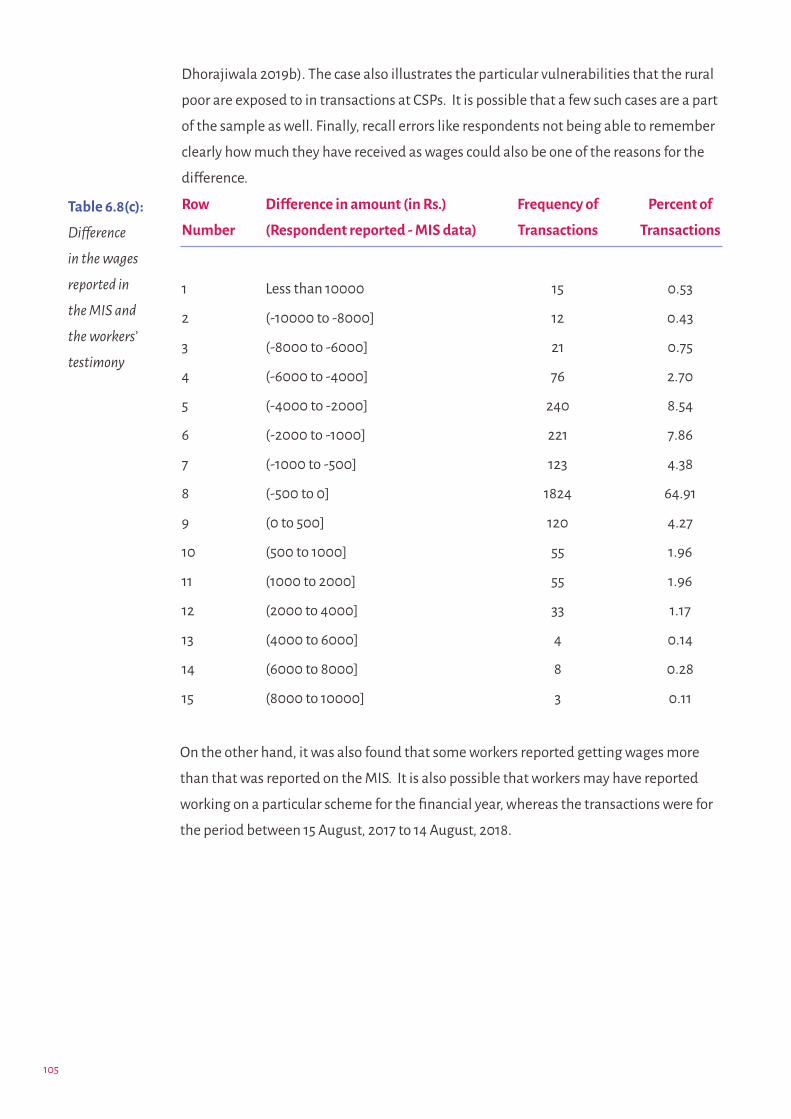
105
Dhorajiwala 2019b). The case also illustrates the particular vulnerabilities that the rural
poor are exposed to in transactions at CSPs. It is possible that a few such cases are a part
of the sample as well. Finally, recall errors like respondents not being able to remember
clearly how much they have received as wages could also be one of the reasons for the
difference.
Difference in amount (in Rs.)
(Respondent reported - MIS data)
Less than 10000
(-10000 to -8000]
(-8000 to -6000]
(-6000 to -4000]
(-4000 to -2000]
(-2000 to -1000]
(-1000 to -500]
(-500 to 0]
(0 to 500]
(500 to 1000]
(1000 to 2000]
(2000 to 4000]
(4000 to 6000]
(6000 to 8000]
(8000 to 10000]
Percent of
Transactions
0.53
0.43
0.75
2.70
8.54
7.86
4.38
64.91
4.27
1.96
1.96
1.17
0.14
0.28
0.11
Row
Number
1
2
3
4
5
6
7
8
9
10
11
12
13
14
15
Table 6.8(c):
Difference
in the wages
reported in
the MIS and
the workers’
testimony
Frequency of
Transactions
15
12
21
76
240
221
123
1824
120
55
55
33
4
8
3
On the other hand, it was also found that some workers reported getting wages more
than that was reported on the MIS. It is also possible that workers may have reported
working on a particular scheme for the financial year, whereas the transactions were for
the period between 15 August, 2017 to 14 August, 2018.

106
RecommendationsThe recommendations to improve delivery of payments in NREGA are critically hinged
on resolving some of the issues that NREGA has faced in the past few years. Wages
need to be increased and made commensurate to the spirit of a moral living wage
(Dhorajiwala and Narayanan 2019a). This would make the programme meaningful
for workers. The second crucial point is to ensure that wages are paid in a timely
manner. As empirically shown by Narayanan et al. (2017), delays in wage payments and
administrative rationing of work reduces the demand for work subsequently. As such,
unless the basic rights such as right to employment on demand and right to timely
payment of wages are implemented in letter and spirit, the workers lose faith in this
programme. Third, NREGA has also been envisioned as a means to strengthen the 73rd
Constitutional Amendment. However, with a highly centralised architecture, Gram
Panchayat’s strengths have undergone dilution. It is therefore imperative that Gram
Panchayats be given more authority in sanctioning and payment of wages.
We present below a minimal set of recommendations categorised by different aspects
of NREGA. This is based on our continued engagement with NREGA over the years. The
recommendations are largely focused on NREGA payments. However, given that rural
distress has been exacerbated by the COVID-19 pandemic, we present a minimal set of
recommendations concerning work demand before presenting our recommendations
concerning payments.
7

107
7.1 Job Card Registration and Work Demand
1. Increase the administrative strength by at least doubling the number of field
functionaries to deal with the increased demand for work.
2. Ensure that job card registrations can happen at the work sites to avoid delays in job
card procurements.
3. In light of the rural distress, the number of work days must be increased to 200 days
per year.
4. Given the massive exodus of migrant workers back to their villages, increase the
shelf and scope of admissible NREGA works. Prioritise community works over
individual asset creation to absorb more labour.
5. Ensure that dated receipts are provided at the work sites for work demand requests.
Many of the following transparency requirements are not restricted to NREGA payments
but are valid for cash transfers (DBT) across many programmes such as scholarships,
maternity entitlements, pensions etc. So we present a minimal set of transparency
measures that would largely hold true for DBT in general.
Sign painted
on a road
in Andhra
Pradesh which
demarcates
an area where
there is good
network
to make
transactions on
a POS machine

108
7.2 Transparency on Cash Transfers
1. Information system design must be worker centric. Worker participation in
designing and rolling out such systems is critical. For instance, all information from
work demand to payments must be made available in each panchayat in formats
arrived at through consultation with workers.
2. Passbooks must be made available to everyone who has a NREGA wages account
irrespective of the payment or disbursement agency.
3. People should be able to update their passbooks for free at any time they request.
The passbook entry should clearly mention the amount and the name of the
programme for which they have received money. For instance, if it’s a NREGA
payment, then the passbook entry should clearly say that.
4. While transacting at the disbursement agency, there needs to be a screen facing the
user which shows the amount withdrawn/deposited. This should be accompanied by
a voice message in local languages of the amount withdrawn/deposited. This would
also help users if the transaction has failed. Such a screen should be made available
in local languages.
5. There should be a strong Know Your Rights (KYR) framework prominently displayed
for users at every disbursement agency including in public spaces such as panchayat
bhavans, Aanganwadis, schools etc. This would help users know what their rights are
- right to have a passbook, right to update it for free etc. A minimal suggested KYR
list can be found in the Annexure.
6. Informed consent must be sought in local languages before linking a worker’s
Aadhaar to the Aadhaar Payment Bridge System (APBS).
7. People should know which bank account their payment has been directed to and
they should have a convenient way to find out where and when their payments have
been credited.

109
8. Risks associated with payment types must be clearly communicated in local
languages. People must be given the choice to withdraw their money from any
disbursement agency regardless of the payment types. For instance, for some
NREGA workers, post offices might be closer than their bank branches. They should
be given the facility to open post office accounts and collect NREGA wages from the
post offices. Alternately, payments through BCs can happen through a designated
period of 5 days every alternate week at public spaces. These could be referred to as
the ‘bhugtan weeks.’
9. Every cash transfer programme must be accompanied with two paper copies of
payment slips or cash transfer slips. One copy of such a slip should be retained by
the cash transfer recipient and the other copy can be signed and given back to the
disbursement agent/implementing agency. The signed copies need to be uploaded
on the corresponding DBT website within the next day.
The next 3 points concern examples for such payment slips as in NREGA
10. For example, for NREGA, implement the Government Circular, RE-I (360078), dated
31st July, 2018 concerning the distribution of wage slips to workers. Such wage slips
should be generated through NREGAsoft and must also be downloadable from the
MIS. It is the responsibility of the Gram Rozgar Sevak to distribute the wage slips to
workers at a public place e.g. the worksite, panchayat bhavan, gram sabha.
11. The wage slips should minimally contain the following information: Name of the
worker, Worker’s Job Card number, Scheme on which work was done, Muster Roll
Number, Muster Roll Start Date and End Date, Number of days worked on the
Muster Roll, Amount of wages credited in the worker’s account (Rs), Bank account
number in which wages are credited, Name and branch of account in which wages
are credited, Date of generation of wage slip, wage rate for the wages.
12. The job cards should be updated with the work they have done, wages they have
earned etc. In addition to manual updating of information on job cards, equip each
panchayat to a job card printing facility similar to passbook updation facilities in
banks.

110
7.3 Reduction of Time and Cost per transaction
1. Every panchayat must be equipped with a disbursement agency.
2. Most workers express the maximum comfort for banks/post offices as opposed to
BCs. Consequently, there is an urgent need to increase the number of rural bank
branches.
3. Implement a key recommendation from the Nachiket Mor Committee Report on
Financial Inclusion: ‘The number and distribution of electronic payment access
points would be such that every single resident would be within a fifteen minute
walking distance from such a point anywhere in the country.’
4. CSPs operate on extremely meagre commissions per transaction. This prevents
them from operating in the gram panchayat they are assigned and instead operate
in the blocks. This is one of the reasons they overcharge workers. Lack of internet
connectivity in gram panchayats further precludes them from operating there.
The government must ensure that they have electricity and internet connectivity
and offline capabilities to ensure workers and other beneficiaries don’t have to be
turned away.
7.4 CSPs/BCs
We reproduce here the relevant set of recommendations based on consultations with
different stakeholders after a 10 district survey on Common Service Centres (Sabhikhi et
al. 2019). These are applicable for CSPs/BCs as each CSP or a BC is in principle a Common
Service Centre. Building upon the clear preference for convenience, the CSC policy
of ‘single window’ should be extended to a ‘No Wrong Door’ policy. Instead of being
substitutes, they should be add-ons to existing systems. There is a need for institutional
platforms at all levels, for all stakeholders (citizens, CSCs, Civil Society Organisations,
technology developers etc.) to participate in the policy design and monitoring. Below we
list specific recommendations for CSPs.

111
1. Move from service-only model to an information facilitation model: CSPs
should provide free information to citizens on eligibility for various government
entitlements, help in accessing government schemes, register grievances and assist
complainants in their tracking.
2. Mixed Financial Model: All government services should be free for all citizens and
CSP owners should be given a basic salary in addition to incentive-based commission
to improve long term sustainability.
3. Gram Panchayat Oversight: Gram Sabhas must have a role in the selection and
removal of CSP, and monitoring of their functioning. Human Resource funds from
the 14th Finance Commission may be used to hire operators for CSPs.
4. CSP Operator Diversity: Affirmative action and skill ladder policies should be
implemented for women, SC and ST groups to increase their numbers as CSP
operators.
5. No Mandatory Aadhaar: To improve the operations of CSPs an alternative to
Aadhaar-based biometric must be introduced.
6. Enforce Minimum Standards: Even if the CSPs are private entrepreneurs, minimum
standards for a CSP operation should be enforced, particularly reliable working
hours and functioning printers for updating passbooks and provision of free receipts.
7. Citizens’ Banking Records: It must be a right of every citizen that they have a detailed
record of all their banking transactions in a robust document such as a passbook.
Thus, ensure that every CSP is equipped to do passbook updation facility.
8. Services delivered through CSPs must be brought under existing legal frameworks
such as the Right to Guaranteed Services and the Right to Information Act.
9. Proactive Disclosures: Official government issued rate chart should be enhanced to
include timelines. Clear Job Charts of processes and officials responsible for service
delivery should be widely publicised, offline and online.
10. Social Accountability: The CSPs should adhere to the minimum standards of social
audits formalised by the CAG.8

112
11. Addition of New Services: Follow a transparent, consultative policy with all
stakeholders, including citizens and CSPs on type and manner of services to be
included.
Accountability
1. The MoRD is primarily responsible for ensuring that workers get their wages within
15 days of completion of work.
2. Given the scarcity of administrative staff, there is immense burden on the field
functionaries to complete tasks on time. To truly implement NREGA in letter and
spirit, there is an urgent need to double the administrative budget and ensure more
field functionaries per panchayat. This would also ensure that accountability norms
of field functionaries are achievable.
3. The MoRD should be responsible for the delays in wage payments until it is credited
to the workers. A meaningful compensation (at least matching the savings interest
rate) should be offered to people for the delay in crediting the cash transfer.
4. Every agency involved in the payment of NREGA wages must be brought within
the ambit of social audits with clear penalty norms in case of violations. In addition
to field functionaries such as the Gram Rozgar Sahayak (GRS), Junior Engineer, the
Programme Officer, the following institutions should also be brought under social
audit norms: the National Payments Corporation of India (NPCI), UIDAI, banks, and
BC/CSPs.
5. At the moment, the filled muster rolls handed over by Mates to the GRS are entered
in the MIS. However, to ensure more transparency and accountability, it would
be useful to have a ‘dated and signed handover slip’ that the Mates can show the
workers.
6. Implement account based payments instead of APBS. APBS is opaque and
unfriendly from the workers’ perspective.
7. Any payment related interventions should be worker centric and must be piloted
with wide consultation with workers before rolling out.
7.5
113
Rejected Payments
The current system puts the onus of recognising the problem of rejection and resolving
it entirely on the worker. It is similar when payments of other cash transfer programmes
also fail.
The government department responsible for the cash transfer should ensure that
individuals for whom the payment transfer fails do not suffer. They must proactively take
steps to rectify the problem due to which the payment has failed.
1. The error codes and rejection reasons should be standardised across banks
and payment agencies. For each rejection reason there must be concrete steps
for resolution. The steps should spell out the responsibility of the government
functionaries, banks and payment intermediaries.
2. Each state government should set up a system to monitor rejected payments
regularly and ensure that they provide prompt support to resolve grievances. They
should include members from the UIDAI, NPCI and banks so that workers do not
suffer due to the lack of coordination among these agencies.
3. All payment intermediaries must be accountable for rejections. If the central
government is soliciting the services of a private body (such as the NPCI), there must
be clear accountability norms, failing which there should be penalties.
4. There must be officers appointed to review the extent of rejections and they should
be held responsible when such payments are not cleared beyond 30 days.
5. Camps must be held once a month in each panchayat and bank so that issues
concerning rejected payments can be rectified without the workers having to make
multiple visits.
6. Workers must be given a dated receipt every time they submit documents for
rectification at the block, bank or any agency. The time for resolution should be
printed on such a receipt.
7. There should be special social audits for rejected payments.
7.6

114
Grievance Redressal
In the section on grievance redressal, we outlined the broad issues from the workers’
perspective. Here we present some thoughts on how the State can construe an apparatus
with principles of empathy and primacy to workers’ rights and limitations.
1. Create and spread awareness about multiple access points to collect grievances.
Common Services Centres (CSCs) may also be used for this purpose.
2. Grievance collection should not have conditionalities. Any manner in which the
worker is presenting grievances must be recorded.
3. Block level grievance collection centres with block level toll-free numbers could be
set up to account for variation of language across blocks.
4. Technology can be used effectively for grievances. For example, calculation
and payment of unemployment allowance and delay compensation should be
automatically approved and transferred to the workers’ accounts. This should be
automatically treated as a grievance without the workers having to register them as
such.
5. Given the complexity of the DBT architecture, a Grievance Redress Commission
(GRC) for DBT programmes may be set up. Such a GRC could be a statutory body with
a well-defined appellate structure for complaint escalation with strong principles of
time-bound resolution mechanisms. Such a GRC would draw upon expertise from
various line departments involved in the cash transfer process and must include
representatives of all major banks, line departments, UIDAI, SLBC and NPCI.
The GRC must operate at state and national levels and must meet weekly with a
strong feedback component with workers. Some principles from the Information
Commission (prior to the RTI amendment) could be used to set up the GRC. There
are pros and cons of another Commission. Alternatively, a robust and efficient
grievance redressal system should be set up by the Finance Ministry so that all DBT
related grievances can be addressed at one place. The grievances registered on the
system should be monitored by the Cabinet Secretary/Finance Secretary every week
and by the Finance Minister once every month for speedy resolution of grievances.
7.7

115
AppendicesIn this section, we will present the mathematical underpinnings concerning several
calculations in the report. In Appendix A.1, we present the data cleaning and imputation
strategies used for missing values in the survey responses. Appendix A.2 is further
subdivided into three parts: Appendix A.2.1 presents some robustness checks
concerning the choice of cut-offs of some continuous variables used in the creation of
the reported hardship scores. We then present two different statistical techniques used
to justify the use of a simple average of hardship scores. In Appendix A.2.2, we describe
the method and the application of Exploratory & Confirmatory Factor Analysis to the
response data. In Appendix A.2.3 we discuss the method and the application of another
statistical technique called Multiple Factor Analysis to the survey response data. Using
measures of association between each of these techniques with the simple average
of reported hardship, we can conclude that using simple average serves the Occam’s
razor principle that using a parsimonious, easy to understand technique serves as
good a purpose as using any of these statistical procedures. We attempt to explain the
mathematics in words instead of resorting to mathematical symbols and equations for
the sake of readability
Data Cleaning & Missing Value Imputation
As is common in survey responses, there were missing values and responses saying
“I DON’T KNOW” (IDK). In situations when the data is either missing at random or
has IDK values entered erroneously, it is a common practice to impute such data with
meaningful values. For a few questions and responses, the values entered as ‘unclear’
was coded as 888 in the survey responses. By treating some of them as IDK values, we
imputed them depending on whether they could be treated as missing at random.
There is no well defined scientific consensus on what is an acceptable proportion of
missing or IDK values that can be imputed. Our imputation strategy ensured that the
data distribution before and after imputation are very similar.
8
A.1

116
The objective of imputation is the following: What would be a reasonable guess for an
unobserved value had the respondent answered or had the data for this respondent
been entered correctly. The literature on missing value imputation is vast and
sophisticated techniques have emerged that borrow insights from the responses of
other questions of the same respondent in making a reasonable guess for the question
with missing values. Multiple Imputation strategies, proposed by Rubin (1987), has
become a popular choice for complex missing data problems.
Multiple imputation broadly has the following three steps:
1. The missing values are imputed with m values drawn randomly from some
distribution to get m complete case data sets.
2. The same analysis is performed on each of the m data sets.
3. The results are pooled in some meaningful manner.
Performing multiple imputations instead of single imputation accounts for the
statistical uncertainty in the imputations. Schafer and Graham (2002) present a detailed
account of the various multiple imputation procedures. One imputation approach that
has gained enormous currency and ratification among theoreticians and practitioners
alike is called the Multiple Imputation using Chained Equations (MICE). In literature it is
also called fully conditional specification or sequential regression multiple imputation
(SRMI). MICE rests on the basic idea that it uses information from other observed values
of variables to predict and impute the missing values of one variable. A number of
simulated datasets with complete cases are created and the imputed value is obtained
by pooling from these simulated datasets. To appreciate the idea of fully conditional
specifications in creating multiple imputations for multivariate data the reader is
referred to Raghunathan et al. (2001), van Buuren (2007) and the references therein.
A practical and an applications oriented perspective of using MICE is presented by Azur
et al. (2011)

117
We implemented the MICE algorithm using the R software9 to impute some variables
used in the calculation of hardship scores. The R software has an excellent package of the
MICE algorithm developed by Van Buren and Groothuis-Oudshoorn (2011) and has over
5500 citations across various application domains. The missing values were imputed for
each state separately since the profile of respondents of each state are different.
For bank users, there were 9 variables that were used to build a hardship score for each
respondent. For each of these variables, to impute a missing value for a variable, we
used the other 8 variables as predictors in the MICE algorithm. For the complete list of
the hardship variables refer to table 6.4.1(a). For example, the number of visits required
to link one’s Aadhaar to the bank account is a discrete ordinal variable. To impute its
missing values, the predictors used were: number of visits to link Aadhaar to the job
card, whether there was any misinformation regarding crediting of wages, whether
banks update the passbooks of respondents, whether reasons were provided in case of
refusal to update passbooks, the number of visits made to access the wages for the last
transaction, the time taken to access wages, the cost incurred to access wages, and the
maximum time taken to access wages. The first 5 of these variables are either ordinal or
categorical while the last three are continuous. To impute each of the first 5 variables,
we used polytomous regression methods and for each of the last 3 continuous variables,
we used predictive mean matching methods. Further, we set m=5 to impute each
variable where m denotes the number of multiple imputations done. All the variables
used to construct the simple average of reported hardship for both banks and CSP/BC
had around 10 percent or less missing or IDK values except for two variables: Biometric
issues faced by respondents at the CSP/BC and whether respondents get a receipt for
transactions at the CSP/BC. These variables had roughly 15% IDK values. Table A.1(a)
presents the simple average of reported hardships at CSP/BC by dropping these two
variables from the calculation and by using imputed values for these two variables.
Column 2 depicts the simple average of hardship scores of respondents excluding the
two variables having high percentages of IDK. Column 3 depicts the simple average of
hardship scores of respondents by including the imputed values of these two variables.
As can be easily seen from this table, the imputation strategy works very effectively even
when there are about 15 percent IDK values among respondents in the survey. The trend
and the values of reported hardships across states are practically identical.
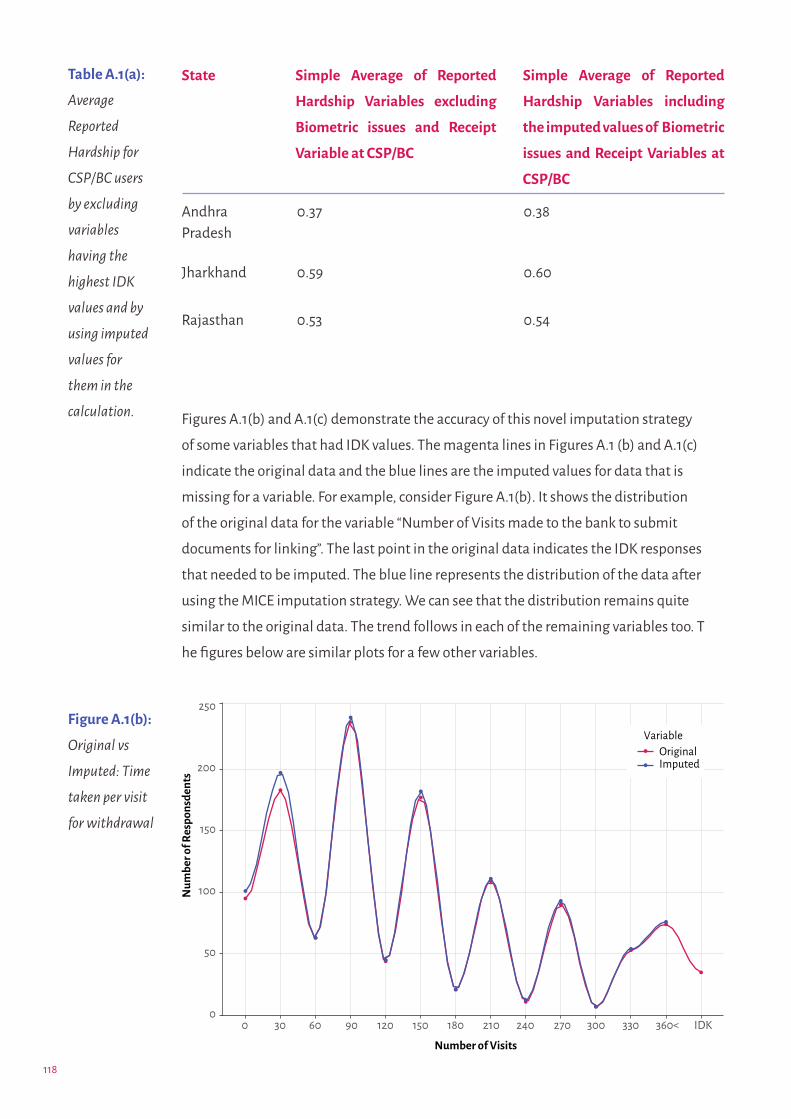
118
State Simple Average of Reported
Hardship Variables excluding
Biometric issues and Receipt
Variable at CSP/BC
Simple Average of Reported
Hardship Variables including
the imputed values of Biometric
issues and Receipt Variables at
CSP/BC
Andhra Pradesh
0.37 0.38
Jharkhand 0.59 0.60
Rajasthan 0.53 0.54
Figures A.1(b) and A.1(c) demonstrate the accuracy of this novel imputation strategy
of some variables that had IDK values. The magenta lines in Figures A.1 (b) and A.1(c)
indicate the original data and the blue lines are the imputed values for data that is
missing for a variable. For example, consider Figure A.1(b). It shows the distribution
of the original data for the variable “Number of Visits made to the bank to submit
documents for linking”. The last point in the original data indicates the IDK responses
that needed to be imputed. The blue line represents the distribution of the data after
using the MICE imputation strategy. We can see that the distribution remains quite
similar to the original data. The trend follows in each of the remaining variables too. T
he figures below are similar plots for a few other variables.
Table A.1(a):
Average
Reported
Hardship for
CSP/BC users
by excluding
variables
having the
highest IDK
values and by
using imputed
values for
them in the
calculation.
Figure A.1(b):
Original vs
Imputed: Time
taken per visit
for withdrawal

119
Figure A.1(c):
Original vs
Imputed:
Number of
Visits to the
bank for last
withdrawal
Figure A.1(d):
Original vs
Imputed:
Number of
visits to link
Aadhaar to
Bank

120
Figure A.1(e):
Number of
biometric
failures at
CSP/BC
Figure A.1(f):
Original vs
Imputed: Time
Taken by CSP/
BC users for
withdrawal

121
Robustness Checks for Reported Hardship Scores
When numerous variables are used to measure some characteristics, it’s sometimes
useful to find some meaningful approach to combine them into a single number. Such a
number, an index, becomes an objective measure of the underlying phenomenon that is
being studied.
There are a few distinct advantages of using a measure such as a simple average of vari-
ables, each of which is a binary variable (0 = no hardship and 1=hardship). First is obvi-
ously its ease of interpretation. Second, given that each is a binary variable, taking a sim-
ple average creates an index of hardship that is between 0 and 1 for each respondent. An
individual whose score is close to 0 indicates that this person had to face fewer hardships
compared to an individual whose average score is close to 1. This aids in comparing the
hardships faced across respondents. For example, the overall average reported hardship
for bank users in AP was 0.34 and those in JH was 0.48. Given the simple scale, we can
easily conclude that, on average, respondents in AP faced less difficulty compared to the
respondents in JH. It should be pointed out that these average scores are better suited as
comparative aids and not as an absolute measure because they could be sensitive to the
choice of the cut-offs for each variable.
This brings us to the caveats of using a simple average of reported hardships. There are
broadly three categories of variables capturing the reported hardships. (a) Biometric
Authentication related (b) Transparency/Accountability such as ability of passbook
updation and (c) Time and cost related variables. Thinking of time taken as a proxy for
opportunity cost, we could club the time and cost related variables and refer to them as
cost variables. While what constitutes hardship for the variables pertaining to biometric
authentication and transparency/accountability are self explanatory, the cut-offs cho-
sen for the time and cost considerations are indeed arbitrary. This is the first legitimate
concern in this approach. The second concern is the usage of simple average as a single
measure of hardship in each state. What are the statistical justifications for using such a
measure as an index of hardship?
The hardship scores of respondents for each disbursement agency was calculated based
on a few discrete variables (number of visits to withdraw wages, number of biometric
failures etc) and a few continuous variables (time taken to access wages, cost incurred
etc.). Categorising an experience as hardship is simpler for discrete variables since
multiple visits to withdraw one’s own wages is an obvious hardship. However, there
A.2
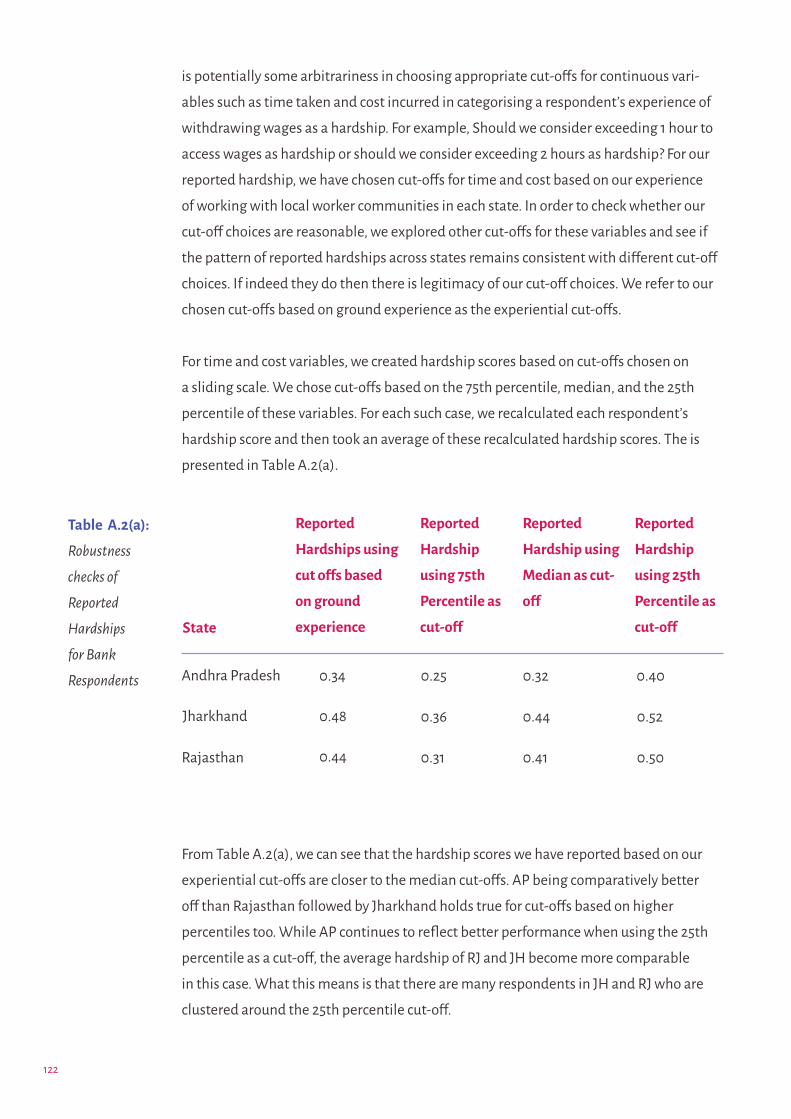
122
is potentially some arbitrariness in choosing appropriate cut-offs for continuous vari-
ables such as time taken and cost incurred in categorising a respondent’s experience of
withdrawing wages as a hardship. For example, Should we consider exceeding 1 hour to
access wages as hardship or should we consider exceeding 2 hours as hardship? For our
reported hardship, we have chosen cut-offs for time and cost based on our experience
of working with local worker communities in each state. In order to check whether our
cut-off choices are reasonable, we explored other cut-offs for these variables and see if
the pattern of reported hardships across states remains consistent with different cut-off
choices. If indeed they do then there is legitimacy of our cut-off choices. We refer to our
chosen cut-offs based on ground experience as the experiential cut-offs.
For time and cost variables, we created hardship scores based on cut-offs chosen on
a sliding scale. We chose cut-offs based on the 75th percentile, median, and the 25th
percentile of these variables. For each such case, we recalculated each respondent’s
hardship score and then took an average of these recalculated hardship scores. The is
presented in Table A.2(a).
From Table A.2(a), we can see that the hardship scores we have reported based on our
experiential cut-offs are closer to the median cut-offs. AP being comparatively better
off than Rajasthan followed by Jharkhand holds true for cut-offs based on higher
percentiles too. While AP continues to reflect better performance when using the 25th
percentile as a cut-off, the average hardship of RJ and JH become more comparable
in this case. What this means is that there are many respondents in JH and RJ who are
clustered around the 25th percentile cut-off.
State
Reported
Hardships using
cut offs based
on ground
experience
Reported
Hardship
using 25th
Percentile as
cut-off
0.34
0.48
0.44
Reported
Hardship
using 75th
Percentile as
cut-off
Reported
Hardship using
Median as cut-
off
0.25
0.36
0.31
0.32
0.44
0.41
0.40
0.52
0.50
Table A.2(a):
Robustness
checks of
Reported
Hardships
for Bank
Respondents Andhra Pradesh
Jharkhand
Rajasthan

123
We performed another confirmatory means to check if our chosen cut-offs in the
calculation of reported hardships are reliable. To do this, for each state, we rank the
individuals based on the reported hardship calculated using the experiential cut-off
and based on the cut-off using the 25th, 50th (median), and the 75th percentile values.
We then calculated Kendall’s tau rank correlation measure. Kendall’s tau is a non-
parametric measure of rank correlation between two continuous variables. Kendall’s
rank correlation is used to test the similarities in the ordering of data when it is ranked.
It is a normalised measure that lies between 0 and 1. A value of zero implies that rank
of individuals in one variable is completely opposite to the rank of the individuals in the
other variable. A value of one indicates perfect association. In other words, a rank of one
implies that rank of individuals in one variable perfectly coincides with the rank of the
individuals in the other variable. This in turn means that one variable serves as a perfect
proxy for the other variable. For our case, if the reported hardships for banks using
experiential cut-off has a high rank correlation with cut-offs based on other percentiles,
then we can conclude that the reported hardships using the experiential cut-offs are
robust to alternative choices.
Figure A.2(b) shows the relationship between the reported hardships based on
experiential cut-off and if the cut-offs were chosen based on the 25th percentile. This is
done for each state.
Figure A.2(b):
Hardship
scores using
experiential
cut-off and
using 25th
percentile for
bank users.

124
Figure A.2(b) depicts that there is a high rank correlation between hardship scores
using experiential cut-off and using the 25th percentile cut-off. These would be much
better for higher percentiles since the rank correlations between hardships based on
experiential cut-offs and those based on higher percentiles are higher. The blue line
through each scatterplot shows the regression line between the two variables. Indeed
the adequacy of using the experiential cut-off can be further sanctified statistically using
a statistical test of rank correlation between the experiential cut-off and the cut-off using
25th percentile, 50th percentile (median), and the 75th percentile. The results of this are
presented in Table A.2(c).
Table A.2(c) shows the Kendall’s rank correlation between the experiential cut-off
for reported hardship scores for banks with the 25th, 50th (median), and the 75th
percentiles. The calculated correlations are very high. Indeed a statistical test of
association reveals that the scores using experiential cut-offs are very highly correlated
(in the rank sense) with each of the 25th, 50th (median) and the 75th percentile. Indeed
the p-values for each of these for every state is incredibly low. The null hypothesis of no
association between the hardships based on experiential cut-off and other percentile
cut-offs are rejected at a significance level of 0.01. This indicates that our choice of
cut-off to calculate the reported hardships for banks is robust to the choice of the
State Kendall’s Tau Between
Experiential Cut-off
and Using 75th
Percentile as Cut-off
(p value)
Kendall’s Tau Between
Experiential Cut-off
and Using 25th
Percentile as Cut-off
(p value)
AndhraPradesh
0.79 (p value < 2.2e-16)
Jharkhand
Rajasthan
Kendall’s Tau Between
Experiential Cut-off
and Using Median as
Cut-off
(p value)
0.93(p value < 2.2e-16)
0.89(p value < 2.2e-16)
Table A.2(c):
Rank
Correlation
between
experiential
cut-off for bank
hardship scores
and cut-offs
using 25th,
50th, and 75th
percentile
0.86(p value < 2.2e-16)
0.94(p value < 2.2e-16)
0.91(p value < 2.2e-16)
0.82(p value < 2.2e-16)
0.93(p value < 2.2e-16)
0.85(p value < 2.2e-16)

125
cut-offs. Table A.2(d) gives the comparison between reported hardships based on
experiential cut-offs and cut-offs using the 75th, 50th (median), and the 25th percentiles
for the CSP/BC users. The methodology for populating this table is identical to that for
bank users presented in Table A.1(a).
One can clearly glean from Table A.2(d) that the pattern of reported hardships based
on a variety of cut-offs is consistent with the experiential cut-off finally adopted by us
(column 2).
Table A.2(e) gives the rank correlations and the corresponding p-values for testing
association between experiential cut-offs and other choices.
State Reported
Hardships
based on
experiential
cut offs
Reported
Hardship
using 25th
Percentile as
cut-off
0.38
0.60
0.54
Reported
Hardship
using 75th
Percentile as
cut-off
Reported
Hardship
using
Median as
cut-off
0.30
0.51
0.45
0.31
0.56
0.51
0.33
0.58
0.52
Table A.2(d):
Robustness
checks of
Reported
Hardships for
CSP/BC Users
State Kendall’s Tau Between
Experiential Cut-off
and Using 75th
Percentile as Cut-off
(p value)
Kendall’s Tau Between
Experiential Cut-off
and Using 25th
Percentile as Cut-off
(p value)
AndhraPradesh
0.85(p value < 2.2e-16)
Jharkhand
Rajasthan
Kendall’s Tau Between
Experiential Cut-off
and Using Median as
Cut-off
(p value)
0.85(p value < 2.2e-16)
0.87(p value < 2.2e-16)
Table A.2(e):
Rank
Correlation
between
experiential
cut-off for
CSP/BC
hardship scores
and cut-offs
using 75th,
50th, and 25th
percentile
0.85(p value < 2.2e-16)
0.90(p value < 2.2e-16)
0.93(p value < 2.2e-16)
0.79(p value < 5.4e-16)
0.90(p value < 6.1e-13)
0.94(p value < 3.4e-13)
Andhra Pradesh
Jharkhand
Rajasthan

126
The null hypothesis of no association between the hardships based on experiential cut-
off and other percentile cut-offs for CSP/BC users are rejected at a significance level of
0.01. This indicates that our choice of cut-off to calculate the reported hardships for CSP/
BC is robust to the choice of other percentile cut-offs.
A similar robustness check analysis can be easily replicated for post office users.
However, since postal payments were prevalent only in AP, such an exercise would not
add anything to our understanding of comparative performance across states.
Exploratory & Confirmatory Factor Analysis (CFA)Factor analysis is a popular statistical method that exploits the variation in the data
by combining the measured variables into factors. Each factor is a linear combination
of the variables. For our case, there are numerous variables used to measure various
dimensions of hardship. These variables act as observable proxies for the directly
immeasurable notion of ‘hardship’. An important analytical question then is how to
meaningfully combine the measured variables to arrive at the unobservable factor
hardship.
Every factor explains some amount of the total variance. The amount of variance that
each factor explains is measured by the eigenvalue. For example, if the eigenvalue of a
factor is say 3, then this single factor has the capacity to explain the variance contributed
by 3 variables. In practice, only the factors that cumulatively explain a large percentage
of variance are retained. The coefficient of variables in the linear combination of a factor
can be considered as a measure of association between the variable and the underlying
hidden factor. This coefficient is known as the factor loading of the variable. The factor
loadings are then used to arrive at factor scores for each individual respondent. The
factor scores reflect the individual’s relative position in the corresponding factor.
We used Factor Analysis to arrive at factor scores of individuals based on their reported
hardships with disbursement agencies. We explain the process and the results in
the case of reported hardships for banks. Without loss of generality, the process and
the explanation are the same for CSP/BCs. All the software implementation for this
has been done using the R programming language. In particular, the factor analysis
implementation has been done using the psych package (Revelle 2020) of R.
A.2.1
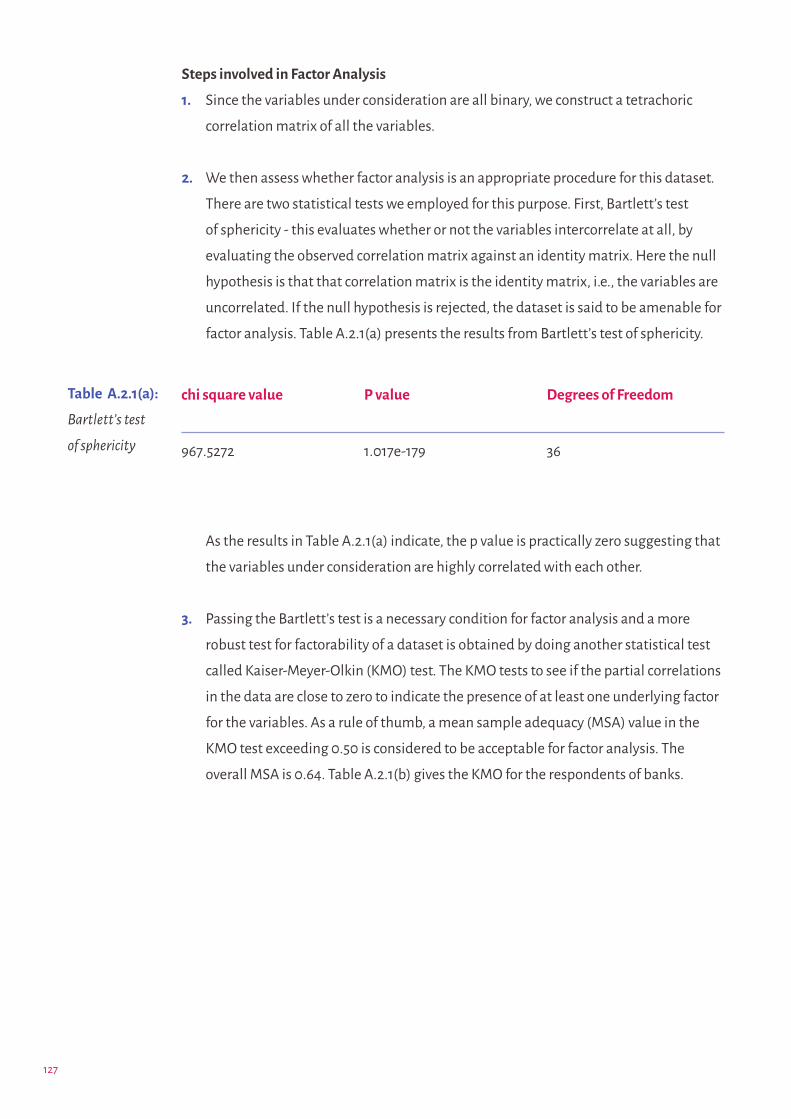
127
Steps involved in Factor Analysis
1. Since the variables under consideration are all binary, we construct a tetrachoric
correlation matrix of all the variables.
2. We then assess whether factor analysis is an appropriate procedure for this dataset.
There are two statistical tests we employed for this purpose. First, Bartlett’s test
of sphericity - this evaluates whether or not the variables intercorrelate at all, by
evaluating the observed correlation matrix against an identity matrix. Here the null
hypothesis is that that correlation matrix is the identity matrix, i.e., the variables are
uncorrelated. If the null hypothesis is rejected, the dataset is said to be amenable for
factor analysis. Table A.2.1(a) presents the results from Bartlett’s test of sphericity.
As the results in Table A.2.1(a) indicate, the p value is practically zero suggesting that
the variables under consideration are highly correlated with each other.
3. Passing the Bartlett’s test is a necessary condition for factor analysis and a more
robust test for factorability of a dataset is obtained by doing another statistical test
called Kaiser-Meyer-Olkin (KMO) test. The KMO tests to see if the partial correlations
in the data are close to zero to indicate the presence of at least one underlying factor
for the variables. As a rule of thumb, a mean sample adequacy (MSA) value in the
KMO test exceeding 0.50 is considered to be acceptable for factor analysis. The
overall MSA is 0.64. Table A.2.1(b) gives the KMO for the respondents of banks.
chi square value P value Degrees of Freedom
967.5272 1.017e-179 36
Table A.2.1(a):
Bartlett’s test
of sphericity

128
MSA for each variable is given in the Table ---
As Table A.2.1(b) indicates, the overall MSA is high suggesting that the dataset is
highly amenable for factor analysis and even the MSA of each variable comfortably
exceeds the threshold.
4. Having established that the dataset is amenable for factor analysis, the next step
is to decide the number of factors required for this exercise. One usually relies on a
‘parallel analysis scree plot’ to arrive at the desirable number of factors.
Parallel analysis was a method developed by the cognitive psychologist John
Horn and has come to be synonymous with him (Horn 1965) . The method relies
on a comparison of the eigenvalues of the actual dataset with eigenvalues of
randomly simulated datasets having the same structure as the original dataset.
The eigenvalues of the actual dataset and the simulated datasets are plotted on the
same graph and then find the number of eigenvalues of the actual dataset that are
greater than those of the simulated datasets. The number of such eigenvalues would
constitute the number of factors to be retained for analysis.
Variable
Number of visits to link Aadhaar with bank account
Number of visits to link Aadhaar with NREGA job card
Number of times misinformed about wages being credited
Does the passbook get updated every time
Has the respondent been refused getting their passbooks updated
Number of visits made to get the wages for the last withdrawal
Time taken on average to visit the bank
Maximum time taken at the bank
Cost incurred on average to visit the bank
MSA
0.56
0.54
0.68
0.61
0.62
0.71
0.69
0.74
0.70
Table A.2.1(b):
Kaiser-Meyer-
Olkin Factor
Adequacy Test
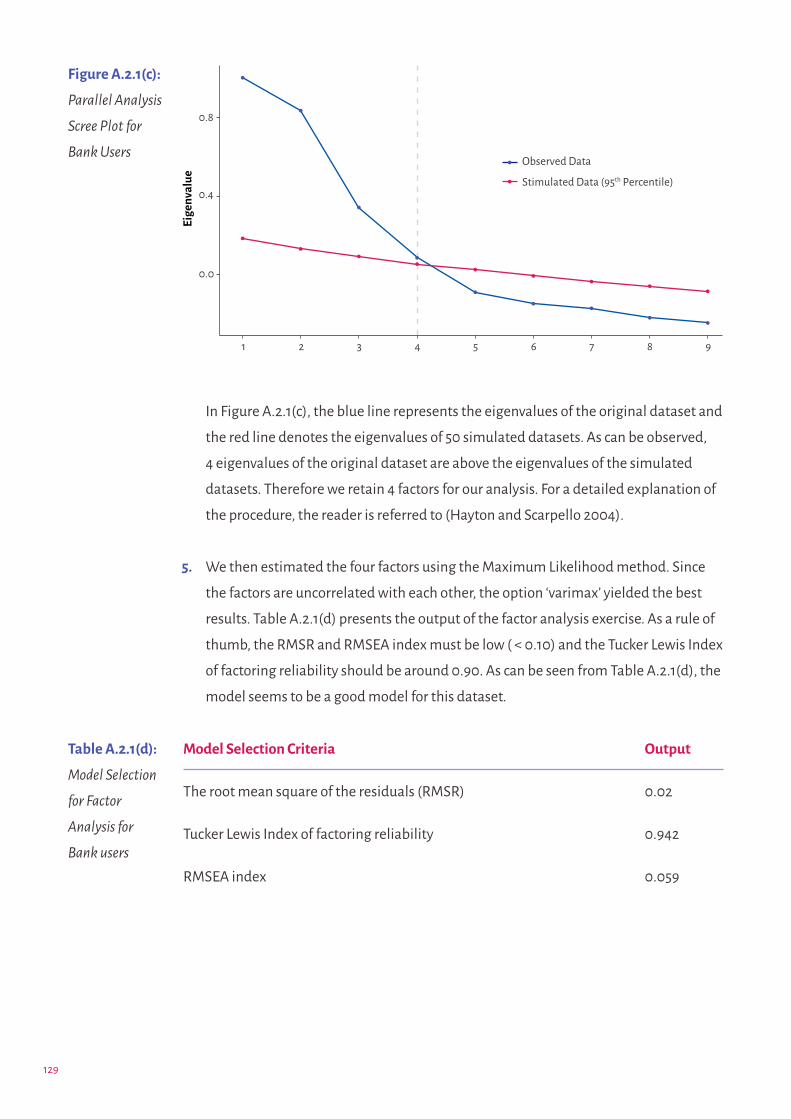
129
In Figure A.2.1(c), the blue line represents the eigenvalues of the original dataset and
the red line denotes the eigenvalues of 50 simulated datasets. As can be observed,
4 eigenvalues of the original dataset are above the eigenvalues of the simulated
datasets. Therefore we retain 4 factors for our analysis. For a detailed explanation of
the procedure, the reader is referred to (Hayton and Scarpello 2004).
5. We then estimated the four factors using the Maximum Likelihood method. Since
the factors are uncorrelated with each other, the option ‘varimax’ yielded the best
results. Table A.2.1(d) presents the output of the factor analysis exercise. As a rule of
thumb, the RMSR and RMSEA index must be low ( < 0.10) and the Tucker Lewis Index
of factoring reliability should be around 0.90. As can be seen from Table A.2.1(d), the
model seems to be a good model for this dataset.
Figure A.2.1(c):
Parallel Analysis
Scree Plot for
Bank Users
Model Selection Criteria
The root mean square of the residuals (RMSR)
Tucker Lewis Index of factoring reliability
RMSEA index
Output
0.02
0.942
0.059
Table A.2.1(d):
Model Selection
for Factor
Analysis for
Bank users

130
In practice, we ignore the contribution of those variables to a factor where the
correlations are low. Table A.2.1(e) presents the factor loadings of those variables
that exceed a threshold of 0.40 to represent the dominant variables that contribute
most to that factor. This threshold is arbitrary but it gives a sense of which variables
correlate more with each factor.
Table A.2.1(e) also gives an interesting picture. One observes that the variables
connecting to say, time and cost, dominate the correlations with the second factor
while they make negligible contributions to the other factors. Similarly, the variables
connected to linking Aadhaar dominate the correlations for factor 1 and have
negligible correlations with the other factors. When this happens in a dataset, it’s
said that the dataset exhibits a ‘Simple Structure’.
From Table A.2.1(e) we can conclude that Aadhaar related variables are the main
drivers for the first factor. Cost related variables are the main drivers for the second
factor. Transparency and accountability pertaining to passbook updation drive the
third factor and the number of visits made to the bank to withdraw wages constitute
the last factor.
Variables
Number of visits to link Aadhaar to Bank Account
Number of visits to link Aadhaar to NREGA job card
Average time taken at the bank
Average cost incurred to visit a bank
Maximum time taken at the bank
Passbook doesn’t get updated at the bank
Have been denied update of the passbook at the bank
Misinformed about wages being credited
Number of visits made to the bank to access the wages for the last withdrawal
Factor 2
(ML2)
0.749
0.643
0.641
Factor 3
(ML3)
0.571
0.971
Factor 4
(ML4)
0.452
0.653
Factor 1
(ML1)
0.691
0.988
Table A.2.1(e):
Correlation
of variables
with respective
factors to
demonstrate
the dominant
variables for
each factor

131
Table A.2.1(f) summarises the proportion of variance explained by each factor in
descending order.
The four factors taken together account for roughly 57 percent of the total variation
in the dataset.
6. As a reminder, the idea of hardship is latent and what we have attempted here
is to capture that using measurable features. We now have four interpretable
factors to depict the drivers of the underlying structure of hardship faced by the
respondents. We then combined the different variables for a factor, based on their
loadings, to arrive at a score for each individual on the factor. Factor scores are an
optimally weighted linear combination of variables and can be used as proxies for
all the measured variables to explore an underlying structure. So each individual
is assigned a score on each factor. This is akin to ranking the individuals based on
these measurable features of hardships. We use a regression-based method that
fits a linear regression of the variables to estimate the factor scores. The factor
scores so obtained have zero mean and the variance is equal to the squared multiple
correlations between the variables and the corresponding factor. As a reminder
our analysis revealed four distinct factors with the following interpretation -- (a)
hardships due to biometric authentication issues, (b) hardships due to cost (c)
hardship due to transparency and accountability with respect to passbooks and (d)
hardship due to the visits to the bank due to misinformation. Since the proportion
of variance explained by each factor is different, we need to account for that when
combining the factor scores of individuals.
7. Once we obtain the factor scores of each individual for each factor, we have to
combine the factor scores of each factor in a meaningful way. We achieved this by
combining the factor scores of each factor using a weighted linear combination of
the factor scores weighted by the contribution of each factor to the total variation.
This is more meaningful than combining using equal weights. This is statistically
called weighting by the ‘communality’ of each factor to the total sum of squares.
Proportion of variance explained 19.11 10.03 5.23
Variables Factor 2 Factor 3 Factor 4Factor 1
22.12
Table A.2.1(f):
Proportion
of variance
explained

132
Upon completion of the above seven steps, we get a ‘Net Hardship Score using
Confirmatory Factor Analysis’ that we have called ‘Confirmatory Factor Score’. We have
done this exercise for both bank users and CSP/BC users.
If the reported simple average of the reported hardship variables adequately capture the
underlying hardship structure, then the simple average scores of respondents should
exhibit high correlation with the factor scores of individuals created using the procedure
just described. So people with low average reported hardship would also have low factor
scores and people with high average reported hardship should have high factor scores in
case the simple average reported hardship serves as a reasonable candidate of reported
hardship.
Figure A.2.1 (g) shows the correlation between the simple average reported hardship
scores (x axis) of bank users with the confirmatory factor scores (y axis) for each state.
As is evident from Figure A.2.1(g) people with low simple average hardship scores tend
to have low confirmatory factor scores and those with high simple average hardship
scores have high factor scores.
Figure
A.2.1(g):
Correlation
between
Simple Average
Hardship
Scores with the
Confirmatory
Factor Scores
for bank users

133
A statistical test of correlation between the simple average reported hardship scores
and the confirmatory factor scores is presented in Table A.2.1(h). Column 2 gives the
non-parametric rank correlation between the two variables and within parenthesis we
show the results of the test of association between the two variables. Column 3 gives
the classical Pearson’s product moment correlation between the two variables and
the parenthesis gives the p value of the test of association between the two variables.
The null hypothesis in each of these tests is that the two variables are uncorrelated.
From the incredibly low p values (much less than 10^(-16)) we can safely conclude that
the two variables are highly correlated. Indeed, what this actionably means for us is
that the simple average reported hardship scores are a very good proxy for using the
confirmatory factor scores. Column 4 gives a 95 percent confidence interval for the
product moment correlation between these two variables. Theoretically, Kendall’s Tau
will always be smaller than the classical Pearson’s product moment correlation.
We performed each of the above steps for CSP/BC users as well. Instead of going through
the details again, we present below some key summaries from the exploratory and
confirmatory factor analysis models for CSP/BC users.
The Kaiser-Meyer-Olkin (KMO) factor adequacy for CSP/BC hardship variables is 0.51.
The parallel analysis scree plots suggested a 3 factor model. Table A.2.1(i) gives the factor
model adequacy and diagnostics for the CSP/BC users.
State Kendall’s Tau Between
Simple Average
Reported Hardship
and Confirmatory
Factor Scores
(p value)
95 percent Confidence
Interval for the
Pearson’s correlation
coefficient
AndhraPradesh
0.69(p value < 2.2e-16)
Jharkhand
Rajasthan
Pearson’s Correlation
Between Simple
Average Reported
Hardship and
Confirmatory Factor
Scores (p value)
0.84(p value < 2.2e-16)
(0.80,0.87)
Table
A.2.1(h):
Correlation
between
Simple Average
Reported
Hardship and
Confirmatory
Factor Scores
0.80(p value < 2.2e-16)
0.91(p value < 2.2e-16)
(0.89,0.93)
0.66(p value < 5.4e-16)
0.81(p value < 2.2e-16)
(0.78,0.84)
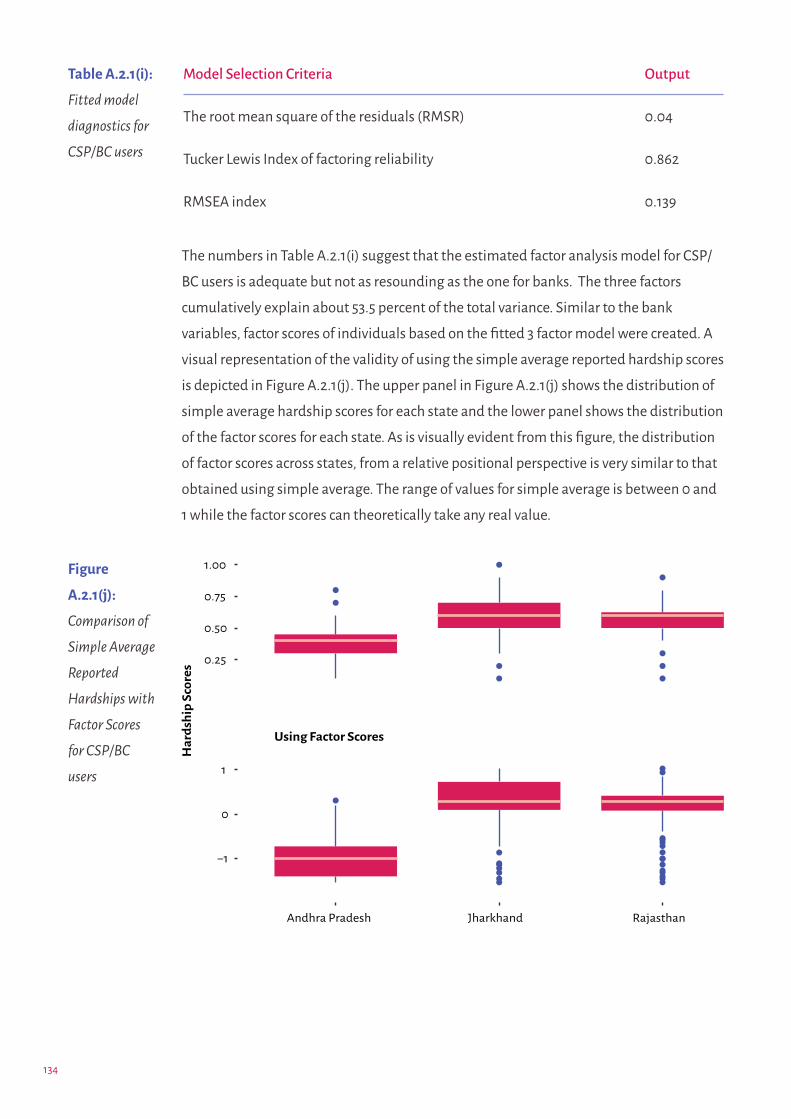
134
The numbers in Table A.2.1(i) suggest that the estimated factor analysis model for CSP/
BC users is adequate but not as resounding as the one for banks. The three factors
cumulatively explain about 53.5 percent of the total variance. Similar to the bank
variables, factor scores of individuals based on the fitted 3 factor model were created. A
visual representation of the validity of using the simple average reported hardship scores
is depicted in Figure A.2.1(j). The upper panel in Figure A.2.1(j) shows the distribution of
simple average hardship scores for each state and the lower panel shows the distribution
of the factor scores for each state. As is visually evident from this figure, the distribution
of factor scores across states, from a relative positional perspective is very similar to that
obtained using simple average. The range of values for simple average is between 0 and
1 while the factor scores can theoretically take any real value.
Model Selection Criteria
The root mean square of the residuals (RMSR)
Tucker Lewis Index of factoring reliability
RMSEA index
Output
0.04
0.862
0.139
Table A.2.1(i):
Fitted model
diagnostics for
CSP/BC users
Figure
A.2.1(j):
Comparison of
Simple Average
Reported
Hardships with
Factor Scores
for CSP/BC
users

135
Table A.2.1(k) presents the results of the test of independence between the simple
average reported hardship score and the corresponding net hardship confirmatory factor
scores for CSP/BC users. We could still rely on the simple average scores. The p-values,
given in parenthesis, are much lower than standard thresholds of 0.01. We can therefore
infer that there is a high degree of association between the reported hardship scores and
the confirmatory factor scores for CSP/BC users across the states.
Based on these analyses, we can conclude that our choice of using simple reported
hardship scores for bank users and CSP/BC users are statistically valid and robust.
Multiple Factor Analysis (MFA)Confirmatory factor analysis discussed in the previous subsection adequately justified
using a simple average of some variables to arrive at hardship scores. We explored
another method called Multiple Factor Analysis (MFA) to assess the adequacy of using
simple average. Using CFA worked very well for users of banks, we found that MFA was
able to capture the underlying variability structure of CSPs better.
State Kendall’s Tau Between
Simple Average
Reported Hardship
and Confirmatory
Factor Scores for CSP/
BC Users (p value)
95 percent Confidence
Interval for the
Pearson’s correlation
coefficient
AndhraPradesh
0.35(p value < 1.8e-07)
Jharkhand
Rajasthan
Pearson’s Correlation
Between Simple
Average Reported
Hardship and
Confirmatory Factor
Scores for CSP/BC
Users (p value)
0.42(p value < 8.2e-07)
(0.27,0.55)
Table
A.2.1(k):
Correlation
tests between
simple average
reported scores
and the factor
scores based
on the 3 factor
model for CSP/
BC users 0.60(p value < 2.2e-16)
0.75(p value < 2.2e-16)
(0.70,0.79)
0.57(p value < 2.2e-16)
0.81(p value < 2.2e-16)
(0.76,0.85)
A.2.1

136
MFA, developed by Escofier and Pages (1994) is useful in analysing relationships in
situations when there is a natural grouping of variables into distinct categories. For
example, to assess hardships of users of BCs or CSPs, there were two questions checking
for biometric related problems, three questions concerning getting receipts for
transactions, three different questions concerning the cost incurred for transactions and
two other questions concerning difficulties about being able to update passbooks and
queues at the CSP. Each group of variables supply a different kind of information on each
individual and it is instructive to understand the similarities and differences between
groups from an individual’s perspective. MFA studies the relationships between
individuals based on a set of grouped variables and studies the relationships between
variables based on the responses.
In situations where there are many questions pertaining to one category and fewer
questions in another category, a general factor analysis tends to bias the category
with more questions. MFA addresses this problem by balancing various categories by
normalising the contribution of each category’s variability to the total variability. It can
therefore be thought of as a weighted Principal Components Analysis. In this method,
the same weights are used for all variables within a category so that the category
structure is preserved. Mathematically, this is achieved by setting the variance of the
principal axis of each group to 1.
Having created 4 natural groups -- biometric, receipt, cost, other -- we created the key
dimensions of variability of the respondents followed by a score for each respondent
in each dimension. The dimensions are linear combinations of the groups of variables.
The coordinates of the observations, respondents in our case, on the components (or
dimensions) are the multiple factor scores. Two individuals ‘close to each other’ in
the map of the principal dimensions are considered to be exhibiting a similar profile.
Consider Figure A.2.2(a).

137
Dim 1, on the x-axis, is the first principal dimension: a linear combination of the variables
that capture the maximal variability. Dim 2, on the y-axis, is another linear combination
of the variables that capture the second highest variability. Observe the cluster of
individuals from Jharkhand (in blue) along the vertical line at 0 and observe four
individuals from Andhra Pradesh (in red) along the horizontal line at 0. MFA identifies
the respondents in blue clusters as similar and the respondents in the red cluster as
similar. Let’s look at their hardship responses to assess their similarity.
We see from the data that the three individuals from JH (blue cluster) represented in
Figure A.2.2(a) faced hardship in at least 7 out of 9 questions. However, the individuals
from AP (red cluster) faced hardship only in the questions pertaining to biometric issues
and hence they are ‘close’ to each other in the above figure. MFA helps us identify such
relationships and assigns scores to individuals based on their responses. MFA helps us
identify such relationships and assigns scores to individuals based on their responses.
MFA scores of each individual from each dimension were then combined to create a
single hardship score for each individual.
The first principal dimension obtained by doing MFA is the variable that maximises
the connection between each group. The second dimension is obtained, orthogonal to
the first, after accounting for all the information used to calculate the first dimension.
Subsequent dimensions are found in this manner.
Figure A.2.2(a):
Individuals
Contributing to
the Dominant
Dimensions

138
Suppose v1 denotes the first principal dimension then a measure called the projected
inertia of all the variables of the jth group denoted by Lg(Kj ,v1) that lies between 0 and
1 is maximised. This can be thought of as equivalent of R2 used in standard linear
regressions. When Lg is 0, it implies that all the variables in the jth group are uncorrelated
with the first principal dimension and when Lg is 1 then the first principal dimension v1
is the same as the first principal component of the jth group. For two groups of variables,
we can use the Lg measure to construct a correlation-type measure called RV to see how
close two groups are. RV will lie between 0 and 1. For our case, we can construct, for
example, such a measure based on respondents facing hardship due to biometric issues
and say hardship due to cost factors. If RV between two groups is close to 0 then we can
say that the hardship faced by respondents of one group are not necessarily the same
respondents facing hardship in another group.
Table A.2.2(b) gives a normalised RV measure between the groups. What we can say is
that the variables due to the biometric issues give a more multidimensional description
of the hardship as the Lg values are highest for that group among all the groups.
RV Matrix: Between groups Association
Biometric Receipt Cost Other MFABiometric 1.000 0.042 0.017 0.043 0.041Receipt 0.042 1.000 0.076 0.037 0.081Cost 0.017 0.076 1.000 0.016 0.747Other 0.043 0.037 0.016 1.000 0.677MFA 0.041 0.081 0.747 0.677 1.000
We can see that the numerical measure of association between groups is quite low. None
of them exceed 0.10. What this means is that the same respondents are not, on average,
going through all forms of hardships. So, a set of respondents while facing biometric
issues are not necessarily the same set of people subject to other forms of hardships and
a set of respondents facing cost related problems are not necessarily incurring receipt
related problems.
The last row and last column of the above RV matrix gives the MFA configuration. Based
on the coordinates of individuals on the dimensions, RV for MFA gives an ‘average’ RV
value for the constructed MFA. The hardship due to cost and the ‘other’ category are
closest to the mean MFA configuration as the RV between MFA and cost is the highest,
around 0.747.
Table A.2.2(b):
RV Matrix for
Between Group
Association
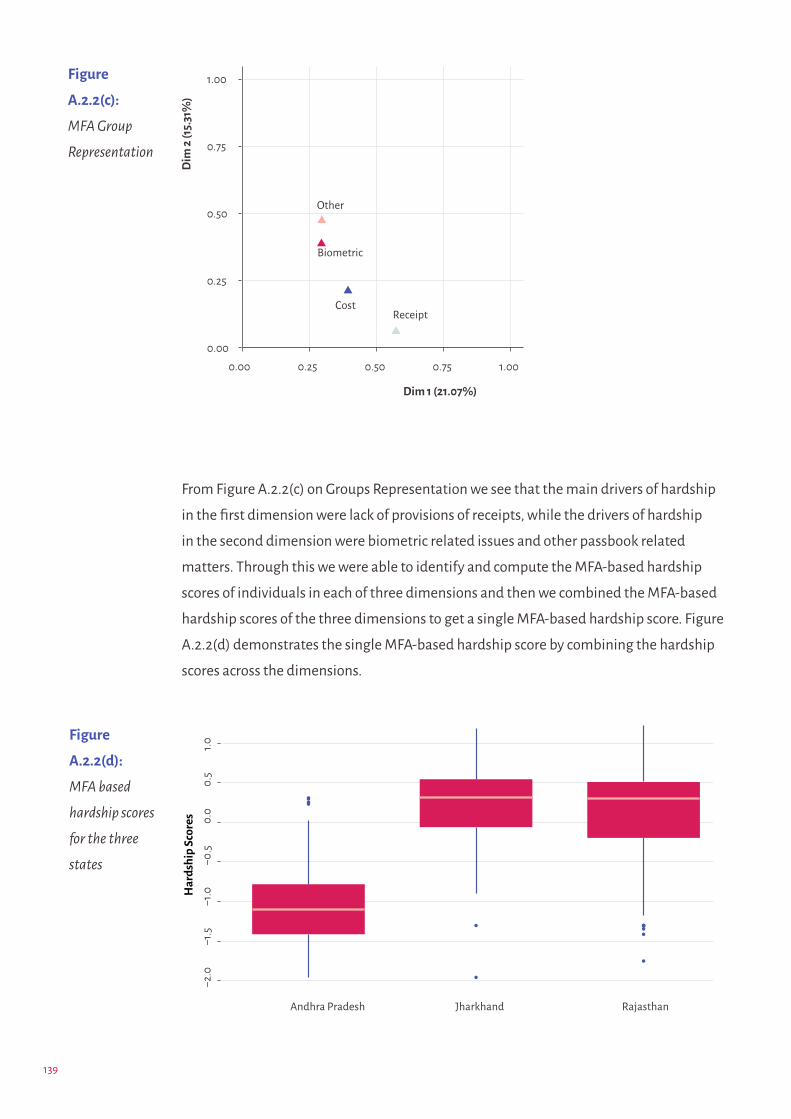
139
From Figure A.2.2(c) on Groups Representation we see that the main drivers of hardship
in the first dimension were lack of provisions of receipts, while the drivers of hardship
in the second dimension were biometric related issues and other passbook related
matters. Through this we were able to identify and compute the MFA-based hardship
scores of individuals in each of three dimensions and then we combined the MFA-based
hardship scores of the three dimensions to get a single MFA-based hardship score. Figure
A.2.2(d) demonstrates the single MFA-based hardship score by combining the hardship
scores across the dimensions.
Figure
A.2.2(c):
MFA Group
Representation
Figure
A.2.2(d):
MFA based
hardship scores
for the three
states

140
Figure A.2.2(e) reproduces the simple average reported hardship score for respondents
who use the CSP/BC for their transactions.
As can be easily gleaned from Figures A.2.2(d) and A.2.2(e), the distribution of MFA
based hardship scores of individuals is very similar to the distribution of the simple
average based hardship scores of individuals. For further robustness checks, we tested
whether the rank correlation between the simple average scores and the MFA is zero
and the statistical test of zero correlation was rejected at 1 % significance level indicating
that the simple average score can be used as a proxy for the MFA scores. AP fares low on
hardship in most of the categories and also overall.
Figure
A.2.2(e):
Simple
Average
Hardship Score
for CSP/BC
users
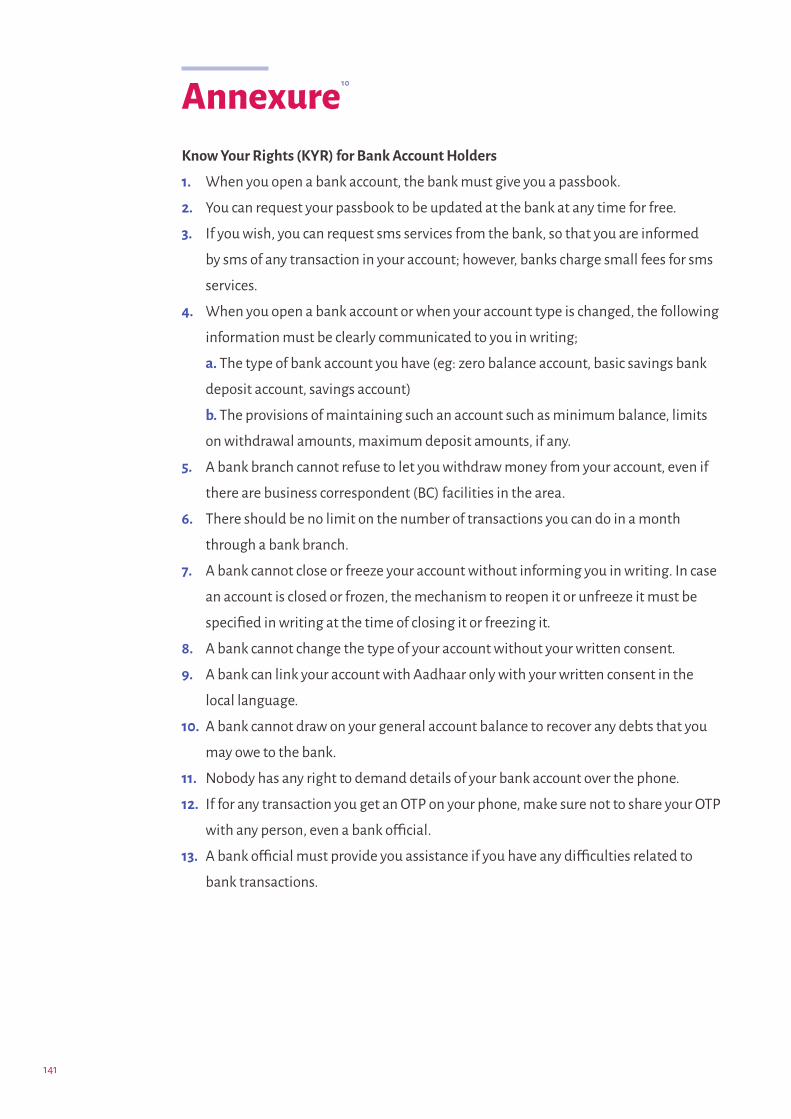
141
Annexure Know Your Rights (KYR) for Bank Account Holders
1. When you open a bank account, the bank must give you a passbook.
2. You can request your passbook to be updated at the bank at any time for free.
3. If you wish, you can request sms services from the bank, so that you are informed
by sms of any transaction in your account; however, banks charge small fees for sms
services.
4. When you open a bank account or when your account type is changed, the following
information must be clearly communicated to you in writing;
a. The type of bank account you have (eg: zero balance account, basic savings bank
deposit account, savings account)
b. The provisions of maintaining such an account such as minimum balance, limits
on withdrawal amounts, maximum deposit amounts, if any.
5. A bank branch cannot refuse to let you withdraw money from your account, even if
there are business correspondent (BC) facilities in the area.
6. There should be no limit on the number of transactions you can do in a month
through a bank branch.
7. A bank cannot close or freeze your account without informing you in writing. In case
an account is closed or frozen, the mechanism to reopen it or unfreeze it must be
specified in writing at the time of closing it or freezing it.
8. A bank cannot change the type of your account without your written consent.
9. A bank can link your account with Aadhaar only with your written consent in the
local language.
10. A bank cannot draw on your general account balance to recover any debts that you
may owe to the bank.
11. Nobody has any right to demand details of your bank account over the phone.
12. If for any transaction you get an OTP on your phone, make sure not to share your OTP
with any person, even a bank official.
13. A bank official must provide you assistance if you have any difficulties related to
bank transactions.
10

142
Endnotes1. In Maneka Gandhi v. Union of India ((1978) SCC (1) 248) the Supreme Court held that
‘The right to live includes the right to live with human dignity and all that goes along
with it...and also the right to carry on functions and activities as constitute the bare mini-
mum expression of human self.’
2. In Olga Tellis v. Bombay Municipal Corporation ((1985) SCC (3) 545)) the Supreme Court
held that ‘An equally important facet of the right to life is the right to livelihood because
no person can live without the means of livelihood.;
3. ACH - Automated Clearing House for electronic funds transfers through account;
NACH - National ACH;
4. Swaraj Abhiyan vs Union of India (2018) WRIT PETITION(CIVIL) NO. 857 OF
2015 (https://main.sci.gov.in/supremecourt/2015/41648/41648_2015_Judge-
ment_18-May-2018.pdf)
5. AP was not part of the states analysed as AP uses a different MIS.
6. https://www.npci.org.in/product-overview/aeps-product-overview
7. https://www.thehindu.com/news/cities/Hyderabad/andhra-pradesh-ahead-of-other-
states-has-an-aadhaar-in-enrolment/article4721515.ece
8. https://nrega.nic.in/netnrega/writereaddata/Circulars/1948Social_Audit_.pdf
9. https://www.r-project.org/
10. With inputs from Prof. Jean Drèze and Prof. Sudha Narayanan

143
BibliographyAdhikari, Anindita, and Kartika Bhatia (2010): “NREGA Wage Payments: Can We Bank on
the Banks?” Economic & Political Weekly 45 (01): 30–37.
Aggarwal, Ankita ( 2017) “Tyranny of MGNREGA’s Monitoring System.” Economic & Political
Weekly 52 (37): 24–26.
Azur, Melissa J., Elizabeth A. Stuart, Constantine Frangakis, and Philip J. Leaf (2011):
“Multiple Imputation by Chained Equations: What Is It and How Does It Work?”
International Journal of Methods in Psychiatric Research 20 (1): 40–49.
Burgess, Robin, and Rohini Pande (2005): “Do Rural Banks Matter? Evidence from the
Indian Social Banking Experiment.” The American Economic Review 95 (3): 78–795.
Dhorajiwala, Sakina (2018). “MGNREGA: Honest Labour’s Love Lost as Government
Makes Payment Process Complex.” Economic Times, April 25, 2018. https://economictimes.
indiatimes.com/blogs/et-commentary/mgnrega-honest-labours-love-lost-as-
government-makes-payment-process-complex/.
Dhorajiwala, Sakina, Jean Drèze, and Niklas Wagner (2019): “A Bridge to Nowhere.” The
Hindu, March 27, 2019. https://www.thehindu.com/opinion/lead/a-bridge-to-nowhere/
article26646131.ece.
Dhorajiwala, Sakina, and Rajendran Narayanan (2016): “All about Means and Ends.” The
Hindu, 04 2016.
Dhorajiwala, Sakina, and Niklas Wagner (2019): “Consent to Nothing; Aadhaar Based
Payment Systems in Welfare.” Ideas for India, August. https://www.ideasforindia.in/topics/
governance/consent-to-nothing-aadhaar-based-payment-systems-in-welfare.html.
Drèze, Jean (2018): “Done By Aadhaar.” The Telegraph, August 3, 2018. https://www.
telegraphindia.com/opinion/done-by-aadhaar/cid/1467855.
———. 2020. “Has the Finance Minister Pulled a Fast One on MNREGA Workers?”
Thewire.In, March 27, 2020. Has the Finance Minister Pulled a Fast One on MNREGA
Workers?

144
Drèze, Jean, and Amartya Sen (2013): “An Uncertain Glory: India and Its Contradictions”. First
Edition. Delhi: Allen Lane, Penguin Group.
Escofier, Brigitte, and Jerome Pages (1994): “Multiple Factor Analysis (AFMULT Package).”
Computational Statistics & Data Analysis 18 (1): 121–40. https://doi.org/10.1016/0167-
9473(94)90135-X.
Hayton, James C., David G. Allen, and Vida Scarpello (2004): “Factor Retention Decisions
in Exploratory Factor Analysis: A Tutorial on Parallel Analysis.” Organizational Research
Methods 7 (2): 191–205. https://doi.org/10.1177%2F1094428104263675.
Horn, John L. 1965. “A Rationale and Test for the Number of Factors in Factor
Analysis.” Psychometrika 30 (2): 179–85. https://doi.org/10.1007/BF02289447.
Iqbal, Badar Alam, and Shaista Sami (2017): “Role of Banks in Financial Inclusion in India
Papel de Los Bancos En La Inclusión Financiera En La India.” Contaduria y Administracion 62
(2): 644–56.
Jha, Somesh (2019): “Consumer Spend Sees First Fall in 4 Decades on Weak Rural
Demand: NSO Data.” Business Standard, November 15, 2019. https://www.business-
standard.com/article/economy-policy/consumer-spend-sees-first-fall-in-4-decades-on-
weak-rural-demand-nso-data-119111401975_1.html.
Kesar, Surbhi, Rosa Abraham, Rahul Lahoti, Paaritosh Nath, and Amit Basole (2020):
“Pandemic, Informality, and Vulnerability: Impact of COVID-19 on Livelihoods in
India.” Centre for Sustainable Employment, Azim Premji University, June. https://dx.doi.
org/10.1002%2Fmpr.329.
Khera, Reetika (2017) “Impact of Aadhaar on Welfare Programmes.” Economic & Political
Weekly 52 (50): 61–70.
Kohli, Renu (2018): “Women & Banking: India’s Financial Inclusion Suffers from a Gender
Gap.” Financial Express, May 19, 2018. https://tinyurl.com/yyp5kjyy
Leyshon, Andrew, and Andrew Thrift (1995): “Geographies of Financial Exclusion:
Financial Abandonment in Britain and the United States” 20 (3): 312–41.

145
Ministry of Finance, Department of Expenditure (2017): “Office Memorandum on Delay
in Payments of MGNREGA - Study of PFMS Data - Reg.” Government of India.
Ministry of Rural Development (2008): “NREGA Operational Guidelines (2008): The
National Rural Employment Guarantee Act 2005 (NREGA).” New Delhi: Government
of India. https://www.slideshare.net/ginosmit/nrega-national-rural-employment-
guarantee-act-guidelines-eng-presentation.
——— (2013): “Operational Guidelines 2013: Mahatma Gandhi National Rural
Employment Guarantee Act (MGNREGA).” https://nrega.nic.in/Circular_Archive/archive/
Operational_guidelines_4thEdition_eng_2013.pdf.
——— (2020): “The Gazetteer of India (CG-DL-E-24032020-218892).” https://nrega.nic.
in/netnrega/writereaddata/Circulars/2410Wage_rate_notification_for_FY2020-21.pdf.
Mor, Nachiket, Bindu Ananth, Prakash Bakshi, Bharat Doshi, A.P. Hota, Sunil Kaushal,
Roopa Kudva, Zia Mody, S.S.Mundra, Vikram Pandit, Ramesh Ramanathan, Shikha
Sharma, A. Udgata (2013): “Committee on Comprehensive Financial Servicesfor
Small Businesses and Low Income Households.” https://rbidocs.rbi.org.in/rdocs/
PublicationReport/Pdfs/CFS070114RFL.pdf.
Nandy, Debmalya (2018): “MGNREGA’s Information System Flawed, Misguiding.”
Down to Earth, December 19, 2018. https://www.downtoearth.org.in/blog/agriculture/
mgnrega-s-information-system-flawed-misguiding-62545.
———. (2019): “Why Linking MGNREGA Payments to Aadhaar Is a Mistake.” Down to
Earth, March 21, 2019. https://www.downtoearth.org.in/blog/agriculture/why-linking-
mgnrega-payments-to-aadhaar-is-a-mistake-63680.
Narayanan, Rajendran, and Sakina Dhorajiwala (2019a): “The Minimum Wage Solution.”
The Hindu, October 10, 2019. https://www.thehindu.com/opinion/op-ed/the-minimum-
wage-solution/article29629570.ece.
——— (2019b): “The Namesake: Human Costs of Digital Identities.” Economic & Political
Weekly 54 (49). https://www.epw.in/engage/article/namesake-human-costs-digital-
identities.

146
Narayanan, Rajendran, Sakina Dhorajiwala, and Rajesh Golani (2017): “MGNREGA
Payout Delays Underestimated.” Business Standard, August 8, 2017. https://www.business-
standard.com/article/opinion/mgnrega-payout-delays-underestimated-117080701296_1.
html.
Narayanan, Rajendran, Sakina Dhorajiwala, and Rajesh Golani (2018): “With Shifting
Accountability on NREGA Payment Delays, Workers Continue to Be Denied Their Due,”
December 5, 2018. https://thewire.in/economy/nrega-payment-delay.
——— (2019): “Analysis of Payment Delays and Delay Compensation in MGNREGA:
Findings Across Ten States for Financial Year 2016–2017.” Indian Journal of Labour Economics
62 (1): 113–33. https://doi.org/10.1007/s41027-019-00164-x.
Narayanan, Rajendran, Sakina Dhorajiwala and Sabhil Nath Paikra (2017): “Aadhaar
Trouble: How a Woman’s Wages under MGNREGA Were Transferred to Someone Else’s
Account.” Scroll.In, April 9, 2017. https://scroll.in/article/833487/aadhaar-trouble-how-a-
womans-wages-under-mgnrega-were-transferred-to-someone-elses-account.
Narayanan, Rajendran, and Madhubala Pothula. 2018. “A Triple Blow to Job Guarantee
Scheme.” The Hindu, May 16, 2018. https://www.thehindu.com/opinion/op-ed/a-triple-
blow-to-job-guarantee-scheme/article23896197.ece.
Narayanan, Sudha, Upasak Das, Yanyan Liu, and Christopher B. Barrett (2017):
“The ‘‘Discouraged Worker Effect” in Public Works Programs: Evidence from the
MGNREGA in India.” World Development 100 (July): 31–44. http://dx.doi.org/10.1016/j.
worlddev.2017.07.024.
Oxfam India (2018): “Oxfam Inequality Report 2017.” https://tinyurl.com/y5plwfbr
Parthasarathy, Anognya, and Rajendran Narayanan (2019): “Digital India’s ‘Magic
Wand’ Creates More Problems Than Solutions In Jharkhand, Finds Survey.” Indiaspend,
November 25, 2019. https://www.indiaspend.com/digital-indias-magic-wand-creates-
more-problems-than-solutions-in-jharkhand-finds-survey/.

147
Raghunathan, Trivellore E., James M. Lepkowski, John Van Hoewyk, and Peter
Solenberger (2001): “A Multivariate Technique for Multiply Imputing Missing Values
Using a Sequence of Regression Models.” Survey Methodology, Statistics Canada,
Catalogue No. 12-001, 27 (1): 85–95.
Murgai, Rinku and Martin Ravallion (2005): “Employment Guarantee in Rural India:
What Would It Cost and How Much Would It Reduce Poverty?” Economic & Political Weekly
40 (31): 3450–55.
Ray, Debraj, and S. Subramanian (2020): “India’s Lockdown: An Interim Report.”
Rubin, Donald B. 1987. Multiple Imputation for Nonresponse in Surveys. New York: John
Wiley & Sons, Inc.
Sabhikhi, Inayat, Rahul Lahoti, and Rajendran Narayanan (2019): “Common
Service Centres: Emperor’s New Clothes.” The Indiaforum, November. https://www.
theindiaforum.in/article/common-service-centres-emperor-s-new-clothes.
Schafer, Joseph L., and John W. Graham (2002): “Missing Data: Our View of the State of
the Art.” Psychol Methods 7 (2): 147–77.
Seshadri, Suresh (2019): “What Is Consumer Expenditure Survey, and Why Was Its 2017-
2018 Data Withheld?,” November 24, 2019. https://tinyurl.com/y4bba6l9
Stranded Workers Action Network (2020a): “21 Days and Counting.” http://
strandedworkers.in/mdocuments-library/.
——— (2020b): “32 Days and Counting.” http://strandedworkers.in/mdocuments-
library/.
Subramanian, S. (2019): “What Is Happening to Rural Welfare, Poverty, and Inequality in
India?” The Indiaforum, no. December 6, 2019 (December). https://www.theindiaforum.
in/article/what-happened-rural-welfare-poverty-and-inequality-india-between-2011-12-
and-2017-18.
148
The World Bank (2017): “Global Findex Survey.” https://globalfindex.worldbank.org/#GF-
ReportChapters.
van Buuren, Stef (2007): “Multiple Imputation of Discrete and Continuousdata by Fully
Conditional Specification.” Statistical Methods in Medical Research 16: 219–42.
van Buuren, Stef, and Karin Groothuis-Oudshoorn (2011): “Mice: Multivariate Imputation
by Chained Equations in R.” Journal of Statistical Software 45 (3). http://dx.doi.org/10.18637/
jss.v045.i03.
Vanaik, Anish, and Siddhartha (2008): “Bank Payments: End of Corruption in NREGA?”
Economic & Political Weekly 43 (17).
Revelle, William (2020): Psych: Procedures for Psychological, Psychometric, and Personality
Research (version 1.9.12.31). R. https://cran.r-project.org/web/packages/psych/index.html.

149

150
Azim Premji University
Pixel Park, PES Campus, Electronic City, Hosur Road
Bangalore 560100
080-6614 5136
www.azimpremjiuniversity.edu.in
Facebook: /azimpremjiuniversity Instagram: @azimpremjiuniv Twitter: @azimpremjiuniv