Embed Size (px)
Citation preview

LEHMAN EQUITY RESEARCH TIPPING:
EVIDENCE IN THE STOCK PRICE DATA
Report of
Professor Steven P. Feinstein, Ph.D., CFA
March 24, 2010
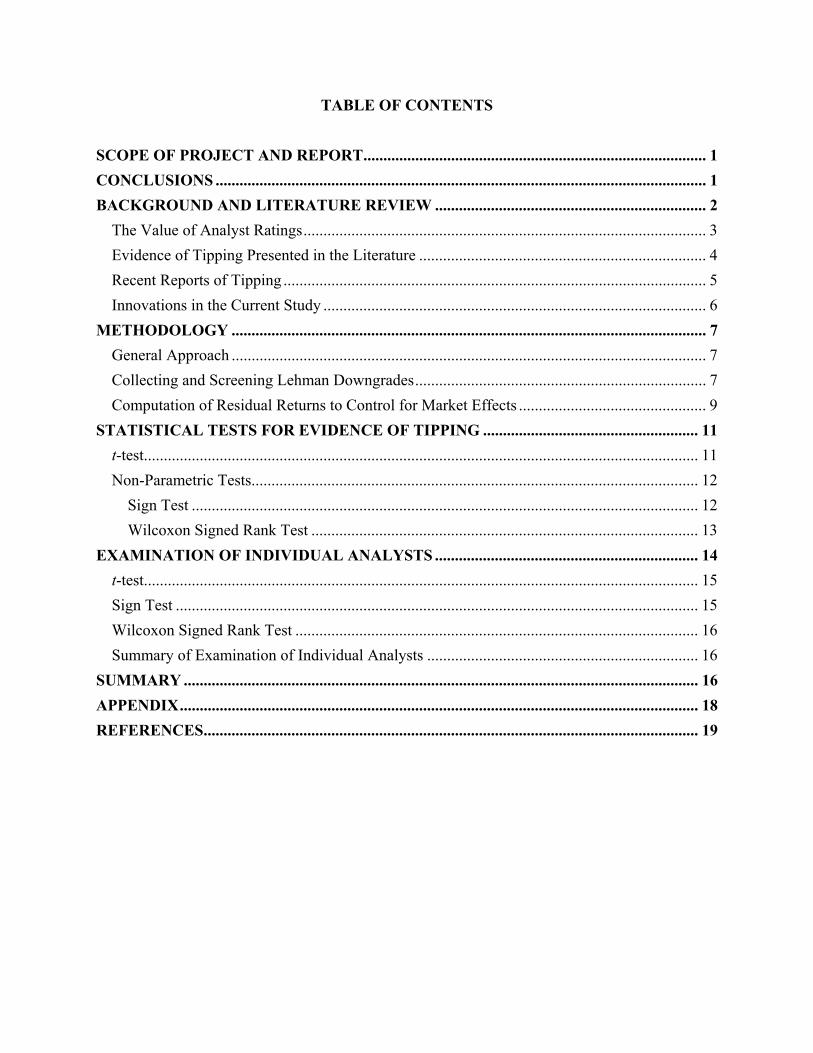
TABLE OF CONTENTS
SCOPE OF PROJECT AND REPORT ...................................................................................... 1CONCLUSIONS ........................................................................................................................... 1BACKGROUND AND LITERATURE REVIEW .................................................................... 2
The Value of Analyst Ratings ..................................................................................................... 3Evidence of Tipping Presented in the Literature ........................................................................ 4Recent Reports of Tipping .......................................................................................................... 5Innovations in the Current Study ................................................................................................ 6
METHODOLOGY ....................................................................................................................... 7General Approach ....................................................................................................................... 7Collecting and Screening Lehman Downgrades ......................................................................... 7Computation of Residual Returns to Control for Market Effects ............................................... 9
STATISTICAL TESTS FOR EVIDENCE OF TIPPING ...................................................... 11t-test........................................................................................................................................... 11Non-Parametric Tests................................................................................................................ 12
Sign Test ............................................................................................................................... 12Wilcoxon Signed Rank Test ................................................................................................. 13
EXAMINATION OF INDIVIDUAL ANALYSTS .................................................................. 14t-test........................................................................................................................................... 15Sign Test ................................................................................................................................... 15Wilcoxon Signed Rank Test ..................................................................................................... 16Summary of Examination of Individual Analysts .................................................................... 16
SUMMARY ................................................................................................................................. 16APPENDIX .................................................................................................................................. 18REFERENCES ............................................................................................................................ 19

SCOPE OF PROJECT AND REPORT
1. I, Steven P. Feinstein, am an Associate Professor of Finance and the holder of the Donald
P. Babson Chair in Applied Investments at Babson College. I have served as the Director
of the Stephen D. Cutler Investment Management Center at Babson College, a research and
education center dedicated to the study and teaching of investments and capital markets.
2. I have a Ph.D. in Economics from Yale University, a Master of Philosophy degree in
Economics from Yale University, a Master of Arts in Economics from Yale University, and
a Bachelor of Arts degree in Economics from Pomona College. I also hold the Chartered
Financial Analyst (“CFA”) designation, granted by the CFA Institute. My curriculum
vitae, is attached as Exhibit-1.
3. I was asked by Phillips & Cohen LLP to determine if there is evidence in market data
indicating that equity rating downgrades issued by Lehman Brothers (“Lehman” or the
“Company”) were leaked to select market participants prior to public release.
4. In reaching my conclusions in this matter, I relied entirely on publicly available
information and data. I analyzed Lehman Brothers equity research reports and ratings
changes, equity research reports and ratings changes issued by other analyst firms, news
and announcements pertaining to the covered companies, and the stock price behavior of
the subject companies.
5. This report presents my methodology, findings, and conclusions. I may revise this analysis
and report as additional information becomes available and as I conduct further research.
CONCLUSIONS
6. Based on widely used and generally accepted quantitative methods, I have determined, to a
high degree of statistical certainty, that the price behavior of stocks downgraded by
Lehman Brothers during 2004 to 2008 indicates that information about imminent
downgrades was likely communicated privately to select market participants prior to the
public announcements.
7. More specifically, I find that stocks exhibited significantly different price behavior on the
two trading days preceding a rating downgrade by Lehman Brothers than they did on other
1

days. The subject stocks, on average, exhibited significantly negative returns on those
days. These results were evident even after controlling for market effects, other releases of
company information, and downgrades by other brokerage firms.
8. Several statistical tests confirm the result that the behavior of stocks downgraded by
Lehman Brothers exhibited anomalous trading behavior on the two trading days preceding
the downgrade.
9. This study provides compelling evidence that Lehman Brothers engaged in “tipping,” the
practice of privately informing select market participants of upcoming rating revisions,
likely causing damage to the general population of investors.
10. Further analysis uncovers unusual stock price behavior, consistent with tipping, preceding
the downgrades issued by certain individual analysts at Lehman Brothers.
11. While previous studies detected evidence of tipping in short sale activity and institutional
trading volume, this current study finds evidence directly in stock prices. Moreover, prior
studies relied on proprietary data to investigate tipping, whereas this current study detects
evidence of tipping in publicly available market data.
BACKGROUND AND LITERATURE REVIEW
12. “Sell-side” securities analysts are professionals who work for brokerage houses and
investment banks. They conduct research on market sectors, companies, and securities,
most notably the stock of publicly traded companies. Securities analysts typically issue
reports and ratings on the companies and securities they cover, such as “buy,” “hold,”
“sell,” or similar evaluations and recommendations.
13. Analysts from brokerages and investment banks publish reports in which they present
information, interpretations of data, analyses, and their ratings.
14. Analyst research helps market participants acquire relevant information and understand the
implications of that information for valuation and investment decisions. Consequently,
securities analysts facilitate the flow and digestion of information within the marketplace.
These functions promote market efficiency.
2

The Value of Analyst Ratings
15. It is well established that analyst ratings and recommendations are material information.
Analyst ratings influence stock prices. For example, Stickel [1995] confirmed this fact
with empirical research:
“Brokerage house buy and sell recommendations influence stock prices.” “The Anatomy of the Performance of Buy and Sell Recommendations,” by Scott E. Stickel, Financial Analyst Journal, September-October 1995.
16. Womack [1996] similarly confirmed that analyst recommendations are material
information and found that the recommendations themselves impact stock prices,
independent of other information that may also be available:
“An analysis of new buy and sell recommendations of stocks by security analysts at major U.S. brokerage firms shows significant, systematic discrepancies between prerecommendation prices and eventual values. The initial return at the time of the recommendations is large, even though few recommendations coincide with new public news or provide previously unavailable facts.” “Do Brokerage Analysts’ Recommendations Have Investment Value?” by Kent L. Womack, Journal of Finance, March 1996.
17. Womack’s empirical research found the price impact of analyst recommendation revisions
to be considerable:
“In effect, an analyst’s recommendation revision means, ‘I have analyzed the publicly available information, and the current stock price is not ‘right.’ Then, on average, the stock price adjusts either up 5 percent (for added-to-buy changes) or down 11 percent (for added-to-sell changes) over the next several months. ... The three-day recommendation-period returns are large and in the direction forecast by the analysts. ... Thus, there is strong evidence that stock prices are significantly influenced by analysts’ recommendation changes, not only at the immediate time of the announcement but also in subsequent months.” “Do Brokerage Analysts’ Recommendations Have Investment Value?” by Kent L. Womack, Journal of Finance, March 1996.
3

18. More recently, Barber, Lehavy, McNichols, and Trueman [2001] discovered that investors
can profit from analyst recommendations, but the profit potential is greatest for those
investors who obtain and trade on the analysts’ recommendations most quickly:
“We document that purchasing (selling short) stocks with the most (least) favorable consensus recommendations in conjunction with daily portfolio rebalancing and a timely response to recommendation changes, yield annual abnormal gross returns greater than four percent. Less frequent portfolio rebalancing or a delay in reaction to recommendation changes diminishes these returns;” “Can Investors Profit from the Prophets? Security Analyst Recommendations and Stock Returns,” by Brad Barber, Reuven Lehavy, Maureen McNichols, and Brett Trueman, Journal of Finance, April 2001.
19. Other studies that found analyst recommendations to be valuable information include the
following: Chung and Jo [1996]; Kim, Lin, and Slovin [1997]; Branson, Guffey, and
Pagach [1998]; Michaely and Womack [1999]; Li [2002]; Bradley, Jordan, and Ritter
[2003]; Irvine [2003]; Jegadeesh, Kim, Krische, and Lee [2004]; Green [2006]; and Hsieh,
Ng, and Wang [2007].
20. In summary, the published finance literature finds that: a) analyst recommendations are
material information that impact stock prices; b) the value of analyst recommendations
diminishes with time; and c) investors who quickly obtain and trade on the basis of analyst
recommendations can earn abnormal profits.
Evidence of Tipping Presented in the Literature
21. Two recent studies examined the trading behavior of stocks listed on United States
exchanges in the days leading up to analyst recommendations. Both studies concluded that
select investors were forewarned of imminent analyst recommendations before public
release. This practice, known as “tipping,” allows investors who receive non-public
information to trade in advance of the announcement and profit from the expected stock
price movement.
22. Irvine, Lipson, and Puckett [2007] compared the level of institutional trading to the total
trading volume of all investors. Irvine, et al. found that institutional trading increased
4

significantly in the days prior to initial “buy” or “strong buy” analyst recommendations.
This study excluded initial recommendations that were preceded by earnings releases.
“We confirm that institutions buying before the recommendation release earn abnormal profits. Our results are consistent with institutional traders receiving tips regarding the contents of the forthcoming analysts’ reports.” “Tipping,” by Paul Irvine, Marc Lipson, and Andy Puckett, Review of Financial Studies, 2007.
23. Christophe, Ferri, and Hsieh [2010] found evidence of tipping in daily short-sale data.
They found that short selling increased significantly in the days just prior to the public
announcement of an analyst downgrade. Christophe, et al. controlled for earnings
announcements, other analysts’ recommendations, and “non-routine events,” which
otherwise could explain the phenomenon. Christophe, et al. concluded that the suspicious
spike in short-selling was caused by tipping:
“This paper studies short-selling prior to the release of analyst downgrades in a sample of 670 downgrades of NASDAQ stocks between 2000 and 2001. We documented abnormal levels of short-selling in the three days before downgrades are publicly announced. ... Overall, our tests strongly support the informed front-running hypothesis. We document a sharp increase in short-selling immediately before analyst downgrade announcements. ... The fact that the evidence strongly supports the tipping hypothesis raises serious issues regarding whether some clients of certain brokerage firms benefit from material private information about upcoming downgrades.” “Informed Trading Before Analyst Downgrades: Evidence from Short Sellers,” by Stephen E. Christophe, Michael G. Ferri, and Jim Hsieh, Journal of Financial Economics, January 2010.
24. Neither of these studies, however, established to what extent, if any, the practice of tipping
impacted trading prices, and whether or not tipping harmed the investing public.
Recent Reports of Tipping
25. In addition to articles published in the academic literature and professional journals,
evidence and allegations of tipping have been recently reported in the media.
5

26. On 1 March 2007, the Securities and Exchange Commission filed a complaint accusing a
UBS analyst of providing clients with non-public information regarding impending
recommendation changes. This development was reported in The Wall Street Journal and
Business Week.1
27. In August 2009, The Wall Street Journal published a report about “trading huddles” and
tipping by Goldman Sachs analysts.2
28. On 12 January 2010, an article in The New York Times reported that Goldman Sachs
acknowledged that “the firm’s Fundamental Strategies Group may have shared investment
ideas with the firm’s proprietary trading group or some clients before sharing them with
others.”3
29. Still, to date, no evidence has emerged that the practice of tipping has significantly
impacted the trading prices of securities or harmed investors.
Innovations in the Current Study
30. This current study differs from the previous research on tipping in three important respects.
First, both Irvine, et al. and Christophe, et al. relied on proprietary data sets. Irvine, et al.
used non-public data on institutional trading levels, and Christophe, et al. examined non-
public data on daily short-selling. Because their data is not publicly available, their
research cannot be generalized by independent researchers to securities and time periods
beyond the scope of the original research.
31. Second, neither of the two prior studies on tipping reported evidence of tipping directly in
security price data. Irvine, et al. found evidence in institutional trading volume and
Christophe et al. found evidence in short-selling activity. By uncovering the impact on
trading prices, the current study can be used to assess whether or not the practice harms the
investing public and to what extent.
32. Third, the prior studies aggregated across all major brokerages such their results could not
(and did not) identify a specific firm that engaged in tipping: 1 Litigation Release No. 20022, U.S. Securities and Exchange Commission, 1 March 2007. “Homing In On Trading Abuses,” by Matthew Goldstein, Business Week, 12 March 2007. “UBS: Notes on a Wall Street Scandal; How the lines between stock research and marketing can still blur so easy,” by Matthew Goldstein, Business Week, 26 March 2007. “Pleas in UBS Insider Case,” by Chad Bray, The Wall Street Journal, 28 February 2008. 2“Goldman's Trading Tips Reward Its Biggest Clients,” by Susanne Craig, The Wall Street Journal, 24 August 2009. 3 “Goldman Acknowledges Conflicts with Clients,” New York Times, 12 January 2010.
6

“... we do not have data that clearly link the identities of sellers and dealers involved in the trades (and are, accordingly unable to probe possible links between specific short sellers and brokerage firms that release analyst downgrades) ...” “Informed Trading Before Analyst Downgrades: Evidence from Short Sellers,” by Stephen E. Christophe, Michael G. Ferri, and Jim Hsieh, Journal of Financial Economics, January 2010.
33. Because the methodology in the current study uses price data that are publicly available,
abundant, and can cover any time period or analyst firm of interest, it can be used to
identify which firms have engaged in tipping.
34. In particular, focusing on Lehman Brothers downgrades, this study detects evidence of
tipping directly in stock price behavior. Consequently, this study’s findings, unlike those
in other studies, indicate that: a) Lehman Brothers apparently engaged in tipping, b) equity
valuations were impacted, and c) investors likely suffered damages caused by tipping.
METHODOLOGY
General Approach
35. Because the price impact of rating downgrades is more pronounced than the impact of
upgrades according to the published literature, I focused the current study on downgrades
only. Future research can generalize the study to upgrades.
36. The general approach was to collect a comprehensive sample of ratings changes for a
particular brokerage firm, control for confounding factors (as previous research has), and
then conduct tests to determine whether the behavior of stock price returns in the days
preceding ratings downgrades was different from typical stock price return behavior.
37. At the request of Phillips & Cohen LLP, I selected Lehman Brothers as the subject
brokerage firm.
Collecting and Screening Lehman Downgrades
38. Consistent with Green [2006], Irvine, et al. [2007], and Christophe, et al. [2010], I used the
I/B/E/S database as the source of analyst rating changes.4 I examined the period from 1
4 In 2000, the I/B/E/S was integrated with Thomson Financial/First Call.
7

January 2004 through 20 March 2008. The start date corresponds to the approximate time
which, according to Phillips & Cohen LLP, there is independent evidence of tipping
activity at Lehman Brothers. The end date is the date of the last Lehman Brothers rating
revision contained in the I/B/E/S database. In September 2008, Lehman Brothers declared
bankruptcy and Barclays Capital subsequently acquired Lehman Brothers’ North American
businesses.
39. I first retrieved all Lehman Brothers ratings changes pertaining to United States-based
companies issued during the selected timeframe. According to I/B/E/S, there were 3,751
such Lehman rating changes over the examination period.
40. From the I/B/E/S data, I determined which reported rating changes were upgrades and
which were downgrades. I removed all upgrades from my sample. The remaining sample
comprised 750 Lehman downgrades of U.S.-based companies.
41. Consistent with the screen applied by Christophe, et al. [2010], I removed from the sample
all Lehman downgrades that were preceded within seven calendar days by a ratings
downgrade by another major analyst firm of the same subject stock. This screen ensures
that anomalous price behavior preceding the Lehman downgrades could not potentially
have been caused by another firm’s downgrade.
To determine which analyst firms were “major” and therefore required removal of
confounding downgrade events in the sample, I used the analyst rankings listed in
Institutional Investor, as did Green [2006], Irvine, et al. [2007], and Christophe, et al.
[2010]. Each year from 2004 to 2006, Institutional Investor reported the firms it
considered to be the top 14 analyst firms. In 2007 and 2008, Institutional Investor listed
only the top 10 analyst firms. Exhibit-2 presents the major analyst firms according to
Institutional Investor.
42. Any Lehman Brothers downgrade which, according to the I/B/E/S data, was preceded
within seven calendar days by a downgrade from any of these major analyst firms was
removed from the sample. The remaining sample of 646 Lehman Brothers downgrades
therefore represents events in which Lehman Brothers issued a downgrade which did not
follow within one week of another firm’s downgrade.
43. As did Christophe, et al. [2010], I also screened out any downgrade event for which there
was a company earnings announcement within the period beginning five days before the
8

downgrade and ending one day after. This screen ensures that any potentially anomalous
price behavior could not have been caused by recently announced earnings results or
leakage of those results. After this screen, 507 Lehman downgrade events remained in the
sample.
44. I then removed any Lehman downgrade that was preceded by non-routine news within the
three trading days prior to the downgrade event. This screen removed downgrade events
where non-routine news such as announcements of mergers, guidance, and same store
sales, which could potentially cause unusual price movements. This screen was similar to
the screen performed by Christophe, et al. After removing these events from the sample,
391 Lehman downgrade events remained.
45. Finally, I eliminated companies for which there were insufficient data to perform the
requisite analysis. For example, stocks that were recent IPOs, spinoffs, or were delisted,
such that they did not have a year’s worth of trading data prior to the downgrade event,
were removed from the sample. This screen eliminated 30 downgrade events, leaving 361
events in the sample.
46. Because there is no basis to suspect that Lehman Brothers downgrades or tipping are
systematically correlated with IPOs, spinoffs, and delistings, this screen does not introduce
selection bias or survivorship bias.
47. The removal of a downgrade event from the sample does not imply that the downgrade was
or was not associated with tipping behavior, but rather its removal facilitates the
investigation of tipping behavior by controlling for confounding factors and eliminating
alternative potential explanations for unusual stock price behavior.
48. The screened sample comprised 361 Lehman downgrades and represented 318 unique
subject stocks. Exhibit-3 lists the 361 screened Lehman downgrade events.
Computation of Residual Returns to Control for Market Effects
49. To eliminate the potentially confounding market effect from the stock price returns I
examined, company-specific residual returns were computed using an estimated market
model for each of the 361 downgrade events. That is, for each downgrade event, I
regressed the respective subject stock’s returns against an intercept and the returns of the
9

overall stock market. The residuals from each such regression are the company-specific
returns with overall market effect removed.
50. This adjustment for isolating the portion of stock returns caused by company-specific
factors is widely used and generally accepted in professional and academic financial
research. Virtually all event studies, for example, make similar adjustments. Campbell,
Lo, and MacKinlay [1997], for example, explain these steps in their review of event study
methodology.5
51. I obtained stock prices from the Center for Research in Security Prices (CRSP). Share
prices were adjusted for dividends and spin-offs. All such distributions were added to the
share price on the ex-date, prior to calculating logarithmic return for that day. I used the
CRSP market index as the measure for the overall stock market.
52. Consistent with generally accepted practice, all returns used in the regressions were
computed as logarithmic returns, the natural logarithm of the ratio of the current day’s
closing price (plus dividends, if any) to the previous day’s closing price. Analysts and
researchers generally use logarithmic returns instead of percent price changes because of
various computational advantages.6
53. Each regression was estimated using daily returns for 252 trading days, or approximately
one year of data, ending 10 trading days prior to the publication of the respective
downgrade report. For example, to analyze the Lehman downgrade of 3COM Corporation
issued on 29 November 2006, I estimated the market model regression for 3COM over the
period 14 November 2005 to 13 November 2006. Using a one-year regression period
ending several days before the event of interest is a widely used and generally accepted
methodology. The buffer between the regression period and the event date ensures that the
regression results are not impacted by the event itself.
54. The regressions enable one to compute the portion of the stock return caused by trend (the
regression intercept term) and the market factor. For any particular stock on any particular
day, the regression “explained return” equals the stock market return times the regression’s
market coefficient, plus the regression intercept term.
5 Chapter 4 of The Econometrics of Financial Markets, by John Y. Campbell, Andrew W. Lo, and A. Craig MacKinlay, Princeton University Press, 1997. 6 The Appendix presents the mathematical formula for the logarithmic return, and a description and discussion of the measure.
10

55. By subtracting the explained return from the stock return, one computes the residual return,
which is the return of the stock after controlling for the overall stock market and trend. All
tests described below were run using residual returns to focus exclusively on company-
specific factors.
STATISTICAL TESTS FOR EVIDENCE OF TIPPING
56. I conducted a number of statistical tests on the residual returns preceding the 361 Lehman
downgrade events to investigate whether or not there was evidence of tipping in the stock
price data.
t-test
57. The first test was a cross-sectional t-test. A t-test determines whether the average return
among a particular group of stock returns is significantly different from the norm. I applied
the test to determine whether the average residual stock returns preceding Lehman
downgrades differed significantly from typical residual returns.
58. For each of the 361 Lehman downgrade events, I isolated each company’s residual return
on the trading day preceding the downgrade event. For each respective downgrade event, I
termed this return the “d minus one” (“d-1”) return. That is, the downgrade event is
labeled day “d” and one day prior is termed day “d-1”. Each downgrade event has an
associated d-1 return. I grouped all d-1 returns into a sample of 361 observations of such
d-1 returns.
59. Unless there is a systematic factor impacting residual returns on the day preceding a
downgrade event, the expected d-1 residual return for each stock should be zero, and
therefore the cross-sectional mean among all d-1 returns should also be zero.
60. If the cross-sectional mean of d-1 returns is not zero, that result would indicate the
existence of a systematic factor impacting d-1 returns. Such a result would indicate that the
behavior of stock prices on the day before a Lehman downgrade was unusual compared to
typical stock price behavior.
61. The average d-1 return within the sample of 361 events is -0.63%. This average return is
negative and large and diverges significantly from zero. The null hypothesis that the mean
d-1 return is zero can be rejected at the 5% significance level (t = -5.43; p 0.00%),
11

indicating to a high degree of statistical certainty that stocks exhibited unusual price
declines one day prior to Lehman downgrades.
62. I conducted the same statistical test on d-2 residual returns. That is, I repeated the same
statistical test on the residual returns two days prior to each Lehman downgrade event.
63. The average d-2 residual return across the sample is -0.43%. Again, the null hypothesis
that the mean d-2 return is zero is rejected at the 5% significance level (t = -2.82; p =
0.51%), indicating with a high degree of statistical certainty that there was a systematic
factor negatively impacting the prices of stocks downgraded by Lehman two trading days
before the public release of the downgrade report.
64. I repeated the same statistical test on the residual returns from d-3 through d-10. For d-3
through d-10, however, the respective mean residual returns did not significantly differ
from zero at the 5% significance level. Exhibit-4 presents the results of the t-tests.
65. The statistically significant average negative return on the two days immediately preceding
Lehman Brothers’ downgrades (d-1 and d-2) is consistent with tipping of the impending
downgrade. As noted above, earnings announcements, other firms’ downgrades, and other
non-routine events that could alternatively explain such anomalous price movements were
removed from the test sample.
Non-Parametric Tests
66. I conducted two non-parametric tests, the Sign test and Wilcoxon Signed Rank test, to
substantiate the robustness of the t-test results.
Sign Test
67. The Sign test counts the number of positive and negative residual returns in a particular
sample, (e.g. d-1, d-2, etc.), and determines if the median residual return of the population
is significantly different from zero by comparing the frequency of observed positive
residual returns with the frequency of observed negative residual returns. In the absence of
a systematic factor impacting the residual returns on the trading days leading up to a
Lehman downgrade, one would expect an equal likelihood of positive and negative residual
returns and a median return of zero. Alternatively, if there is tipping, one would expect
significantly more negative returns than positive returns on days prior to downgrades.
12

68. Within the sample of 361 d-1 residual returns, 229 were negative and 132 were positive.
According to the Sign test, the probability of this division is nearly zero under the null
hypothesis that negative and positive returns are equally likely. Consequently the empirical
evidence demonstrates that the median of d-1 residual returns is negative, and negative d-1
residual returns occur more frequently than positive d-1 residual returns. These results
indicate unusual stock return behavior consistent with tipping.
69. I repeated the Sign test on d-2 residual returns. Within the sample of 361 d-2 residual
returns, 200 were negative and 161 were positive. The probability of such a division under
the zero median null hypothesis is 4.54%. Consequently, the zero median hypothesis is
rejected at the 5% significance level, indicating that the median of d-2 residual returns is
negative, and negative d-2 residual returns occur more frequently than positive d-2 residual
returns. These results indicate unusual stock return behavior consistent with tipping on day
d-2.
70. I repeated the Sign test on d-3 through d-10 residual returns. Consistent with the t-tests, the
Sign tests indicate that there is no statistically significant abnormal stock price behavior
beyond two trading days preceding a Lehman downgrade. Exhibit-5 presents the results of
the Sign tests.
71. Results of the Sign test show, to a high degree of statistical certainty, that median residual
returns on d-1 and d-2 are negative and consistent with tipping.
Wilcoxon Signed Rank Test
72. The Wilcoxon Signed Rank test is another test that determines whether or not negative and
positive residual returns are equally likely. Similar to the Sign test, the Wilcoxon Signed
Rank test does not require an assumption of normal return distribution. The test examines
the positive or negative direction of residual return, but also considers the rank order of the
spread of each residual return from the median in reaching a conclusion.
73. The Wilcoxon Signed Rank test assumes that a random sample of paired differences and
the population of paired differences follow a symmetric distribution. A symmetric
distribution does not assume normality, but rather that there should simply be
approximately the same number of values above and below the median.
74. This test ranks the absolute values of the difference of each residual return from the
hypothesized median of zero from lowest to highest. Any differences with a value of zero
13

are discarded and tied differences are given average values. The ranks are then assigned
the sign of the original difference in the data, that is, the ranks of positive residual returns
are assigned a “+” sign and the ranks of negative residual returns are assigned a “–” sign.
75. The test statistic is the sum of the positive signed ranks. The test statistic is compared to an
expected value to test for significance.
76. I performed the Wilcoxon Signed-Rank test on the residual returns for each sample (d-1
through d-10). The results of the Wilcoxon Signed-Rank test are consistent with the results
of the t-test and the Sign test. Both d-1 and d-2 are statistically significant at the 5%
significance level (p-values for d-1 and d-2 are 0.00% and 1.44%, respectively).
Exhibit-6 presents the results of the Wilcoxon Signed-Rank tests.
77. I repeated the test on d-3 through d-10 residual returns. Again, the residual returns during
the period d-3 through d-10 were not unusual.
EXAMINATION OF INDIVIDUAL ANALYSTS
78. The statistical analysis detailed above provides strong evidence that, collectively, Lehman
Brothers analysts tipped select market participants prior to the public dissemination of
ratings downgrades during the period 1 January 2004 through 20 March 2008.
79. To determine if certain Lehman analysts appeared to be more likely associated with the
tipping evidence than others, I reanalyzed the data after separating the downgrades by
analyst.
80. The 361 downgrade events were issued by 97 individual Lehman analysts.
81. Because the power of the analytical methodology depends on the number of events in the
sample, I focused my examination on those analysts who published a large number of
reports. Of the 97 individual analysts, eight analysts had ten or more downgrade events: J.
Birchenough, A. Chanda, G. Chase, P. Cheng, B. Harting, A. Jao, T. Luke, and R. Shah.
Collectively, these eight analysts accounted for 104, approximately one third, of the 361
Lehman downgrade events. I therefore examined the downgrade events and residual
returns related to these eight analysts.
82. For each of these eight analysts, I ran the same three statistical tests (t-test, Sign test, and
Wilcoxon Signed Rank test).
14

t-test
83. The first test performed on each individual analyst’s downgrades was the t-test. The test
statistics and associated p-values of these tests are presented in Exhibit-7a through
Exhibit-7h.
84. The test statistics and p-values of the t-tests show that four of the eight analysts –
J. Birchenough, A. Chanda, B. Harting, and T. Luke – were associated with statistically
significant, unusual price declines the day before their downgrades were issued. The
average residual returns corresponding to each of those four analysts on d-1 are -1.69%,
-2.86%, -3.69%, and -1.78%, respectively.
85. Of the four analysts associated with unusual price behavior on d-1, two analysts –
A. Chanda and B. Harting – also had significant, unusual price declines on d-2. The mean
residual returns on d-2 associated with these two analysts are -3.65% and -3.53%,
respectively.
86. The results of the t-tests indicate that there was unusual negative price movement the day
before downgrades issued by J. Birchenough, A. Chanda, B. Harting, and T. Luke.
Furthermore, unusual price declines were also observed two days before downgrades
issued by A. Chanda and B. Harting.
Sign Test
87. I conducted Sign tests on residual returns for each of the eight analysts. The test statistics
and associated p-values of these tests are presented in Exhibit-8a through Exhibit-8h.
88. Three of the eight analysts – A. Chanda, B. Harting, and T. Luke –had statistically
significant negative price movements on d-1, with corresponding p-values of 2.15%,
1.29%, and 0.20%, respectively.
89. Of the three analysts exhibiting unusual price declines on d-1, two – A. Chanda and
B. Harting – also had unusual price declines on d-2. The p-values for the A. Chanda and
B. Harting samples on d-2 are 0.20% and 5.74%, respectively. The d-2 result is
statistically significant at the 5% significance level for A. Chanda, and very close for B.
Harting.
15

90. The results of the Sign tests indicate that there was unusual negative price movement the
day before downgrades issued by A. Chanda, B. Harting, and T. Luke. Furthermore,
unusual price declines were also observed two days before downgrades issued by A.
Chanda and B. Harting.
Wilcoxon Signed Rank Test
91. Finally, I conducted Wilcoxon Signed Rank tests focused on the downgrades of each of the
eight analysts. The test statistics and associated p-values of these tests are presented in
Exhibit-9a through Exhibit-9h.
92. The test statistics and p-values of the Wilcoxon Signed Rank tests show that
J. Birchenough, A. Chanda, B. Harting, and T. Luke were associated with unusual price
declines on d-1. The corresponding p-values for these four analysts on d-1 are 4.79%,
0.39%, 0.31%, and 0.20%, respectively.
93. Again, A. Chanda and B. Harting are associated with unusual price declines two days
preceding their downgrades according the Wilcoxon Signed Rank test. The corresponding
p-values for these two analysts on d-2 are 0.20% and 2.45%, respectively, indicating
statistical significance at the 5% significance level for each.
Summary of Examination of Individual Analysts
94. The statistical analysis of individual analysts indicates that three of the eight analysts
examined – A. Chanda, B. Harting, and T. Luke – are associated with unusual price
declines before their downgrades were announced, consistent with the practice of tipping.
SUMMARY
95. Employing widely used and generally accepted financial and quantitative analytic methods,
I conclude from numerous statistical tests that the stock price returns on the two days
immediately preceding Lehman Brothers downgrades were aberrant relative to typical
stock price behavior. Those returns were more likely to be negative than were typical
returns, and the average d-1 and d-2 residual returns were significantly negative.
16

96. The study controls for earnings announcements, other analysts’ downgrades, and other
extraordinary events in the same manner as previous studies in this field, eliminating prior
negative news as the explanation for the aberrant price behavior.
97. Unlike prior studies, which relied on proprietary short interest and institutional trading data
to investigate tipping, this study detected evidence of tipping directly in publicly available
stock price data.
98. These results are compelling empirical evidence that Lehman Brothers engaged in tipping
during the period 1 January 2004 through 20 March 2008 and provided advanced notice of
imminent downgrades to select market participants prior to public dissemination.
99. Statistical analysis of the price behavior preceding the downgrades of individual Lehman
analysts indicates that there was unusual residual price behavior associated with
downgrades issued by A. Chanda, B. Harting, and T. Luke, consistent with tipping.
___________________________
Steven P. Feinstein, Ph.D., CFA
17

APPENDIX
The formula for a logarithmic return is:
1
lnt
ttt P
dPR
where: Rt is the logarithmic return on day t; Pt is the stock price at the end of day t; Pt-1 is the stock price from the previous day, day t-1; dt is the dividend on day t, if any. The formula for converting a logarithmic return into a dollar return is: )1(1
tRtt ePDR
where: DRt is the dollar return on day t; Pt-1 is the stock price from the previous day, day t-1; e is natural e (approximately 2.7); Rt is the logarithmic return on day t. If a stock falls from $20 to $18, the percent change in price is -10%, equal to the $2 decline
divided by the original $20 price. The logarithmic return, however, is -10.54%, equal to
log($18/$20). Among its other attractive features, the logarithmic return relates a price change to
an average of the original, final, and intervening prices over the course of a price decline. As
such, for large price declines, it is possible for a logarithmic price decline to exceed 100%, since
the price decline may be greater than the average of the beginning and ending prices.
Logarithmic returns, rather than percent change returns are commonly used in stock return
regressions and event study analysis. Another attractive feature of logarithmic returns is that
they can be decomposed into contributing factors linearly. That is, the portion of a logarithmic
return caused by company-specific information is isolated by subtracting from the total
logarithmic return the portion of the total return caused by market and peer group factors.
18

REFERENCES
Barber, Brad, Reuven Lehavy, Maureen McNichols, and Brett Trueman. “Can Investors Profit
from the Prophets? Security Analyst Recommendations and Stock Returns.” The Journal of Finance 56.2 (2001): 531–563.
Bradley, Daniel J., Bradford D. Jordan, and Jay R. Ritter. ‘‘The Quiet Period Goes out with a Bang.’’ The Journal of Finance 58.1 (2003): 1–36.
Branson, Bruce C., Daryl M. Guffey, and Donald P. Pagach. ‘‘Information Conveyed in Announcements of Analyst Coverage.’’ Contemporary Accounting Research 15.2 (1998): 119–143.
Bray, Chad. “Pleas in UBS Insider Case.” The Wall Street Journal 28 February 2008: C3.
Campbell, John Y., Andrew W. Lo, and A. Craig MacKinlay. The Econometrics of Financial Markets. Princeton: Princeton University Press, 1997.
Christophe, Stephen E., Michael G. Ferri, and Jim Hsieh. “Informed Trading Before Analyst Downgrades: Evidence from Short Sellers.” Journal of Financial Economics 95.1 (2010): 85-106.
Chung, Kee H., and Jo Hoje. ‘‘The Impact of Security Analysts’ Monitoring and Marketing Functions on the Market Value of Firms.’’ The Journal of Financial and Quantitative Analysis 31.4 (1996): 493–512.
Craig, Susanne. “Goldman's Trading Tips Reward Its Biggest Clients.” The Wall Street Journal 24 August 2009: A1.
Green, Clifton. “The Value of Client Access to Analyst Recommendations.” Journal of Financial and Quantitative Analysis 41.1 (2006): 1–24.
Goldstein, Matthew. “Homing in on Trading Abuses.” Business Week 12 March 2007: 46.
Goldstein, Matthew. “UBS: Notes on a Wall Street Scandal; How the Lines Between Stock Research and Marketing Can Still Blur So Easily.” Business Week 26 March 2007: 40.
Hsieh, Jim, Lilian K. Ng, and Qinghai Wang. “How Informative are Analyst Recommendations and Insider Trades?” AFA 2006 Boston Meetings Paper, 2005.
Irvine, Paul J. ‘‘Analysts’ Forecasts and Brokerage-Firm Trading.’’ The Accounting Review 79.1 (2004): 125–149.
Irvine, Paul J., Marc Lipson, and Andy Puckett. “Tipping.” The Review of Financial Studies 20.3 (2007): 741–768.
Jegadeesh, Narasimhan, Joonghyuk Kim, Susan D. Krische, and Charles M. C. Lee. “Analyzing the Analysts: When Do Recommendations Add Value?” The Journal of Finance 59.3 (2004): 1083–1124.
19

Juergens, Jennifer L., and Laura Lindsey. “Getting Out Early: An Analysis of Market Making Activity at the Recommending Analyst’s Firm.” The Journal of Finance 64.5 (2009): 2327-2359.
Kim, Sok Tae., Ji-Chai Lin, and Myron B. Slovin. ‘‘Market Structure, Informed Trading, and Analysts’ Recommendations.’’ Journal of Financial and Quantitative Analysis 32.4 (1997): 507–524.
United States. Securities and Exchange Commission. “Litigation Release No. 20022” 1 March 2007.
Michaely, Roni, and Kent L. Womack. ‘‘Conflict of Interest and the Credibility of Underwriter Analyst Recommendations.’’ The Review of Financial Studies 12.4 (1999): 653–686.
“Goldman Acknowledges Conflicts with Clients.” The New York Times 12 January 2010.
Stickel, Scott E.. “The Anatomy of the Performance of Buy and Sell Recommendations.” Financial Analysts Journal 51.5 (1995): 25–39.
Womack, Kent L. “Do Brokerage Analysts’ Recommendations Have Investment Value?” The Journal of Finance 51.1 (1996): 137–167.
20

Exhibit-1
Curriculum Vitae Steven P. Feinstein, Ph.D., CFA
Babson College Finance Division
Babson Park, MA 02457 781-239-5275
[email protected] EDUCATION 1989 YALE UNIVERSITY Ph.D. in Economics (Concentration in Finance) 1986 YALE UNIVERSITY M.Phil. in Economics 1983 YALE UNIVERSITY M.A. in Economics 1981 POMONA COLLEGE B.A. in Economics (Phi Beta Kappa, cum laude) TEACHING EXPERIENCE 1996 - present BABSON COLLEGE Babson Park, MA Full-time Faculty, Finance Division Associate Professor (2000-present) Donald P. Babson Chair in Applied Investments (2002-present) Faculty Director of the Babson College Fund (2002-2009) Director of the Stephen D. Cutler Investment Management Center (2002-2007)
Assistant Professor (1996-2000) 1992 - 2002 BOSTON UNIVERSITY CHARTERED FINANCIAL ANALYSTS
(CFA) REVIEW PROGRAM Instructor A 3-level program preparing financial analysts, portfolio managers,
brokers and other investment professionals for the examinations leading to professional certification. The core curriculum consists of the following modules:
Equity Securities Analysis Fixed Income Securities Analysis Portfolio Management
21

Exhibit-1
Curriculum Vitae Steven P. Feinstein, Ph.D., CFA
Derivatives Financial Accounting Economic Analysis Quantitative Analysis Ethical and Professional Standards
1990 - 1995 BOSTON UNIVERSITY SCHOOL OF MANAGEMENT Boston, MA Full-time Faculty, Department of Finance 1993 - 1994 WASHINGTON UNIVERSITY, OLIN SCHOOL OF BUSINESS St. Louis, MO Visiting Assistant Professor, Department of Finance BUSINESS EXPERIENCE 2008 - present CROWNINSHIELD FINANCIAL RESEARCH, LLC Wellesley, MA Managing Principal and Senior Expert 1996 - 2008 THE MICHEL-SHAKED GROUP Boston, MA Senior Expert (2001 - 2008) Affiliated Expert (1996 - 2001) 1987 - 1990 FEDERAL RESERVE BANK OF ATLANTA Economist PROFESSIONAL DESIGNATIONS 1998 Awarded the Chartered Financial Analyst designation by the Association for Investment
Management and Research. RESEARCH AWARDS 1999 Greater Boston Real Estate Board/Real Estate Finance Association – Research Grant and
Featured Speaker at Real Estate Finance Association Meetings.
22

Exhibit-1
Curriculum Vitae Steven P. Feinstein, Ph.D., CFA
PAPERS AND PUBLICATIONS
“Planning Capital Expenditure,” in The Portable MBA in Financing and Accounting, J. L. Livingstone and T. Grossman, editors, New York: Wiley, 3rd edition 2001, and 4th edition 2009. “Financial Management of Risks,” in The Portable MBA in Financing and Accounting, J. L. Livingstone and T. Grossman, editors, New York: Wiley, 2nd edition 1997, 3rd edition 2001, and 4th edition 2009. “Fraud-on-the-market Theory: Is a Market Efficient?” (with Allen Michel and Israel Shaked) American Bankruptcy Institute Journal, May 2005. “Valuation of Credit Guarantees” (with Allen J. Michel and Israel Shaked). Journal of Forensic Economics 17(1), pp. 17-37, 2005. “A Better Understanding of why NPV Undervalues Managerial Flexibility,” (with Diane Lander) in The Engineering Economist, 2002, Volume 47, Number 4. “Teaching the Strong-Form Efficient Market Hypothesis: A Classroom Experiment,” Journal of Financial Education, fall 2000. A Future for Real Estate Futures: Potential Applications of Derivatives in Real Estate Investment and Finance (with Linda Stoller). Monograph. Boston: Real Estate Finance Association / Greater Boston Real Estate Board, May 2000. “The Risk Budget: Using Your Human Resources,” (with John Marthinsen and John Edmunds) Risk Management, April 2000. “Scenario Learning: A Powerful Tool for the 21st Century Planner,” (with Jeffrey Ellis and Dennis Stearns) The Journal of Financial Planning, April 2000. “Protecting Future Product Liability Claimants in the Case of Bankruptcy,” (with Allen Michel and Israel Shaked) American Bankruptcy Institute Journal, January 2000. “Measuring Risk with the Bodie Put When Stocks Exhibit Mean Reversion,” The Journal of Risk, Vol. 1, No. 3, 1999. “Just-in-Time Mathematics: Integrating the Teaching of Finance Theory and Mathematics,” (with Gordon Prichett) Primus, Vol. IX, No. 2, June 1999. Atlanta Park Medical Center v. Hamlin Asset Management. (with Natalie Taylor). Babson Case Collection, Harvard Business School Press, 1998.
23

Exhibit-1
Curriculum Vitae Steven P. Feinstein, Ph.D., CFA
“Dealing with Delta,” Derivatives Week, VII, No. 44, November 2, 1998. “Expected Return in Option Pricing: A Non-Mathematical Explanation,” Derivatives Week, VII, No. 35, August 31, 1998. “When Hedges Fail: The Put Paradox and its Solution,” Derivatives Quarterly, Vol. 4, No. 2, Winter 1997. Finance and Accounting for Project Management. New York: American Management Association, 1996. “International Investing,” in Irwin’s Directory of Emerging Market Brokerages. New York: Irwin, 1996. “The Hull and White Implied Volatility.” Boston University Working Paper #92-51, 1992. “Immunizing Against Interest Rate Risk Using the Macaulay Duration Statistic: An Assessment,” (with Don Smith) in Financial Systems and Risk Management, the proceedings of the US-Japan Forum on Financial Strategy in the 1990s, sponsored by Osaka Foundation of International Exchange and Boston University, August 1991. “Covered Call Options: A Proposal to Ease LDC Debt,” (with Peter Abken) Federal Reserve Bank of Atlanta Economic Review, March/April 1990. Reprinted in Financial Derivatives: New Instruments and Their Uses. Atlanta: Federal Reserve Bank. “Forecasting Stock-Market Volatility Using Options on Index Futures,” Federal Reserve Bank of Atlanta Economic Review, May/June 1989. Reprinted in Financial Derivatives: New Instruments and Their Uses. Atlanta: Federal Reserve Bank. “The Black-Scholes Formula is Nearly Linear in Sigma for At-the-Money Options; Therefore Implied Volatilities from At-the-Money Options are Virtually Unbiased.” Federal Reserve Bank of Atlanta Working Paper #88-9, December 1988. “The Effect of the ‘Triple Witching Hour’ on Stock Market Volatility,” (with William Goetzmann) Federal Reserve Bank of Atlanta Economic Review, September/October 1988. Reprinted in Financial Derivatives: New Instruments and Their Uses. Atlanta: Federal Reserve Bank. “Stock Market Volatility,” Federal Reserve Bank of Atlanta Economic Review, November/December 1987.
24

Exhibit-1
Curriculum Vitae Steven P. Feinstein, Ph.D., CFA
Book review of In Who’s Interest: International Banking and American Foreign Policy, by Benjamin J. Cohen, Yale University Press, in Federal Reserve Bank Of Atlanta Economic Review, Summer 1987.
PRESENTATIONS “The Computation of Damages in Securities Fraud Cases,” at the Grant and Eisenhofer Institutional Investor Conference, December 2002. “The Role of the Financial Expert in Complex Litigation,” at the Financial Management Association Conference, October 2000. “Entrepreneurial Incentives and Resource Allocation Among Corporate Venturing Initiatives,” (with Joel Shulman and U. Srinivasa Rangan), Babson Entrepreneurship Research Conference, May 2000. “Application of Real Options in Purchasing Strategies,” (with Juan Orozco), presented at the International Applied Business Research Conference, March 2000. “A Future for Real Estate Futures,” (with Linda Stoller) at the Fairfield County chapter of the Real Estate Finance Association, November 1999, and at the Greater Boston Real Estate Board, November 2000. “Atlanta Park Medical Center v. Hamlin Asset Management,” (with Natalie Taylor) at the 1999 convention of the North American Case Research Association. “Using Future Worlds in the Financial Planning Process,” (with Jeffrey Ellis) at the Institute of Certified Financial Planners Masters Retreat, October 1999. “Toward a Better Understanding of Real Options: A Weighted Average Discount Rate Approach,” at the 1999 Financial Management Association Conference, the 1999 European Financial Management Association Conference, and the 1999 Multinational Finance Society Conference. “Just-In-Time Mathematics: Integrating the Teaching of Finance Theory and Mathematics,” (with Gordon Prichett) at the 1999 Financial Management Association Conference. “Alternative Dow Investments for the Individual Investor: Diamonds, Synthetics, and the Real Thing,” at the 1999 Academy of Financial Services Convention.
25

Exhibit-1
Curriculum Vitae Steven P. Feinstein, Ph.D., CFA
“Evidence of Yield Burning in Municipal Refundings” at Financial Management Association Convention, October 1997; Government Finance Officers Association, 1997; and Northeast Regional Convention of the National Association of State Treasurers, 1997. “Teaching the Strong-Form Efficient Market Hypothesis” at Conference on Classroom Experiments in the Teaching of Economics at University of Virginia, September 1995. “Efficient Consolidation of Implied Standard Deviations,” (with Shaikh Hamid) at Midwest Finance Association, March 1995. “A Test of Intertemporal Averaging of Implied Volatilities,” (with Shaikh Hamid) at Eastern Finance Association, April 1995. “Taking Advantage of Volatility: Non-linear Forecasting and Options Strategies,” (with Hassan Ahmed) at Chicago Board of Trade / Chicago Board Options Exchange Conference on Risk Management, February 1992. “Immunizing Against Interest Rate Risk Using the Macaulay Duration Statistic: An Assessment,” (with Don Smith) at Japan-U.S. Conference on Financial Strategies in the 1990s, Osaka, Japan, August 1991. “The Hull and White Implied Volatility,” at American Finance Association Convention, December 1990.
REVIEWED ARTICLES AND BOOKS FOR:
Journal of Economic Education Journal of Forensic Economics Journal of Risk Financial Review North American Case Research Association Financial Management Journal of Business Journal of Money, Credit and Banking Quarterly Review of Economics and Finance Blackwell Prentice Hall Southwestern Publishing
26

Exhibit-1
Curriculum Vitae Steven P. Feinstein, Ph.D., CFA
COURSES TAUGHT
Valuation (MBA) Investments (MBA and Executive) Equity Markets (MBA) Fixed Income Analysis (Undergraduate and MBA) Babson College Fund (Undergraduate and MBA) Options and Futures (Undergraduate) Advanced Derivative Securities (MBA) Corporate Finance (MBA and Executive) Financial Management (MBA) Risk Management (MBA) Corporate Financial Strategy (MBA) Integrated Management (Undergraduate) Cross-Functional Management (Integrated curriculum, Undergraduate) Continuous-Time Finance (Doctoral) Portfolio Theory / Management Information Systems (Executive) Quantitative Methods for Investment Management (Undergraduate and MBA) Introduction to Derivatives Securities (Executive) International Finance (Executive)
TEACHING AWARDS
Reid Teaching Award, Washington University, Olin School of Business, 1993-94. SELECT LIST OF MEDIA CITATIONS
“Hospital Move Presents Buy-Out Groups with New Risks,” by Francesco Guerra, Christopher Bowe, and Rebecca Knight, Financial Times, July 15, 2006. “Funds of Knowledge Add Value,” by Rebecca Knight, Financial Times, March 12, 2006. “City’s Financial Picture Worse Than Ever, Sanders Says,” by Matthew T. Hall, San Diego Union-Tribune, January 7, 2006. “Downer: Stock Market Takes Another Dive,” by John Chesto, Boston Herald, July 23, 2002. “Banks, Developers, Are Main Beneficiaries,” [editorial column] by Steven Feinstein, The Boston Globe, March 31, 2002, p. C4.
27

Exhibit-1
Curriculum Vitae Steven P. Feinstein, Ph.D., CFA
“Washington Investing: What Michael Saylor is Really Worth,” by Jerry Knight, The Washington Post, March 6, 2000. “IBM Retools Pensions,” by Stephanie Armour, USA Today, May 4, 1999. “L.A. MTA’s Law Firm Says Lissack Strategy Will be a Replay,” by Andrea Figler, Bond Buyer, September 30, 1998. “Fed Key Player in Rescue of Floundering Hedge Fund,” by Andrew Fraser, Associated Press, September 25, 1998. “Top Banks Plan Bailout for Fund,” by Andrew Fraser, Associated Press, September 24, 1998. “Clarion Call to the Small Investor,” by Jo-Ann Johnston, The Boston Globe, March 4, 1998. “L.A. Authority Study Shows Rampant Yield Burning Abuse,” by Michael Stanton, The Bond Buyer, April 22, 1997. “Dispute Over Yield Burning Dominates GFOA Session,” by Michael Stanton, The Bond Buyer, January 29, 1997. “Men Behaving Badly (Yield Burning),” Grants Municipal Bond Observer, January 24, 1997. “Municipal Bond Dealers Face Scrutiny,” by Peter Truell, The New York Times, December 17, 1996. “Iowa Market Takes Stock of Presidential Candidates,” by Stanley W. Angrist, The Wall Street Journal, August 28, 1995. “Looking for Clues in Options Prices,” by Sylvia Nasar, The New York Times, July 18, 1991. “For Fed, A New Set of Tea Leaves,” by Sylvia Nasar, The New York Times, July 5, 1991.
28

Exhibit-1
Curriculum Vitae Steven P. Feinstein, Ph.D., CFA
MEMBERSHIP IN PROFESSIONAL SOCIETIES
American Finance Association Boston Security Analysts Society Chartered Financial Analyst Institute (formerly the Association for Investment
Management and Research) Financial Management Association Foundation for Advancement of Research in Financial Economics (founding member) North American Case Research Association
29

Brokerage 2004 2005 2006 2007
Lehman 1 1 1 1Merrill Lynch 2 2 3 5UBS 3 5 5 8Morgan Stanley 4 3 9 9 (tied)Smith Barney Citigroup 5 5 2 3Bear, Stearns & Co. 6 4 4 2Credit Suisse First Boston 7 9 10 n/aGoldman Sachs & Co. 8 9 10 9 (tied)Sanford C. Bernstein & Co. 9 8 8 7J.P. Morgan Securities 10 7 7 4Banc of America Securities 11 9 6 6Prudential Equity Group 12 12 12 n/aDeutsche Bank Securities 13 13 13 n/aInternational Strategy & Investment Group 14 14 14 n/a
Notes :[1] Data are as reported in October issue of each respective year.[2] Institution Investor's ranking is based on the number of
"All-American" sell-side research analysts at each firm.
Year
Exhibit-2Institutional Investor's Top Brokerages
30

1/5/2004 ABERCROMBIE & FITCH CO ANF GREENBERGER K1/6/2004 CARBO CERAMICS INC CRR HACKMAN L1/7/2004 TORCHMARK CORP TMK BERG E
1/14/2004 BUCKEYE PARTNERS LP BPL GROSS R1/14/2004 INTELSAT CORP SPOT JAYANT V1/26/2004 SPRINT CORP FON LYNCH R1/26/2004 AIRTRAN HOLDINGS INC AAI CHASE G1/26/2004 PNC FINANCIAL SERVICES GROUP PNC VANDERVLIET B2/3/2004 NPS PHARMACEUTICALS INC NPSP BIRCHENOUGH J2/3/2004 ROYAL DUTCH PETRO RD ELDEN J2/3/2004 TIDEWATER INC TDW CRANDELL J2/3/2004 BAKER HUGHES INC BHI CRANDELL J
2/10/2004 AUTONATION INC AN BLACK J2/23/2004 3COM CORP COMS SHAO J3/9/2004 ENTERASYS NETWORKS INC ETS LUKE T
3/22/2004 MGM MIRAGE MGM DICLEMENTE A3/23/2004 SAFEWAY INC SWY ADLER M3/24/2004 TEPPCO PARTNERS LP TPP GROSS R3/30/2004 SUNOCO INC SUN CHENG P3/30/2004 FRONTIER OIL CORP FTO CHENG P3/31/2004 DOT HILL SYSTEMS CORP HILL BLOUNT H4/14/2004 FRONTIER OIL CORP FTO CHENG P5/11/2004 INTERSIL CORP ISIL SHAH R5/11/2004 MAXIM INTEGRATED PRODUCTS MXIM SHAH R5/11/2004 LINEAR TECHNOLOGY CORP LLTC SHAH R5/26/2004 RAYOVAC CORP ROV GILLIN LEFEVE A6/4/2004 GREATER BAY BANCORP GBBK JAO A
6/17/2004 CENTURYTEL INC CTL SEITZ T6/22/2004 MCKESSON CORP MCK MARSH L6/28/2004 CROWN CASTLE INTL CORP CCI BATH B6/28/2004 RF MICRO DEVICES INC RFMD KVAAL J6/28/2004 TRIQUINT SEMICONDUCTOR INC TQNT KVAAL J7/6/2004 PMC - SIERRA INC PMCS CHANDA A7/6/2004 APPLIED MICRO CIRCUITS CORP AMCC CHANDA A7/6/2004 VITESSE SEMICONDUCTOR CORP VTSS CHANDA A7/8/2004 CSX CORP CSX RITTER J
7/12/2004 ICOS CORPORATION ICOS BIRCHENOUGH J7/16/2004 TEXAS INSTRUMENTS INC TXN LUKE T7/19/2004 ADOLOR CORPORATION ADLR BIRCHENOUGH J8/5/2004 STONE ENERGY CORP SGY ROBERTSON J
8/10/2004 FAIRCHILD SEMICONDUCTOR FCS LUKE T8/11/2004 HEWLETT-PACKARD CO HPQ BLOUNT H8/11/2004 ALLEGHENY ENERGY INC AYE FORD D8/11/2004 MAXTOR CORP MXO BLOUNT H8/11/2004 APPLE INC AAPL BLOUNT H8/11/2004 INTL BUSINESS MACHINES CORP IBM BLOUNT H8/12/2004 PROVINCE HEALTHCARE CO PRV FEINSTEIN A8/16/2004 HASBRO INC HAS HENDRIX F8/20/2004 DUQUESNE LIGHT HOLDINGS INC DQE FORD D8/20/2004 FMC TECHNOLOGIES INC FTI CRANDELL J
Analyst
1 January 2004 to 20 March 2008Lehman Brothers Downgrade Events
Exhibit-3
Ticker Company NameDowngrade Date
31

Analyst
1 January 2004 to 20 March 2008Lehman Brothers Downgrade Events
Exhibit-3
Ticker Company NameDowngrade Date
8/27/2004 ALLSTATE CORP ALL WINANS C9/2/2004 INTERSIL CORP ISIL SHAH R9/7/2004 NATIONAL SEMICONDUCTOR CORP NSM SHAH R9/7/2004 BROADCOM CORP BRCM CHANDA A9/7/2004 CEPHALON INC CEPH BIRCHENOUGH J9/7/2004 PMC - SIERRA INC PMCS CHANDA A9/7/2004 APPLIED MICRO CIRCUITS CORP AMCC CHANDA A9/7/2004 SILICON LABORATORIES INC SLAB CHANDA A9/7/2004 VITESSE SEMICONDUCTOR CORP VTSS CHANDA A9/7/2004 CONEXANT SYSTEMS INC CNXT CHANDA A
9/13/2004 ADVANCED FIBRE COMMUNICATION AFCI LEVY S9/20/2004 CISCO SYSTEMS INC CSCO LUKE T9/27/2004 PIXAR PIXR DICLEMENTE A9/29/2004 AVICI SYSTEMS INC AVCI SHAO J9/29/2004 NETEASE.COM INC-ADR NTES SUN L10/1/2004 SINA CORP SINA SUN L10/7/2004 COST PLUS INC CPWM RIFKIN A10/8/2004 FIRSTENERGY CORP FE FORD D
10/12/2004 TRIBUNE CO TRB HUBER C10/12/2004 EW SCRIPPS CO SSP HUBER C10/12/2004 KNIGHT RIDDER INC KRI HUBER C10/15/2004 VISTEON CORP VC KIMBALL D10/28/2004 TJX COMPANIES INC TJX BLACK J10/28/2004 URBAN OUTFITTERS INC URBN BLACK J10/28/2004 CHILDREN'S PLACE PLCE BLACK J11/12/2004 ELECTRONICS FOR IMAGING EFII SABBAGHA C11/12/2004 AFLAC INC AFL BERG E11/16/2004 COMMONWEALTH TELEPHONE ENTRP CTCO SEITZ T11/19/2004 WESTAMERICA BANCORPORATION WABC JAO A11/23/2004 PIER 1 IMPORTS INC PIR RIFKIN A11/23/2004 CARMAX INC KMX NESSON S12/2/2004 CANADIAN PACIFIC RAILWAY LTD CP RITTER J12/7/2004 JETBLUE AIRWAYS CORP JBLU CHASE G12/7/2004 NORTHWEST AIRLINES CORP NWAC CHASE G12/7/2004 CONTINENTAL AIRLINES CAL CHASE G12/7/2004 ALASKA AIR GROUP INC ALK CHASE G12/9/2004 PIONEER NATURAL RESOURCES CO PXD DRISCOLL T
12/13/2004 ADC TELECOMMUNICATIONS INC ADCT KUPFERSCHMIDT M12/14/2004 APPLIED FILMS CORP AFCO MUSE C1/10/2005 PROLOGIS PLD SHULMAN D1/19/2005 UNUMPROVIDENT GROUP UNM BERG E1/19/2005 PRINCIPAL FINANCIAL GROUP PFG BERG E1/19/2005 LINCOLN NATIONAL CORP LNC BERG E1/21/2005 MICHAELS STORES INC MIK NESSON S1/24/2005 CABOT MICROELECTRONICS CORP CCMP BERG T1/24/2005 TENET HEALTHCARE CORP THC FEINSTEIN A1/25/2005 MONSANTO CO MON VASNETSOV S1/25/2005 UNITED SURGICAL PARTNERS INT USPI FEINSTEIN A2/3/2005 EMULEX CORP ELX NAAH H2/4/2005 CUMULUS MEDIA INC CMLS MEYERS W
32

Analyst
1 January 2004 to 20 March 2008Lehman Brothers Downgrade Events
Exhibit-3
Ticker Company NameDowngrade Date
2/8/2005 ABERCROMBIE & FITCH CO ANF BLACK J2/23/2005 FISERV INC FISV FREEMAN R3/4/2005 WESTERN WIRELESS WWCA SEITZ T3/9/2005 DARDEN RESTAURANTS INC DRI BERNSTEIN J3/9/2005 CHEESECAKE FACTORY INC/THE CAKE BERNSTEIN J
3/11/2005 AMIS HOLDINGS INC AMIS SHAH R3/15/2005 OSI PHARMACEUTICALS INC OSIP BIRCHENOUGH J3/16/2005 TELIK INC TELK BIRCHENOUGH J3/28/2005 WATSON PHARMACEUTICALS INC WPI SILVER R4/15/2005 WEBSTER FINANCIAL CORP WBS ELLIOTT-GURNE F4/25/2005 EXPRESS SCRIPTS INC ESRX MARSH L5/3/2005 DELTA AIR LINES INC DAL CHASE G5/5/2005 EATON CORP ETN TISS J
5/17/2005 DJ ORTHOPEDICS DJO HOPKINS R5/18/2005 METLIFE INC MET BERG E5/19/2005 WESTERN DIGITAL CORP WDC BLOUNT H5/19/2005 LEAR CORP LEA KIMBALL D5/20/2005 ENTERGY CORP ETR FORD D5/20/2005 SEMTECH CORP SMTC SHAH R5/23/2005 HUNTINGTON BANCSHARES INC HBAN JAO A5/31/2005 EOG RESOURCES INC EOG DRISCOLL T6/2/2005 VARIAN SEMICONDUCTOR EQUIP VSEA MUSE C6/3/2005 WHOLE FOODS MARKET INC WFMI MUSHKIN S6/8/2005 IKON OFFICE SOLUTIONS INC IKN SABBAGHA C
6/10/2005 CONTINENTAL AIRLINES CAL CHASE G6/10/2005 AMR CORP AMR CHASE G6/16/2005 WISCONSIN ENERGY CORP WEC FORD D6/16/2005 EMMIS COMMUNICATIONS EMMS MEYERS W6/20/2005 TRIQUINT SEMICONDUCTOR INC TQNT KVAAL J7/6/2005 QLOGIC CORP QLGC NAAH H7/7/2005 MOVIE GALLERY INC MOVI DICLEMENTE A7/7/2005 AT&T INC T BATH B7/7/2005 BLOCKBUSTER INC BBI DICLEMENTE A
7/15/2005 STRAYER EDUCATION INC STRA BISBEE G8/2/2005 CARE INVESTMENT TRUST INC CRE HARRIS D8/8/2005 GENZYME CORP GENZ PARKER C
8/16/2005 D&K HEALTHCARE RESOURCES INC DKHR MARSH L8/16/2005 PRIORITY HEALTHCARE CORP PHCC MARSH L8/29/2005 HARTFORD FINANCIAL SVCS GRP HIG BERG E9/6/2005 VALSPAR CORP VAL VASNETSOV S
9/20/2005 COCA-COLA ENTERPRISES CCE BRANCA M9/20/2005 PEPSIAMERICAS INC PAS BRANCA M9/30/2005 NORSK HYDRO AS NHY HASKINS L10/3/2005 HEALTH MGMT ASSOCIATES INC HMA FEINSTEIN A10/3/2005 LIFEPOINT HOSPITALS INC LPNT FEINSTEIN A
10/26/2005 JAMDAT MOBILE INC JMDT KVAAL J11/8/2005 LSI CORP LSI LUKE T
11/15/2005 GANNETT CO GCI HUBER C11/17/2005 IVAX CORP IVX SILVER R11/18/2005 TEKELEC TKLC KUPFERSCHMIDT M
33

Analyst
1 January 2004 to 20 March 2008Lehman Brothers Downgrade Events
Exhibit-3
Ticker Company NameDowngrade Date
11/23/2005 WEBEX COMMUNICATIONS INC WEBX SHAO J11/28/2005 NORTHERN TRUST CORP NTRS GOLDBERG J12/1/2005 DOW CHEMICAL DOW VASNETSOV S12/2/2005 APPLERA CORP ABI BUTLER C12/5/2005 MICREL INC MCRL SHAH R12/5/2005 INTL RECTIFIER CORP IRF SHAH R12/6/2005 MICRON TECHNOLOGY INC MU LUKE T12/8/2005 BJ SERVICES CO BJS CRANDELL J
12/12/2005 POST PROPERTIES INC PPS HARRIS D12/12/2005 EQUITY RESIDENTIAL EQR HARRIS D12/16/2005 COST PLUS INC CPWM RIFKIN A12/21/2005 AVON PRODUCTS INC AVP LIEBERMAN L
1/6/2006 CLEAR CHANNEL CCU DICLEMENTE A1/6/2006 ENTERCOM COMMUNICATIONS ETM DICLEMENTE A
1/11/2006 NEXTEL PARTNERS INC NXTP BATH B1/17/2006 TEREX CORP TEX TISS J1/17/2006 JOY GLOBAL INC JOYG TISS J1/17/2006 MIDDLEBY CORP MIDD TISS J1/17/2006 CATERPILLAR INC CAT TISS J1/19/2006 MANOR CARE INC HCR FISCHBECK K1/20/2006 KINDRED HEALTHCARE INC KND FISCHBECK K1/20/2006 VISTEON CORP VC KIMBALL D1/20/2006 ORBOTECH LTD ORBK MUSE C1/27/2006 AZTAR CORP AZR HENDRIX F2/2/2006 AUTODESK INC ADSK HERNANDEZ I2/3/2006 APTARGROUP INC ATR JAIN S2/9/2006 NABI BIOPHARMACEUTICALS NABI BIRCHENOUGH J
2/10/2006 DOVER CORP DOV O'CALLAGHAN S2/13/2006 STONE ENERGY CORP SGY ROBERTSON J2/13/2006 AMR CORP AMR CHASE G2/14/2006 SYSCO CORP SYY ADLER M2/22/2006 NEWFIELD EXPLORATION CO NFX DRISCOLL T2/22/2006 APACHE CORP APA DRISCOLL T3/7/2006 CORINTHIAN COLLEGES INC COCO BISBEE G
3/17/2006 HOLLY ENERGY PARTNERS LP HEP KARPF A4/3/2006 ADVANCED MICRO DEVICES AMD LUKE T
4/11/2006 NORFOLK SOUTHERN CORP NSC CHASE G4/17/2006 CONTINENTAL AIRLINES CAL CHASE G4/19/2006 MYLAN INC MYL SILVER R4/19/2006 UNIVERSAL TECHNICAL INSTITUT UTI LASSER M4/21/2006 UNITED NATURAL FOODS INC UNFI LASSER M5/1/2006 PIER 1 IMPORTS INC PIR RIFKIN A
5/22/2006 MAGELLAN HEALTH SERVICES INC MGLN RASKIN J5/25/2006 MERCANTILE BANKSHARES CORP MRBK JAO A5/25/2006 ASSOCIATED BANC CORP ASBC JAO A6/2/2006 SANTANDER HOLDINGS USA INC SOV HARTING B
6/16/2006 TD BANK US HOLDING CO BNK HARTING B6/19/2006 KIMBERLY-CLARK CORP KMB LIEBERMAN L6/28/2006 GLOBAL PAYMENTS INC GPN BU J7/5/2006 PACIFIC CAPITAL BANCORP PCBC JAO A
34

Analyst
1 January 2004 to 20 March 2008Lehman Brothers Downgrade Events
Exhibit-3
Ticker Company NameDowngrade Date
7/5/2006 UNIONBANCAL CORPORATION UB JAO A7/5/2006 ATHEROS COMMUNICATIONS ATHR CHANDA A7/6/2006 UNUM GROUP UNM BERG E7/7/2006 TECH DATA CORP TECD NAAH H
7/11/2006 MURPHY OIL CORP MUR CHENG P7/12/2006 SANMINA-SCI CORP SANM KRAPIVIN Y7/12/2006 JABIL CIRCUIT INC JBL KRAPIVIN Y7/14/2006 PLUM CREEK TIMBER CO PCL RUSCHMEIER P8/3/2006 COVENTRY HEALTH CARE INC CVH RASKIN J
8/16/2006 ADC TELECOMMUNICATIONS INC ADCT KUPFERSCHMIDT M8/21/2006 INTERSIL CORP ISIL SHAH R8/21/2006 FAIRCHILD SEMICON INTERNATIO FCS SHAH R8/21/2006 NATIONAL SEMICONDUCTOR CORP NSM SHAH R9/6/2006 ESTEE LAUDER COMPANIES EL LIEBERMAN L9/8/2006 DOW JONES & CO INC DJ HUBER C
9/12/2006 ALON USA ENERGY INC ALJ CHENG P9/12/2006 FRONTIER OIL CORP FTO CHENG P9/12/2006 TESORO CORP TSO CHENG P9/12/2006 VALERO ENERGY CORP VLO CHENG P9/13/2006 ROSS STORES INC ROST BLACK J9/15/2006 OPENWAVE SYSTEMS INC OPWV KVAAL J9/18/2006 SYMBOL TECHNOLOGIES SBL KESSLER J9/19/2006 IOWA TELECOMMUNICATIONS SERV IWA SEITZ T9/21/2006 POWER-ONE INC PWER KRAPIVIN Y9/21/2006 LAMAR ADVERTISING CO LAMR DICLEMENTE A9/22/2006 FAIRPOINT COMMUNICATIONS INC FRP SEITZ T9/27/2006 CROSSTEX ENERGY INC XTXI KARPF A9/27/2006 ENTERPRISE GP HOLDINGS LP EPE GROSS R9/29/2006 CHECK POINT SOFTWARE TECH CHKP HERNANDEZ I10/5/2006 TEMPUR-PEDIC INTERNATIONAL TPX DRBUL R
10/10/2006 MICROCHIP TECHNOLOGY INC MCHP SHAH R10/17/2006 SOUTHWEST AIRLINES CO LUV CHASE G10/23/2006 INFOSYS TECHNOLOGIES INFY HELLAWELL A10/25/2006 ECI TELECOM LTD ECIL KUPFERSCHMIDT M10/25/2006 ANDREW LLC ANDW KVAAL J10/26/2006 OSI PHARMACEUTICALS INC OSIP BIRCHENOUGH J11/2/2006 NATIONAL FUEL GAS CO NFG GROSS R
11/15/2006 TELIK INC TELK BIRCHENOUGH J11/17/2006 NATIONAL FUEL GAS CO NFG GROSS R11/29/2006 WEBSTER FINANCIAL CORP WBS JAO A11/29/2006 3COM CORP COMS SHAO J11/29/2006 LINEAR TECHNOLOGY CORP LLTC SHAH R12/1/2006 ADVANCED MEDICAL OPTICS EYE BLACKMAN M12/1/2006 F5 NETWORKS INC FFIV SHAO J12/1/2006 3M CO MMM O'CALLAGHAN S
12/14/2006 POST PROPERTIES INC PPS HARRIS D1/3/2007 SAFEWAY INC SWY ADLER M1/3/2007 MARKWEST HYDROCARBON INC MWP KARPF A1/5/2007 EXXON MOBIL CORP XOM CHENG P1/8/2007 TORCHMARK CORP TMK BERG E
35

Analyst
1 January 2004 to 20 March 2008Lehman Brothers Downgrade Events
Exhibit-3
Ticker Company NameDowngrade Date
1/8/2007 MICROSEMI CORP MSCC SHAH R1/8/2007 ALLSTATE CORP ALL GELB J1/9/2007 DECODE GENETICS INC DCGN GARDNER P1/9/2007 HENRY SCHEIN INC HSIC MARSH L1/9/2007 GENTIVA HEALTH SERVICES GTIV MARSH L1/9/2007 WEST PHARMACEUTICAL SERVICES WST MARSH L
1/11/2007 PRA INTERNATIONAL PRAI TSAO D1/17/2007 ADTRAN INC ADTN KUPFERSCHMIDT M1/17/2007 GENOMIC HEALTH INC GHDX BIRCHENOUGH J1/17/2007 PENN VIRGINIA RESOURCE PARTN PVR WARD P1/22/2007 OMNICARE INC OCR FEINSTEIN A1/22/2007 HEALTH MGMT ASSOCIATES INC-A HMA FEINSTEIN A1/23/2007 HARRIS CORP HRS CAMPBELL J1/24/2007 BORGWARNER INC BWA JOHNSON B1/31/2007 CARNIVAL CORP CCL HENDRIX F1/31/2007 ROYAL CARIBBEAN CRUISES LTD RCL HENDRIX F2/5/2007 SLM CORP SLM HARTING B
2/12/2007 ARTHUR J GALLAGHER & CO AJG GELB J2/14/2007 NASH FINCH CO NAFC HOWLAND K2/21/2007 HASBRO INC HAS HENDRIX F2/22/2007 RALCORP HOLDINGS INC RAH LAZAR A2/26/2007 NEW YORK TIMES CO NYT HUBER C3/5/2007 COUNTRYWIDE FINANCIAL CORP CFC HARTING B3/6/2007 DIGENE CORP DIGE BUTLER A3/7/2007 MOTOROLA INC MOT KVAAL J
3/21/2007 SEPRACOR INC SEPR SILVER R3/22/2007 INTL RECTIFIER CORP IRF SHAH R3/27/2007 EDISON INTERNATIONAL EIX FORD D4/3/2007 CROSSTEX ENERGY LP XTEX GROSS R4/9/2007 HESS CORP HES CHENG P4/9/2007 MURPHY OIL CORP MUR CHENG P4/9/2007 AXCELIS TECHNOLOGIES INC ACLS MUSE C
4/16/2007 ENSCO INTERNATIONAL ESV SEDITA A4/16/2007 TIDEWATER INC TDW CRANDELL J4/17/2007 TRICO MARINE SERVICES INC TRMA WEST J4/17/2007 NOVELLUS SYSTEMS INC NVLS WHITE E4/17/2007 CASCADE MICROTECH INC CSCD WHITE E4/17/2007 GENESIS MICROCHIP INC GNSS MUSE C4/17/2007 ELECTROGLAS INC EGLS WHITE E4/20/2007 SMURFIT-STONE CONTAINER CORP SSCC RUSCHMEIER P5/1/2007 SONUS NETWORKS INC SONS KUPFERSCHMIDT M
5/23/2007 PINNACLE WEST CAPITAL PNW FORD D5/23/2007 BLUE NILE INC NILE ANMUTH D6/1/2007 NASDAQ OMX GROUP/THE NDAQ FREEMAN R6/5/2007 DU PONT DD VASNETSOV S6/7/2007 PROCTER & GAMBLE CO/THE PG LIEBERMAN L6/8/2007 FIRST AMERICAN CORPORATION FAF HARTING B
6/14/2007 ITT EDUCATIONAL SERVICES INC ESI BISBEE G6/21/2007 ALLTEL CORP AT SEITZ T6/22/2007 ABERCROMBIE & FITCH CO ANF BLACK J
36

Analyst
1 January 2004 to 20 March 2008Lehman Brothers Downgrade Events
Exhibit-3
Ticker Company NameDowngrade Date
6/25/2007 AMGEN INC AMGN BIRCHENOUGH J6/26/2007 HUMAN GENOME SCIENCES INC HGSI BIRCHENOUGH J6/26/2007 MILLENNIUM PHARMACEUTICALS MLNM BIRCHENOUGH J6/26/2007 BIOGEN IDEC INC BIIB BIRCHENOUGH J6/28/2007 U-STORE-IT TRUST YSI TOTI D7/2/2007 POWERWAVE TECHNOLOGIES INC PWAV KVAAL J7/2/2007 TAKE-TWO INTERACTIVE SOFTWRE TTWO HANDLER E7/2/2007 ACTIVISION BLIZZARD INC ATVI HANDLER E
7/24/2007 NISOURCE INC NI FORD D7/25/2007 WEIGHT WATCHERS INTL INC WTW LASSER M8/15/2007 KKR FINANCIAL HOLDINGS LLC KFN HARTING B8/15/2007 NEWCASTLE INVESTMENT CORP NCT HARTING B8/15/2007 ARBOR REALTY TRUST INC ABR HARTING B8/15/2007 MAGELLAN MIDSTREAM HOLDINGS MGG GROSS R9/6/2007 SL GREEN REALTY CORP SLG TOTI D
9/10/2007 PALM INC PALM KVAAL J9/19/2007 SVB FINANCIAL GROUP SIVB JAO A9/19/2007 TEXAS CAPITAL BANCSHARES INC TCBI JAO A9/19/2007 CULLEN FROST BANKERS INC CFR JAO A10/1/2007 NETLOGIC MICROSYSTEMS INC NETL SHAH/LUKE10/1/2007 INTEGRATED DEVICE TECH INC IDTI LUKE T10/1/2007 MARVELL TECHNOLOGY GROUP LTD MRVL SHAH R
10/10/2007 APPLIED MATERIALS INC AMAT MUSE C10/10/2007 LTX CORP LTXX EGAN D10/10/2007 NOVELLUS SYSTEMS INC NVLS MUSE C10/11/2007 BURLINGTON NORTHERN SANTA FE BNI CHASE G10/22/2007 PMI GROUP INC/THE PMI HARTING B10/22/2007 RADIAN GROUP INC RDN HARTING B10/22/2007 MGIC INVESTMENT CORP MTG HARTING B10/22/2007 UNIVERSAL TECHNICAL INSTITUT UTI BISBEE G10/22/2007 COUNTRYWIDE FINANCIAL CORP CFC HARTING B10/22/2007 WASTE MANAGEMENT INC WM WUH P10/22/2007 INDYMAC BANCORP INC IMB HARTING B10/29/2007 NVIDIA CORP NVDA LUKE T10/31/2007 LAS VEGAS SANDS CORP LVS HENDRIX F11/5/2007 MERRILL LYNCH & CO INC MER FREEMAN R11/5/2007 BEAR STEARNS BSC FREEMAN R
11/12/2007 AVENTINE RENEWABLE ENERGY AVR SINGHAL M11/12/2007 VERASUN ENERGY CORP VSE CHENG P11/16/2007 FANNIE MAE FNM HARTING B11/19/2007 LEAP WIRELESS INTL INC LEAP FELDMAN B11/21/2007 ITC HOLDINGS CORP ITC FORD D12/3/2007 AMERICAN AXLE & MFG HOLDINGS AXL JOHNSON B12/3/2007 JOHNSON CONTROLS INC JCI JOHNSON B12/3/2007 TENNECO INC TEN JOHNSON B12/3/2007 PINNACLE ENTERTAINMENT INC PNK HENDRIX F12/3/2007 UAL CORP UAUA CHASE G
12/13/2007 PAR PHARMACEUTICAL COS INC PRX SILVER R12/18/2007 MACK-CALI REALTY CORP CLI HARRIS D12/18/2007 COUSINS PROPERTIES INC CUZ TOTI D
37

Analyst
1 January 2004 to 20 March 2008Lehman Brothers Downgrade Events
Exhibit-3
Ticker Company NameDowngrade Date
1/3/2008 OSI PHARMACEUTICALS INC OSIP BIRCHENOUGH J1/4/2008 WESTLAKE CHEMICAL CORP WLK VASNETSOV S
1/10/2008 PARKER HANNIFIN CORP PH TISS J1/10/2008 MATRIA HEALTHCARE INC MATR RASKIN J1/17/2008 DECODE GENETICS INC DCGN GARDNER P1/23/2008 TEMPLE-INLAND INC TIN RUSCHMEIER P1/24/2008 OMNICARE INC OCR FEINSTEIN A2/15/2008 WHOLE FOODS MARKET INC WFMI ADLER M2/27/2008 CENTEX CORP CTX TALBOTT MCGRA M3/4/2008 CONOCOPHILLIPS COP CHENG P
3/11/2008 MOODY'S CORP MCO HUBER C
Notes and Source: [1] Data obtained from the I/B/E/S FirstCall Database.
38

d-10 d-9 d-8 d-7 d-6 d-5 d-4 d-3 d-2 d-1 d-0
Sample StatisticsSample Size 361 361 361 361 361 361 361 361 361 361 361Sample Mean -0.02% 0.05% 0.06% 0.06% 0.05% -0.08% 0.06% -0.12% -0.43% -0.63% -2.46%Sample Standard Deviation 2.37% 1.82% 1.96% 2.00% 3.06% 2.06% 2.14% 2.61% 2.91% 2.21% 3.82%
Test ResultsStandard Error of Mean 0.12% 0.10% 0.10% 0.11% 0.16% 0.11% 0.11% 0.14% 0.15% 0.12% 0.20%Degrees of Freedom 360 360 360 360 360 360 360 360 360 360 360t-statistic -0.18 0.57 0.54 0.54 0.28 -0.75 0.57 -0.90 -2.82 -5.43 -12.24p-value 85.97% 57.22% 58.70% 58.89% 77.72% 45.14% 56.77% 36.64% 0.51% 0.00% 0.00%
Significant at 5% level - - - - - - - - Yes Yes Yes
Exhibit-4t -Test Results
Days Prior to Lehman Brothers Downgrades
39

d-10 d-9 d-8 d-7 d-6 d-5 d-4 d-3 d-2 d-1 d-0
Sample Statistics Sample Size 361 361 361 361 361 361 361 361 361 361 361 Sample Median -0.03% 0.05% 0.06% 0.14% 0.04% -0.10% 0.01% 0.00% -0.13% -0.36% -1.84%
Sign Counts Num. of Negative Returns 185 174 176 166 174 191 180 180 200 229 301 Num. of Positive Returns 176 187 185 195 187 170 181 181 161 132 60
p-value 67.38% 52.77% 67.38% 14.05% 52.77% 29.25% 100.00% 100.00% 4.54% 0.00% 0.00%
Significant at 5% Level - - - - - - - - Yes Yes Yes
Exhibit-5
Sign Test Results
Days Prior to Lehman Brothers Downgrades
40

d-10 d-9 d-8 d-7 d-6 d-5 d-4 d-3 d-2 d-1 d-0
Sample StatisticsSample Size 361 361 361 361 361 361 361 361 361 361 361Sample Median -0.03% 0.05% 0.06% 0.14% 0.04% -0.10% 0.01% 0.00% -0.13% -0.36% -1.84%
Ranking InformationNumber of Tied Values 0 0 0 0 0 0 0 0 0 0 0Sum of Negative Ranks 32,901 31,333 31,127 30,972 30,421 34,243 32,363 32,898 37,525 43,646 58,720Sum of Positive Ranks (Test Statistic) 32,440 34,008 34,214 34,369 34,920 31,098 32,978 32,443 27,816 21,695 6,621
p-value 90.77% 50.04% 43.68% 39.21% 25.70% 42.82% 87.70% 90.89% 1.44% 0.00% 0.00%
Significant at 5% level - - - - - - - - Yes Yes Yes
Exhibit-6
Wilcoxon Signed-Rank Test Results
Days Prior to Lehman Brothers Downgrades
41

d-10 d-9 d-8 d-7 d-6 d-5 d-4 d-3 d-2 d-1 d-0
Sample StatisticsSample Size 15 15 15 15 15 15 15 15 15 15 15Sample Mean -0.19% 0.51% -0.72% 0.41% 0.34% 0.41% 0.93% -0.27% 0.01% -1.69% -3.79%Sample Standard Deviation 1.38% 2.15% 2.06% 2.16% 1.57% 2.37% 4.52% 1.49% 1.89% 3.31% 4.01%
Test ResultsStandard Error of Mean 0.36% 0.56% 0.53% 0.56% 0.40% 0.61% 1.17% 0.39% 0.49% 0.85% 1.03%Degrees of Freedom 14 14 14 14 14 14 14 14 14 14 14t-statistic -0.54 0.92 -1.35 0.73 0.84 0.66 0.80 -0.71 0.03 -1.98 -3.66p-value 59.89% 37.48% 19.92% 47.52% 41.51% 51.79% 43.82% 49.06% 97.81% 6.81% 0.26%
Significant at 5% level ! ! ! ! ! ! ! ! ! ! Yes
Exhibit-7at -Test Results for J. Birchenough
Days Prior to Lehman Brothers Downgrades
42

d-10 d-9 d-8 d-7 d-6 d-5 d-4 d-3 d-2 d-1 d-0
Sample StatisticsSample Size 10 10 10 10 10 10 10 10 10 10 10Sample Mean 1.33% -0.94% 0.56% -0.70% 0.54% -1.03% -1.24% 0.05% -3.65% -2.86% -5.37%Sample Standard Deviation 2.77% 4.18% 2.22% 1.63% 2.51% 1.03% 2.64% 2.32% 1.11% 2.07% 4.77%
Test ResultsStandard Error of Mean 0.88% 1.32% 0.70% 0.51% 0.79% 0.33% 0.83% 0.73% 0.35% 0.65% 1.51%Degrees of Freedom 9 9 9 9 9 9 9 9 9 9 9t-statistic 1.52 -0.71 0.79 -1.37 0.68 -3.16 -1.48 0.07 -10.39 -4.38 -3.56p-value 16.32% 49.33% 44.84% 20.44% 51.27% 1.16% 17.18% 94.45% 0.00% 0.18% 0.61%
Significant at 5% level - - - - - Yes - - Yes Yes Yes
Exhibit-7bt -Test Results for A. Chanda
Days Prior to Lehman Brothers Downgrades
43

d-10 d-9 d-8 d-7 d-6 d-5 d-4 d-3 d-2 d-1 d-0
Sample StatisticsSample Size 14 14 14 14 14 14 14 14 14 14 14Sample Mean 1.38% -0.03% 0.52% -0.31% 1.12% 0.55% 0.86% 1.01% -0.42% -0.56% -1.16%Sample Standard Deviation 3.14% 1.94% 3.01% 2.52% 3.10% 1.53% 2.69% 1.86% 2.65% 1.98% 3.88%
Test ResultsStandard Error of Mean 0.84% 0.52% 0.80% 0.67% 0.83% 0.41% 0.72% 0.50% 0.71% 0.53% 1.04%Degrees of Freedom 13 13 13 13 13 13 13 13 13 13 13t-statistic 1.65 -0.06 0.64 -0.46 1.35 1.34 1.19 2.03 -0.59 -1.06 -1.12p-value 12.35% 95.58% 53.06% 65.25% 20.13% 20.22% 25.57% 6.33% 56.80% 30.78% 28.39%
Significant at 5% level - - - - - - - - - - -
Exhibit-7ct -Test Results for G. Chase
Days Prior to Lehman Brothers Downgrades
44
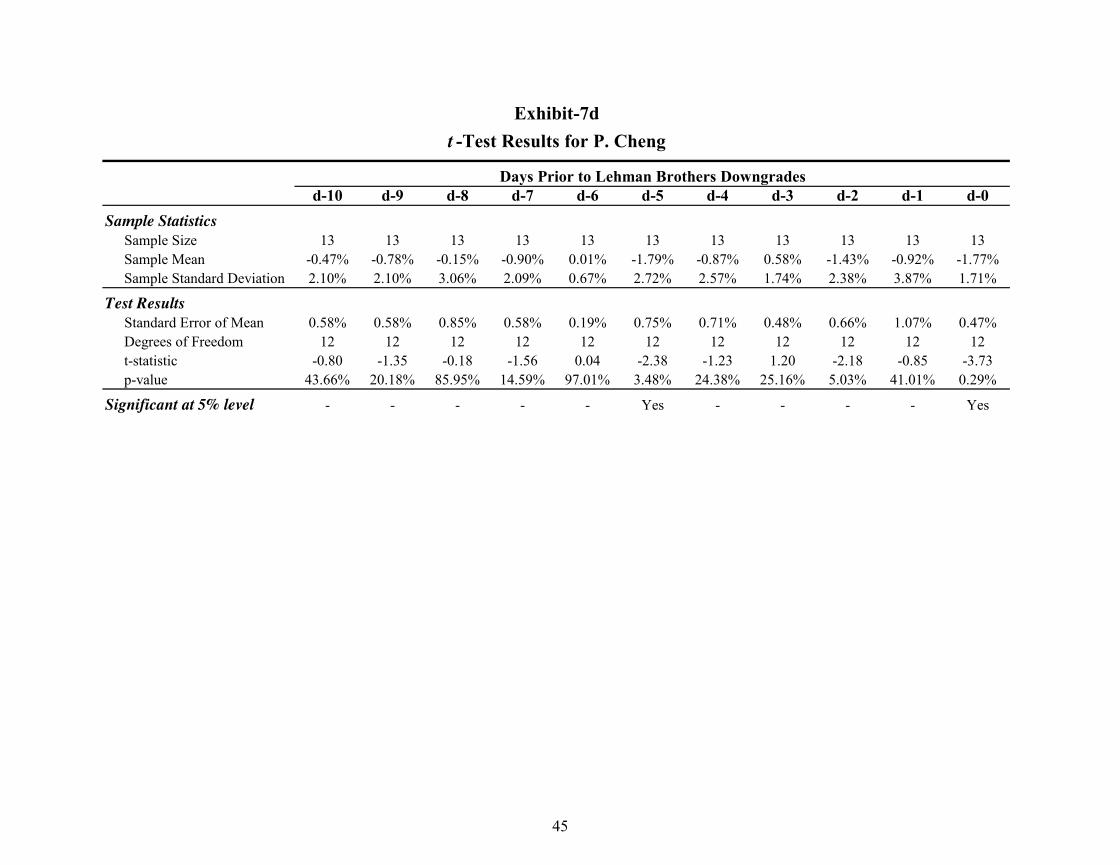
d-10 d-9 d-8 d-7 d-6 d-5 d-4 d-3 d-2 d-1 d-0
Sample StatisticsSample Size 13 13 13 13 13 13 13 13 13 13 13Sample Mean -0.47% -0.78% -0.15% -0.90% 0.01% -1.79% -0.87% 0.58% -1.43% -0.92% -1.77%Sample Standard Deviation 2.10% 2.10% 3.06% 2.09% 0.67% 2.72% 2.57% 1.74% 2.38% 3.87% 1.71%
Test ResultsStandard Error of Mean 0.58% 0.58% 0.85% 0.58% 0.19% 0.75% 0.71% 0.48% 0.66% 1.07% 0.47%Degrees of Freedom 12 12 12 12 12 12 12 12 12 12 12t-statistic -0.80 -1.35 -0.18 -1.56 0.04 -2.38 -1.23 1.20 -2.18 -0.85 -3.73p-value 43.66% 20.18% 85.95% 14.59% 97.01% 3.48% 24.38% 25.16% 5.03% 41.01% 0.29%
Significant at 5% level - - - - - Yes - - - - Yes
Exhibit-7dt -Test Results for P. Cheng
Days Prior to Lehman Brothers Downgrades
45

d-10 d-9 d-8 d-7 d-6 d-5 d-4 d-3 d-2 d-1 d-0Sample Statistics
Sample Size 14 14 14 14 14 14 14 14 14 14 14Sample Mean -3.00% 0.79% -0.41% -1.34% -1.28% 0.75% -0.23% -4.98% -3.53% -3.69% -4.71%Sample Standard Deviation 4.40% 3.63% 2.47% 2.20% 1.71% 2.40% 4.17% 6.98% 4.71% 3.86% 9.26%
Test ResultsStandard Error of Mean 1.18% 0.97% 0.66% 0.59% 0.46% 0.64% 1.11% 1.87% 1.26% 1.03% 2.48%Degrees of Freedom 13 13 13 13 13 13 13 13 13 13 13t-statistic -2.55 0.81 -0.62 -2.27 -2.79 1.18 -0.21 -2.67 -2.80 -3.58 -1.90p-value 2.41% 43.28% 54.42% 4.05% 1.53% 25.97% 83.81% 1.94% 1.50% 0.34% 7.94%
Significant at 5% level Yes - - Yes Yes - - Yes Yes Yes -
Exhibit-7et -Test Results for B. Harting
Days Prior to Lehman Brothers Downgrades
46

d-10 d-9 d-8 d-7 d-6 d-5 d-4 d-3 d-2 d-1 d-0
Sample StatisticsSample Size 11 11 11 11 11 11 11 11 11 11 11Sample Mean -0.08% 0.07% -0.08% -0.71% -0.01% -0.47% -0.42% 0.27% -0.33% -0.54% -2.45%Sample Standard Deviation 0.73% 0.67% 1.16% 1.59% 0.80% 2.01% 0.37% 0.98% 0.79% 1.03% 1.31%
Test ResultsStandard Error of Mean 0.22% 0.20% 0.35% 0.48% 0.24% 0.61% 0.11% 0.30% 0.24% 0.31% 0.40%Degrees of Freedom 10 10 10 10 10 10 10 10 10 10 10t-statistic -0.358 0.351 -0.239 -1.480 -0.022 -0.772 -3.759 0.926 -1.395 -1.730 -6.181p-value 72.76% 73.25% 81.57% 16.98% 98.31% 45.82% 0.37% 37.63% 19.33% 11.42% 0.01%
Significant at 5% level - - - - - - Yes - - - Yes
Exhibit-7ft -Test Results for A. Jao
Days Prior to Lehman Brothers Downgrades
47

d-10 d-9 d-8 d-7 d-6 d-5 d-4 d-3 d-2 d-1 d-0
Sample StatisticsSample Size 10 10 10 10 10 10 10 10 10 10 10Sample Mean -0.69% 0.56% 0.11% 1.12% -0.08% -0.01% 0.25% -0.48% -1.47% -1.78% -3.87%Sample Standard Deviation 1.56% 1.86% 4.03% 0.98% 1.97% 2.30% 2.17% 1.81% 2.93% 1.46% 5.39%
Test ResultsStandard Error of Mean 0.49% 0.59% 1.27% 0.31% 0.62% 0.73% 0.69% 0.57% 0.93% 0.46% 1.70%Degrees of Freedom 9 9 9 9 9 9 9 9 9 9 9t-statistic -1.40 0.95 0.09 3.59 -0.12 -0.02 0.36 -0.83 -1.58 -3.84 -2.27p-value 19.50% 36.88% 93.21% 0.58% 90.53% 98.53% 72.64% 42.64% 14.81% 0.40% 4.93%
Significant at 5% level - - - Yes - - - - - Yes Yes
Exhibit-7gt -Test Results for T. Luke
Days Prior to Lehman Brothers Downgrades
48

d-10 d-9 d-8 d-7 d-6 d-5 d-4 d-3 d-2 d-1 d-0
Sample StatisticsSample Size 18 18 18 18 18 18 18 18 18 18 18Sample Mean 0.35% 0.75% 0.01% -0.08% -1.09% 0.11% 0.30% 1.37% 1.24% -0.40% -3.17%Sample Standard Deviation 1.31% 1.64% 1.78% 1.42% 2.77% 1.88% 1.25% 2.55% 2.17% 2.25% 2.39%
Test ResultsStandard Error of Mean 0.31% 0.39% 0.42% 0.33% 0.65% 0.44% 0.29% 0.60% 0.51% 0.53% 0.56%Degrees of Freedom 17 17 17 17 17 17 17 17 17 17 17t-statistic 1.14 1.94 0.03 -0.25 -1.67 0.24 1.03 2.28 2.44 -0.75 -5.62p-value 27.17% 6.93% 97.51% 80.28% 11.38% 81.47% 31.85% 3.56% 2.62% 46.21% 0.00%
Significant at 5% level - - - - - - - Yes Yes - Yes
Exhibit-7ht -Test Results for R. Shah
Days Prior to Lehman Brothers Downgrades
49

d-10 d-9 d-8 d-7 d-6 d-5 d-4 d-3 d-2 d-1 d-0
Sample Statistics Sample Size 15 15 15 15 15 15 15 15 15 15 15 Sample Median -0.22% 0.53% -0.89% 0.47% 0.49% -0.03% 0.30% -0.05% -0.08% -1.54% -3.40%
Sign Counts Num. of Negative Returns 8 5 8 7 5 8 6 9 8 11 12 Num. of Positive Returns 7 10 7 8 10 7 9 6 7 4 3
p-value 100.00% 30.18% 100.00% 100.00% 30.18% 100.00% 60.72% 60.72% 100.00% 11.85% 3.52%
Significant at 5% Level - - - - - - - - - - Yes
Days Prior to Lehman Brothers Downgrades
Exhibit-8a
Sign Test Results for J. Birchenough
50
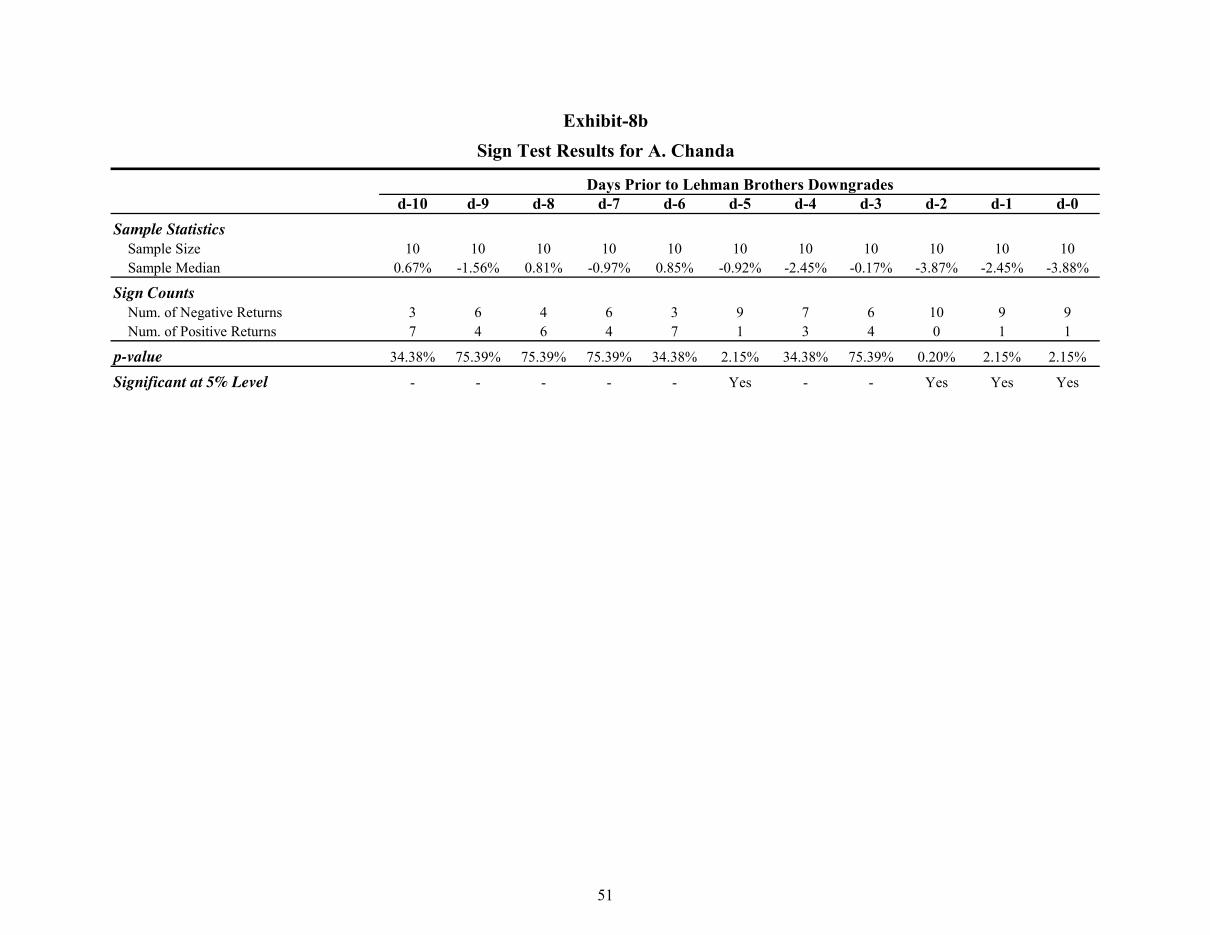
d-10 d-9 d-8 d-7 d-6 d-5 d-4 d-3 d-2 d-1 d-0
Sample Statistics Sample Size 10 10 10 10 10 10 10 10 10 10 10 Sample Median 0.67% -1.56% 0.81% -0.97% 0.85% -0.92% -2.45% -0.17% -3.87% -2.45% -3.88%
Sign Counts Num. of Negative Returns 3 6 4 6 3 9 7 6 10 9 9 Num. of Positive Returns 7 4 6 4 7 1 3 4 0 1 1
p-value 34.38% 75.39% 75.39% 75.39% 34.38% 2.15% 34.38% 75.39% 0.20% 2.15% 2.15%
Significant at 5% Level - - - - - Yes - - Yes Yes Yes
Exhibit-8b
Sign Test Results for A. Chanda
Days Prior to Lehman Brothers Downgrades
51

d-10 d-9 d-8 d-7 d-6 d-5 d-4 d-3 d-2 d-1 d-0
Sample Statistics Sample Size 14 14 14 14 14 14 14 14 14 14 14 Sample Median 0.34% -0.20% 0.95% -0.23% 1.14% 0.47% 0.49% 0.59% -0.70% -0.57% -0.35%
Sign Counts Num. of Negative Returns 6 7 5 7 6 5 3 5 10 9 7 Num. of Positive Returns 8 7 9 7 8 9 11 9 4 5 7
p-value 79.05% 100.00% 42.40% 100.00% 79.05% 42.40% 5.74% 42.40% 17.96% 42.40% 100.00%
Significant at 5% Level - - - - - - - - - - -
Exhibit-8c
Sign Test Results for G. Chase
Days Prior to Lehman Brothers Downgrades
52

d-10 d-9 d-8 d-7 d-6 d-5 d-4 d-3 d-2 d-1 d-0
Sample Statistics Sample Size 13 13 13 13 13 13 13 13 13 13 13 Sample Median -0.02% 0.08% -0.37% -0.01% 0.04% -1.47% -0.59% 0.31% -0.53% -0.35% -1.39%
Sign Counts Num. of Negative Returns 7 6 8 7 6 9 8 6 11 8 12 Num. of Positive Returns 6 7 5 6 7 4 5 7 2 5 1
p-value 100.00% 100.00% 58.11% 100.00% 100.00% 26.68% 58.11% 100.00% 2.25% 58.11% 0.34%
Significant at 5% Level - - - - - - - - Yes - Yes
Exhibit-8d
Sign Test Results for P. Cheng
Days Prior to Lehman Brothers Downgrades
53

d-10 d-9 d-8 d-7 d-6 d-5 d-4 d-3 d-2 d-1 d-0Sample Statistics Sample Size 14 14 14 14 14 14 14 14 14 14 14 Sample Median -1.04% -0.07% -0.48% -1.34% -1.22% 0.24% -0.45% -3.65% -1.96% -2.30% -1.98%
Sign Counts Num. of Negative Returns 11 7 8 10 9 7 9 9 11 12 10 Num. of Positive Returns 3 7 6 4 5 7 5 5 3 2 4
p-value 5.74% 100.00% 79.05% 17.96% 42.40% 100.00% 42.40% 42.40% 5.74% 1.29% 17.96%
Significant at 5% Level - - - - - - - - - Yes -
Exhibit-8eSign Test Results for B. Harting
Days Prior to Lehman Brothers Downgrades
54

d-10 d-9 d-8 d-7 d-6 d-5 d-4 d-3 d-2 d-1 d-0
Sample Statistics Sample Size 11 11 11 11 11 11 11 11 11 11 11 Sample Median -0.08% 0.18% -0.14% -0.12% 0.00% -0.33% -0.46% 0.43% -0.52% -0.22% -2.17%
Sign Counts Num. of Negative Returns 6 4 6 8 6 7 10 4 7 8 11 Num. of Positive Returns 5 7 5 3 5 4 1 7 4 3 0
p-value 100.00% 54.88% 100.00% 22.66% 100.00% 54.88% 1.17% 54.88% 54.88% 22.66% 0.10%
Significant at 5% Level - - - - - - Yes - - - Yes
Exhibit-8f
Sign Test Results for A. Jao
Days Prior to Lehman Brothers Downgrades
55

d-10 d-9 d-8 d-7 d-6 d-5 d-4 d-3 d-2 d-1 d-0
Sample Statistics Sample Size 10 10 10 10 10 10 10 10 10 10 10 Sample Median -0.70% 1.11% -1.18% 1.08% 0.09% -0.57% 0.38% -0.20% -0.43% -1.36% -2.42%
Sign Counts Num. of Negative Returns 7 4 6 1 5 6 4 6 7 10 9 Num. of Positive Returns 3 6 4 9 5 4 6 4 3 0 1
p-value 34.38% 75.39% 75.39% 2.15% 100.00% 75.39% 75.39% 75.39% 34.38% 0.20% 2.15%
Significant at 5% Level - - - Yes - - - - - Yes Yes
Exhibit-8g
Sign Test Results for T. Luke
Days Prior to Lehman Brothers Downgrades
56

d-10 d-9 d-8 d-7 d-6 d-5 d-4 d-3 d-2 d-1 d-0
Sample Statistics Sample Size 18 18 18 18 18 18 18 18 18 18 18 Sample Median 0.24% 0.51% 0.36% -0.22% -1.07% 0.17% 0.59% 0.76% 0.41% -0.72% -3.03%
Sign Counts Num. of Negative Returns 7 7 8 10 11 9 8 5 8 11 16 Num. of Positive Returns 11 11 10 8 7 9 10 13 10 7 2
p-value 48.07% 48.07% 81.45% 81.45% 48.07% 100.00% 81.45% 9.63% 81.45% 48.07% 0.13%
Significant at 5% Level - - - - - - - - - - Yes
Exhibit-8h
Sign Test Results for R. Shah
Days Prior to Lehman Brothers Downgrades
57
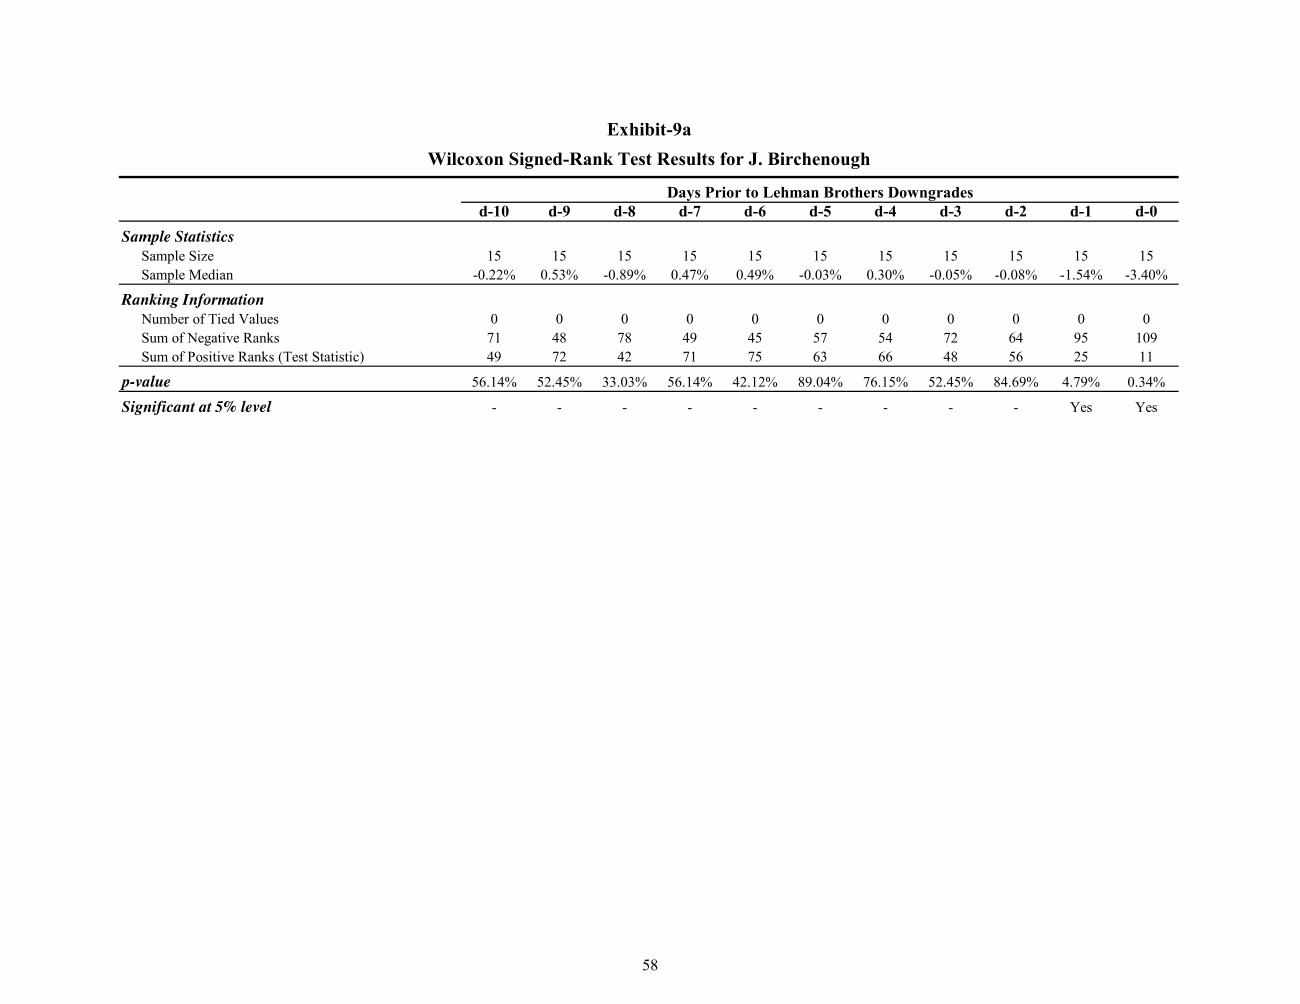
d-10 d-9 d-8 d-7 d-6 d-5 d-4 d-3 d-2 d-1 d-0
Sample StatisticsSample Size 15 15 15 15 15 15 15 15 15 15 15Sample Median -0.22% 0.53% -0.89% 0.47% 0.49% -0.03% 0.30% -0.05% -0.08% -1.54% -3.40%
Ranking InformationNumber of Tied Values 0 0 0 0 0 0 0 0 0 0 0Sum of Negative Ranks 71 48 78 49 45 57 54 72 64 95 109Sum of Positive Ranks (Test Statistic) 49 72 42 71 75 63 66 48 56 25 11
p-value 56.14% 52.45% 33.03% 56.14% 42.12% 89.04% 76.15% 52.45% 84.69% 4.79% 0.34%
Significant at 5% level - - - - - - - - - Yes Yes
Days Prior to Lehman Brothers Downgrades
Wilcoxon Signed-Rank Test Results for J. Birchenough
Exhibit-9a
58

d-10 d-9 d-8 d-7 d-6 d-5 d-4 d-3 d-2 d-1 d-0
Sample StatisticsSample Size 10 10 10 10 10 10 10 10 10 10 10Sample Median 0.67% -1.56% 0.81% -0.97% 0.85% -0.92% -2.45% -0.17% -3.87% -2.45% -3.88%
Ranking InformationNumber of Tied Values 0 0 0 0 0 0 0 0 0 0 0Sum of Negative Ranks 14 35 21 40 19 51 44 30 55 54 54Sum of Positive Ranks (Test Statistic) 41 20 34 15 36 4 11 25 0 1 1
p-value 19.34% 49.22% 55.66% 23.24% 43.16% 1.37% 10.55% 84.57% 0.20% 0.39% 0.39%
Significant at 5% level - - - - - Yes - - Yes Yes Yes
Exhibit-9b
Wilcoxon Signed-Rank Test Results for A. Chanda
Days Prior to Lehman Brothers Downgrades
59

d-10 d-9 d-8 d-7 d-6 d-5 d-4 d-3 d-2 d-1 d-0
Sample StatisticsSample Size 14 14 14 14 14 14 14 14 14 14 14Sample Median 0.34% -0.20% 0.95% -0.23% 1.14% 0.47% 0.49% 0.59% -0.70% -0.57% -0.35%
Ranking InformationNumber of Tied Values 0 0 0 0 0 0 0 0 0 0 0Sum of Negative Ranks 35 54 35 60 41 35 28 26 67 68 67Sum of Positive Ranks (Test Statistic) 70 51 70 45 64 70 77 79 38 37 38
p-value 29.58% 95.15% 29.58% 66.98% 50.16% 29.58% 13.53% 10.40% 39.10% 35.75% 39.10%
Significant at 5% level - - - - - - - - - - -
Exhibit-9c
Wilcoxon Signed-Rank Test Results for G. Chase
Days Prior to Lehman Brothers Downgrades
60
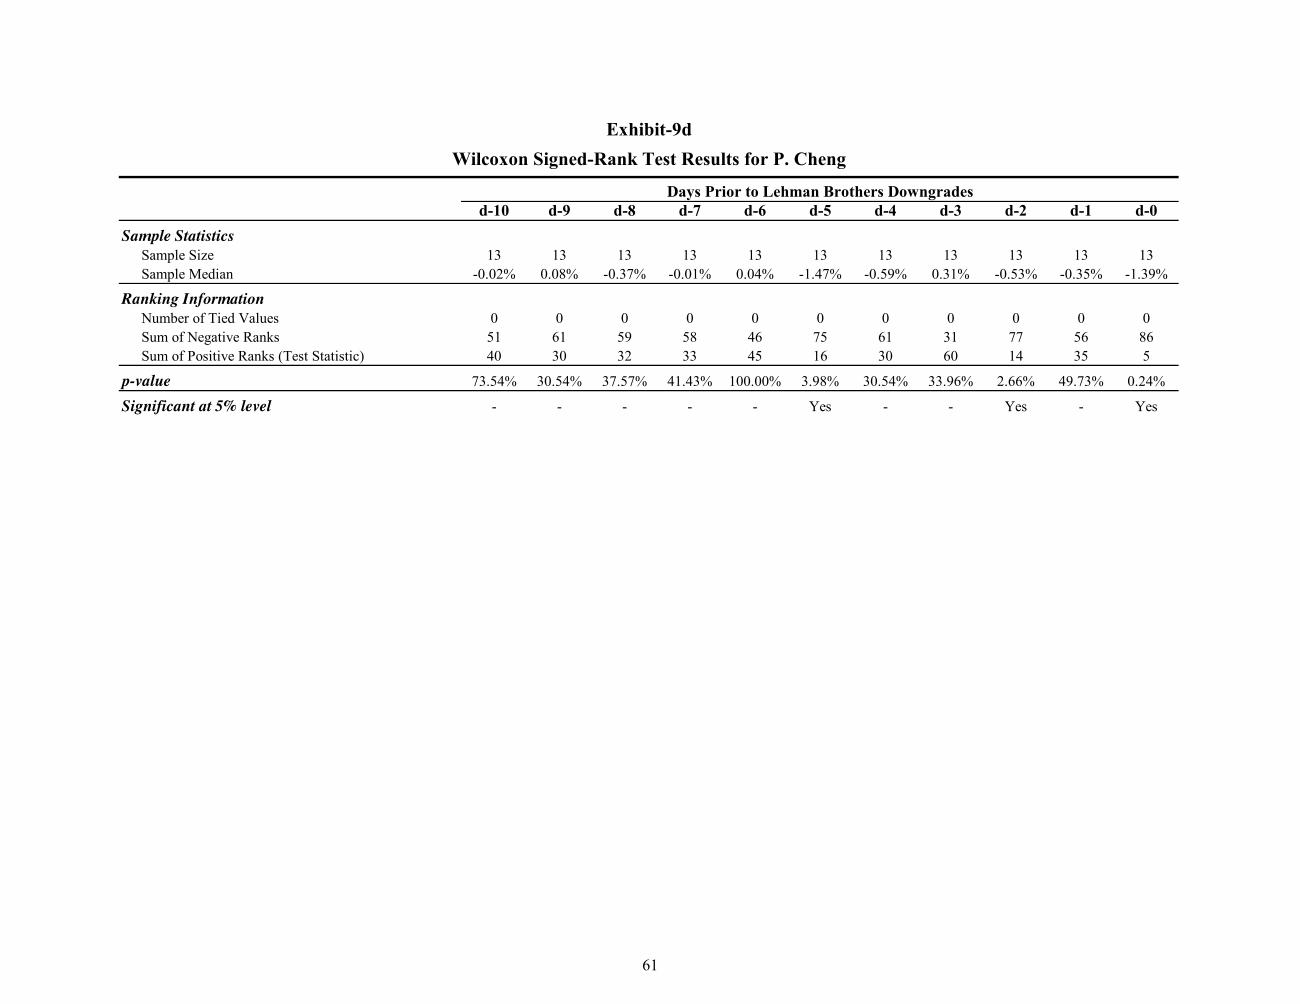
d-10 d-9 d-8 d-7 d-6 d-5 d-4 d-3 d-2 d-1 d-0
Sample StatisticsSample Size 13 13 13 13 13 13 13 13 13 13 13Sample Median -0.02% 0.08% -0.37% -0.01% 0.04% -1.47% -0.59% 0.31% -0.53% -0.35% -1.39%
Ranking InformationNumber of Tied Values 0 0 0 0 0 0 0 0 0 0 0Sum of Negative Ranks 51 61 59 58 46 75 61 31 77 56 86Sum of Positive Ranks (Test Statistic) 40 30 32 33 45 16 30 60 14 35 5
p-value 73.54% 30.54% 37.57% 41.43% 100.00% 3.98% 30.54% 33.96% 2.66% 49.73% 0.24%
Significant at 5% level - - - - - Yes - - Yes - Yes
Exhibit-9d
Wilcoxon Signed-Rank Test Results for P. Cheng
Days Prior to Lehman Brothers Downgrades
61

d-10 d-9 d-8 d-7 d-6 d-5 d-4 d-3 d-2 d-1 d-0Sample Statistics
Sample Size 14 14 14 14 14 14 14 14 14 14 14Sample Median -1.04% -0.07% -0.48% -1.34% -1.22% 0.24% -0.45% -3.65% -1.96% -2.30% -1.98%
Ranking InformationNumber of Tied Values 0 0 0 0 0 0 0 0 0 0 0Sum of Negative Ranks 90 48 65 87 87 40 65 89 88 97 91Sum of Positive Ranks (Test Statistic) 15 57 40 18 18 65 40 16 17 8 14
p-value 1.66% 80.77% 46.31% 2.95% 2.95% 46.31% 46.31% 2.03% 2.45% 0.31% 1.34%
Significant at 5% level Yes - - Yes Yes - - Yes Yes Yes Yes
Exhibit-9eWilcoxon Signed-Rank Test Results for B. Harting
Days Prior to Lehman Brothers Downgrades
62

d-10 d-9 d-8 d-7 d-6 d-5 d-4 d-3 d-2 d-1 d-0
Sample StatisticsSample Size 11 11 11 11 11 11 11 11 11 11 11Sample Median -0.08% 0.18% -0.14% -0.12% 0.00% -0.33% -0.46% 0.43% -0.52% -0.22% -2.17%
Ranking InformationNumber of Tied Values 0 0 0 0 0 0 0 0 0 0 0Sum of Negative Ranks 33 26 34 49 33 40 63 25 48 52 66Sum of Positive Ranks (Test Statistic) 33 40 32 17 33 26 3 41 18 14 0
p-value 100.00% 57.71% 96.58% 17.48% 100.00% 57.71% 0.49% 51.95% 20.61% 10.16% 0.10%
Significant at 5% level - - - - - - Yes - - - Yes
Exhibit-9f
Wilcoxon Signed-Rank Test Results for A. Jao
Days Prior to Lehman Brothers Downgrades
63

d-10 d-9 d-8 d-7 d-6 d-5 d-4 d-3 d-2 d-1 d-0
Sample StatisticsSample Size 10 10 10 10 10 10 10 10 10 10 10Sample Median -0.70% 1.11% -1.18% 1.08% 0.09% -0.57% 0.38% -0.20% -0.43% -1.36% -2.42%
Ranking InformationNumber of Tied Values 0 0 0 0 0 0 0 0 0 0 0Sum of Negative Ranks 42 14 30 2 29 27 22 34 41 55 52Sum of Positive Ranks (Test Statistic) 13 41 25 53 26 28 33 21 14 0 3
p-value 16.02% 19.34% 84.57% 0.59% 92.19% 100.00% 62.50% 55.66% 19.34% 0.20% 0.98%
Significant at 5% level - - - Yes - - - - - Yes Yes
Exhibit-9g
Wilcoxon Signed-Rank Test Results for T. Luke
Days Prior to Lehman Brothers Downgrades
64

d-10 d-9 d-8 d-7 d-6 d-5 d-4 d-3 d-2 d-1 d-0
Sample StatisticsSample Size 18 18 18 18 18 18 18 18 18 18 18Sample Median 0.24% 0.51% 0.36% -0.22% -1.07% 0.17% 0.59% 0.76% 0.41% -0.72% -3.03%
Ranking InformationNumber of Tied Values 0 0 0 0 0 0 0 0 0 0 0Sum of Negative Ranks 59 45 76 91 123 84 58 34 44 111 167Sum of Positive Ranks (Test Statistic) 112 126 95 80 48 87 113 137 127 60 4
p-value 25.75% 8.15% 69.51% 82.76% 10.71% 96.53% 23.97% 2.63% 7.42% 27.63% 0.04%
Significant at 5% level - - - - - - - Yes - - Yes
Exhibit-9h
Wilcoxon Signed-Rank Test Results for R. Shah
Days Prior to Lehman Brothers Downgrades
65
![arXiv:0912.4404v1 [q-fin.PR] 22 Dec 2009 · and Equity Return Swap valuation under Counterparty Risk ... Tarenghi: Structural Model - Lehman CDS calibration + equity swaps CVA 4 2](https://img.dokumen.tips/doc/110x75/5b214c927f8b9a88348b46ab/arxiv09124404v1-q-finpr-22-dec-2009-and-equity-return-swap-valuation-under.jpg)