Embed Size (px)
Citation preview

Legionnaires’ disease: Results From - and Legionnaires’ disease: Results From - and Evaluation of - a Quantitative Microbial Risk Evaluation of - a Quantitative Microbial Risk
AssessmentAssessment
American Industrial Hygiene Conference and ExhibitionAmerican Industrial Hygiene Conference and ExhibitionPhiladelphia, PA June 7, 2007Philadelphia, PA June 7, 2007
Thomas W. Armstrong, ExxonMobil Biomedical Sciences, Inc., Annandale, NJ Thomas W. Armstrong, ExxonMobil Biomedical Sciences, Inc., Annandale, NJ Charles N. Haas, Drexel University, Philadelphia, PA Charles N. Haas, Drexel University, Philadelphia, PA

Armstrong & Haas AIHCE 2007 2
PresentationPresentation Contents Contents
Background on Legionella and Legionnaires’ Disease
Research Objectives Methods Results Discussion

Armstrong & Haas AIHCE 2007 3
Background Background Legionella Legionella and and LegionnairesLegionnaires’ Disease’ Disease
• Legionnaires’ disease (LD) - first reported in 1976, Legionnaires’ disease (LD) - first reported in 1976, American Legion Convention, PhiladelphiaAmerican Legion Convention, Philadelphia
• LD caused by various species of the bacterial genus LD caused by various species of the bacterial genus Legionella and most commonly Legionella and most commonly L. pneumophila (Lp)L. pneumophila (Lp)
• Community acquired pneumonia attributed to Community acquired pneumonia attributed to Legionella may be between 4 and 20%Legionella may be between 4 and 20%
• LD remains rather prevalent (10,000 to 30,000 cases LD remains rather prevalent (10,000 to 30,000 cases estimated per year in the USA)estimated per year in the USA)
• LD is a pneumonia that typically has a 5 to 15% LD is a pneumonia that typically has a 5 to 15% mortality rate once developed to the point that mortality rate once developed to the point that medical care is neededmedical care is needed

Armstrong & Haas AIHCE 2007 4
Background Background (continued)(continued)Legionella Legionella and Legionnaires’ Diseaseand Legionnaires’ Disease
• Widely distributed in soils and surface waters• Legionella are relatively chlorine resistant,
compared to usual water quality indicator bacteria• Legionella thrive in warm water environments,
including hot water supply systems, cooling towers, hot tubs, thermal springs, and more
• Natural hosts are protozoa. The mechanisms Legionella evolved to replicate in protozoa also subvert human alveolar macrophage bactericidal mechanisms

Armstrong & Haas AIHCE 2007 5
Legionnaires' Disease Legionnaires' Disease ProgressionProgression
P exposure P mild infection
P clinical disease
P mortality
Probability (P) of exposure > P mild infection > P clinical disease > P mortality

Armstrong & Haas AIHCE 2007 6
Research ObjectivesResearch Objectives Develop a Quantitative Microbial Risk
Assessment (QMRA) model for LD Evaluate the model’s adequacy for
quantitatively estimating human health risks resulting from Legionella exposure - do the binomial confidence intervals of the calculated and reported rates overlap?
Identify strengths and limitations of the data used for this QMRA model

Armstrong & Haas AIHCE 2007 7
LD QMRA Development & EvaluationLD QMRA Development & Evaluation
Information from the dose-response assessment (branch 1) and the exposure assessment (branch 2) converges at the risk assessment and validation stage (3). Data from outbreaks of Legionnaires' disease were applied to validate the risk assessment model.
Animal dose-response modeling
Animal to human extrapolation
Predicted human dose-response
Outbreak selection, source parameters, modeling
2. Exposure assessment
1. Dose-responseAnalyses
3. Risk assessmentand Model Evaluation
Human uptake, delivered dose
Animal model Selection
START

Armstrong & Haas AIHCE 2007 8
Dose-Response, Animal Model SelectionDose-Response, Animal Model Selection
Guinea pigs provide a reasonable animal model and dose-response data for human risk projections
• Similar course of the disease in guinea pigs & humans
• Similar in vitro uptake (and replication) of Legionella in human & guinea pig alveolar macrophages
• Most mouse and rat strains appear resistant to Legionella infection due to less compliant alveolar macrophages
• Non-human primates also show resistance, but the data are limited

Armstrong & Haas AIHCE 2007 9
Animal Dose-Response ModelsAnimal Dose-Response ModelsDose-response models allow the extrapolation of
responses to doses below the experimental range used to set the model parameters
• Models provide the response probability at a given dose• Model parameters were fit to Legionella dose-response
data using maximum likelihood techniques• Other models run, but exponential and approximate
beta-Poisson models selected for subsequent risk projection work due to mechanistic considerations and low dose extrapolation limited by exposure probability
• Goodness of fit tested & passed for the data sets employed

Armstrong & Haas AIHCE 2007 10
Dose-Response Models (cDose-Response Models (continued)ontinued)
Data for guinea pig aerosol exposure studies include mortality and sub-lethal infection
• The mortality data were evaluated as a basis for mortality or clinical severity (e.g., pneumonia with hospitalization) disease
• The sub-lethal infection (e.g., fever, spontaneous recovery) data were evaluated as a basis for projecting human risks of infection as measured by seroconversion in an outbreak
• Infectivity (ID) and mortality (LD) dose-response curves in guinea pigs developed for the selected dose-response models
• The low-dose extrapolation results were examined for the various models

Armstrong & Haas AIHCE 2007 11
Dose-response Model FindingsDose-response Model Findings• The estimated responses are, for guinea pigs, as retained dose in
animal lungs:• LD50% 6200 CFU, LD1% 92 CFU• ID50% 12 CFU, ID1% 0.17 CFU
• For the exponential model
Where P(d) = probability of response and d = dose the best fit r = 0.06 for infectious dose and r = 1.07 X 10⁻⁴ for mortality
• Dose scaling is not needed for intracellular pathogens• No interspecies factors were applied for the guinea pig to human
extrapolation
P(d)=e-rd

Armstrong & Haas AIHCE 2007 12
Estimates of Human Exposure in Selected Estimates of Human Exposure in Selected OutbreaksOutbreaks
Estimating exposures for the outbreaks was necessary for our LD QMRA model evaluation• No LD outbreak reports existed with relevant air
concentration data (investigations emphasize resolution, not research!) and LD rates
• Cooling towers were considered for evaluation but presented several obstacles
• Whirlpool spas have been implicated in numerous LD outbreaks• Natural Hot Spring Spas have also had numerous LD outbreaks,
including several well-documented outbreaks in Japan
If direct data on outbreak exposures were available, the LD If direct data on outbreak exposures were available, the LD QMRA Model would be largely irrelevantQMRA Model would be largely irrelevant

Armstrong & Haas AIHCE 2007 13
Exposure (continued)Exposure (continued)• Three LD outbreaks - a whirlpool spa outbreak
and two hot spring spas - were selected (few if any others had close to adequate data for exposure estimating)
• The data available were assembled• Approaches for resolving unreported data
needed for exposure predictions were developed• Exposures for the outbreak cases were estimated
using exposure modeling techniques, including:• Near field-far field dispersion for the whirlpool spa• Bacterial water to air partitioning coefficient for the
natural hot springs

Armstrong & Haas AIHCE 2007 14
Whirlpool SpasWhirlpool Spas

Armstrong & Haas AIHCE 2007 15
Whirlpool Spa OutbreakWhirlpool Spa Outbreak
• Closest to ideal data from West Frisian Floral Show Outbreak (The Netherlands, 1999), a large outbreak with up to 318 cases (188 confirmed and probable, remainder suspected cases) cases and 29 fatalities (21 among confirmed and probable for an 11% fatality rate)
• Most detailed data available for personnel who worked in the exhibition halls – a subset of the total cases
• Aerosol generation data for whirlpool spas (but not aerosol Legionella content) are from published sources
• Microbial enrichment in aqueous aerosol (compared to bulk water phase) can occur due to rising bubble surface scavenging of bacteria and surface film droplet formation mechanisms

Armstrong & Haas AIHCE 2007 16
Whirlpool Spa Whirlpool Spa (continued)(continued)
• Infection rates versus distance from source reported by Nagelkerke 2003 for workers in Hall 3
• Clinical Legionellosis rates, work hours in Hall 3, some building physical dimension reported by den Boer 2002
• No air concentration data on Lp during or after the outbreak or water concentration data for Lp in the likely source spa are available
• Presume water content as for whirlpool spas from other LD case reports
• Estimate Lp “generation rate” from respirable aerosol concentrations with and without bacterial enrichment factor
• Estimate exposures via Monte Carlo simulation and near field, far field air concentration model

Armstrong & Haas AIHCE 2007 17
Example of Predicted Exposure Dose DistributionExample of Predicted Exposure Dose Distribution from Monte Carlo Simulationfrom Monte Carlo Simulation
Far field, > 15 meter distance, partial enrichment of the aerosol compared to assumed bulk water concentration of Legionella
10th % AM 90th %

Armstrong & Haas AIHCE 2007 18
Hot Spring SpasHot Spring Spas

Armstrong & Haas AIHCE 2007 19
Japanese Natural Hot Spring Japanese Natural Hot Spring Spas Exposure AssessmentSpas Exposure Assessment
• Several reasonably documented reports exist for outbreaks from these natural hot spring spas
• Generally no air injection as in whirlpool spas• Data from a swimming pool investigation and the ratio
of water to air endotoxin levels were used to estimate the microbial water to air partitioning coefficient and then an aerosol concentration from the reported water concentrations of Legionella
• More direct scenario and fewer assumptions needed to estimate exposures than were used for the West Frisian whirlpool estimates

Armstrong & Haas AIHCE 2007 20
Japanese Natural Hot Spring Spas Japanese Natural Hot Spring Spas (continued)(continued)
• Exposure time (typically 15 minutes) from an estimate given in personal communication from an industrial hygiene colleague in Japan
• Only clinical infection and mortality rates were reported
• Estimated sub-clinical infection rates from Nagelkerke (West Frisian Floral Show outbreak) ratio of clinical to sub-clinical rates
Armstrong & Haas AIHCE 2007 21
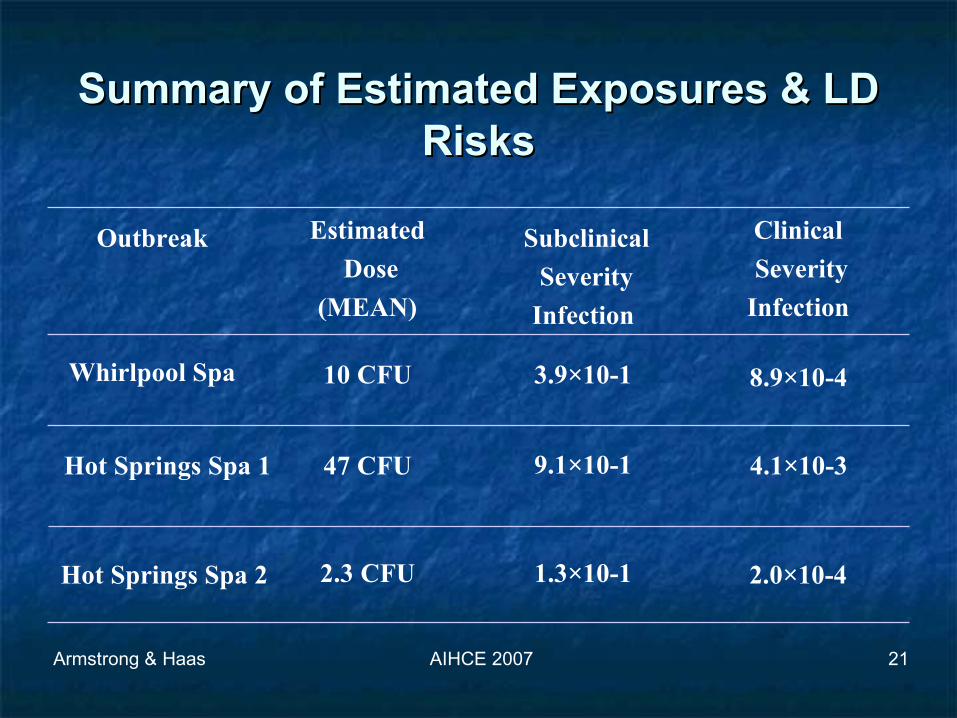
Summary of Estimated Exposures & LD Summary of Estimated Exposures & LD RisksRisks
2.0×10⁻⁴ 1.3×10⁻¹ 2.3 CFU Hot Springs Spa 2
4.1×10⁻³ 9.1×10⁻¹ 47 CFU Hot Springs Spa 1
8.9×10⁻⁴ 3.9×10⁻¹ 10 CFU Whirlpool Spa
Clinical Severity
Infection
SubclinicalSeverity
Infection
Estimated Dose
(MEAN)
Outbreak

Summary of the Evaluation of the Calculated versus Summary of the Evaluation of the Calculated versus Reported Risks Reported Risks (Green check = overlap of confidence intervals)(Green check = overlap of confidence intervals)
“Reported” < 10 X lower (a)Shizuoka
Reported < 10 X lower“Reported” < 10
X lower (a)Miyazaki
(a)Reported < 10 X higherWest Frisian
>15 meter group
(a)Reported < 10 X higherWest Frisian
<15 meter group
MortalityClinical Severity Infection
Subclinical Severity Infection
LD Outbreak
(a) Estimated since mortality did not occur in the West Frisian worker groups and subclinical infection data were not reported for the hot springs spa outbreaks

Armstrong & Haas AIHCE 2007 23
Summary of Key Summary of Key AssumptionsAssumptions
Equivalent virulence of Legionella strains in the animal and human data
For the West Frisian outbreak Concentration of Legionella in whirlpool spa Ventilation rate and mixing height Constant emission rate of Legionella-containing aerosol
For the hot spring spa outbreaks All visitors were exposed Visitors had same exposure duration The endotoxin based partitioning coefficient from a swimming
pool holds for whole bacteria in a hot spring spa environment

Armstrong & Haas AIHCE 2007 24
DiscussionDiscussion Guinea pig mortality data predicts infection rates slightly
less than the reported human clinical infection rates and in general better matches the reported human mortality rates
For the outbreaks used, the reported rates of disease span several orders of magnitude. The estimated exposures and the calculated rates of disease
also span several orders of magnitude The QMRA model predictions generally held over that several
order of magnitude range The guinea pig data were almost all from exposure to L.
pneumophila SG1. The outbreaks used for model evaluation also involved Lp SG1. Thus the QMRA may not extrapolate to other Legionella species and strains

Armstrong & Haas AIHCE 2007 25
Some Research ImplicationsSome Research Implications• QMRA appears to work for an aerosol exposure
route pathogen• Comparative immunology is important in
appropriate animal model selection in QMRA• The focus on finding only high level sources in
Legionella outbreaks many be an incomplete strategy. Widely dispersed exposure sources with somewhat elevated Legionella content may need more consideration
• The Legionella QMRA results could be a basis for deriving risk-based limits on cooling towers, whirlpools, hot springs spas, and other potential Legionella exposure sources

Armstrong & Haas AIHCE 2007 26
A Few Research Opportunities -A Few Research Opportunities -• Develop stronger data for microbial water to air
partitioning• Whirlpool spas• Natural hot springs• Cooling towers
• Develop more information on in vitro alveolar macrophage comparative immunology to better guide animal model choices for intracellular pulmonary pathogens
• Evaluate in vitro alveolar macrophage studies’ capability to provide new data on low-dose pathogen exposure. For Legionella, does the initial virulence state or density affect
• Lag time/incubation period, • Survival fraction• Likelihood of eventual progression to a wide-spread infection
• Include consideration of human susceptibility factors in the QMRA framework

Armstrong & Haas AIHCE 2007 27
For Further InformationFor Further Information• Armstrong TW. 2005. A Quantitative Microbial Risk
Assessment Model for Human Inhalation Exposure to Legionella [Doctor of Philosophy Thesis]. Philadelphia:Drexel University. Available at: http://dspace.library.drexel.edu/handle/1860/615
• Armstrong TW, Haas CN. In Press 2007a. A Quantitative Microbial Risk Assessment Model for Legionnaires Disease: Assessment Of Human Exposures For Selected Spa Outbreaks. J Occup Environ Hyg
• Armstrong TW, Haas CN. In Press 2007b. Legionnaires' Disease: Evaluation of a Quantitative Microbial Risk Assessment Model. Journal of Water and Health.


![New emergency room requirement for hospitals · A480 Gas gangrene A481 Legionnaires' disease A482 Nonpneumonic Legionnaires' disease [Pontiac fever] A483 Toxic shock syndrome A484](https://img.dokumen.tips/doc/110x75/605b6810d3206e62f65dadbf/new-emergency-room-requirement-for-hospitals-a480-gas-gangrene-a481-legionnaires.jpg)