Embed Size (px)
Citation preview

Legends ValueInvestor Presentation
N O R T H C O A S T I N V E S T M E N TA D V I S O R Y T E A M
2 0 3 . 5 3 2 . 7 0 0 3I N F O @ N O R T H C O A S TA M . C O M
OVERVIEW
LEGENDS VALUE
INVESTMENT PROCESS
STOCK SELECTION
PERFORMANCE
APPENDIX
NORTHCOAST ASSET MANAGEMENT
2
MARKETS CHANGE AVOID BIG LOSSES NO ONE KNOWS THE FUTURE
“Even if you’re on the right track, you’ll get run over if you
just sit there.”
- Will Rogers
“The first rule is not to lose money. The second rule is not
to forget the first rule.”
- Warren Buffett
“Wall Street experts have perfected the art of being wrong with confidence.”
- Bennett Goodspeed
EXPERIENCE STABILITY PERFORMANCE
Founded in 1988$1.7 billion in AUM(as of 9/30/2017)
Proprietary, quantitative, and tactical investment strategiesLegacy of preserving capital
during the bear markets of 2000-2002 and 2008
Long-term portfolio performanceExclusive Agreement with
Investor’s Business Daily®
ETF Partnership with BlackRock® iShares®
T H E N O RT HC OA ST A DVA NTAG E
C O R E I N V ES T ME NT B E L I E FS

BENJAMIN GRAHAM
• Widely considered the “father of value investing”
• Author of Security Analysis and The Intelligent Investor
JOEL GREENBLATT
• Founder and Director of Gotham Capital
• Author of The Little Book That Beats the Market
JOHN NEFF
• Manager of Vanguard’s Windsor Fund (1964 – 1995)
• Average annual return exceeded S&P 500 by 3%
A quantitative, rules-based stock strategy derived from the investment philosophies of three of the top value money managers in history - Benjamin Graham, Joel Greenblatt, and John Neff.
• Stable business model
• Below market P/E
• Above average Earning Yield
• Above average Return on Capital
• Low P/E mutiples
• Strong Dividend, Earnings, & Sales
Objective Description Equity Exposure
Investment Universe
Portfolio Holdings
Portfolio Review
Portfolio Research
Long-Term Capital Appreciation All-Cap Value 100% 3,000+ stocks 30 stocks Daily Quantitative
Neither Mr. Neff, Mr. Graham (deceased, 1976), nor Mr. Greenblatt are associated with NorthCoast Asset Management, and as such do not endorse NorthCoast’s investment advice or choose stocks that NorthCoast recommends. NorthCoast researches top performing managers using all publicly available information, and after vetting years of data, builds portfolios based on those findings and our belief that superior performance will continue in the future.
OVERVIEW
LEGENDS VALUE
INVESTMENT PROCESS
STOCK SELECTION
PERFORMANCE
APPENDIX
3
LEGENDS VALUE INVESTMENT PROGRAM
4
INVESTMENT PROCESS
OVERVIEW
LEGENDS VALUE
INVESTMENT PROCESS
STOCK SELECTION
PERFORMANCE
APPENDIX
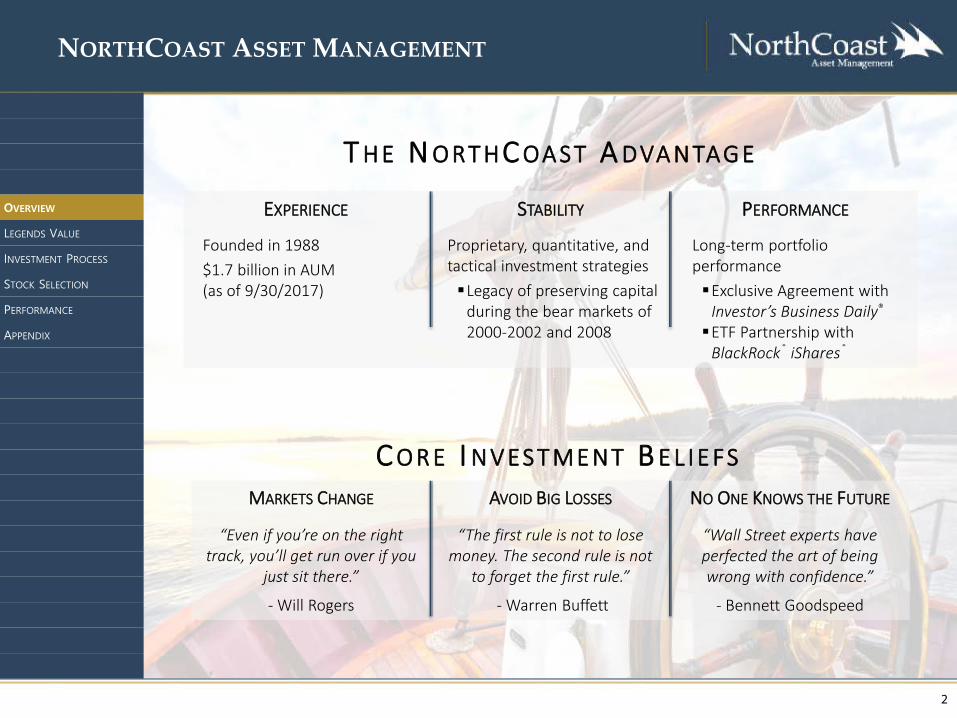
Construct Portfolio Select Stocks Manage Risk
Stocks ranked based on the most attractive quantitative attributes and top
rated stocks are selected
Ben Graham
Joel Greenblatt
John Neff
Combining the strategies of three of the top-performing value investors of
all-time
CoreLong-Only Strategy (No Cash Scaling)
DifferentLow cross-correlation among 3 styles
Time-TestedResearch shows that stocks exhibit common characteristics before gainsOngoing research assessment of portfolio construction ensures accuracy and relevance
Utilizing a comprehensive and collaborating set of risk controls to
effectively minimize risk
New Account Special HandlingDiversification
Daily MonitoringProfit-Takes
Position SizingSector Allocation
Sustainable Research
① ② ③
NorthCoast seeks long-term growth through a stock scoring methodology designed to identify and invest in deep-value stocks expected to outperform in the near future
Positive EPS GrowthPositive Revision EPSBuy Low P/E vs. Market P/E
Primary emphasis on Earnings Yield and Return on Capital
Increasing EPS and Sales GrowthAttractive growth-adjusted P/E Ratio
-15%
-10%
-5%
0%
5%
10%
15%
Q1 (Top 20%) Q2 Q3 Q4 Q5 (Bottom 20%)
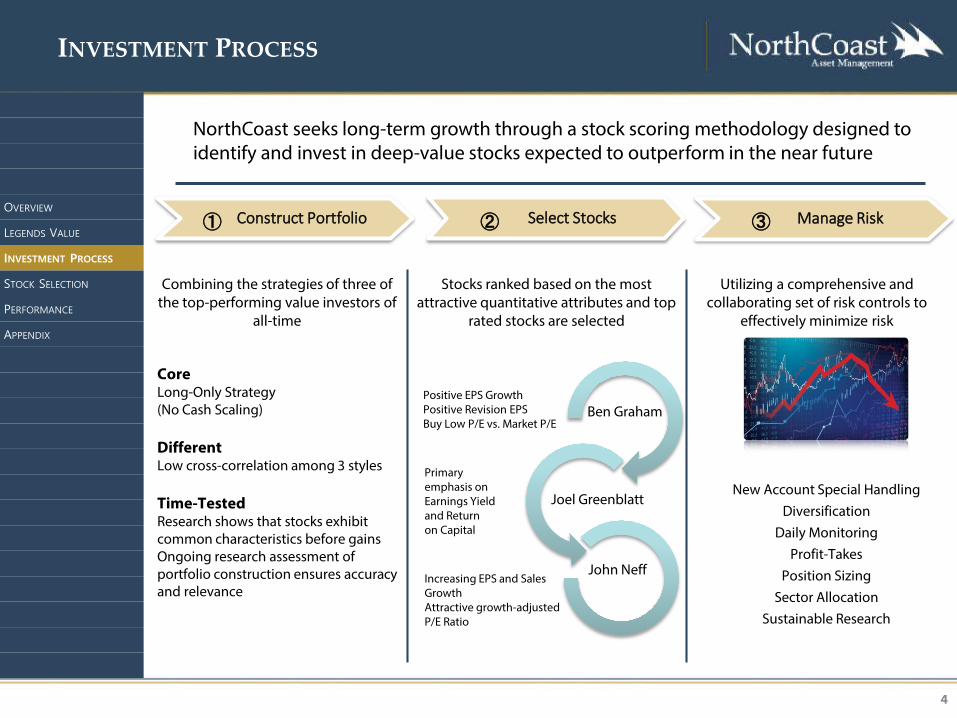
Greenblatt Neff Graham Legends Value
Legends Value stock picking is consistent across time periods
Stocks in the top quintiles of score research have performed better over time. Legends Value selects stocks in the Top 2 Quintiles
Graham
Neff
Legends Value
Greenblatt
Correlation Matrix
46.3%
28.5%
57.7%
Separate program models are differentiated and complement each other
%’s show correlation between each program.
-50%
-30%
-10%
10%
30%
50%
2003 2004 2005 2006 2007 2008 2009 2010 2011 2012 2013 Average
Top 20% Universe Bottom 20%
Score-based model is a proprietary selection system of NorthCoast Asset Management. Data compiled from 1/1/2003 – 12/31/2013 are the results of a hypothetical back-test by monthly re-balancing into of the top-scoring stocks determined by NorthCoast. The above results do not reflect actual performance. 5
WHY STOCK SELECTION MATTERS
OVERVIEW
LEGENDS VALUE
INVESTMENT PROCESS
STOCK SELECTION
PERFORMANCE
APPENDIX

6
PERFORMANCE & CHARACTERISTICS: 9/30/2017
OVERVIEW
LEGENDS VALUE
INVESTMENT PROCESS
STOCK SELECTION
PERFORMANCE
APPENDIX
Past Performance is not indicative of future results. All investments involve risk, including loss of principal. Results are presented net-of-fees. Please reference theAppendix for additional disclosure information.
APPENDIX
7
OVERVIEW
LEGENDS VALUE
INVESTMENT PROCESS
STOCK SELECTION
PERFORMANCE
APPENDIX

8
DIFFERENT, TO MAKE A DIFFERENCE
OVERVIEW
LEGENDS VALUE
INVESTMENT PROCESS
STOCK SELECTION
PERFORMANCE
APPENDIX
On average, the biggest 50 companies (5% of the top 1000) make up 50% of market weight. Therefore, screening through the entire universe of stocks provides the ability to differentiate the portfolio to outperform common
benchmarks
Top 50 Top 1000 ex 50
Annualized Return 3.0% 8.7%
Maximum Drawdown -50.9% -56.0%
Volatility 19.3% 20.2%
*With similar drawdown and volatility, the Top 1000 ex 50 companies have over doubled the performance of the Top 50 companies.
Source: Compustat, data from 12/31/1999 -12/31/2016. Criteria determined by market capitalization. Certain information may have been provided by third party sources and, although believed to be reliable, has not been independently verified and its accuracy or completeness cannot be guaranteed.
-60%
-40%
-20%
0%
20%
40%
60%
2000 2001 2002 2003 2004 2005 2006 2007 2008 2009 2010 2011 2012 2013 2014 2015 2016
Top 50 Top 1000 ex 50
500
1000
1500
2000
2500
3000
3500
4000
4500
1999 2000 2001 2002 2003 2004 2005 2006 2007 2008 2009 2010 2011 2012 2013 2014 2015 2016
Top 50 Top 1000 ex50
9
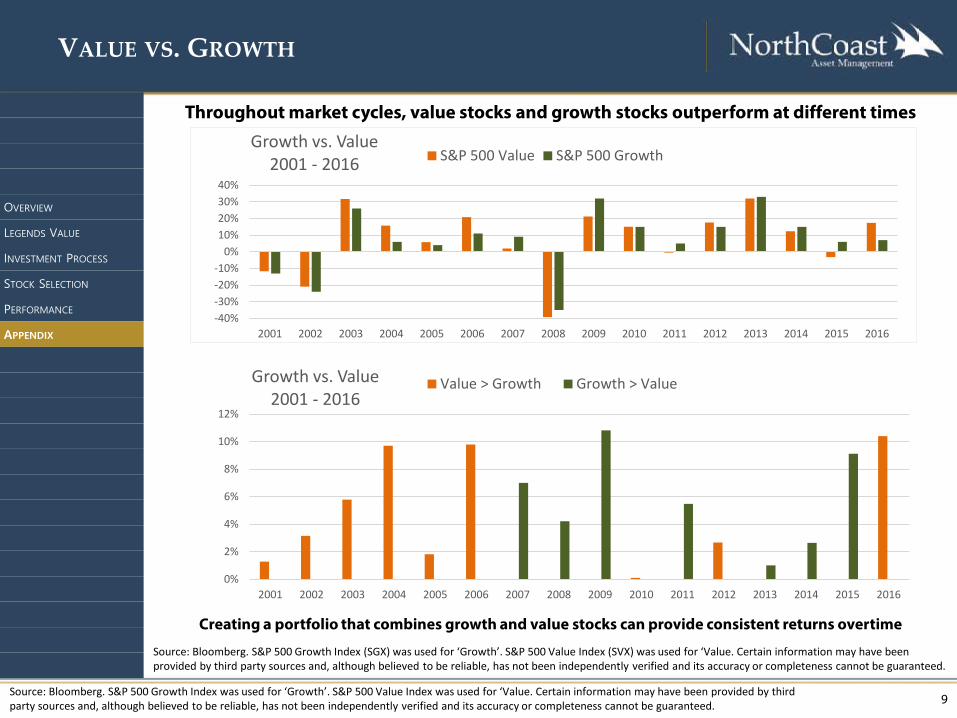
Source: Bloomberg. S&P 500 Growth Index (SGX) was used for ‘Growth’. S&P 500 Value Index (SVX) was used for ‘Value. Certain information may have been provided by third party sources and, although believed to be reliable, has not been independently verified and its accuracy or completeness cannot be guaranteed.
Throughout market cycles, value stocks and growth stocks outperform at different times
Creating a portfolio that combines growth and value stocks can provide consistent returns overtime
VALUE VS. GROWTH
OVERVIEW
LEGENDS VALUE
INVESTMENT PROCESS
STOCK SELECTION
PERFORMANCE
APPENDIX
Source: Bloomberg. S&P 500 Growth Index was used for ‘Growth’. S&P 500 Value Index was used for ‘Value. Certain information may have been provided by third party sources and, although believed to be reliable, has not been independently verified and its accuracy or completeness cannot be guaranteed.
-40%-30%-20%-10%
0%10%20%30%40%
2001 2002 2003 2004 2005 2006 2007 2008 2009 2010 2011 2012 2013 2014 2015 2016
Growth vs. Value2001 - 2016 S&P 500 Value S&P 500 Growth
0%
2%
4%
6%
8%
10%
12%
2001 2002 2003 2004 2005 2006 2007 2008 2009 2010 2011 2012 2013 2014 2015 2016
Growth vs. Value2001 - 2016
Value > Growth Growth > Value
PORTFOLIO MANAGEMENT TEAM
10
OVERVIEW
LEGENDS VALUE
INVESTMENT PROCESS
STOCK SELECTION
PERFORMANCE
APPENDIX
KEY
MA
NA
GER
S
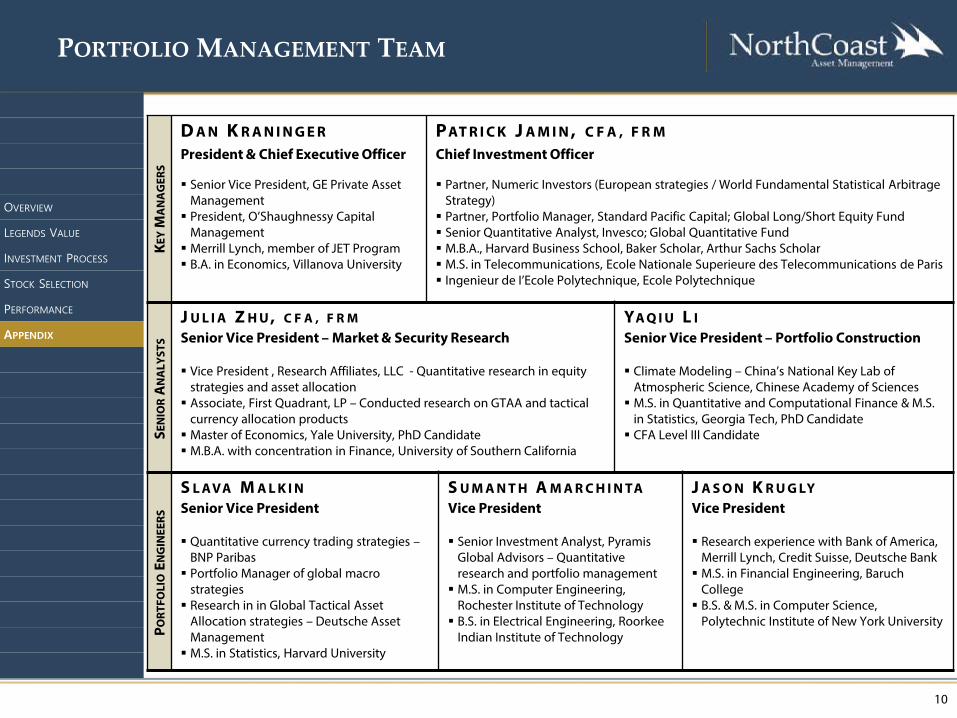
D A N K R A N I N G E R PAT R I C K J A M I N , C F A , F R MPresident & Chief Executive Officer Chief Investment Officer
Senior Vice President, GE Private Asset Management President, O’Shaughnessy Capital
Management Merrill Lynch, member of JET Program B.A. in Economics, Villanova University
Partner, Numeric Investors (European strategies / World Fundamental Statistical Arbitrage Strategy) Partner, Portfolio Manager, Standard Pacific Capital; Global Long/Short Equity Fund Senior Quantitative Analyst, Invesco; Global Quantitative Fund M.B.A., Harvard Business School, Baker Scholar, Arthur Sachs Scholar M.S. in Telecommunications, Ecole Nationale Superieure des Telecommunications de Paris Ingenieur de I’Ecole Polytechnique, Ecole Polytechnique
SEN
IOR
AN
ALY
STS
J U L I A Z H U , C F A , F R M YA Q I U L ISenior Vice President – Market & Security Research Senior Vice President – Portfolio Construction
Vice President , Research Affiliates, LLC - Quantitative research in equity strategies and asset allocation Associate, First Quadrant, LP – Conducted research on GTAA and tactical
currency allocation products Master of Economics, Yale University, PhD Candidate M.B.A. with concentration in Finance, University of Southern California
Climate Modeling – China’s National Key Lab of Atmospheric Science, Chinese Academy of Sciences M.S. in Quantitative and Computational Finance & M.S.
in Statistics, Georgia Tech, PhD Candidate CFA Level III Candidate
PORT
FOLI
OEN
GIN
EERS
S L AVA M A L K I N S U M A N T H A M A R C H I N TA J A S O N K R U G LYSenior Vice President Vice President Vice President
Quantitative currency trading strategies –BNP Paribas Portfolio Manager of global macro
strategies Research in in Global Tactical Asset
Allocation strategies – Deutsche Asset Management M.S. in Statistics, Harvard University
Senior Investment Analyst, PyramisGlobal Advisors – Quantitative research and portfolio management M.S. in Computer Engineering,
Rochester Institute of Technology B.S. in Electrical Engineering, Roorkee
Indian Institute of Technology
Research experience with Bank of America, Merrill Lynch, Credit Suisse, Deutsche Bank M.S. in Financial Engineering, Baruch
College B.S. & M.S. in Computer Science,
Polytechnic Institute of New York University
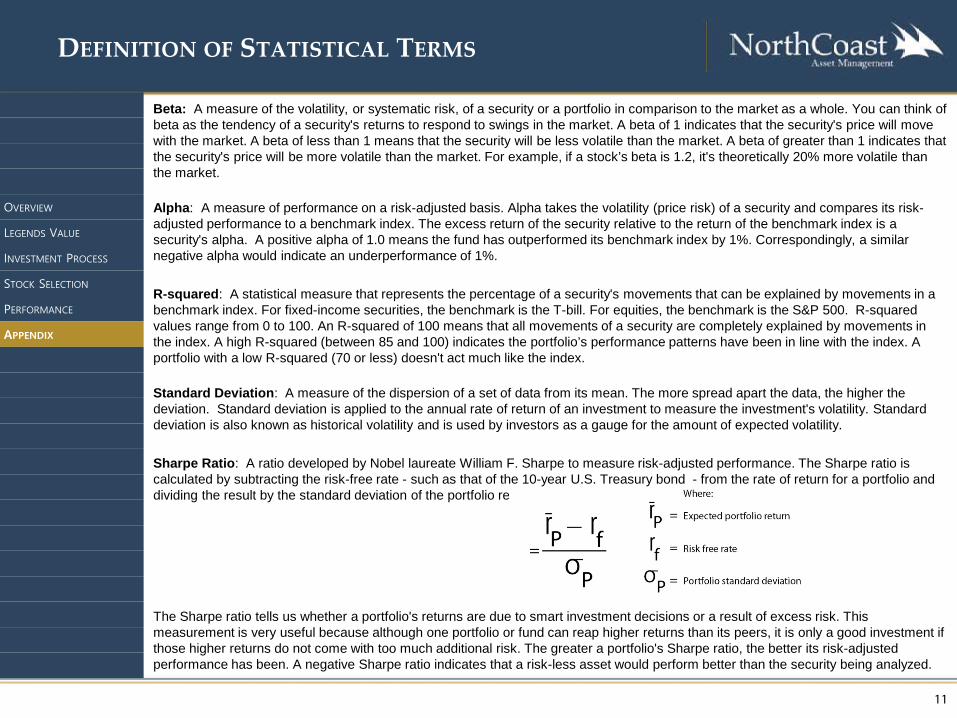
Beta: A measure of the volatility, or systematic risk, of a security or a portfolio in comparison to the market as a whole. You can think of beta as the tendency of a security's returns to respond to swings in the market. A beta of 1 indicates that the security's price will move with the market. A beta of less than 1 means that the security will be less volatile than the market. A beta of greater than 1 indicates that the security's price will be more volatile than the market. For example, if a stock’s beta is 1.2, it's theoretically 20% more volatile than the market.
Alpha: A measure of performance on a risk-adjusted basis. Alpha takes the volatility (price risk) of a security and compares its risk-adjusted performance to a benchmark index. The excess return of the security relative to the return of the benchmark index is a security's alpha. A positive alpha of 1.0 means the fund has outperformed its benchmark index by 1%. Correspondingly, a similarnegative alpha would indicate an underperformance of 1%.
R-squared: A statistical measure that represents the percentage of a security's movements that can be explained by movements in a benchmark index. For fixed-income securities, the benchmark is the T-bill. For equities, the benchmark is the S&P 500. R-squared values range from 0 to 100. An R-squared of 100 means that all movements of a security are completely explained by movements in the index. A high R-squared (between 85 and 100) indicates the portfolio’s performance patterns have been in line with the index. A portfolio with a low R-squared (70 or less) doesn't act much like the index.
Standard Deviation: A measure of the dispersion of a set of data from its mean. The more spread apart the data, the higher the deviation. Standard deviation is applied to the annual rate of return of an investment to measure the investment's volatility. Standard deviation is also known as historical volatility and is used by investors as a gauge for the amount of expected volatility.
Sharpe Ratio: A ratio developed by Nobel laureate William F. Sharpe to measure risk-adjusted performance. The Sharpe ratio is calculated by subtracting the risk-free rate - such as that of the 10-year U.S. Treasury bond - from the rate of return for a portfolio and dividing the result by the standard deviation of the portfolio returns. The Sharpe ratio formula is:
The Sharpe ratio tells us whether a portfolio's returns are due to smart investment decisions or a result of excess risk. This measurement is very useful because although one portfolio or fund can reap higher returns than its peers, it is only a good investment if those higher returns do not come with too much additional risk. The greater a portfolio's Sharpe ratio, the better its risk-adjusted performance has been. A negative Sharpe ratio indicates that a risk-less asset would perform better than the security being analyzed.
DEFINITION OF STATISTICAL TERMS
11
OVERVIEW
LEGENDS VALUE
INVESTMENT PROCESS
STOCK SELECTION
PERFORMANCE
APPENDIX
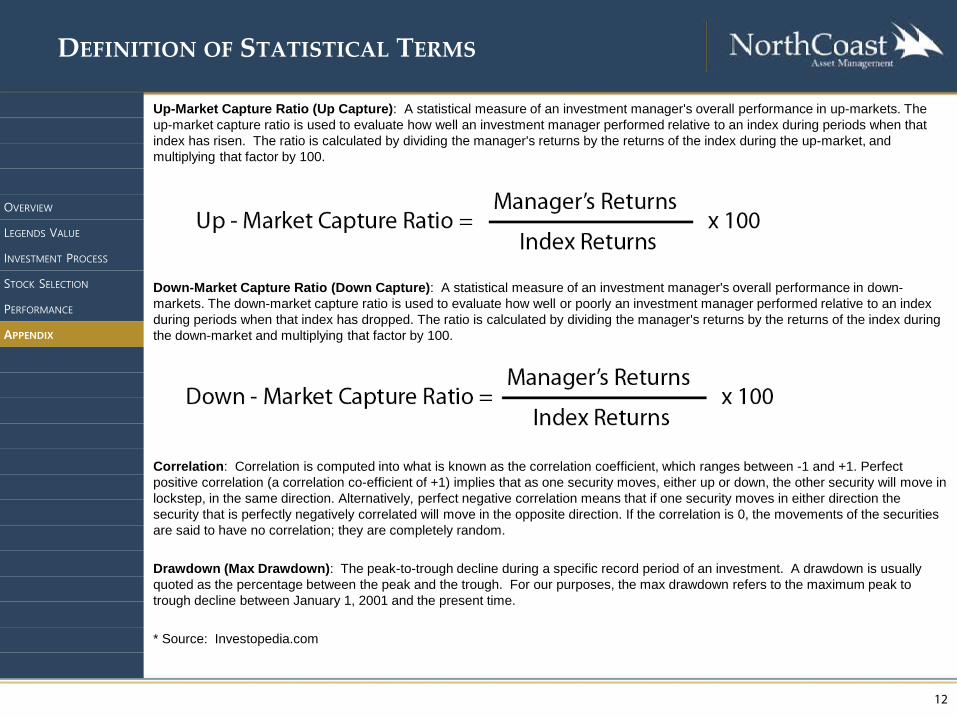
Up-Market Capture Ratio (Up Capture): A statistical measure of an investment manager's overall performance in up-markets. The up-market capture ratio is used to evaluate how well an investment manager performed relative to an index during periods when that index has risen. The ratio is calculated by dividing the manager's returns by the returns of the index during the up-market, and multiplying that factor by 100.
Down-Market Capture Ratio (Down Capture): A statistical measure of an investment manager's overall performance in down-markets. The down-market capture ratio is used to evaluate how well or poorly an investment manager performed relative to an index during periods when that index has dropped. The ratio is calculated by dividing the manager's returns by the returns of the index during the down-market and multiplying that factor by 100.
Correlation: Correlation is computed into what is known as the correlation coefficient, which ranges between -1 and +1. Perfect positive correlation (a correlation co-efficient of +1) implies that as one security moves, either up or down, the other security will move in lockstep, in the same direction. Alternatively, perfect negative correlation means that if one security moves in either direction the security that is perfectly negatively correlated will move in the opposite direction. If the correlation is 0, the movements of the securities are said to have no correlation; they are completely random.
Drawdown (Max Drawdown): The peak-to-trough decline during a specific record period of an investment. A drawdown is usually quoted as the percentage between the peak and the trough. For our purposes, the max drawdown refers to the maximum peak to trough decline between January 1, 2001 and the present time.
* Source: Investopedia.com
DEFINITION OF STATISTICAL TERMS
12
OVERVIEW
LEGENDS VALUE
INVESTMENT PROCESS
STOCK SELECTION
PERFORMANCE
APPENDIX
DISCLOSURE INFORMATION
13
Past Performance is not indicative of future results. All investments involve risk, including loss of principal. The firm is defined as NorthCoast Asset Management LLC. NCAM was established in 1988 and is an independent Registered Investment Advisor (RIA) registered with the Securities and Exchange Commission (SEC). The firm is a full service investment management company. The firm specializes in quantitative investment programs. NCAM is located in Greenwich, CT, and is not affiliated with any parent organization and has no other offices operating under the same brand name.
Performance results shown from January 1, 2009 through March 31, 2010, are the actual results of a single-account composite managed according to the dictates of the strategy. Since April 1, 2010, actual performance results are based on widely accepted performance standards and represent the net composite time-weighted return for the strategy. Returns are presented net-of-fees. Net-of-fee returns are reduced by trading costs and the portfolio’s actual management fee. Valuations are computed and performance is reported in U.S. dollars. A complete list of composite descriptions is available upon request. Policies for valuing portfolios, calculating performance, and preparing compliant presentations are available upon request. To obtain a compliant presentation for the associated strategy, please contact one of our advisors at 800.274.5448.
Single account composite performance results reflect the results of actual trading using a single client account managed in accordance with the dictates of the program. Other accounts are excluded to prevent additions, withdrawals and client mandated customizations from biasing the performance results. However actual client accounts are not insulated from these factors. Therefore actual client accounts may have experienced investment results during the corresponding time periods that were materially different from those portrayed in the model. Account statements for the single account for the period are available for inspection upon request.
This information contained herein has been prepared by NCAM on the basis of publicly available information, internally developed data and other third party sources believed to be reliable. This material is for informational and illustrative purposes only and should not be viewed as a recommendation or a solicitation to buy or sell any securities or investment products or to adopt any investment strategy.
Legends Value is a strategic long-term value strategy focused on capital appreciation. The strategy aims to maintain a full investment in equity securities. The program is derived from the investment philosophies of three of the top professional money managers in history, Benjamin Graham, John Neff, and Joel Greenblatt and coupled with a proprietary stock scoring system designed to build a comprehensive value portfolio.
Benchmarks - The S&P 500 Value Index measures value stocks using three factors: the ratios of book value, earnings, and sales to price. S&P Style Indices divide the complete market capitalization of each parent index into growth and value segments. Constituents are drawn from the S&P 500®.
OVERVIEW
LEGENDS VALUE
INVESTMENT PROCESS
STOCK SELECTION
PERFORMANCE
APPENDIX

DISCLOSURE INFORMATION
14
OVERVIEW
LEGENDS VALUE
INVESTMENT PROCESS
STOCK SELECTION
PERFORMANCE
APPENDIX
This information contained herein has been prepared by NorthCoast Asset Management, LLC ("NorthCoast") on the basis of publiclyavailable information, internally developed data and other third party sources believed to be reliable. NorthCoast has not sought toindependently verify information obtained from public and third party sources and makes no representations or warranties as toaccuracy, completeness or reliability of such information. All opinions and views constitute judgments as of the date of writingwithout regard to the date on which the reader may receive or access the information, and are subject to change at any timewithout notice and with no obligation to update. This material is for informational and illustrative purposes only and is intendedsolely for the information of those to whom it is distributed by NorthCoast. No part of this material may be reproduced orretransmitted in any manner without the prior written permission of NorthCoast. NorthCoast does not represent, warrant orguarantee that this information is suitable for any investment purpose and it should not be used as a basis for investment decisions.
PAST PERFORMANCE DOES NOT GUARANTEE OR INDICATE FUTURE RESULTS.
This material should not be viewed as a current or past recommendation or a solicitation of an offer to buy or sell any securities orinvestment products or to adopt any investment strategy. The reader should not assume that any investments in companies,securities, sectors, strategies and/or markets identified or described herein were or will be profitable and no representation is madethat any investor will or is likely to achieve results comparable to those shown or will make any profit or will be able to avoidincurring substantial losses. Performance differences for certain investors may occur due to various factors, including timing ofinvestment. Investment return will fluctuate and may be volatile, especially over short time horizons.
INVESTING ENTAILS RISKS, INCLUDING POSSIBLE LOSS OF SOME OR ALL OF THE INVESTOR'S PRINCIPAL.
The investment views and market opinions/analyses expressed herein may not reflect those of NorthCoast as a whole and different views may be expressed based on different investment styles, objectives, views or philosophies. To the extent that these materials contain statements about the future, such statements are forward looking and subject to a number of risks and uncertainties.