Embed Size (px)
Citation preview

DRAFT
Teanaway RiverPreliminary ChannelMigration Zone Map 1Kittitas County Inventory
and Characterization
Teanaway River
0 0.25 0.5
Miles ¯
Data Sources: USFWS (NWI), 2011; Kittitas County, 2011; Ecology, 2010; DNR, 2007; ESRI, 2010.
Date: 10/26/2012Copyright:© 2009 ESRIMainstem Yakima (not mapped yet)
Disconnected area north of Red Bridge Road
Red Bridge
SR 970
Potential Disconnected Area north of 970; river has the potential to enter this area upstream of the 970 bridge
Hillside mapped as Mass-Wasting Deposits; resulting in geotechnical hazard flag
LegendKittitas_CMZ_Prelim
Active Channel CorridorTier 1 CMZDisconnected Migration AreaAlluvial FanGeotechnical Hazard Flag
DRAFT
Analyzed by: S. WinterReviewed by:
DRAFT
Teanaway RiverPreliminary ChannelMigration Zone Map 1Kittitas County Inventory
and Characterization
Teanaway River
0 0.25 0.5
Miles ¯
Data Sources: Aerial: Kittitas County, 2011; 10m DEM hillshade: Ecology, 2010; RWSE LiDAR: Ecology 2012.
Date: 10/26/2012Copyright:© 2009 ESRIMainstem Yakima (not mapped yet)
Disconnected area north of Red Bridge Road
Red Bridge
SR 970
Potential Disconnected Area north of 970; river has the potential to enter this area upstream of the 970 bridge
Hillside mapped as Mass-Wasting Deposits; resulting in geotechincal hazard flag
LegendKittitas_CMZ_Prelim
Active Channel CorridorTier 1 CMZDisconnected Migration AreaAlluvial FanGeotechnical Hazard Flag
DRAFT
Relative Water Surface Elevations. These represent a way to visuallize floodplain surfaces in relation to the active channel. Tthe values represent a relative height (in feet) to the water surface at the time of LiDAR data collection.teanaway<VALUE>
25.1 - 2624.1 - 2523.1 - 2422.1 - 2321.1 - 2220.1 - 2119.1 - 20
18.1 - 1917.1 - 1816.1 - 1715.1 - 1614.1 - 1513.1 - 1412.1 - 1311.1 - 1210.1 - 11
9.01 - 108.01 - 97.01 - 86.01 - 75.01 - 64.01 - 53.01 - 42.01 - 31.01 - 2
0.001 - 1-0.99 - 0-1.99 - -1-2.99 - -2-3.99 - -3-4.99 - -4-5.73 - -5
Analyzed by: S. Winter (Tier 1)Reviewed by:

DRAFT
Teanaway RiverPreliminary ChannelMigration Zone Map 2Kittitas County Inventory
and Characterization
Teanaway River
0 0.25 0.5
Miles ¯
Data Sources:Aerial: Kittitas County, 2011; 10m DEM and RWSE LiDAR surface: Ecology, 2012.
Date: 10/26/2012Copyright:© 2009 ESRIQuail Road
Teanaway Road
Small disconnected areas on hillside above road
Channel actively eroding parts of bluff
LegendKittitas_CMZ_Prelim
Active Channel CorridorTier 1 CMZDisconnected Migration AreaAlluvial FanGeotechnical Hazard Flag
DRAFT
Analyzed by: S. WinterReviewed by:

DRAFT
Teanaway RiverPreliminary ChannelMigration Zone Map 2Kittitas County Inventory
and Characterization
Teanaway River
0 0.25 0.5
Miles ¯
Data Sources: Aerial: Kittitas County, 2011; 10m DEM hillshade: Ecology, 2010; RWSE LiDAR: Ecology 2012.
Date: 10/26/2012Copyright:© 2009 ESRI
LegendKittitas_CMZ_Prelim
Active Channel CorridorTier 1 CMZDisconnected Migration AreaAlluvial FanGeotechnical Hazard Flag
DRAFT
Relative Water Surface Elevations. These represent a way to visuallize floodplain surfaces in relation to the active channel. Tthe values represent a relative height (in feet) to the water surface at the time of LiDAR data collection.teanaway<VALUE>
25.1 - 2624.1 - 2523.1 - 2422.1 - 2321.1 - 2220.1 - 2119.1 - 20
18.1 - 1917.1 - 1816.1 - 1715.1 - 1614.1 - 1513.1 - 1412.1 - 1311.1 - 1210.1 - 11
9.01 - 108.01 - 97.01 - 86.01 - 75.01 - 64.01 - 53.01 - 42.01 - 31.01 - 2
0.001 - 1-0.99 - 0-1.99 - -1-2.99 - -2-3.99 - -3-4.99 - -4-5.73 - -5
Analyzed by: S. WInter (Tier 1)Reviewed by:

DRAFT
Teanaway RiverPreliminary ChannelMigration Zone Map 3Kittitas County Inventory
and Characterization
Teanaway River
0 0.25 0.5
Miles ¯
Data Sources: USFWS (NWI), 2011; Kittitas County, 2011; Ecology, 2010; DNR, 2007; ESRI, 2010.
Date: 10/26/2012Copyright:© 2009 ESRI
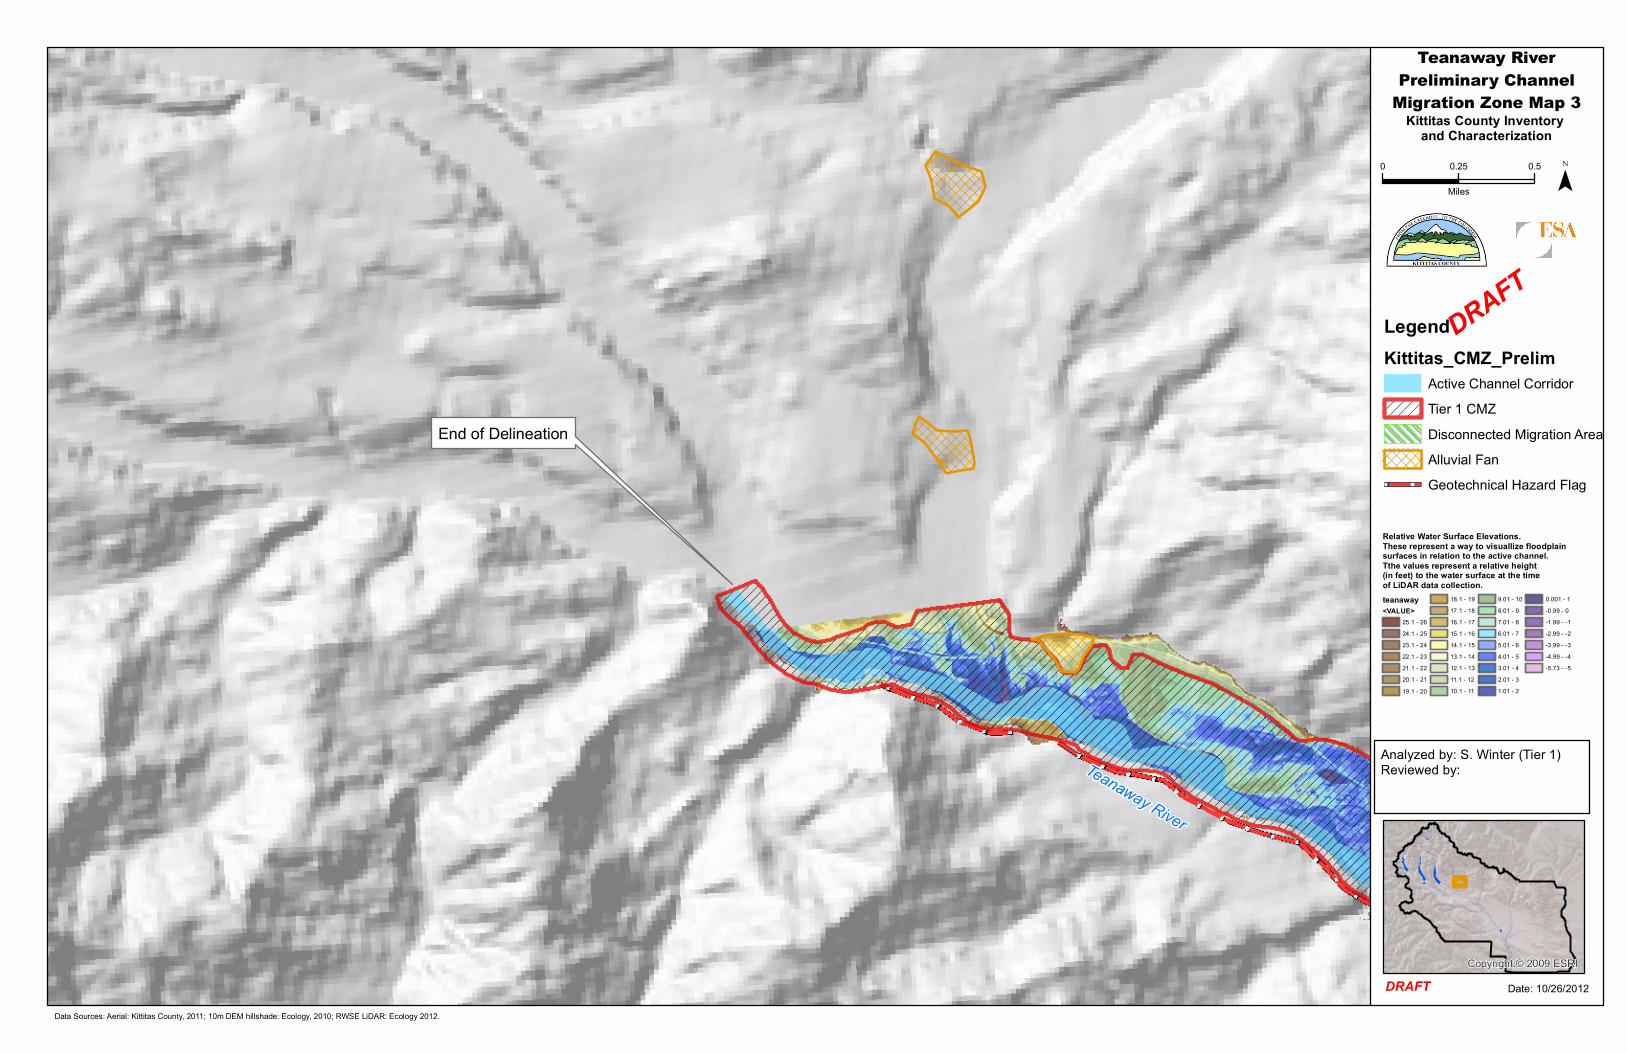
Upstream end of Tier 1 Mapping; Downstream end of Tier 2 Mapping
Avulsion hazard to swale results in wide CMZ hereEnd of Delineation
LegendKittitas_CMZ_Prelim
Active Channel CorridorTier 1 CMZDisconnected Migration AreaTier 2 CMZAlluvial FanGeotechnical Hazard Flag
DRAFTNF Teanaway River
Disconnected area above sole-source county road
Analyzed by: S. Winter (Tier 1)A. Merrill (Tier 2)Reviewed by:
DRAFT
Teanaway RiverPreliminary ChannelMigration Zone Map 3Kittitas County Inventory
and Characterization
Teanaway River
0 0.25 0.5
Miles ¯
Data Sources: Aerial: Kittitas County, 2011; 10m DEM hillshade: Ecology, 2010; RWSE LiDAR: Ecology 2012.
Date: 10/26/2012Copyright:© 2009 ESRI
LegendKittitas_CMZ_Prelim
Active Channel CorridorTier 1 CMZDisconnected Migration AreaAlluvial FanGeotechnical Hazard Flag
DRAFT
Relative Water Surface Elevations. These represent a way to visuallize floodplain surfaces in relation to the active channel. Tthe values represent a relative height (in feet) to the water surface at the time of LiDAR data collection.teanaway<VALUE>
25.1 - 2624.1 - 2523.1 - 2422.1 - 2321.1 - 2220.1 - 2119.1 - 20
18.1 - 1917.1 - 1816.1 - 1715.1 - 1614.1 - 1513.1 - 1412.1 - 1311.1 - 1210.1 - 11
9.01 - 108.01 - 97.01 - 86.01 - 75.01 - 64.01 - 53.01 - 42.01 - 31.01 - 2
0.001 - 1-0.99 - 0-1.99 - -1-2.99 - -2-3.99 - -3-4.99 - -4-5.73 - -5
End of Delineation
Analyzed by: S. Winter (Tier 1)Reviewed by:

DRAFT
Teanaway RiverPreliminary ChannelMigration Zone Map 4Kittitas County Inventory
and Characterization0 0.25 0.5
Miles ¯
Data Sources: USFWS (NWI), 2011; Kittitas County, 2011; Ecology, 2010; DNR, 2007; ESRI, 2010.
Date: 10/26/2012Copyright:© 2009 ESRI
Geology mapped as Mass Wasting and Glacial Outwash, combined withsteep slopes Legend
Kittitas_CMZ_PrelimActive Channel CorridorTier 1 CMZDisconnected Migration AreaTier 2 CMZAlluvial FanGeotechnical Hazard Flag
DRAFT
NF Te
anaw
ay Ri
ver
Analyzed by: A. Merrill (Tier 2)Reviewed by:
DRAFT
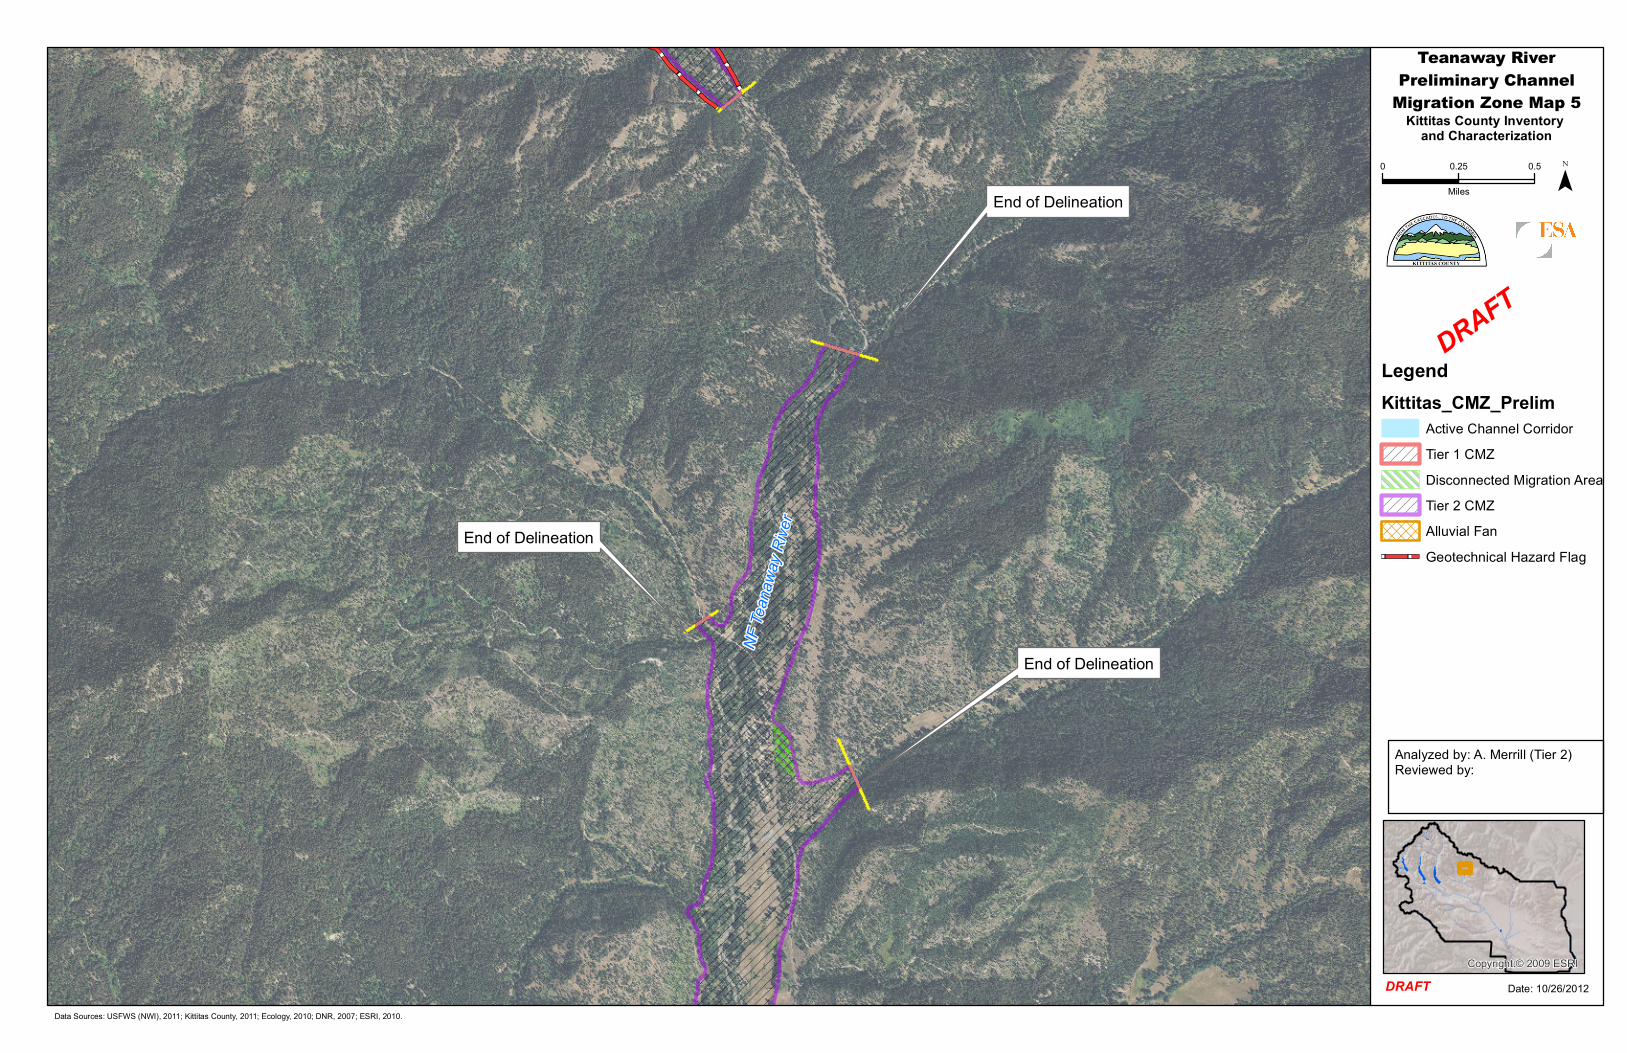
Teanaway RiverPreliminary ChannelMigration Zone Map 5Kittitas County Inventory
and Characterization0 0.25 0.5
Miles ¯
Data Sources: USFWS (NWI), 2011; Kittitas County, 2011; Ecology, 2010; DNR, 2007; ESRI, 2010.
Date: 10/26/2012Copyright:© 2009 ESRI
End of Delineation
LegendKittitas_CMZ_Prelim
Active Channel CorridorTier 1 CMZDisconnected Migration AreaTier 2 CMZAlluvial FanGeotechnical Hazard Flag
DRAFT
NF Te
anaw
ay R
iver
End of Delineation
Analyzed by: A. Merrill (Tier 2)Reviewed by:
End of Delineation
DRAFT
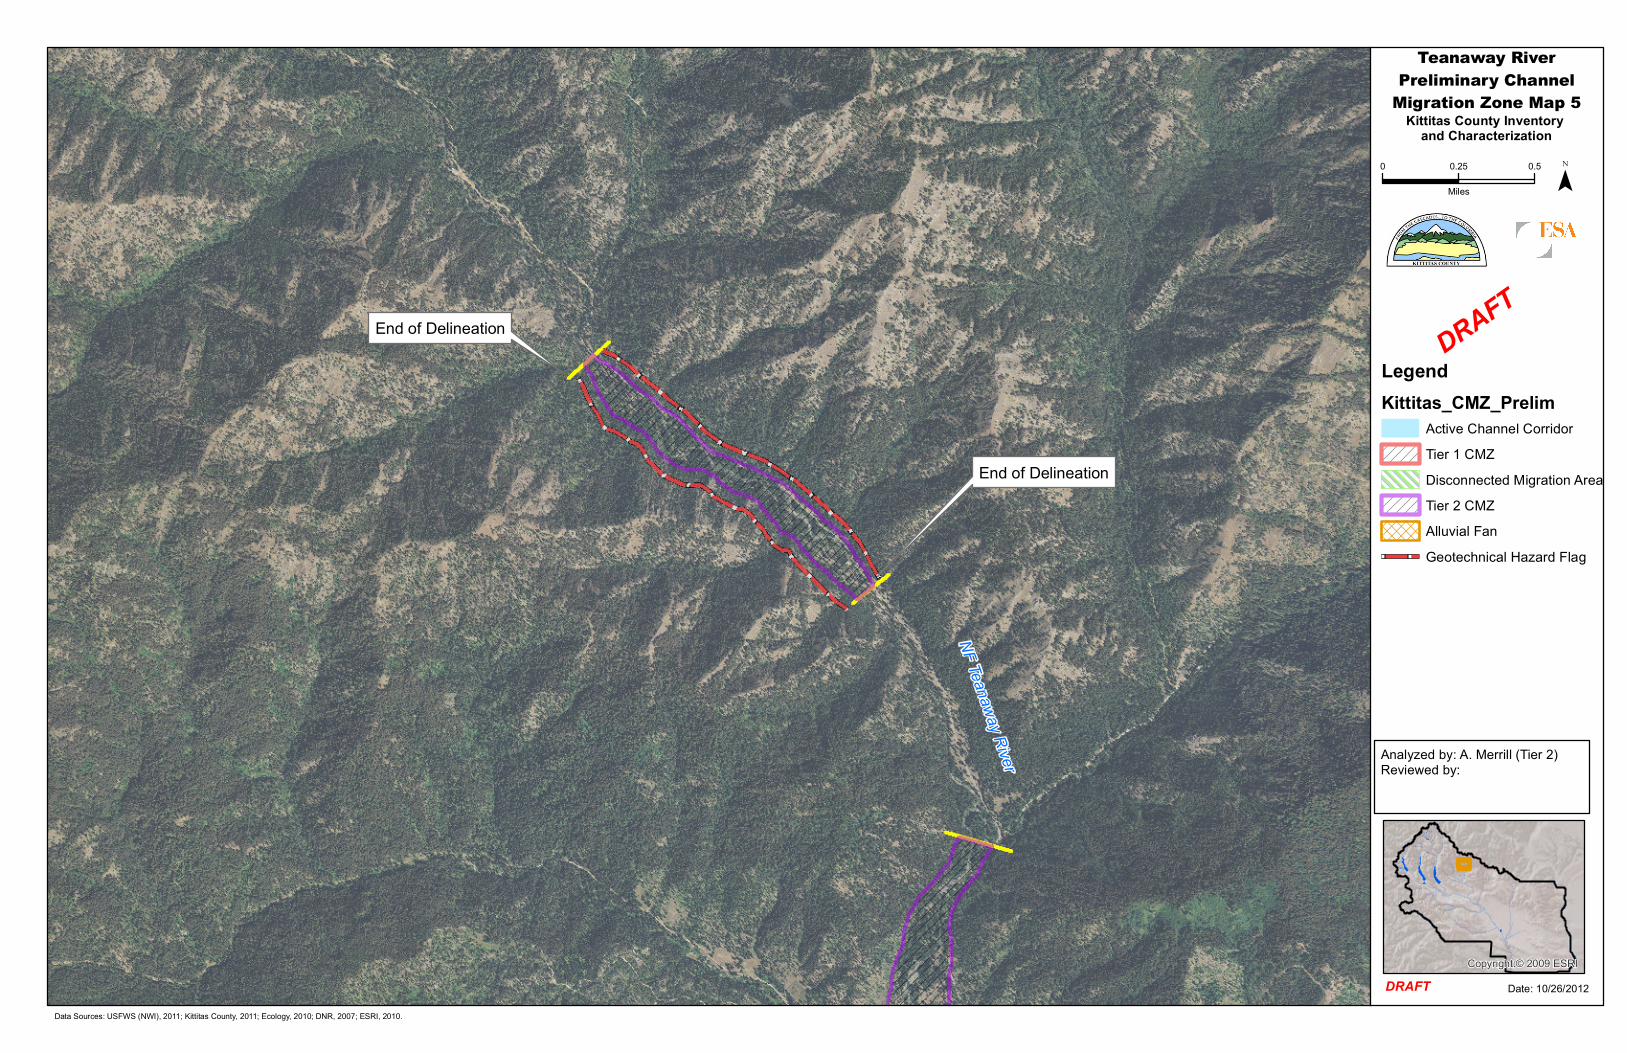
Teanaway RiverPreliminary ChannelMigration Zone Map 5Kittitas County Inventory
and Characterization0 0.25 0.5
Miles ¯
Data Sources: USFWS (NWI), 2011; Kittitas County, 2011; Ecology, 2010; DNR, 2007; ESRI, 2010.
Date: 10/26/2012Copyright:© 2009 ESRI
End of Delineation
LegendKittitas_CMZ_Prelim
Active Channel CorridorTier 1 CMZDisconnected Migration AreaTier 2 CMZAlluvial FanGeotechnical Hazard Flag
DRAFT
NF Teanaway River
End of Delineation
Analyzed by: A. Merrill (Tier 2)Reviewed by:

Teanaway River CMZ delineation elements
10/26/12
DRAFT
TIER 1
Element Source/development Notes
Subunits
Identified along the active channel based
on geomorphic channel characteristics
such as sinuosity, channel type, overall
valley confinement, and gradient.
Note: these are referenced as ‘reaches’
in the Draft CMZ guidance from
Ecology, but are termed subunits here to
avoid confusion with SMP reaches.
Five subunits were identified along the
Tier 1 section of the mainstem
Teanaway River, primarily based on
sinuosity, and presence/absence of
active gravel bars.
Active Channel Corridor
(ACC)
Digitized from 2011 aerial photo and
relative water surface elevations (RWSE)
Active channel included bars and
secondary channels judged to be
frequently activated. This included
secondary channels connected to the
mainstem with evidence of engagement
in recent high flow events.
Avulsion Hazard Areas
(AHA)
Included locations from 1950s aerials
showing main channel outside existing
active channel.
Taken from existing meander bend apex
downstream if there is a relict channel or
swale judged to be within the inundation
area shown by the RWSE
Extensive avulsion hazard areas were
identified on the alluvial valley, with
most extending outside the ACC plus an
EHA based on the meander amplitude.
Alluvial Fans Sketched over geologic and topographic
data sources.
Alluvial fans from tributaries were
identified adjacent to the CMZ as
channel change is often rapid in these
areas, and these areas have the potential
for significant sediment input to the
main channel.
Erosion Hazard Buffer
(EHA) – from the
Active Channel
250 to 400 foot buffer from Active
Channel, calculated by stream subunit.
Based on width measurements, the
active channel meander amplitude
typically ranged from 150 to 400 feet.
These calculations were performed by
geomorphic subunit, then used as an
initial buffer from the ACC.

TIER 1
Element Source/development Notes
Erosion Hazard Buffer –
Avulsion hazard areas
Variable buffer from Avulsion Hazard
Areas.
Incorporated on the outside (away from
Active Channel) edge of avulsion
hazard areas.
Tier 1 Channel Migration
Zone
Sketched along outside edge of the full
EHA (from both the active channel and
avulsion hazard zones) described above.
Typically, a 300 foot erosion hazard
buffer was applied to the river left bank,
and 150 feet were applied to the river
right bank to capture the greater
potential for migration into the alluvial
valley.
The 300 foot buffer was then inspected
against geomorphic features such as
relict channels and low areas on the
floodplain that present avulsion hazard
risks, and the
Disconnected Migration
Area (DMA)
Areas within the overall CMZ that are
separated from the existing main channel
by a linear feature that is likely to be
maintained in the future (e.g., sole-source
county roads and state highways)
DMAs were identified in the lower
subunits. The largest area was
delineated on the landward side of Red
Bridge Road. Smaller DMAs were
identified along Teanaway Road.
A potential DMA exists north of SR
970, but the channel appears to have the
potential to avulse into the floodplain in
the section between Red Bridge Road
and SR 970, which would engage this
area.
Geotechnical Hazard Flag Sketched in locations where the CMZ
intersects the valley wall.
Identified for locations with taller
terrace composed of landslide,
sedimentary rock, or glacial outwash
materials or where past erosion of the
valley margin is evident.
These areas would require more detailed
analysis to determine appropriate
management measures.
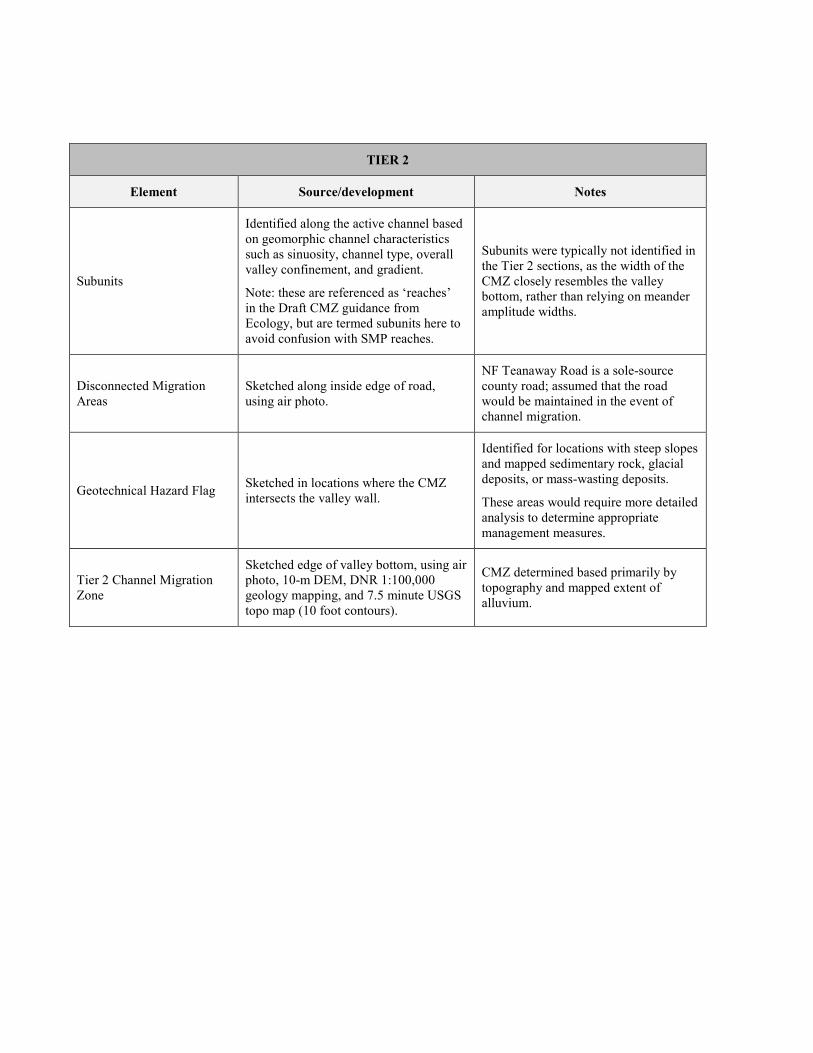
TIER 2
Element Source/development Notes
Subunits
Identified along the active channel based
on geomorphic channel characteristics
such as sinuosity, channel type, overall
valley confinement, and gradient.
Note: these are referenced as ‘reaches’
in the Draft CMZ guidance from
Ecology, but are termed subunits here to
avoid confusion with SMP reaches.
Subunits were typically not identified in
the Tier 2 sections, as the width of the
CMZ closely resembles the valley
bottom, rather than relying on meander
amplitude widths.
Disconnected Migration
Areas
Sketched along inside edge of road,
using air photo.
NF Teanaway Road is a sole-source
county road; assumed that the road
would be maintained in the event of
channel migration.
Geotechnical Hazard Flag Sketched in locations where the CMZ
intersects the valley wall.
Identified for locations with steep slopes
and mapped sedimentary rock, glacial
deposits, or mass-wasting deposits.
These areas would require more detailed
analysis to determine appropriate
management measures.
Tier 2 Channel Migration
Zone
Sketched edge of valley bottom, using air
photo, 10-m DEM, DNR 1:100,000
geology mapping, and 7.5 minute USGS
topo map (10 foot contours).
CMZ determined based primarily by
topography and mapped extent of
alluvium.