Embed Size (px)
Citation preview

mergermarket M&A Round-up for Q1-Q3 2012 8 October 2012 for immediate release
press releasePRESS CONTACTS
EMEA: Flora Wilke
fl [email protected]: +44 207 059 6348
Americas: Dara Silverstein
[email protected]: +1 646 3783118
Asia-Pacifi c: Jessica Chan
[email protected]: +852 21589706 www.mergermarket.com

Global M&A in Q1-Q3 2012 down 17.4% compared to same period last year • Q3 2012 total of US$ 461bn, down 16.1% from Q2 2012 • Q3 2012 resumed freefall from Q4 2010 after brief spike in Q2 • Energy, Mining & Utilities saw 26.1% of total global deal value this year
Clifford Chance tops global and Europe advisory league tables for Q1-Q3 2012 • Clifford Chance jumped 15 places from its Q1-Q3 2011 fi nish to claim top spot in the global legal adviser league table • Skadden Arps Slate Meagher & Flom moved up three places to fi nish top of the Americas legal adviser league table • Freshfi elds Bruckhaus Deringer Citigroup jumped six places to achieve top rank in Asia Pacifi c (excl. Japan)
mergermarket Heat Charts reveal TMT as the most popular “Companies for sale” sector globally • Industrials & Chemicals and the Consumer sector dominate both the CEE and Germanic region • TMT maintained top post in the US Heat Chart • Industrials & Chemicals led in the Asia-Pacifi c, mainly in Greater China
European M&A in the fi rst nine months of 2012 down 22.6% on Q1-Q3 2011 • Europe posted lowest quarter since Q3 2009 • Germanic region remained the most active in Europe with 27.5% market share • Construction saw 48.7% pickup in activity compared to Q1-Q3 2011
US takes brunt of slide with year-to-date total 18.6% lower than this time last year • Q3 2012 US M&A totalled US$ 206.7bn, up 4.8% on Q3 2011 • Q1-Q3 2012 down 18.6% from Q1-Q3 2011 • Industrials & Chemicals saw sharp decline of 51.9% from Q1-Q3 2011
Asia-Pacifi c fi rst nine months M&A down 13.2% on Q1-Q3 2011 • Third quarter total of US$ 89.5bn, up 16.6% on Q2 2012 • Indonesia Q1-Q3 2012 deals recorded biggest rise, up 185.3% on Q1-Q3 2011 • South Korea and Australia down 47% and 43.9% respectively in 2012 so far
Private Equity buyouts in Q1-Q3 2012 down 22.8% year to date • Value of buyouts for Q3 2012 down 27.8% on Q3 2011 • European buyouts at third lowest Q3 level on mergermarket record • US buyouts in Q3 up 18.9% compared to same period last year
Emerging Markets deals down by 22.9% since last year • BRICs witness lowest quarterly total since Q1 2009 • 33.2% drop in inbound investment from Europe in Q1-Q3 2012 • European bidders are most active investors
Energy, Mining & Utilities increased dominant market share in Q1-Q3 2012 • However activity fell by 7.6% on Q1-Q3 2011 • Inbound European deals boosted Construction and Transport in the region • Emerging Markets saw growth in Technology by 94.3%
CONTENTS:
2 mergermarket M&A Round-Up
3 Global M&A Overview
7 - Mid-Market 8 - Private Equity Buyouts9 - Private Equity Exits 10 - Emerging Markets 11 - Premia / Multiples Analysis12 - Consideration Structure
Insolvency13 - Deal Value Breakdown14 - Global League Table of Legal
Advisers16 - European M&A Overview
29 - US M&A Overview
39 - Asia-Pacifi c M&A Overview (ex. Japan)
49 - Africa & MIddle East M&A Overview
53 - Criteria/ About mergermarket
MEDIA CONTACTS:EMEA: Flora Wilke
+44 207 059 6348
Americas: Dara Silverstein
+1 646 378 3118
Asia-Pacifi c: Jessica Chan
+852 2158 9706
mergermarket M&A Round-up for Q1-Q3 2012
Press Release: mergermarket M&A Round-up for Q1-Q3 2012 2 www.mergermarket.com

• Q3 2012 global M&A at US$ 461bn, down 16.1% from Q2 2012 • Q1-Q3 2012 total of US$ 1,461.1bn, down 17.4% on the same period in 2011 • Drastic decline in Europe of 46.1% from the previous quarter • Asia-Pacifi c and US regions see quarter-on-quarter increase by 16.6% and
11.7% respectively
Global M&A in the fi rst three quarters of 2012 added up to US$ 1,461.1bn, down by 17.4% on the same period in 2011 (US$ 1,769bn), and representing the second lowest total since Q1-Q3 2009 (US$ 1,142bn). Q3 2012 totaled US$ 461bn, down 16.1% from Q2 2012 (US$ 549.7bn), resuming the freefall briefl y paused by a rally in Q2. The third quarter was also the second lowest Q3 since 2004 (US$ 343.4bn)
The fi nancial crisis is evident within the European M&A market as it has seen its slowest quarter in three years. Q3 2012 M&A in Europe totaled US$100.3bn, down 46.1% on Q2 2012 (US$ 186.3bn) and a 39.3% decrease on Q3 2011 (US$ 165.2bn). The fi rst nine months added up to US$ 457.5bn, a decrease of 22.6% compared to the same period last year, and the lowest since Q1-Q3 2010 (US$ 399.9bn).
The US, with US$ 512.1bn worth of M&A deals announced in Q1-Q3 2012 saw a decrease of 18.6% on the same period in 2011 (US$ 628.8bn), but registered a quarter-on-quarter in-crease of 11.7%, with Q3 2012 M&A coming in at US$ 206.7bn. The quarter was boosted by Kraft Food’s US$ 26.3bn spin-off of its North American business accounting for a sizeable chunk of this. This also ensured that US made up the largest share of global M&A of any region; it accounted for 35% of total deal value in the fi rst nine months of 2012.
The Asia-Pacifi c region has seen M&A deals in 2012 adding up to US$ 246.3bn, down 13.2% on Q1-Q3 2011. For Q3 2012, Asia-Pacifi c showed an increase in activity by 16.6% from the previous quarter (US$ 76.8bn).
Q3 2012 saw US$ 191.5bn-worth of cross-border deals, down 23.2% from the previous quarter (US$ 249.5bn) and 15% from the same period last year (US$ 225.3bn). Cross-border deals accounted for 41.5% of all global M&A (US$ 461bn) last quarter. Deals between re-gions added up to US$ 138.7bn in Q3 2012 and accounted for 30.1% of all global M&A. They were down 21.4% from Q2 2012 (US$ 176.4bn), and 10.7% from the same period last year.
Energy, Mining & Utilities saw a drop in deal value in Q1-Q3 2012 compared to the same period last year, but remained the most active sector in global M&A and increased its mar-ket share. The sector registered US$ 380.9bn-worth of deals, down 7.7% from the fi rst three quarters of 2011 (US$ 412.5bn), but market share increased from 23.3% to 26.1%.
Clifford Chance claimed the Q1-Q3 2012 global legal advisers mantle, by deal value, after climbing 15 places from its Q1-Q3 2011 fi nish. DLA Piper won the day by claiming top spot for the deal volume crown.
Global M&A Overview
0
100
200
300
400
500
600
700
800
900
1,000
1,100
1,200
1,300
1,400
1,500
Valu
e of
Dea
ls (U
S$bn
)
Global Cross Border M&A Analysis - Value
Global Cross Border (regions) Global M&A Global Cross Border (individual countries)
Press Release: mergermarket M&A Round-up for Q1-Q3 2012 3 www.mergermarket.com

©2012 Google - Map data © 2012 Google
Global M&A Heat ChartSector Americas Asia Europe Africa Middle
EastTotal
TMT 1,278 680 621 17 71 2,667
Industrials & Chemicals 473 1,031 705 22 20 2,251
Energy, Mining & Utilities 947 666 445 102 27 2,187
Consumer 572 575 637 22 16 1,822
Pharma, Medical & Biotech 682 310 308 3 29 1,332
Business Services 528 280 293 13 15 1,129
Financial Services 409 328 317 54 23 1,131
Leisure 246 204 232 6 13 701
Transportation 167 176 193 8 14 558
Construction 71 176 173 20 6 446
Defence 71 5 22 2 2 102
Real Estate 67 205 95 14 12 393
Agriculture 50 135 43 6 2 236
Government 16 2 9 27
Other 6 31 10 2 49
Total 5,583 4,804 4,103 291 250 15,031
Hot Warm Cold
1,000 300 50
650 200 20
500 100 0
Note: The Intelligence Heat Chart are based on “companies for sale” tracked by mergermarket in the respective regions between 12 March 2012 and 11 September 2012. Opportunities are captured according to the dominant geography and sector of the potential target company. mergermarket’s Heat Chart of predicted deal flow is based on the intelligence collected in our database relating to companies rumoured to be for sale, or officially up for sale in the respective regions. It is therefore indicative of areas that are likely to be active in the months to come. The intelligence comes from a range of sources, including press reports, company statements and our own team of journalists gathering proprietary intelligence from M&A across the regions. The data does not differentiate between small and large transactions, nor between deals that could happen in the short or long-term.
The derailment of the economic recovery has led to signifi cant declines in the M&A market. Two major factors are still affecting M&A right now: the wide bid-ask spread and the likelihood of completion. With all of the uncertainty on the macro level, corporates are taking a wait-and-see attitude. For the M&A fl oodgates to open some large corporate trans-action announcements will be required.
Expectations based on “Companies for sale” analysis are:
• North America to dominate, followed by Europe. • Americas to see TMT focus, possibly indicating a move towards an anticipated consolidation within the sector. • Industrials & Chemicals sector to maintain its top position in Asia and Europe. • Energy, Mining & Utilities sector to lead in the African region (whilst second in the Americas, third in Asia and fourth in Europe).
Press Release: mergermarket M&A Round-up for Q1-Q3 2012 4 www.mergermarket.com

Global M&A Overview: Industry and Geography Breakdown
North America 32.7%
Central & South America 5.0%
Western Europe 24.8%
Southern Europe 5.5%
Northern Europe 5.7%
Central & Eastern Europe 4.2%
North Asia 7.8%
Japan 3.2%
Australasia 3.8%
South & Central Asia 2.3%
South East Asia 2.8%
Africa & Middle East 2.5%
Mix of Announced Deals by Geographic Region Q1-Q3 2012 - Volume
North America 40.8%
Central & South America 5.6%
Western Europe 20.8%
Southern Europe 5.4%
Northern Europe 2.5%
Central & Eastern Europe 2.6%
North Asia 8.5%
Japan 3.5%
Australasia 2.6%
South & Central Asia 2.1%
South East Asia 3.6%
Africa & Middle East 2.0%
Mix of Announced Deals by Geographic Region Q1-Q3 2012 - Value
Q1-Q3 2012 Q1-Q3 2011 Change
Sector Value (US$bn) Market share Deal count Value (US$bn) Market share Deal count Value (%) Deal Count
Energy, Mining & Utilities 380.9 26.1% 863 412.5 23.3% 912 -7.6% -49
Consumer 196.6 13.5% 1,163 148.2 8.4% 1,308 32.6% -145
Industrials & Chemicals 187.1 12.8% 1,814 308.4 17.4% 1,954 -39.3% -140
Financial Services 148.6 10.2% 752 207.6 11.7% 878 -28.4% -126
Pharma, Medical & Biotech 108.3 7.4% 652 164.4 9.3% 785 -34.1% -133
Technology 97.8 6.7% 966 113.0 6.4% 1,063 -13.4% -97
Business Services 80.1 5.5% 1,025 83.0 4.7% 1,270 -3.6% -245
Telecommunications 59.1 4.0% 91 94.9 5.4% 118 -37.8% -27
Real Estate 51.3 3.5% 186 90.2 5.1% 169 -43.1% 17
Transport 42.2 2.89% 291 40.2 2.3% 318 5.1% -27
Media 33.7 2.3% 296 34.9 2.0% 306 -3.4% -10
Leisure 30.3 2.1% 319 34.6 2.0% 355 -12.3% -36
Construction 26.9 1.8% 314 25.4 1.4% 380 6.1% -66
Agriculture 10.9 0.7% 91 6.1 0.3% 114 78.3% -23
Defence 5.3 0.4% 29 5.9 0.3% 29 -10.2% 0
Total 1,459.1 8,852 1,769.3 9,959 -17.5% -1,107
Press Release: mergermarket M&A Round-up for Q1-Q3 2012 5 www.mergermarket.com

Global Top Deals for Q1-Q3 2012Top 10 Announced Deals for Q1-Q3 2012
Announced Date
Bidder Company Bidder Legal Adviser Target Company Target/Seller Legal Adviser Seller Company Deal Value (US$m)
07-Feb-12 Glencore International plc Clifford Chance (Advising Citigroup; Credit Suisse; Morgan Stanley); Linklaters
Xstrata Plc (65.92% Stake) Freshfields Bruckhaus Deringer; King & Wood Mallesons
50,563
14-Aug-12 Kraft Foods Inc (shareholders) Kraft Foods Group Inc Clifford Chance; Cravath Swaine & Moore
Mondelez International Inc 26,294
04-Apr-12 Conocophillips Company (shareholders)
Phillips 66 Bracewell & Giuliani ConocoPhillips Company 20,790
29-Jun-12 Anheuser-Busch InBev NV Alston & Bird (Advising Barclays); Clifford Chance; Freshfields Bruckhaus Deringer; Mijares, Angoitia, Cortes y Fuentes; Skadden Arps Slate Meagher & Flom; Sullivan & Cromwell
Grupo Modelo SAB de CV (49.7% Stake)
Cravath Swaine & Moore; Creel, Garcia-Cuellar, Aiza y Enriquez; Greenberg Traurig (Advising Morgan Stanley)
20,100
23-Jul-12 China National Offshore Oil Corporation Ltd
Cleary Gottlieb Steen & Hamilton (Advising Citigroup); Davis Polk & Wardwell; Herbert Smith; Morrison & Foerster; Stikeman Elliott
Nexen Inc Blake, Cassels & Graydon; Osler, Hoskin & Harcourt (Advising Goldman Sachs; RBC Capital Markets); Paul Weiss Rifkind Wharton & Garrison
17,654
04-Jul-12 Volkswagen AG Clifford Chance; Hogan Lovells; White & Case
Dr Ing hc F Porsche AG (50.1% Stake)
Freshfields Bruckhaus Deringer; Hengeler Mueller
Porsche Automobil Holding SE 14,238
22-Aug-12 China Telecom Corporation Limited
Freshfields Bruckhaus Deringer; Sullivan & Cromwell
China Telecommunication Corporation (certain CDMA Network assets)
China Telecommunications Corporation
13,307
21-May-12 Nuclear Damage Compensation Facilitation Corporation
Anderson Mori & Tomotsune (Advising Nomura Holdings); Mori Hamada & Matsumoto (Advising JPMorgan); Nishimura & Asahi
Tokyo Electric Power Co Inc (75.7% Stake)
Nagashima Ohno & Tsunematsu 12,600
21-May-12 Eaton Corporation A&L Goodbody; Davis Polk & Wardwell (Advising Citigroup; Morgan Stanley); Kinstellar; Matheson Ormsby Prentice; McCann FitzGerald (Advising Citigroup; Morgan Stanley); Simpson Thacher & Bartlett
Cooper Industries Plc Arthur Cox; Blake, Cassels & Graydon; Cleary Gottlieb Steen & Hamilton (Advising Goldman Sachs); Slaughter and May; Wachtell, Lipton, Rosen & Katz
11,940
23-Apr-12 Nestle SA A&L Goodbody; King & Wood Mallesons; Mayer Brown; White & Case
Pfizer Nutrition Baker & McKenzie; Clifford Chance; DLA Cliffe Dekker Hofmeyr; DLA Piper; Kirkland & Ellis (Advising Centerview Partners); Lee and Li Attorneys at Law; McCann FitzGerald; Skadden Arps Slate Meagher & Flom
Pfizer Inc 11,850
Press Release: mergermarket M&A Round-up for Q1-Q3 2012 6 www.mergermarket.com

Global M&A Overview: Mid-market M&A Activity • Global mid-market M&A in 2012 declined to US$ 558.2bn, the third lowest
level since 2005 • Energy, Mining & Utilities sector with top market share of 23.3%, a 11.9%
decrease on Q1-Q3 2011 • Latham & Watkins topped legal advisers ranking with US$ 38.9bn in deals
Global mid-market M&A transactions for the fi rst three quarters of 2012 added up to US$ 558.2bn, 11.9% less than Q1-Q3 2012 (US$ 633.8bn), making it the third lowest Q1-Q3 period since 2005 (US$ 536bn). The third quarter saw mid-market deals valuing US$ 175.5bn, down by 17.9% from the previous quarter (US$ 213.9bn). The proportion of total global M&A accounted for by the mid-market, however, was roughly level: 38.1% (of US$ 461bn) in Q3, slightly down from 38.9% (of US$ 549.7bn) in Q2.
Most major regions saw a signifi cant downturn in mid-market deals. The drop-off was most pronounced in Africa and the Middle East (38.6% decrease on Q1-Q3 2011), but Asia-Pacifi c (ex Japan) and Europe also experienced decreases of 29.3% and 24.8% respectively. The US was the only major economy seeing an increase – of 12.1% – on Q1-Q3 2011. The Energy, Mining & Utilities sector accounted for 23.3% of total mid-market activity so far this year, with deal values totalling US$ 130.3bn, down by 11.9% on the same period in 2011 (US$ 147.9bn).
The acquisition of Vivint Inc by Blackstone Group, a deal valued at US$ 2bn, was the largest mid-market M&A transaction announced in Q3, followed by the acquisition of Veolia ES Solid Waste by Highstar Capital for US$ 1.9bn.
Latham & Watkins was involved in more mid-sized deals than any other legal advisors and topped the mid-market legal adviser league table with US$ 38.9bn-worth of deals.
Energy, Mining & Utilities 23.3%
Industrials & Chemicals 12.7%
Consumer 12.0%
Financial Services 10.2%
Technology 8.2%
Pharma, Medical & Biotech 7.2%
Business Services 6.2%
Real Estate 5.0%
Leisure 3.6%
Transport 3.4%
Media 2.5%
Construction 1.8%
Telecom 3.0%
Agriculture 0.2%
Mid-Market M&A Industry Breakdown Q1-Q3 2012 - Value
0.0%
5.0%
10.0%
15.0%
20.0%
25.0%
30.0%
35.0%
40.0%
45.0%
50.0%
0
50
100
150
200
250
300
350
Valu
e of
Dea
ls (U
S$bn
)
Global Mid-Market M&A Activity - Quarterly
RoW M&A Asia-Pacific ex Jp Mid-Market M&A US Mid-Market M&A European Mid-Market M&A % of Global M&A
% o
f Glo
bal M
&A
Global mid-market Legal Adviser League Tables Q1-Q3 2012Ranking Q1-Q3 2012 Q1-Q3 2011
Q1-Q3 2012
Q1-Q3 2011 Company Name
Value (US$bn)
Deal Count
Value (US$bn)
% Val. Change
1 3 Latham & Watkins 38.9 55 44.3 -12.2%2 9 Sullivan & Cromwell 36.2 40 32.7 10.8%3 2 Skadden Arps Slate Meagher &
Flom36.1 50 46.3 -22.1%
4 6 Simpson Thacher & Bartlett 35.2 44 37.6 -6.3%5 5 Freshfields Bruckhaus Deringer 35.1 47 41.7 -15.8%6 1 Linklaters 33.3 50 49.0 -32.1%7 4 Clifford Chance 33.0 50 43.6 -24.3%8 10 Kirkland & Ellis 30.8 44 32.4 -5.2%9 12 Cleary Gottlieb Steen & Hamilton 30.7 36 31.1 -1.5%10 7 Allen & Overy 29.0 40 37.2 -22.0%
Press Release: mergermarket M&A Round-up for Q1-Q3 2012 7 www.mergermarket.com

• Global buyouts for Q3 2012 down 27.8% on Q3 2011 and down 22.8% year-to-date
• Europe suffered third lowest Q3 on mergermarket record but US Q3 was up 18.9% on 2011
• Latham & Watkins was leading advisor with US$ 25.3bn in deal value
Global buyouts in Q1-Q3 2012 totalled US$ 176.1bn, down 22.8% compared to the same period in 2011 (US$ 228.0bn). Activity in Europe fell to US$ 62.5bn, a 29.5% drop from the US$ 88.6bn announced in 2011. Asia-Pacifi c (excluding Japan) fared worse with a 41.2% decline to US$ 18.1bn year-to-date.
12.7% of total global M&A in Q3 this year was attributable to private equity buyouts, standing at US$ 58.6bn. This was the lowest value for global Q3 buyouts since 2009 (US$ 24.4bn). Eurozone unsettlement contributed to a 39.9% drop from Q2 in European buyouts (from US$ 23.3bn to US$ 14bn), the largest drop between these quarters since 2007.
The availability of cheap debt in the US made room for more buyouts, borne out by a 18.6% increase in the total value of US buyouts in Q3 2012 (US$ 31.9bn) as compared with Q3 2011 (US$ 26.9bn). Total US buyouts (US$ 82.2bn) in 2012 have accounted for 46.7% of global buyouts, a modest 4.8% decline from the same time in 2011 (US$ 86.3) when com-pared with other regions.
The Carlyle Group made the largest deal in Q3 when acquiring DuPont Performance Coat-ings from E. I. du Pont de Nemours and Company in a deal valued at US$ 4.9bn.
Latham & Watkins tops the legal advisers ranking by value, advising on 36 deals valued at US$ 25.3bn in 2012 to date.
Global M&A Overview: Private Equity Buyouts
0%
10%
20%
30%
40%
50%
60%
70%
80%
0
1
2
3
4
5
6
7
2004 2005 2006 2007 2008 2009 2010 2011 Q1-Q3 2012
Deb
t/Tot
al F
undi
ng (%
)
Deb
t/EB
ITD
A (x
)
Global Debt Financing Ratios Trend (US$200m+ buyouts, excluding buy-ins)
Debt/EBITDA Multiple (x) Debt/Total Funding (%)
0%
5%
10%
15%
20%
25%
30%
35%
0
50
100
150
200
250
300
350
400
Perc
enta
ge o
f Glo
bal M
&A
Valu
e of
Dea
ls (U
S$bn
)
Global Private Equity Buyout Activity - Quarterly
Rest of the World (Value)
Asia-Pacific ex Japan (Value)
US (Value)
Europe (Value)
Buyouts (% of Total M&A)
Top 10 Global private equity fi rms Q1-Q3 2012 - buyoutsRank Company Name Value (US$m) Deal Count
1 The Carlyle Group 15,495 202 Blackstone Group 8,741 143 AXA Private Equity 1,816 124 Kohlberg Kravis Roberts & Co 2,858 115 The Riverside Company - 106 Lloyds TSB Development Capital 396 97 H.I.G. Capital 47 88 EQT Partners 3,419 79 Vista Equity Partners 2,501 710 Warburg Pincus 1,638 7
Press Release: mergermarket M&A Round-up for Q1-Q3 2012 8 www.mergermarket.com

• Global exits (US$ 203.3bn) down 16.4% on same period last year • SBOs steady; drop in exits driven by 21.9% drop in trade sales • 2012 European exit premiums down to 15%
Private Equity fi rms were sitting tight on their investments as they waited for safer condi-tions. Total exits in Q1-Q3 2012 totalled US$ 203.3bn, down 16.4% on the same period in 2011 (US$ 243.2bn). Trade sales made up 69.2% of total PE backed exits, secondary buy-outs (SBOs) the other 30.8%.
SBOs remained steady compared to last year, matching the last year’s Q1-Q3 total value of USD$62.8bn with the current up to date 2012’s value of US$62.6bn. The third quarter alone saw US$ 28.2bn-worth of activity, up 21.6% on Q3 2011 (US$ 23.2bn).
It was trade sales that were down - by 21.9% for 2012 (US$ 140.8bn) compared to the same period in 2011 (US$ 180.4bn). The third quarter’s activity of US$ 41.2bn was down 34.9% on Q2’s US$ 63.3bn: companies appeared to be avoiding risk and remained prudent in their divestments.
Global exit premiums were up from 32.4% in 2011 to 34.9%. US premiums at 48.8% (37.9% in 2011) supported the reported slow recovery while, not surprisingly, European premiums have decreased to 15% in 2012 so far (31.1% in 2011). Global EBITDA exit multiple, at 9.9x, was behind 2011 (12.6x) and the lowest since 2003. Europe’s 10.9x was only just higher than the US’ 9.8x.
The Industrials & Chemicals sector saw the top deal of the quarter, in which Japanese Dai-kin Industries acquired Goodman Global from US Hellman & Friedman for US$ 3.7bn.
Kirkland & Ellis advised on most deals: 46 deals with a total value of US$ 16.5bn.
Global M&A Overview: Private Equity Exits
6
8
10
12
14
16
18
20
22
24
2004 2005 2006 2007 2008 2009 2010 2011 Q1-Q3 2012
EBIT
DA
Mul
tiple
(x) -
Ave
rage
Exit EBITDA Multiple Analysis - Average
Global Europe US
0%
10%
20%
30%
40%
50%
60%
70%
80%
90%
100%
0
10
20
30
40
50
60
70
80
90
100
110
120
130
140
150
Perc
enta
ge o
f Tot
al E
xits
(exc
l. IP
Os)
Valu
e of
Dea
ls (U
S$bn
)
Trade Sales vs SBO Exit Activity - Quarterly
Trade Sales (Value) SBOs (Value) Trade Sales (% of total exits) SBOs (% of total exits)
Top 10 Global private equity fi rms Q1-Q3 2012 - exitsRank Company Name Value (US$m) Deal Count
1 Intel Capital 1,531 122 Draper Fisher Jurvetson 1,948 113 3i Group 1,122 114 Battery Ventures 830 95 The Riverside Company 70 96 Macquarie Group 6,971 87 The Carlyle Group 6,653 88 Sun Capital Partners 98 89 Benchmark Capital 1,619 610 Atlas Venture 1,571 6
Press Release: mergermarket M&A Round-up for Q1-Q3 2012 9 www.mergermarket.com

• Emerging Markets deals down by 22.9% since last year • BRICs witnessed lowest quarterly total since Q1 2009 • 33.2% drop in inbound investment from Europe in Q1-Q3 2012 • Skadden Arps Slate Meagher & Flom top legal adviser with a total value of
US$ 60.6bn for the year to date
The third quarter saw Emerging Markets M&A deals adding up to US$ 69.3bn, still 49% less than Q3 2011 (US$ 135.8bn), the lowest Q3 since Q3 2008 (US$ 49.3bn) and the second low-est since Q3 2006 (US$ 67bn). The total for fi rst three quarters of the year was US$ 293.5bn, 24.1% less than Q1-Q3 2011 (US$ 386.8bn). Emerging Markets accounted for 15% of global M&A activity in Q3 2012, down from the 23.5% they accounted for in the same period in 2011. Year-to-date activity accounted for 20.4% of global M&A, compared to 21.9% in 2011.
BRIC M&A activity also decreased for the second quarter in a row to US$ 47.1bn (from US$ 75.6 in Q1 2012), the lowest quarterly BRIC total since Q1 2009 (US$ 38.6bn). Inbound cross-border activity into Emerging Markets in Q3 2012 totalled US$ 24.3bn, down 61.8% from Q2 2012 (US$ 63.7bn) and a 52% drop from Q3 2011 (US$ 50.6bn). In Q1-Q3 2012, European bidders remained the most active investors into Emerging Markets with US$ 47.2bn-worth of deals, although this was a decrease of 33.2% compared to the same period last year (US$ 70.6bn).
Gains have been seen in the Emerging Markets with Technology deals totalling US$ 21bn for Q1-Q3 2012, almost double from the same period last year (US$ 10.8bn), aided by the Yahoo-Alibaba deal valued at US$ 7.1bn.
Global M&A Overview: Emerging Markets
0.0%
2.0%
4.0%
6.0%
8.0%
10.0%
12.0%
14.0%
16.0%
18.0%
20.0%
0
10
20
30
40
50
60
2004 2005 2006 2007 2008 2009 2010 2011 Q1-Q3 2012
Perc
enta
ge (%
)
Valu
e (U
S$bn
)
Emerging Markets Buyout Activity Trend
Value (US$bn)
% of Global BO (Value)
% of EM M&A (Value)
0%
5%
10%
15%
20%
25%
30%
0
20
40
60
80
100
120
140
160
180
200
% o
f Glo
bal M
&A
Valu
e of
Dea
ls (U
S$bn
)
Emerging Markets M&A Activity Trend
Other EM (Value) BRIC (Value) EM M&A as % of Global M&A
Press Release: mergermarket M&A Round-up for Q1-Q3 2012 10 www.mergermarket.com

• Average global premiums for Q1-Q3 2012 at 28%, up from 26.6% in 2011 • North America premiums highest of any region at 41.1% • European average EBITDA multiples continue to be lowest with Asia-Pacifi c
not far behind • Decrease in overall global Q1-Q3 2012 EBITDA to 11.4x, lowest since 2003
The average premium (one day before) of global M&A deals in Q1-Q3 2012 was 28%, a slight increase from 2011 (26.6%).
North American premiums continued to trump all other regions in Q1-Q3 2012 at 41.1%, up from 37.6% in 2011. Meanwhile, European premiums took a dip in Q1-Q3 2012 at 19.3%, down from 21.9% in 2011. Targets in Asia-Pacifi c (ex Japan) had Q1-Q3 2012 average premi-ums of 24.4%, an increase from 2011 (19%) and the highest on mergermarket record (since 2001).
The average EBITDA multiple across global M&A was 11.4x in Q1-Q3 2012, down from 13.3x in 2011 and the lowest level since 2003 (10.6x). In Europe, the average EBITDA multiple was 9.8x, down from 13.7x in 2011 and the lowest on mergermarket record (since 2001).
North America’s EBITDA multiple for Q1-Q3 2012 was 12.6x, down from 2011 when it reached 13.6x.
In Japan, the Q1-Q3 2012 multiple stood at 9.8x, which, while a decrease from 2011 (14.4x), was an increase from H1 2012, when multiples were at 8.9x.
Global M&A Overview: Premia and Multiples Analysis
0
5
10
15
20
25
30
2004 2005 2006 2007 2008 2009 2010 2011 Q1-Q3 2012
EBIT
DA
Mul
tiple
(x) -
Ave
rage
EBITDA Multiple Analysis - Average
Global
Europe
North America
Asia-Pacific (excl. Japan)
Japan
0%
10%
20%
30%
40%
50%
60%
2004 2005 2006 2007 2008 2009 2010 2011 Q1-Q3 2012
Prem
ium
s %
Premium Analysis - Average
Global Europe North America Asia-Pacific (excl. Japan) Japan
Press Release: mergermarket M&A Round-up for Q1-Q3 2012 11 www.mergermarket.com

Consideration Structure
• Proportion of global M&A funded with cash-only up for third year running to hit highest ratio on record while equity contributions hit record low
• Cross-border deals have seen second highest proportion of cash-only deals in 11 years
Cash-only transactions accounted for 73.8% of the total value of M&A transactions in 2012, the highest proportion on mergermarket record (since 2001). This proportion increased for the third year running. The proportion of cross-border deals which were cash-only was also up (for the third year running) to 86.7%, with US$ 300.4bn-worth of cash-only cross-border deals announced this year.
Equity-only M&A deals, down globally, were particularly absent in Europe which saw only nine deals worth a total of US$ 1.2bn this quarter, compared with 20 deals worth US$ 11.9bn in Q3 last year. Of all global M&A deals this year, only 15.5% was paid in bidder’s shares, the lowest proportion on mergermarket record (since 2001).
The largest transaction in Q3 2012 was Kraft Foods Inc’s spin-off of its North American gro-cery business, valued at US$ 26.3bn.
Insolvency
• Q3 2012 global insolvency deals totaled US$ 4.0bn, up 18.9% from Q2 2012 • Japan’s Elpida Memory insolvency deal accounted for 62.5% of global insol-
vency value in Q3 2012 • European insolvencies in 2012 hit highest total since 2007
The third quarter of 2012 saw 65 global insolvency deals with a total value of US$ 4.0bn, a 18.9% increase from Q2 2012 (US$ 3.4bn). Global insolvency deals in Q1-Q3 2012 showed only 1.7% decrease to a total of US$ 14.0bn, compared to the US$ 14.2bn for the same period in 2011.
Asia-Pacifi c saw the highest value of insolvency deals in Q3 2012, mainly due to the acquisi-tion by Micro Technology, the US semiconductor producer, of Elpida Memory, its Japanese counterpart, for US$ 2.5bn.
Europe saw a 71.7% decrease in Q3 in the total value of insolvency deals, which fell from US$ 2.8bn in Q2 2012 to US$ 0.8bn in Q3 2012. However, the year overall hit US$ 7bn, the highest European Q1-Q3 value since 2007.
US insolvencies for the year to date fell 40.4% from US$ 5.4bn in Q1-Q3 2011, to US$ 3.2bn in Q1-Q3 2012.
Global M&A Overview: Consideration Structure/ Insolvency
0
25
50
75
100
125
150
175
200
0
10
20
30
40
50
60
Num
ber o
f dea
ls
Valu
e of
Dea
ls (U
S$bn
)
Quarterly Insolvency Deals - Global
Value (US$bn) Volume
59.1% 59.1% 59.9% 67.4% 71.0%
58.8% 67.9% 69.7%
73.8%
18.3% 18.8% 26.0%
17.9%
22.9%
22.2%
20.5% 18.6% 15.5%
22.6% 22.1% 14.1% 14.7%
6.1%
18.9% 11.5% 11.7% 10.7%
0%
10%
20%
30%
40%
50%
60%
70%
80%
90%
100%
2004 2005 2006 2007 2008 2009 2010 2011 Q1-Q3 2012
% o
f Glo
bal M
&A
Global Consideration Breakdown - Value % cash only deals % equity only deals % cash & equity deals
Press Release: mergermarket M&A Round-up for Q1-Q3 2012 12 www.mergermarket.com

• Mega-deals accounted for 16.6% of Q1-Q3 2012 global M&A with total of US$ 242.5bn
• US Q3 2012 average deal size hit second highest since Q1 2011
Mega-deals – those worth more than US$ 10bn – accounted for 16.6% of the value of global M&A transactions announced in Q1-Q3 2012, the highest proportion since 2010 but sub-stantially below the 20-plus% each year between 2004 and 2009. In the third quarter mega-deals amounted to US$ 81.6bn, 7.4% below the total for Q2 2012 (US$ 88.1bn).
US deals valued at US$ 2bn to US$ 10bn during 2012 added up to US$ 182bn, representing 35.55% of all US M&A deals announced in this period. This fi gure was marginally under the 35.85% registered in 2011 and marked the second highest level since 2007.
In the US, the average Q3 2012 deal size of US$ 516m was the highest since Q1 2011 (US$ 526m) and represented a second successive quarterly increase. This has pushed up the global average deal size, which has climbed for the third consecutive quarter to US$ 335m, the highest average deal size since Q1 2011 (US$ 361m).
Global M&A Overview: Deal Value Breakdown
28.0% 23.5% 20.1% 20.4% 23.4% 22.4% 24.6% 24.7% 24.1%
24.5%
22.0% 20.8% 22.9% 19.3% 20.5%
27.5% 26.3% 27.9%
25.5% 30.1%
27.0% 29.9% 27.9% 27.5%
32.6% 34.0% 31.4%
21.9% 24.5% 32.0%
26.7% 29.4% 29.6%
15.4% 15.0% 16.6%
0%
10%
20%
30%
40%
50%
60%
70%
80%
90%
100%
2004 2005 2006 2007 2008 2009 2010 2011 Q1-Q3 2012
Global M&A Deal Size Breakdown - % by Deal Value
$0m - $500m $501m - $2,000m $2,001 - $10,000m mega deals (over $10,001m)
Press Release: mergermarket M&A Round-up for Q1-Q3 2012 13 www.mergermarket.com

Global: League Tables of Legal AdvisersLeague Table of Legal Advisers to Global M&A: Volume
Ranking Q1-Q3 2012 Q1-Q3 2011Q1-Q3 2011
Q1-Q3 2012 Company Name
Value (US$m)
Deal Count
Deal Count
Count Change
1 1 DLA Piper 34,041 206 259 -533 2 Jones Day 87,333 204 229 -252 3 Latham & Watkins 126,483 192 232 -408 4 Kirkland & Ellis 90,859 186 196 -104 5 Linklaters 151,048 166 205 -397 6 Clifford Chance 219,543 152 196 -445 7 Baker & McKenzie 53,283 149 198 -4910 8 Skadden Arps Slate Meagher & Flom 190,993 143 169 -269 9 Allen & Overy 76,250 137 189 -526 10 Freshfields Bruckhaus Deringer 205,564 131 196 -6515 11 White & Case 95,043 122 115 713 12 Weil Gotshal & Manges 98,470 118 133 -1511 13 CMS 9,174 110 161 -5112 14 Hogan Lovells 46,225 101 152 -5118 15 Sullivan & Cromwell 126,419 87 106 -1917 16 Ashurst 31,911 86 107 -2114 17 Simpson Thacher & Bartlett 103,593 83 116 -3326 18 Paul Hastings 13,932 78 87 -921 19 Cleary Gottlieb Steen & Hamilton 120,576 77 97 -2032 20 Stikeman Elliott 51,063 77 75 2
League Table of Legal Advisers to Global M&A: ValueRanking Q1-Q3 2012 Q1-Q3 2011
Q1-Q3 2011
Q1-Q3 2012 Company Name
Value (US$m)
Deal Count
Value (US$m)
% Val. Change
16 1 Clifford Chance 219,543 152 96,240 128.1%7 2 Freshfields Bruckhaus Deringer 205,564 131 204,391 0.6%3 3 Skadden Arps Slate Meagher & Flom 190,993 143 233,530 -18.2%5 4 Linklaters 151,048 166 213,931 -29.4%9 5 Latham & Watkins 126,483 192 195,603 -35.3%1 6 Sullivan & Cromwell 126,419 87 318,424 -60.3%11 7 Cleary Gottlieb Steen & Hamilton 120,576 77 166,396 -27.5%14 8 Davis Polk & Wardwell 104,111 75 116,746 -10.8%2 9 Simpson Thacher & Bartlett 103,593 83 295,246 -64.9%13 10 Weil Gotshal & Manges 98,470 118 116,904 -15.8%23 11 White & Case 95,043 122 67,604 40.6%66 12 King & Wood Mallesons 91,176 61 24,487 272.3%20 13 Kirkland & Ellis 90,859 186 74,507 21.9%4 14 Wachtell, Lipton, Rosen & Katz 87,526 43 225,418 -61.2%17 15 Jones Day 87,333 204 93,855 -6.9%12 16 Allen & Overy 76,250 137 161,672 -52.8%10 17 Cravath Swaine & Moore 74,670 34 167,170 -55.3%19 18 Blake, Cassels & Graydon 72,479 76 79,845 -9.2%8 19 Shearman & Sterling 66,622 74 199,800 -66.7%21 20 Baker & McKenzie 53,283 149 72,206 -26.2%
Press Release: mergermarket M&A Round-up for Q1-Q3 2012 14 www.mergermarket.com

Global: League Tables of Legal AdvisersLeague Table of Legal Advisers to Global Buyouts*: Volume
Ranking Q1-Q3 2012 Q1-Q3 2011Q1-Q3 2011
Q1-Q3 2012 Company Name
Value (US$m)
Deal Count
Deal Count
Count Change
1 1 Kirkland & Ellis 11,429 69 84 -153 2 Latham & Watkins 25,261 36 38 -22 3 Weil Gotshal & Manges 16,232 33 42 -95 4 Clifford Chance 7,826 25 32 -74 5 Jones Day 3,930 24 34 -106 6 Simpson Thacher & Bartlett 15,997 23 30 -713 7 SJ Berwin 2,647 23 21 27 8 Linklaters 13,199 22 30 -89 9 Freshfields Bruckhaus Deringer 13,310 19 24 -520 10 Paul Weiss Rifkind Wharton &
Garrison 9,624 17 15 2
10 11 DLA Piper 493 16 24 -819 12 Skadden Arps Slate Meagher & Flom 2,836 15 15 018 13 Paul Hastings 1,319 14 16 -261 14 Vinson & Elkins 10,549 13 7 627 15 White & Case 2,573 13 13 026 16 Mayer Brown 2,177 13 13 042 17 McDermott Will & Emery 288 13 9 432 18 Debevoise & Plimpton 18,347 12 10 228 19 Willkie Farr & Gallagher 10,755 12 12 011 20 Allen & Overy 6,735 12 21 -9
League Table of Legal Advisers to Global Buyouts*: ValueRanking Q1-Q3 2012 Q1-Q3 2011
Q1-Q3 2011
Q1-Q3 2012 Company Name
Value (US$m)
Deal Count
Value (US$m)
% Val. Change
5 1 Latham & Watkins 25,261 36 12,538 101.5%6 2 Debevoise & Plimpton 18,347 12 11,576 58.5%3 3 Weil Gotshal & Manges 16,232 33 19,465 -16.6%1 4 Simpson Thacher & Bartlett 15,997 23 33,870 -52.8%12 5 Freshfields Bruckhaus Deringer 13,310 19 9,978 33.4%13 6 Linklaters 13,199 22 9,593 37.6%2 7 Kirkland & Ellis 11,429 69 21,315 -46.4%27 8 Willkie Farr & Gallagher 10,755 12 3,795 183.4%125 9 Vinson & Elkins 10,549 13 468 2,154%25 10 Paul Weiss Rifkind Wharton & Garrison 9,624 17 3,953 143.5%4 11 Clifford Chance 7,826 25 15,220 -48.6%9 12 Torys 7,797 5 10,814 -27.9%32 13 Wachtell, Lipton, Rosen & Katz 7,745 3 3,191 142.7%34 14 Sullivan & Cromwell 7,236 8 3,037 138.3%30 15 Allen & Overy 6,735 12 3347 101.2%- 16= Campos Ferreira, Sa Carneiro e Asociados 5,633 1 - -- 16= Morais Leitao Galvao Teles Soares Da
Silva & Associados5,633 1 - -
- 16= Vieira de Almeida & Associados 5,633 1 - -394 19 Veirano Advogados 4,900 1 - -10 20 Ropes & Gray 4,730 12 10,438 -54.7%
* Based on the target geography only and the adviser advising the buy-side only
Press Release: mergermarket M&A Round-up for Q1-Q3 2012 15 www.mergermarket.com

• Europe posted its lowest quarter since Q3 2009 • Q1-Q3 totalled US$ 457.5bn, down 22.6% on Q1-Q3 2011 • Germanic region led continent in activity
The fi nancial crisis appears to have taken a fi rm grip on the European M&A market as it has seen its slowest quarter for three years. European deals in Q3 totalled US$ 100.3bn, down 46.1% from Q2 (US$ 186.3bn) and 39.3% from Q3 2011 (US$ 165.2bn). This steep drop-off comes after two consecutive quarters of growth, and was the lowest quarter since Q3 2009, and the fourth lowest quarter on mergermarket record (since 2001).
European deals for the year to date amounted to US$ 457.5bn, a 22.6% drop on the same period in 2011 (US$ 591bn). This leaves the region needing to post its highest quarter since Q3 2008 in Q4 if it is to reach 2011’s year-end total of US$ 725.2bn-worth of deals.
The Germanic region remained the most active in the European M&A market in terms of deal value from Q1-Q3 2012 with a 27.5% market share. Energy, Mining & Utilities ac-counted for 26.3% of European deals in Q1-Q3 2012, boosted by the US$ 50.1bn Glen-core/Xstrata megadeal. Construction enjoyed a 48.7% pickup in activity for the same pe-riod compared to Q1-Q3 2011, making up US$ 12.3bn-worth of all European transactions with Camargo Correa’s US$ 5.4bn offer for Cimpor the top deal. Defence, whilst typically a quiet sector, could see a big fi llip if the rumoured EADS takeover of BAE goes through.
European inbound investment in Q3 2012 added up to US$ 38.8bn, down 50.1% from the previous quarter (US$77.7bn) and down 32.2% from the same period last year (US$57.2bn).
Europe continued to be the most attractive region for investors from outside the target country, with 42.2% of total cross-border investment by country going into Europe. Asian interest in European investments continues, particularly amongst Chinese and Japanese companies, with the latter accounting for 13% (US$ 21.6bn) of investment into Europe so far this year. The Eurozone crisis has led to a decline in inbound investment from non-zone countries. Q3 2012 saw inbound M&A into the Eurozone (US$ 26.5bn) at its second lowest level since Q2 2010 (US$ 17bn).
Clifford Chance topped the legal adviser league tables for the year to date with US$ 181.2bn-worth of deals. Freshfi elds Bruckhaus Deringer came in second with US$ 174.6bn.
European M&A Overview
0
25
50
75
100
125
150
175
200
225
250
275
300
0
10
20
30
40
50
60
70
80
90
100
110
120
130
140
150
Volu
me
of D
eals
Valu
e of
Dea
ls (U
S$bn
)
European Inbound/Outbound M&A
Inbound Value (US$bn) Outbound Value (US$bn) Inbound Volume Outbound Volume
Press Release: mergermarket M&A Round-up for Q1-Q3 2012 16 www.mergermarket.com

European M&A Overview: Industry and Geography Breakdown
UK & Ireland 23.3%
Germanic 18.0%
France 11.6%
Italy 5.7%
Iberia 5.1%
Benelux 8.9%
Nordic 14.1%
Central & Eastern Europe 9.8%
South Eastern Europe 3.2%
Other 0.2%
Mix of Announced European Deals by Geographic Region Q1-Q3 2012 - Volume
UK & Ireland 25.1%
Germanic 27.5%
France 5.6%
Italy 7.1%
Iberia 7.8%
Benelux 8.2%
Nordic 8.1%
Central & Eastern Europe 8.0%
South Eastern Europe 2.4%
Other 0.05%
Mix of Announced European Deals by Geographic Region Q1-Q3 2012 - Value
Q1-Q3 2012 Q1-Q3 2011 Change
Sector Value (US$bn) Market share Deal count Value (US$bn) Market share Deal count Value (%) Deal Count
Energy, Mining & Utilities 120.2 26.3% 240 131.3 22.2% 320 -8.5% -80
Industrials & Chemicals 69.1 15.1% 817 98.2 16.6% 884 -29.6% -67
Financial Services 60.0 13.1% 273 94.6 16.0% 313 -36.5% -40
Consumer 48.4 10.6% 568 62.1 10.5% 638 -22.0% -70
Pharma, Medical & Biotech 24.8 5.4% 191 56.2 9.5% 259 -55.8% -68
Technology 23.6 5.2% 340 31.2 5.3% 340 -24.3% 0
Transport 23.1 5.1% 139 10.8 1.8% 156 114.2% -17
Business Services 22.5 4.9% 419 24.6 4.2% 586 -8.7% -167
Telecommunications 20.4 4.5% 44 33.3 5.6% 53 -38.8% -9
Real Estate 14.4 3.1% 63 15.5 2.6% 69 -7.5% -6
Construction 12.3 2.7% 150 8.3 1.4% 183 48.7% -33
Media 9.6 2.1% 121 8.9 1.5% 148 7.3% -27
Leisure 7.8 1.7% 128 13.8 2.3% 168 -43.6% -40
Agriculture 1.0 0.2% 37 1.4 0.2% 41 -26.8% -4
Defence 0.3 0.1% 9 0.6 0.1% 7 -40.9% 2
Total 457.5 3,539 590.7 4,165 -22.5% -626
Press Release: mergermarket M&A Round-up for Q1-Q3 2012 17 www.mergermarket.com

European M&A Overview: Top DealsTop 10 Announced Deals for Q1-Q3 2012
Announced Date
Bidder Company Bidder Legal Adviser Target Company Target/Seller Legal Adviser Seller Company Deal Value (US$m)
07-Feb-12 Glencore International plc Clifford Chance (Advising Citigroup; Credit Suisse; Morgan Stanley); Linklaters
Xstrata Plc (65.92% Stake) Freshfields Bruckhaus Deringer; King & Wood Mallesons
50,563
04-Jul-12 Volkswagen AG Clifford Chance; Hogan Lovells; White & Case
Dr Ing hc F Porsche AG (50.1% Stake)
Freshfields Bruckhaus Deringer; Hengeler Mueller
Porsche Automobil Holding SE 14,238
21-May-12 Eaton Corporation A&L Goodbody; Davis Polk & Wardwell (Advising Citigroup; Morgan Stanley); Kinstellar; Matheson Ormsby Prentice; McCann FitzGerald (Advising Citigroup; Morgan Stanley); Simpson Thacher & Bartlett
Cooper Industries Plc Arthur Cox; Blake, Cassels & Graydon; Cleary Gottlieb Steen & Hamilton (Advising Goldman Sachs); Slaughter and May; Wachtell, Lipton, Rosen & Katz
11,940
16-Apr-12 GDF Suez SA Cleary Gottlieb Steen & Hamilton (Advising Lazard); Linklaters; Weil Gotshal & Manges
International Power Plc (30.23% Stake)
Clifford Chance 10,867
17-Jan-12 Sumitomo Mitsui Financial Group Inc
A&L Goodbody; Milbank Tweed Hadley & McCloy; Nagashima Ohno & Tsunematsu
RBS Aviation Capital Limited Clifford Chance; McCann FitzGerald
Royal Bank of Scotland Group Plc 7,300
19-Mar-12 United Parcel Service Inc Freshfields Bruckhaus Deringer TNT Express NV Allen & Overy; Clifford Chance (Advising Lazard); Stibbe; Sullivan & Cromwell (Advising Goldman Sachs)
6,843
19-Jun-12 Walgreen Company Allen & Overy; Cleary Gottlieb Steen & Hamilton (Advising Goldman Sachs); Davis Polk & Wardwell (Advising Bank of America Merrill Lynch); Gibson Dunn & Crutcher (Advising Lazard); Wachtell, Lipton, Rosen & Katz; Weil Gotshal & Manges
Alliance Boots GmbH (45% Stake) Clifford Chance; Darrois Villey Maillot Brochier; Simpson Thacher & Bartlett; Niederer Kraft & Frey
AB Acquisitions Holdings Limited 6,690
06-May-12 Electricite de France SA Clifford Chance; Freshfields Bruckhaus Deringer (Advising BNP Paribas); Jones Day; Paul Weiss Rifkind Wharton & Garrison
Edison International SpA (19.36% Stake)
6,438
31-May-12 Sara Lee Corporation (shareholders)
D.E MASTER BLENDERS 1753 BV De Brauw Blackstone Westbroek; Skadden Arps Slate Meagher & Flom; Allens
Hillshire Brands Co 5,876
25-Apr-12 Watson Pharmaceuticals Inc Latham & Watkins; Loyens & Loeff; Skadden Arps Slate Meagher & Flom
Actavis Group hf Clifford Chance (Advising Deutsche Bank); Kinstellar; Linklaters; Shearman & Sterling
5,806
Press Release: mergermarket M&A Round-up for Q1-Q3 2012 18 www.mergermarket.com

Europe M&A Heat Chart
Sector Ger -manic
CEE (excl.
Russia)
UK & Ireland
Italy France Nordics Ben -elux
Russia Greece &
Turkey
Iberia Total
Industrials & Chemicals 170 130 72 81 63 51 28 41 49 19 636
Consumer 130 134 68 71 55 47 30 37 35 29 704
TMT 82 105 109 32 67 64 59 43 21 37 619
Energy, Mining & Utilities 47 120 90 31 14 47 17 41 21 16 444
Pharma, Medical & Biotech 77 40 64 19 24 35 15 5 13 16 308
Business Services 43 34 77 20 23 26 25 20 12 13 293
Financial Services 38 60 58 42 13 13 19 30 27 14 314
Leisure 33 44 51 17 17 7 8 16 19 20 232
Transportation 19 43 12 15 14 19 13 23 22 13 193
Construction 20 42 14 11 22 11 6 14 13 20 173
Real Estate 24 19 14 7 3 2 6 14 5 1 95
Agriculture 7 11 1 3 3 1 14 1 1 42
Defence 4 11 1 3 3 22
Other 1 0 2 1 6 10
Government 3 1 2 3 9
Total 691 789 640 347 321 325 228 304 250 199 4,094
Hot Warm Cold
150 80 20
120 60 10
100 40 0
Note: The Intelligence Heat Chart are based on “companies for sale” tracked by mergermarket in the respective regions between 12 March 2012 and 11 September 2012. Opportunities are captured according to the dominant geography and sector of the potential target company. mergermarket’s Heat Chart of predicted deal flow is based on the intelligence collected in our database relating to companies rumoured to be for sale, or officially up for sale in the respective regions. It is therefore indicative of areas that are likely to be active in the months to come. The intelligence comes from a range of sources, including press reports, company statements and our own team of journalists gathering proprietary intelligence from M&A across the regions. The data does not differentiate between small and large transactions, nor between deals that could happen in the short or long-term.
The CEE region is set to be the most active region in Europe according to the amount of intelligence on upcoming M&A, with the Consumer sector leading amid a slew of large and high profi le deals in the sector and consolidation of Russia’s supermarket industry.
Russia’s new WTO membership has seen massive investment into the country, leading to the Industrial & Chemicals sector being the second most active industry.
The Consumer sector and the Industrial and Chemicals sector – but in reverse order - also dominate in the Germanic region, EMEA’s second most active and among the least affected by Europe’s sovereign debt crisis. The TMT sector dominates “Companies for sale” in all other European regions except Italy and Greece & Turkey.
©2012 Google - Map data © 2012 Google
Press Release: mergermarket M&A Round-up for Q1-Q3 2012 19 www.mergermarket.com

Europe: League Tables of Legal AdvisersLeague Tables of Legal Advisers to European M&A: Volume
Ranking Q1-Q3 2012 Q1-Q3 2011Q1-Q3 2011
Q1-Q3 2012 Company Name
Value (US$m)
Deal Count
Deal Count
Count Change
2 1 Linklaters 138,428 148 176 -284 2 Clifford Chance 181,148 121 158 -375 3 DLA Piper 27,468 116 152 -361 4 Freshfields Bruckhaus Deringer 174,562 115 178 -633 5 CMS 8,624 109 159 -506 6 Allen & Overy 65,718 105 145 -407 7 Baker & McKenzie 32,630 84 124 -4011 8 Jones Day 23,078 74 90 -1610 9 White & Case 52,235 72 90 -188 10 Hogan Lovells 37,989 66 98 -329 11 Latham & Watkins 50,031 64 93 -2913 12 Eversheds 13,219 64 78 -1420 13 Skadden Arps Slate Meagher & Flom 89,375 56 54 215 14 Ashurst 16,903 56 65 -919 15 Pinsent Masons 3,401 54 55 -117 16 SJ Berwin 4,481 49 62 -1383 17 Bech-Bruun 7,452 48 20 2816 18 Loyens & Loeff 18,776 46 65 -1922 19 Mannheimer Swartling 2,557 44 52 -834 20 Hengeler Mueller 40,381 43 39 4
League Tables of Legal Advisers to European M&A: ValueRanking Q1-Q3 2012 Q1-Q3 2011
Q1-Q3 2011
Q1-Q3 2012 Company Name
Value (US$m)
Deal Count
Value (US$m)
% Val. Change
6 1 Clifford Chance 181,148 121 80,799 124.2%1 2 Freshfields Bruckhaus Deringer 174,562 115 193,824 -9.9%2 3 Linklaters 138,428 148 172,911 -19.9%13 4 Skadden Arps Slate Meagher & Flom 89,375 56 50,118 78.3%7 5 Cleary Gottlieb Steen & Hamilton 78,241 42 79,893 -2.1%
127 6 King & Wood Mallesons 71,580 9 3,697 1,836%4 7 Allen & Overy 65,718 105 112,204 -41.4%3 8 Sullivan & Cromwell 57,510 25 129,914 -55.7%10 9 White & Case 52,235 72 59,961 -12.9%14 10 Weil Gotshal & Manges 50,459 40 49,971 1.0%11 11 Latham & Watkins 50,031 64 54,347 -7.9%8 12 Simpson Thacher & Bartlett 44,422 20 79,781 -44.3%9 13 Wachtell, Lipton, Rosen & Katz 41,763 11 76,256 -45.2%22 14 Hengeler Mueller 40,381 43 40,641 -0.6%23 15 Hogan Lovells 37,989 66 40,612 -6.5%35 16 Davis Polk & Wardwell 36,489 17 24,043 51.8%45 17 Kirkland & Ellis 34,043 31 19,361 75.8%67 18 A&L Goodbody 32,745 15 11,433 186.4%26 19 Baker & McKenzie 32,630 84 37,197 -12.3%21 20 Slaughter and May 32,314 29 42,315 -23.6%
Press Release: mergermarket M&A Round-up for Q1-Q3 2012 20 www.mergermarket.com

Europe: League Tables of Legal AdvisersLeague Tables of Legal Advisers to European Buyouts* Volume
Ranking Q1-Q3 2012 Q1-Q3 2011Q1-Q3 2011
Q1-Q3 2012 Company Name
Value (US$m)
Deal Count
Deal Count
Count Change
5 1 SJ Berwin 2,647 23 21 21 2 Linklaters 11,757 19 28 -93 3 Clifford Chance 5,009 17 23 -64 4 Freshfields Bruckhaus Deringer 12,192 15 23 -88 5 Latham & Watkins 1,586 13 15 -26 6 Weil Gotshal & Manges 6,898 11 19 -82 7 CMS 950 11 25 -1413 8 Kirkland & Ellis 4,210 10 12 -215 9 Mayer Brown 953 9 11 -218 10 Eversheds 339 9 10 -17 11 Allen & Overy 6,140 8 17 -916 12 Vinge 2,255 8 10 -219 13 White & Case 1,282 8 10 -226 14 Olswang 698 8 9 -112 15 Ashurst 687 8 12 -432 16 Macfarlanes 31 8 7 150 17 Hannes Snellman 788 7 5 211 18 DLA Piper 379 7 14 -720 19 Pinsent Masons 50 7 10 -331 20 De Pardieu Brocas Maffei - 7 7 0
League Tables of Legal Advisers to European Buyouts* ValueRanking Q1-Q3 2012 Q1-Q3 2011
Q1-Q3 2011
Q1-Q3 2012 Company Name
Value (US$m)
Deal Count
Value (US$m)
% Val. Change
2 1 Freshfields Bruckhaus Deringer 12,192 15 9,978 22.2%3 2 Linklaters 11,757 19 8,788 33.8%13 3 Weil Gotshal & Manges 6,898 11 4,144 66.5%21 4 Allen & Overy 6,140 8 2,737 124.3%- 5= Campos Ferreira, Sa Carneiro e Asociados 5,633 1 - -- 5= Morais Leitao Galvao Teles Soares Da Silva
& Associados5,633 1 - -
- 5= Vieira de Almeida & Associados 5,633 1 - -1 8 Clifford Chance 5,009 17 10,089 -50.4%57 9 Sullivan & Cromwell 4,524 2 649 597.1%11 10 Kirkland & Ellis 4,210 10 4,262 -1.2%
175 11 Advokatfirmaet BA-HR DA 2,834 3 - -33 12 SJ Berwin 2,647 23 1,621 63.3%54 13 Slaughter and May 2,640 2 654 303.7%25 14 Bech-Bruun 2,628 6 2,091 25.7%18 15 Simpson Thacher & Bartlett 2,576 2 3,067 -16.0%93 16 Roschier 2,518 4 171 1,373%39 17 Baker & McKenzie 2,408 4 1,360 77.1%100 18 P+P Poellath + Partners 2,313 6 139 1,564%10 19 Ropes & Gray 2,308 2 4,304 -46.4%7 20 Vinge 2,255 8 5,620 -59.9%
* Based on the target geography only and the adviser advising the buy-side only
Press Release: mergermarket M&A Round-up for Q1-Q3 2012 21 www.mergermarket.com

Europe: League Tables of Legal Advisers
Legal Advisers to French M&A: VolumeRanking Q1-Q3 2012 Q1-Q3 2011
Q1-Q3 2011
Q1-Q3 2012 Company Name
Value (US$m)
Deal Count
Deal Count
Count Change
1 1 Linklaters 15,370 23 35 -1210 2 De Pardieu Brocas Maffei 1,280 22 22 04 3 SJ Berwin 2,476 21 27 -69 4 CMS 285 21 22 -120 5 Baker & McKenzie 5,365 18 15 32 6 Clifford Chance 17,989 17 31 -147 7 Latham & Watkins 4,360 17 24 -76 8 Gide Loyrette Nouel 2,326 17 25 -817 9 Jones Day 3,463 16 16 012 10 Cleary Gottlieb Steen & Hamilton 23,101 14 19 -513 11 White & Case 2,061 14 19 -53 12 Mayer Brown 1,063 14 29 -1518 13 Weil Gotshal & Manges 12,902 13 16 -315 14 Hogan Lovells 3,200 13 18 -519 15 Paul Hastings 107 13 16 -3
Legal Advisers to French M&A: ValueRanking Q1-Q3 2012 Q1-Q3 2011
Q1-Q3 2011
Q1-Q3 2012 Company Name
Value (US$m)
Deal Count
Value (US$m)
% Val. Change
7 1 Cleary Gottlieb Steen & Hamilton 23,101 14 11,359 103.4%6 2 Clifford Chance 17,989 17 14,533 23.8%1 3 Linklaters 15,370 23 46,827 -67.2%39 4 Weil Gotshal & Manges 12,902 13 2,851 352.5%2 5 Freshfields Bruckhaus Deringer 8,863 11 32,305 -72.6%24 6 Darrois Villey Maillot Brochier 7,060 8 5,203 35.7%11 7 Baker & McKenzie 5,365 18 9,174 -41.5%5 8 Latham & Watkins 4,360 17 18,336 -76.2%3 9 Bredin Prat 3,880 11 26,405 -85.3%30 10 Jones Day 3,463 16 3,948 -12.3%71 11 Paul Weiss Rifkind Wharton & Garrison 3,449 3 921 274.5%80 12 Dechert 3,281 8 748 338.6%35 13 Hogan Lovells 3,200 13 3,142 1.8%16 14 Sullivan & Cromwell 3,189 2 8,095 -60.6%15 15 Loyens & Loeff 2,915 7 8,724 -66.6%
Legal Advisers to UK M&A: VolumeRanking Q1-Q3 2012 Q1-Q3 2011
Q1-Q3 2011
Q1-Q3 2012 Company Name
Value (US$m)
Deal Count
Deal Count
Count Change
2 1 Linklaters 42,050 64 68 -41 2 DLA Piper 12,048 63 79 -166 3 Pinsent Masons 3,401 54 55 -13 4 Freshfields Bruckhaus Deringer 39,204 49 60 -114 5 Eversheds 9,221 49 59 -107 6 Clifford Chance 48,003 47 53 -65 7 Allen & Overy 28,850 40 56 -168 8 CMS 6,089 32 49 -1710 9 Hogan Lovells 11,646 30 38 -814 10 Ashurst 5,931 30 34 -425 11 Macfarlanes 2,604 30 24 619 12 Travers Smith 10,297 28 30 -220 13 Olswang 1,421 28 30 -29 14 Slaughter and May 19,296 26 44 -1823 15 Squire Sanders 1,133 26 26 0
Legal Advisers to UK M&A: ValueRanking Q1-Q3 2012 Q1-Q3 2011
Q1-Q3 2011
Q1-Q3 2012 Company Name
Value (US$m)
Deal Count
Value (US$m)
% Val. Change
11 1 Clifford Chance 48,003 47 16,131 197.6%2 2 Linklaters 42,050 64 68,418 -38.5%14 3 Weil Gotshal & Manges 39,531 21 14,573 171.3%1 4 Freshfields Bruckhaus Deringer 39,204 49 68,798 -43.0%33 5 Cleary Gottlieb Steen & Hamilton 37,033 8 7,933 366.8%3 6 Allen & Overy 28,850 40 65,166 -55.7%22 7 Simpson Thacher & Bartlett 28,152 11 13,246 112.5%25 8 Latham & Watkins 22,006 23 11,920 84.6%21 9 Wachtell, Lipton, Rosen & Katz 20,918 6 13,330 56.9%13 10 Sullivan & Cromwell 20,662 14 14,666 40.9%4 11 Slaughter and May 19,296 26 36,950 -47.8%15 12 Skadden Arps Slate Meagher & Flom 17,935 21 14,476 23.9%16 13 Kirkland & Ellis 16,440 18 14,407 14.1%119 14 Kaye Scholer 15,193 4 901 1,586%30 15 Fried Frank Harris Shriver & Jacobson 12,323 4 10,401 18.5%
Press Release: mergermarket M&A Round-up for Q1-Q3 2012 22 www.mergermarket.com

Europe: League Tables of Legal Advisers
Legal Advisers to Germanic M&A: VolumeRanking Q1-Q3 2012 Q1-Q3 2011
Q1-Q3 2011
Q1-Q3 2012 Company Name
Value (US$m)
Deal Count
Deal Count
Count Change
1 1 Freshfields Bruckhaus Deringer 94,719 53 75 -222 2 CMS 2,766 49 69 -203 3 Clifford Chance 94,033 39 44 -56 4 Hengeler Mueller 39,608 39 33 65 5 Baker & McKenzie 19,968 35 36 -111 6 Noerr 7,563 27 27 04 7 Linklaters 69,205 26 38 -127 8 Allen & Overy 26,694 25 30 -517 9 Jones Day 8,847 23 18 514 10 Hogan Lovells 23,694 22 21 18 11 P+P Poellath + Partners 4,491 22 29 -710 12 Latham & Watkins 7,855 20 27 -712 13 White & Case 32,081 19 25 -69 14 DLA Piper 12,331 19 28 -919 15 Skadden Arps Slate Meagher & Flom 27,806 18 14 4
Legal Advisers to Germanic M&A: ValueRanking Q1-Q3 2012 Q1-Q3 2011
Q1-Q3 2011
Q1-Q3 2012 Company Name
Value (US$m)
Deal Count
Value (US$m)
% Val. Change
3 1 Freshfields Bruckhaus Deringer 94,719 53 59,863 58.2%21 2 Clifford Chance 94,033 39 20,988 348.0%55 3 King & Wood Mallesons 70,840 6 2,483 2,753%4 4 Linklaters 69,205 26 56,106 23.3%11 5 Hengeler Mueller 39,608 39 38,722 2.3%13 6 White & Case 32,081 19 32,355 -0.8%36 7 Skadden Arps Slate Meagher & Flom 27,806 18 8,738 218.2%26 8 Allen & Overy 26,694 25 15,024 77.7%44 9 Hogan Lovells 23,694 22 4,216 462.0%34 10 Baker & McKenzie 19,968 35 9949 100.7%47 11 Gibson Dunn & Crutcher 17,847 5 3,192 459.1%31 12 Davis Polk & Wardwell 16,708 7 12,267 36.2%53 13 Kirkland & Ellis 16,586 7 2,560 547.9%16 14 Weil Gotshal & Manges 15,886 7 22,349 -28.9%24 15 Mayer Brown 13,883 10 16,567 -16.2%
Legal Advisers to German M&A: VolumeRanking Q1-Q3 2012 Q1-Q3 2011
Q1-Q3 2011
Q1-Q3 2012 Company Name
Value (US$m)
Deal Count
Deal Count
Count Change
2 1 CMS 2,285 44 61 -171 2 Freshfields Bruckhaus Deringer 41,408 40 61 -214 3 Hengeler Mueller 39,608 38 33 53 4 Clifford Chance 22,757 32 42 -107 5 Noerr 7,563 27 26 16 6 P+P Poellath + Partners 4,491 22 28 -615 7 Hogan Lovells 23,694 20 14 610 8 Latham & Watkins 7,855 20 22 -216 9 Jones Day 4,999 19 14 513 10 Baker & McKenzie 5,703 18 18 08 11 Allen & Overy 18,403 17 24 -75 12 Linklaters 8,388 17 29 -1211 13 White & Case 20,231 16 22 -69 14 Luther 1,333 16 23 -712 15 DLA Piper 456 14 20 -6
Legal Advisers to German M&A: ValueRanking Q1-Q3 2012 Q1-Q3 2011
Q1-Q3 2011
Q1-Q3 2012 Company Name
Value (US$m)
Deal Count
Value (US$m)
% Val. Change
12 1 Freshfields Bruckhaus Deringer 41,408 40 20,607 100.9%8 2 Hengeler Mueller 39,608 38 38,722 2.3%32 3 Hogan Lovells 23,694 20 3234 632.7%11 4 Clifford Chance 22,757 32 20,652 10.2%14 5 White & Case 20,231 16 16,870 19.9%17 6 Allen & Overy 18,403 17 14,768 24.6%9 7 Linklaters 8,388 17 28920 -71.0%52 8 Weil Gotshal & Manges 7,941 4 1,158 585.8%13 9 Latham & Watkins 7,855 20 17,088 -54.0%31 10 Noerr 7,563 27 3,830 97.5%27 11 Skadden Arps Slate Meagher & Flom 6,300 11 5,184 21.5%29 12 Baker & McKenzie 5,703 18 4,388 30.0%20 13 Davis Polk & Wardwell 5,688 3 12,267 -53.6%- 14 Gleiss Lutz 5,136 13 - -
15 15 Cravath Swaine & Moore 5,044 3 16,762 -69.9%
Press Release: mergermarket M&A Round-up for Q1-Q3 2012 23 www.mergermarket.com

Europe: League Tables of Legal Advisers
Legal Advisers to Italian M&A: VolumeRanking Q1-Q3 2012 Q1-Q3 2011
Q1-Q3 2011
Q1-Q3 2012 Company Name
Value (US$m)
Deal Count
Deal Count
Count Change
1 1 Chiomenti Studio Legale 6,613 26 32 -62 2 Gianni, Origoni, Grippo, Cappelli & Partners 12,866 18 23 -53 3 d'Urso Gatti e Bianchi - Studio
Legale Associato10,263 18 18 0
7 4 NCTM Studio Legale Associato 5,050 16 13 34 5 Bonelli Erede Pappalardo 6,833 13 15 -214 6 Linklaters 2,371 10 8 26 7 Studio Pedersoli e Associati 441 10 13 -35 8 Clifford Chance 5,450 8 13 -520 9 Grimaldi e Associati 1,017 6 6 021 10 BLF Studio Legale 729 6 6 08 11 Latham & Watkins 700 6 11 -522 12 CMS 302 6 6 09 13 Freshfields Bruckhaus Deringer 9,404 5 10 -524 14 Jones Day 3,729 5 5 031 15 Pirola Pennuto Zei & Associati 1,248 5 4 1
Legal Advisers to Italian M&A: ValueRanking Q1-Q3 2012 Q1-Q3 2011
Q1-Q3 2011
Q1-Q3 2012 Company Name
Value (US$m)
Deal Count
Value (US$m)
% Val. Change
5 1 Gianni, Origoni, Grippo, Cappelli & Partners 12,866 18 7,053 82.4%3 2 d'Urso Gatti e Bianchi - Studio
Legale Associato10,263 18 7,584 35.3%
4 3 Freshfields Bruckhaus Deringer 9,404 5 7,234 30.0%2 4 Bonelli Erede Pappalardo 6,833 13 10,580 -35.4%1 5 Chiomenti Studio Legale 6,613 26 12,569 -47.4%10 6 Clifford Chance 5,450 8 5,690 -4.2%75 7 Paul Weiss Rifkind Wharton & Garrison 5,277 4 125 4,122%36 8 NCTM Studio Legale Associato 5,050 16 575 778.3%11 9 Cleary Gottlieb Steen & Hamilton 4,298 3 5,656 -24.0%99 10 Jones Day 3,729 5 40 9,223%19 11 Linklaters 2,371 10 2,071 14.5%- 12= Epstein Rosenblum Maoz 1,989 2 - -- 12= Rosenram 1,989 2 - -- 12= Yigal Arnon & Co 1,989 2 - -
50 15 White & Case 1,663 2 319 421.3%
Legal Advisers to Benelux M&A: VolumeRanking Q1-Q3 2012 Q1-Q3 2011
Q1-Q3 2011
Q1-Q3 2012 Company Name
Value (US$m)
Deal Count
Deal Count
Count Change
2 1 Loyens & Loeff 7,725 36 56 -201 2 Allen & Overy 21,330 35 59 -249 3 De Brauw Blackstone Westbroek 14,585 31 29 23 4 NautaDutilh 4,406 22 42 -2012 5 Houthoff Buruma 1,435 22 26 -48 6 Freshfields Bruckhaus Deringer 36,081 21 29 -84 7 Linklaters 7,369 21 40 -19- 8 Stibbe 3,998 21 - -6 9 DLA Piper 967 20 31 -117 10 CMS 716 18 30 -1211 11 Baker & McKenzie 1,284 13 26 -1337 12 AKD lawyers & civil law notaries 29 13 5 825 13 Lexence - 13 8 55 14 Clifford Chance 32,341 12 33 -2118 15 Eubelius 255 11 10 1
Legal Advisers to Benelux M&A: ValueRanking Q1-Q3 2012 Q1-Q3 2011
Q1-Q3 2011
Q1-Q3 2012 Company Name
Value (US$m)
Deal Count
Value (US$m)
% Val. Change
2 1 Freshfields Bruckhaus Deringer 36,081 21 21,271 69.6%1 2 Sullivan & Cromwell 32,909 4 22,976 43.2%24 3 Skadden Arps Slate Meagher & Flom 32,599 10 4,376 644.9%10 4 Clifford Chance 32,341 12 9,933 225.6%7 5 Allen & Overy 21,330 35 11,909 79.1%31 6 Greenberg Traurig 20,422 3 3,343 510.9%202 7 Alston & Bird 20,115 2 - -139 8 Cravath Swaine & Moore 20,100 2 100 20,000%
- 9= Creel, Garcia-Cuellar, Aiza y Enriquez 20,100 1 - -65 9= Mijares, Angoitia, Cortes y Fuentes 20,100 1 756 2,559%28 11 De Brauw Blackstone Westbroek 14,585 31 3,728 291.2%15 12 Wachtell, Lipton, Rosen & Katz 8,649 3 9,000 -3.9%16 13 Cleary Gottlieb Steen & Hamilton 8,078 8 7,013 15.2%4 14 Loyens & Loeff 7,725 36 19514 -60.4%3 15 Linklaters 7,369 21 19,908 -63.0%
Press Release: mergermarket M&A Round-up for Q1-Q3 2012 24 www.mergermarket.com

Europe: League Tables of Legal Advisers
Legal Advisers to Spanish M&A: VolumeRanking Q1-Q3 2012 Q1-Q3 2011
Q1-Q3 2011
Q1-Q3 2012 Company Name
Value (US$m)
Deal Count
Deal Count
Count Change
1 1 Garrigues 10,110 31 37 -62 2 Cuatrecasas, Goncalves Pereira 1,767 21 31 -103 3 Uria Menendez 9,816 17 30 -137 4 Linklaters 4,627 17 16 111 5 Baker & McKenzie 2,078 11 11 013 6 DLA Piper 289 11 10 19 7 Deloitte Legal 468 10 13 -320 8 Ashurst 1,386 9 4 54 9 Freshfields Bruckhaus Deringer 11,200 8 22 -145 10 Clifford Chance 4,256 7 18 -1116 11 Jones Day 1,575 6 7 -118 12 Hogan Lovells 3,092 5 5 0- 13 Bird & Bird 530 4 - -8 14 KPMG Abogados 470 4 15 -11- 15 Lefosse Advogados 3,931 3 - -
Legal Advisers to Spanish M&A: ValueRanking Q1-Q3 2012 Q1-Q3 2011
Q1-Q3 2011
Q1-Q3 2012 Company Name
Value (US$m)
Deal Count
Value (US$m)
% Val. Change
2 1 Freshfields Bruckhaus Deringer 11,200 8 36,957 -69.7%7 2 Garrigues 10,110 31 10,791 -6.3%1 3 Uria Menendez 9,816 17 42,781 -77.1%5 4 Linklaters 4,627 17 17,454 -73.5%3 5 Clifford Chance 4,256 7 26,556 -84.0%- 6 Lefosse Advogados 3,931 3 - -
19 7= Machado Meyer Sendacz e Opice 3,255 2 3,161 3.0%18 7= Souza, Cescon, Barrieu & Flesch Advogados 3,255 2 3,509 -7.2%73 9 Hogan Lovells 3,092 5 111 2,686%16 10 Baker & McKenzie 2,078 11 4,212 -50.7%4 11 Cuatrecasas, Goncalves Pereira 1,767 21 20,931 -91.6%53 12 Jones Day 1,575 6 245 542.9%21 13 Sullivan & Cromwell 1,413 1 2,925 -51.7%37 14 Ashurst 1,386 9 720 92.5%46 15 Ramon & Cajal 1,311 2 354 270.3%
Legal Advisers to Iberian M&A: VolumeRanking Q1-Q3 2012 Q1-Q3 2011
Q1-Q3 2011
Q1-Q3 2012 Company Name
Value (US$m)
Deal Count
Deal Count
Count Change
1 1 Garrigues 10,110 31 39 -82 2 Cuatrecasas, Goncalves Pereira 2,371 24 35 -116 3 Linklaters 12,296 23 18 53 4 Uria Menendez 15,303 19 31 -1211 5 Baker & McKenzie 2,078 11 11 013 6 DLA Piper 289 11 10 19 7 Deloitte Legal 468 10 13 -322 8 Ashurst 1,386 9 4 54 9 Freshfields Bruckhaus Deringer 11,200 8 22 -145 10 Clifford Chance 4,520 8 18 -1016 11 Jones Day 1,575 6 7 -126 12 Morais Leitao Galvao Teles Soares Da
Silva & Associados6,468 5 4 1
18 13 Hogan Lovells 3,092 5 5 0103 14 PLMJ - Sociedade de Advogados 5,810 4 1 315 15 Allen & Overy 3,942 4 7 -3
Legal Advisers to Iberian M&A: ValueRanking Q1-Q3 2012 Q1-Q3 2011
Q1-Q3 2011
Q1-Q3 2012 Company Name
Value (US$m)
Deal Count
Value (US$m)
% Val. Change
1 1 Uria Menendez 15,303 19 42,781 -64.2%5 2 Linklaters 12,296 23 17,454 -29.6%2 3 Freshfields Bruckhaus Deringer 11,200 8 36,957 -69.7%- 4 Campos Ferreira, Sa Carneiro e Asociados 11,060 2 - -6 5 Garrigues 10,110 31 15,762 -35.9%
107 6 Morais Leitao Galvao Teles Soares Da Silva & Associados
6,468 5 8 80,750%
96 7 PLMJ - Sociedade de Advogados 5,810 4 29 19,934%- 8 Servulo Correia & Associados 5,696 2 - -
109 9 Vieira de Almeida & Associados 5,633 1 6 93,783%11 10= Bredin Prat 5,427 1 6,031 -10.0%28 10= Mattos Filho, Veiga Filho, Marrey Jr. e
Quiroga Advogados5,427 1 2,005 170.7%
3 12 Clifford Chance 4,520 8 26,556 -83.0%18 13 Allen & Overy 3,942 4 4,407 -10.6%- 14 Lefosse Advogados 3,931 3 - -
21 15= Machado Meyer Sendacz e Opice 3,255 2 3,161 3.0%8 15= Souza, Cescon, Barrieu & Flesch Advogados 3,255 2 8,472 -61.6%
Press Release: mergermarket M&A Round-up for Q1-Q3 2012 25 www.mergermarket.com

Europe: League Tables of Legal AdvisersLegal Advisers to Nordic M&A: Volume
Ranking Q1-Q3 2012 Q1-Q3 2011Q1-Q3 2011
Q1-Q3 2012 Company Name
Value (US$m)
Deal Count
Deal Count
Count Change
19 1 Bech-Bruun 7,452 48 19 292 2 Mannheimer Swartling 2,540 42 51 -98 3 Kromann Reumert 6,498 37 31 69 4 Wiersholm 6,631 36 29 71 5 Vinge 3,821 35 51 -163 6 Schjodt 2,957 35 39 -44 7 Hannes Snellman 5,435 30 38 -85 8 Roschier 4,446 28 35 -76 9 Plesner 3,024 28 34 -610 10 Thommessen 7,063 27 29 -211 11 Wikborg Rein & Co 2,097 27 29 -218 12 Gorrissen Federspiel 3,564 26 20 614 13 Advokatfirman Lindahl 257 26 24 27 14 Accura 3,411 22 32 -1033 15 Delphi 165 18 10 8
Legal Advisers to Nordic M&A: ValueRanking Q1-Q3 2012 Q1-Q3 2011
Q1-Q3 2011
Q1-Q3 2012 Company Name
Value (US$m)
Deal Count
Value (US$m)
% Val. Change
12 1 Clifford Chance 15,449 12 9,724 58.9%40 2 Shearman & Sterling 11,612 1 2,678 333.6%1 3 Freshfields Bruckhaus Deringer 10,813 10 24,142 -55.2%14 4 Linklaters 9,967 13 8,506 17.2%8 5 Skadden Arps Slate Meagher & Flom 8,925 3 11,581 -22.9%4 6 Bech-Bruun 7,452 48 14,820 -49.7%3 7 White & Case 7,367 16 20,682 -64.4%16 8 Thommessen 7,063 27 8,016 -11.9%15 9 Wiersholm 6,631 36 8154 -18.7%11 10 Kromann Reumert 6,498 37 10,242 -36.6%36 11 Latham & Watkins 6,275 4 3,016 108.1%153 12 Loyens & Loeff 5,875 4 54 10,780%18 13 Eversheds 5,814 10 6,834 -14.9%- 14 Kinstellar 5,806 3 - -
19 15 Hannes Snellman 5,435 30 6,633 -18.1%
Legal Advisers to Swedish M&A: ValueRanking Q1-Q3 2012 Q1-Q3 2011
Q1-Q3 2011
Q1-Q3 2012 Company Name
Value (US$m)
Deal Count
Value (US$m)
% Val. Change
1 1 Freshfields Bruckhaus Deringer 7,234 5 22,384 -67.7%11 2 Clifford Chance 6,249 9 7,625 -18.0%4 3 Bech-Bruun 3,837 6 13,740 -72.1%9 4 Vinge 3,821 34 7,965 -52.0%2 5 White & Case 3,532 12 20,072 -82.4%48 6 Kromann Reumert 3,380 7 895 277.7%16 7 Kirkland & Ellis 3,257 2 3,707 -12.1%23 8 Roschier 3,009 13 3204 -6.1%65 9 Advokatfirmaet BA-HR DA 2,834 4 444 538.3%49 10 Accura 2,816 6 878 220.7%38 11 Gernandt & Danielsson 2,622 12 1,474 77.9%12 12 Mannheimer Swartling 2,414 40 6,475 -62.7%46 13 Allen & Overy 2,302 3 990 132.5%75 14 Baker & McKenzie 2,301 6 289 696.2%13 15 P+P Poellath + Partners 2,289 3 4,634 -50.6%
Legal Advisers to Swedish M&A: VolumeRanking Q1-Q3 2012 Q1-Q3 2011
Q1-Q3 2011
Q1-Q3 2012 Company Name
Value (US$m)
Deal Count
Deal Count
Count Change
2 1 Mannheimer Swartling 2,414 40 50 -101 2 Vinge 3,821 34 50 -163 3 Advokatfirman Lindahl 248 24 24 06 4 Hannes Snellman 1,723 19 19 09 5 Wistrand 470 17 16 114 6 Delphi 165 17 10 711 7 Roschier 3,009 13 15 -28 8 White & Case 3,532 12 18 -67 9 Gernandt & Danielsson 2,622 12 19 -74 10 Cederquist 1,919 11 21 -1025 11 Clifford Chance 6,249 9 4 55 12 Setterwalls 1,609 9 19 -1010 13 Linklaters 1,353 8 15 -718 14 Kromann Reumert 3,380 7 7 021 15 Eversheds 2,039 7 6 1
Press Release: mergermarket M&A Round-up for Q1-Q3 2012 26 www.mergermarket.com

Europe: League Tables of Legal Advisers
Legal Advisers to Russian M&A: VolumeRanking Q1-Q3 2012 Q1-Q3 2011
Q1-Q3 2011
Q1-Q3 2012 Company Name
Value (US$m)
Deal Count
Deal Count
Count Change
2 1 White & Case 7,642 8 12 -418 2 Skadden Arps Slate Meagher & Flom 7,101 8 3 54 3 Akin Gump Strauss Hauer & Feld 4,351 5 9 -413 4 Cleary Gottlieb Steen & Hamilton 4,151 5 4 16 5 DLA Piper 2,620 5 6 -117 6 Clifford Chance 590 5 4 13 7 Linklaters 3,736 4 9 -526 8 SALANS 500 4 2 219 9 Squire Sanders 208 4 3 15 10 Hogan Lovells 2,261 3 8 -510 11 Debevoise & Plimpton 902 3 4 -11 12 Freshfields Bruckhaus Deringer 620 3 15 -1211 13 Allen & Overy 463 3 4 -124 14 Hannes Snellman 33 3 2 18 15 Baker & McKenzie - 3 5 -2
Legal Advisers to Russian M&A: ValueRanking Q1-Q3 2012 Q1-Q3 2011
Q1-Q3 2011
Q1-Q3 2012 Company Name
Value (US$m)
Deal Count
Value (US$m)
% Val. Change
11 1 White & Case 7,642 8 2,741 178.8%10 2 Skadden Arps Slate Meagher & Flom 7,101 8 2,881 146.5%7 3 Akin Gump Strauss Hauer & Feld 4,351 5 4,639 -6.2%13 4 Cleary Gottlieb Steen & Hamilton 4,151 5 1,873 121.6%1 5 Linklaters 3,736 4 16,416 -77.2%- 6= Kinstellar 3,525 1 - -- 6= Taboglu & Demirhan 3,525 1 - -8 8 DLA Piper 2,620 5 3,801 -31.1%15 9 Hogan Lovells 2,261 3 1,397 61.8%- 10 YukselKarkinKucuk Law Firm 1,900 2 - -- 11 Herguner Bilgen Ozeke 1,900 1 - -- 12 Liniya Prava 1,774 2 - -3 13 Debevoise & Plimpton 902 3 12,137 -92.6%- 14= Herbert Smith 714 2 - -
63 14= LAWIN 714 2 - -
Legal Advisers to CEE M&A: VolumeRanking Q1-Q3 2012 Q1-Q3 2011
Q1-Q3 2011
Q1-Q3 2012 Company Name
Value (US$m)
Deal Count
Deal Count
Count Change
12 1 Allen & Overy 4,817 16 11 53 2 Clifford Chance 1,426 14 21 -72 3 CMS 658 14 23 -91 4 White & Case 7,915 13 24 -115 5 Linklaters 4,386 12 20 -88 6 DLA Piper 4,471 11 15 -410 7 LAWIN 714 11 14 -36 8 Baker & McKenzie 513 10 19 -914 9 SORAINEN 216 10 10 013 10 Wolf Theiss 53 9 11 -230 11 Skadden Arps Slate Meagher & Flom 7,101 8 4 424 12 SALANS 760 8 6 27 13 Raidla Lejins & Norcous 217 8 18 -104 14 Freshfields Bruckhaus Deringer 4,595 7 20 -1316 15 Havel, Holasek & Partners 3,602 6 9 -3
Legal Advisers to CEE M&A: ValueRanking Q1-Q3 2012 Q1-Q3 2011
Q1-Q3 2011
Q1-Q3 2012 Company Name
Value (US$m)
Deal Count
Value (US$m)
% Val. Change
12 1 White & Case 7,915 13 5,534 43.0%17 2 Skadden Arps Slate Meagher & Flom 7,101 8 3,390 109.5%8 3 Weil Gotshal & Manges 5,439 5 8,476 -35.8%3 4 Allen & Overy 4,817 16 13,583 -64.5%1 5 Freshfields Bruckhaus Deringer 4,595 7 24,414 -81.2%5 6 DLA Piper 4,471 11 10,790 -58.6%2 7 Linklaters 4,386 12 22,884 -80.8%13 8 Akin Gump Strauss Hauer & Feld 4,351 5 4,639 -6.2%23 9 Cleary Gottlieb Steen & Hamilton 4,151 5 1,873 121.6%50 10 Havel, Holasek & Partners 3,602 6 219 1,545%70 11 Kinstellar 3,558 6 98 3,531%- 12 Taboglu & Demirhan 3,525 1 - -
81 13 Kirkland & Ellis 3,498 2 46 7,504%- 14 McCarthy Tetrault 3,498 1 - -
26 15 Hogan Lovells 2,261 4 1,397 61.8%
Press Release: mergermarket M&A Round-up for Q1-Q3 2012 27 www.mergermarket.com

Europe: League Tables of Legal AdvisersLegal Advisers to Irish M&A: Volume
Ranking Q1-Q3 2012 Q1-Q3 2011Q1-Q3 2011
Q1-Q3 2012 Company Name
Value (US$m)
Deal Count
Deal Count
Count Change
2 1 A&L Goodbody 20,895 14 22 -81 2 Arthur Cox 13,489 11 26 -155 3 McCann FitzGerald 8,156 9 13 -43 4 William Fry 941 9 16 -74 5 Matheson Ormsby Prentice 13,254 8 15 -76 6 Mason Hayes & Curran 62 7 10 -311 7 Linklaters 1,328 6 3 3- 8 Maples & Calder 7 6 - -
10 9 DLA Piper 589 4 3 129 10 Pinsent Masons 143 4 2 217 11 Clifford Chance 7,387 3 3 08 12 Allen & Overy 750 3 5 -262 13 CMS 151 3 1 2- 14 SALANS 16 3 - -7 15 Eversheds 7 3 8 -5
Legal Advisers to Irish M&A: ValueRanking Q1-Q3 2012 Q1-Q3 2011
Q1-Q3 2011
Q1-Q3 2012 Company Name
Value (US$m)
Deal Count
Value (US$m)
% Val. Change
3 1 A&L Goodbody 20,895 14 10,333 102.2%1 2 Arthur Cox 13,489 11 23,462 -42.5%9 3 Matheson Ormsby Prentice 13,254 8 3,913 238.7%23 4 Cleary Gottlieb Steen & Hamilton 12,635 2 960 1,216%44 5 Latham & Watkins 11,940 2 161 7,316%76 6= Blake, Cassels & Graydon 11,940 1 - -- 6= Davis Polk & Wardwell 11,940 1 - -- 6= Kinstellar 11,940 1 - -
31 6= Simpson Thacher & Bartlett 11,940 1 370 3,127%12 6= Slaughter and May 11,940 1 2,583 362.3%- 6= Wachtell, Lipton, Rosen & Katz 11,940 1 - -
20 12 McCann FitzGerald 8,156 9 1,499 444.1%37 13 Clifford Chance 7,387 3 222 3,227%- 14= Milbank Tweed Hadley & McCloy 7,300 1 - -- 14= Nagashima Ohno & Tsunematsu 7,300 1 - -
Press Release: mergermarket M&A Round-up for Q1-Q3 2012 28 www.mergermarket.com

• Q3 2012 US M&A totaled US$ 206.7bn, up 4.8% on Q3 2011 • Q1-Q3 2012 down 18.6% from Q1-Q3 2011 • Industrials & Chemicals saw sharp decline
The US saw M&A in Q3 2012 with a total value of US$ 206.7bn, up 11.7% from Q2 2012 (US$ 185.1bn). Combined, Q1-Q3 2012’s total of US$ 512.1bn was however down by 18.6% on Q1-Q3 2011 (US$ 628.8bn), making it the lowest Q1-Q3 period since Q1-Q3 2010 (US$ 476.4bn). Q3 2012 saw a year-on-year increase of 4.8% from Q3 2011 (US$ 197.2bn). It was the highest quarterly total since Q1 2011 (US$ 247.2bn) and third highest since Q3 2008 (US$ 263bn). The US accounted for 35% of aggregate global deal activity in 2012 to date, down slightly from its 35.5% share in 2011.
Energy, Mining & Utilities was the most active sector in Q1-Q3 2012 with US$ 117bn-worth of deals, accounting for 22.9% of US M&A in Q1-Q3 2012. Industrials & Chemicals was down 51.9% from the comparable period in 2011 with US$ 60.3bn in deals in 2012 compared to US$ 125.5bn in Q1-Q3 2011.
Four of the top ten deals in the fi rst three quarters of 2012 were in the Energy, Mining & Utili-ties sector, which continued to dominate. They included the US’s second largest 2012 deal so far, ConocoPhillips spinning off its downstream operations valued at US$ 20.8bn. The remain-ing Energy, Mining & Utilities transactions were all valued above US$ 5bn.
US inbound cross-border deals amounted to US$ 44.4bn in Q3, the second highest quarterly total since Q4 2010 (US$ 63bn). US outbound cross-border deals totalled US$ 29.7bn, down 51.5% from the previous quarter (US$ 61.3bn), and down 43.3% from the same period last year (US$ 52.4bn).
Skadden Arps Slate Meagher & Flom topped the legal advisory ranking by total deal value, up four spots from last year. Latham & Watkins came in at second, also up four spots from last year. Both fi rms had signifi cant declines in deal value from the comparable period last year. Simpson Thacher & Bartlett dropped from the top spot in 2011 to third for 2012.
US M&A Overview
0
25
50
75
100
125
150
175
200
225
250
275
300
325
0
10
20
30
40
50
60
70
80
90
100
110
120
130
140
Volu
me
of D
eals
Valu
e of
Dea
ls (U
S$bn
)
US Inbound/Outbound M&A
Inbound Value (US$bn) Outbound Value (US$bn) Inbound Volume Outbound Volume
Press Release: mergermarket M&A Round-up for Q1-Q3 2012 29 www.mergermarket.com

Americas M&A Heat Chart
Hot Warm Cold
600 100 20
400 60 10
300 30 0
Note: The Intelligence Heat Chart are based on “companies for sale” tracked by mergermarket in the respective regions between 12 March 2012 and 11 September 2012. Opportunities are captured according to the dominant geography and sector of the potential target company. mergermarket’s Heat Chart of predicted deal flow is based on the intelligence collected in our database relating to companies rumoured to be for sale, or officially up for sale in the respective regions. It is therefore indicative of areas that are likely to be active in the months to come. The intelligence comes from a range of sources, including press reports, company statements and our own team of journalists gathering proprietary intelligence from M&A across the regions. The data does not differentiate between small and large transactions, nor between deals that could happen in the short or long-term.
In the US, it is hoped that the Federal Reserve’s QE3 launch will give the currently sluggish economic recovery a much needed boost.
• TMT is seen as the hottest sector based on the “Companies for sale” activity. Social collaboration, mobile and data analytics continue to pave the way for more activity in technology; print media has been revived in light of an increased interest in regional papers; and telecom deals will remain on the rise in light of heightened Internet traffi c driving activity in fi ber to wireless towers.
• The Pharma, Medical & Biotech sector comes second with the healthcare sector expected to continue its consolidation as the Affordable Care Act (ACA) was upheld by the US Supreme Court in June 2012.
• The Energy space is also seeing solid levels of activity due to low natural gas prices, the high price of crude oil and weak electricity prices.
South American focus is expected to be on the Energy, Mining & Utilities sector fed by Asia’s growing need for a variety of resources.
©2012 Google - Map data © 2012 Google
Sector USA Canada Brazil South America
(excl. Brazil)
Central America
North America
(excl. USA & Canada)
Total
TMT 1,112 67 47 26 25 1 1,278
Pharma, Medical & Biotech 622 28 14 7 10 1 682
Business Services 444 25 30 16 12 1 528
Energy, Mining & Utilities 443 288 86 91 31 8 947
Consumer 417 23 62 35 32 3 572
Industrials & Chemicals 357 27 35 20 34 0 473
Financial Services 310 2 29 28 31 9 409
Leisure 206 9 12 6 10 3 246
Transportation 93 7 26 14 26 1 167
Defence 69 2 0 0 71
Real Estate 46 3 11 2 5 0 67
Agriculture 32 2 6 8 2 0 50
Construction 18 7 13 10 23 0 71
Government 14 2 0 0 16
Other 2 3 0 1 0 6
Total 4,185 490 376 263 242 27 5,583
Press Release: mergermarket M&A Round-up for Q1-Q3 2012 30 www.mergermarket.com

US M&A Overview: Industry and Geography Breakdown
US (North East) 16.9%
US (Mid West) 14.3%
US (South) 25.5%
US (West) 20.0%
Canada 10.0%
Central & South America 13.2%
Mix of Announced Americas Deals by Geographic Region Q1-Q3 2012 - Volume
US (North East) 15.3%
US (Mid West) 15.4%
US (South) 28.8%
US (West) 16.7%
Canada 11.9%
Central & South America 12.0%
Mix of Announced Americas Deals by Geographic Region Q1-Q3 2012 - Value
Q1-Q3 2012 Q1-Q3 2011 Change
Sector Value (US$bn) Market share Deal count Value (US$bn) Market share Deal count Value (%) Deal Count
Energy, Mining & Utilities 117.0 22.9% 220 160.7 25.6% 206 -27.2% 14
Consumer 71.2 13.9% 259 18.8 3.0% 267 279.6% -8
Pharma, Medical & Biotech 70.8 13.8% 295 94.6 15.1% 349 -25.2% -54
Industrials & Chemicals 60.3 11.8% 444 125.5 20.0% 488 -51.9% -44
Technology 45.5 8.9% 398 62.8 10.0% 431 -27.6% -33
Business Services 33.0 6.4% 308 42.5 6.8% 380 -22.4% -72
Financial Services 30.5 6.0% 232 37.4 6.0% 296 -18.5% -64
Real Estate 23.9 4.7% 29 34.5 5.49% 21 -30.7% 8
Leisure 16.6 3.2% 87 10.8 1.7% 86 54.4% 1
Media 15.0 2.9% 97 12.3 2.0% 86 22.2% 11
Telecommunications 13.6 2.7% 21 16.5 2.6% 26 -17.2% -5
Transport 6.6 1.3% 55 3.2 0.5% 50 108.9% 5
Defence 5.0 1.0% 18 5.3 0.8% 15 -5.4% 3
Construction 2.6 0.5% 57 3.9 0.6% 72 -32.2% -15
Agriculture 0.4 0.1% 11 0.1 0.0% 10 360.5% 1
Total 512.1 2,531 628.8 2,783 -18.6% -252
Press Release: mergermarket M&A Round-up for Q1-Q3 2012 31 www.mergermarket.com

US M&A Overview: Top DealsTop 10 Announced Deals for Q1-Q3 2012
Announced Date
Bidder Company Bidder Legal Adviser Target Company Target/Seller Legal Adviser Seller Company Deal Value (US$m)
14-Aug-12 Kraft Foods Inc (shareholders) Kraft Foods Group Inc Clifford Chance; Cravath Swaine & Moore
Mondelez International Inc 26,294
04-Apr-12 Conocophillips Company (shareholders)
Phillips 66 Bracewell & Giuliani ConocoPhillips Company 20,790
23-Apr-12 Nestle SA A&L Goodbody; King & Wood Mallesons; Mayer Brown; White & Case
Pfizer Nutrition Baker & McKenzie; Clifford Chance; DLA Cliffe Dekker Hofmeyr; DLA Piper; Kirkland & Ellis (Advising Centerview Partners); Lee and Li Attorneys at Law; McCann FitzGerald; Skadden Arps Slate Meagher & Flom
Pfizer Inc 11,850
23-Jan-12 Lehman Brothers Holdings Inc Weil Gotshal & Manges Archstone-Smith Trust (26.5% Stake)
Cleary Gottlieb Steen & Hamilton; Kaye Scholer; Orrick Herrington & Sutcliffe; Simpson Thacher & Bartlett
Bank of America Corporation; and Barclays Plc
11,825
24-Feb-12 Apollo Global Management LLC; Riverstone Holdings LLC; Access Industries; and Korea National Oil Corporation
Debevoise & Plimpton; Kim & Chang; Paul Weiss Rifkind Wharton & Garrison; Vinson & Elkins; Willkie Farr & Gallagher
EP Energy Corporation Baker Botts; Bracewell & Giuliani; Locke Lord; Weil Gotshal & Manges
El Paso Corporation 7,150
30-Apr-12 Energy Transfer Partners LP Bingham McCutchen; Latham & Watkins; Vinson & Elkins; White & Case (Advising Wells Fargo Securities)
Sunoco Inc Alston & Bird (Advising Credit Suisse); Wachtell, Lipton, Rosen & Katz
6,959
25-Jan-12* Roche Holding Ltd Davis Polk & Wardwell; Gibson Dunn & Crutcher (Advising Citigroup); Shearman & Sterling (Advising Greenhill & Co)
Illumina Inc Dewey & LeBoeuf; Skadden Arps Slate Meagher & Flom (Advising Goldman Sachs)
6,846
18-Jul-12 BC Partners Limited; and Canada Pension Plan Investment Board
Latham & Watkins; Torys; Wachtell, Lipton, Rosen & Katz
Suddenlink Communications Fried Frank Harris Shriver & Jacobson; Paul Hastings; Seyfarth Shaw
GS Capital Partners; Oaktree Capital Group LLC; and Quadrangle Group
6,579
29-Jun-12 Bristol-Myers Squibb Company Covington & Burling; Davis Polk & Wardwell; Kirkland & Ellis; Richards Layton & Finger
Amylin Pharmaceuticals Inc Latham & Watkins (Advising Goldman Sachs); Shearman & Sterling (Advising Credit Suisse); Skadden Arps Slate Meagher & Flom
6,349
06-Aug-12 Kinder Morgan Energy Partners LP
Baker Botts El Paso Natural Gas Company (50% Stake); and Tennessee Gas Pipeline Company LLC
Bracewell & Giuliani Kinder Morgan Inc 6,220
* Lapsed Deals
Press Release: mergermarket M&A Round-up for Q1-Q3 2012 32 www.mergermarket.com

Americas: League Tables of Legal AdvisersLeague Table of Legal Advisers to Americas M&A: Volume
Ranking Q1-Q3 2012 Q1-Q3 2011Q1-Q3 2011
Q1-Q3 2012 Company Name
Value (US$m)
Deal Count
Deal Count
Count Change
1 1 Kirkland & Ellis 86,775 178 183 -53 2 Jones Day 76,733 173 167 62 3 Latham & Watkins 109,854 156 178 -225 4 DLA Piper 25,430 124 135 -114 5 Skadden Arps Slate Meagher &
Flom 165,771 116 136 -20
9 6 Weil Gotshal & Manges 77,027 95 89 66 7 Simpson Thacher & Bartlett 99,431 78 104 -2611 8 Sullivan & Cromwell 97,477 74 87 -1320 9 Stikeman Elliott 48,388 73 70 335 10 Vinson & Elkins 46,945 73 52 2115 11 Blake, Cassels & Graydon 64,061 70 77 -721 12 Morgan Lewis & Bockius 9,831 69 68 113 13 Davis Polk & Wardwell 101,095 67 82 -1550 14 White & Case 59,893 67 41 2612 15 Baker & McKenzie 26,326 67 83 -1648 16 Morrison & Foerster 40,409 63 42 2130 17 Greenberg Traurig 39,399 61 56 514 18 Shearman & Sterling 61,880 58 79 -2129 19 Paul Hastings 10,954 57 58 -138 20 Linklaters 44,411 56 49 7
League Table of Legal Advisers to Americas M&A: ValueRanking Q1-Q3 2012 Q1-Q3 2011
Q1-Q3 2011
Q1-Q3 2012 Company Name
Value (US$m)
Deal Count
Value (US$m)
% Val. Change
4 1 Skadden Arps Slate Meagher & Flom
165,771 116 214,201 -22.6%
8 2 Latham & Watkins 109,854 156 159,452 -31.1%11 3 Davis Polk & Wardwell 101,095 67 103,425 -2.3%33 4 Clifford Chance 100,964 47 38,405 162.9%2 5 Simpson Thacher & Bartlett 99,431 78 261,445 -62.0%1 6 Sullivan & Cromwell 97,477 74 267,320 -63.5%9 7 Cleary Gottlieb Steen & Hamilton 89,194 49 149,878 -40.5%3 8 Wachtell, Lipton, Rosen & Katz 87,526 43 224,852 -61.1%18 9 Kirkland & Ellis 86,775 178 69,021 25.7%12 10 Weil Gotshal & Manges 77,027 95 100,552 -23.4%15 11 Jones Day 76,733 173 86,420 -11.2%6 12 Cravath Swaine & Moore 74,062 32 162,705 -54.5%16 13 Freshfields Bruckhaus Deringer 70,778 49 78,739 -10.1%21 14 Blake, Cassels & Graydon 64,061 70 65,962 -2.9%7 15 Shearman & Sterling 61,880 58 162,444 -61.9%30 16 White & Case 59,893 67 40,356 48.4%131 17 Bracewell & Giuliani 50,099 27 4,793 945.3%29 18 Stikeman Elliott 48,388 73 40,638 19.1%38 19 Vinson & Elkins 46,945 73 31,722 48.0%10 20 Linklaters 44,411 56 103,651 -57.2%
Press Release: mergermarket M&A Round-up for Q1-Q3 2012 33 www.mergermarket.com

Americas: League Tables of Legal AdvisersLeague Table of Legal Advisers to US M&A: Volume
Ranking Q1-Q3 2012 Q1-Q3 2011Q1-Q3 2011
Q1-Q3 2012 Company Name
Value (US$m)
Deal Count
Deal Count
Count Change
1 1 Kirkland & Ellis 86,729 177 182 -53 2 Jones Day 70,042 164 156 82 3 Latham & Watkins 108,754 153 170 -174 4 DLA Piper 25,193 119 135 -165 5 Skadden Arps Slate Meagher &
Flom 132,374 97 126 -29
10 6 Weil Gotshal & Manges 76,450 92 85 76 7 Simpson Thacher & Bartlett 92,929 73 101 -2830 8 Vinson & Elkins 46,402 71 52 1918 9 Morgan Lewis & Bockius 9,823 67 67 011 10 Sullivan & Cromwell 66,129 66 83 -1712 11 Davis Polk & Wardwell 80,481 63 76 -1347 12 White & Case 57,434 61 38 2346 13 Morrison & Foerster 22,340 61 40 2125 14 Greenberg Traurig 18,779 58 55 317 15 Baker & McKenzie 22,006 57 69 -1224 16 Paul Hastings 10,954 57 57 09 17 Wilson Sonsini Goodrich & Rosati 11,035 52 87 -3533 18 Mayer Brown 18,814 51 48 37 19 Hogan Lovells 15,113 51 91 -4013 20 Goodwin Procter 7,872 50 74 -24
League Table of Legal Advisers to US M&A: ValueRanking Q1-Q3 2012 Q1-Q3 2011
Q1-Q3 2011
Q1-Q3 2012 Company Name
Value (US$m)
Deal Count
Value (US$m)
% Val. Change
5 1 Skadden Arps Slate Meagher & Flom
132,374 97 196,746 -32.7%
6 2 Latham & Watkins 108,754 153 157,128 -30.8%1 3 Simpson Thacher & Bartlett 92,929 73 257,987 -64.0%17 4 Kirkland & Ellis 86,729 177 67,653 28.2%3 5 Wachtell, Lipton, Rosen & Katz 86,583 42 223,895 -61.3%11 6 Davis Polk & Wardwell 80,481 63 94,345 -14.7%12 7 Weil Gotshal & Manges 76,450 92 93,497 -18.2%41 8 Clifford Chance 71,160 37 29,648 140.0%15 9 Jones Day 70,042 164 83,373 -16.0%2 10 Sullivan & Cromwell 66,129 66 248,894 -73.4%9 11 Cleary Gottlieb Steen & Hamilton 62,755 41 141,284 -55.6%28 12 White & Case 57,434 61 39,169 46.6%8 13 Cravath Swaine & Moore 53,192 29 148,814 -64.3%
109 14 Bracewell & Giuliani 50,099 27 4,793 945.3%7 15 Shearman & Sterling 49,536 48 150,228 -67.0%37 16 Vinson & Elkins 46,402 71 31,722 46.3%13 17 Gibson Dunn & Crutcher 43,114 45 92,741 -53.5%16 18 Freshfields Bruckhaus Deringer 41,001 44 70,121 -41.5%14 19 Fried Frank Harris Shriver & Jacobson 35,644 38 88,693 -59.8%30 20 Debevoise & Plimpton 30,247 38 38,316 -21.1%
Press Release: mergermarket M&A Round-up for Q1-Q3 2012 34 www.mergermarket.com

Americas: League Tables of Legal AdvisersLeague Table of Legal Advisers to US Buyouts* M&A: Volume
Ranking Q1-Q3 2012 Q1-Q3 2011Q1-Q3 2011
Q1-Q3 2012 Company Name
Value (US$m)
Deal Count
Deal Count
Count Change
1 1 Kirkland & Ellis 6,841 56 64 -82 2 Latham & Watkins 23,635 22 21 13 3 Jones Day 3,233 20 19 14 4 Simpson Thacher & Bartlett 12,352 18 18 05 5 Weil Gotshal & Manges 7,508 15 18 -320 6 Vinson & Elkins 9,761 12 6 613 7 McDermott Will & Emery 275 12 8 48 8 Paul Weiss Rifkind Wharton & Garrison 7,581 10 10 015 9 Debevoise & Plimpton 16,963 9 7 230 10 Willkie Farr & Gallagher 10,710 8 4 414 11 Paul Hastings 380 8 8 07 12 Ropes & Gray 178 8 12 -410 13 King & Spalding - 8 9 -117 14 Skadden Arps Slate Meagher & Flom 1,306 7 6 111 15 Fried Frank Harris Shriver & Jacobson 1,575 6 9 -329 16 Winston & Strawn 374 6 4 219 17 DLA Piper 30 6 6 026 18 Sullivan & Cromwell 2,712 5 4 123 19 Alston & Bird 2,175 5 5 018 20 Dechert 510 5 6 -1
League Table of Legal Advisers to US Buyouts* M&A: ValueRanking Q1-Q3 2012 Q1-Q3 2011
Q1-Q3 2011
Q1-Q3 2012 Company Name
Value (US$m)
Deal Count
Value (US$m)
% Val. Change
8 1 Latham & Watkins 23,635 22 7,466 216.6%7 2 Debevoise & Plimpton 16,963 9 8,494 99.7%1 3 Simpson Thacher & Bartlett 12,352 18 25,814 -52.1%63 4 Willkie Farr & Gallagher 10,710 8 154 6,855%68 5 Vinson & Elkins 9,761 12 134 7,184%18 6 Wachtell, Lipton, Rosen & Katz 7,745 3 2625 195.0%19 7 Paul Weiss Rifkind Wharton & Garrison 7,581 10 2467 207.3%3 8 Weil Gotshal & Manges 7,508 15 12,021 -37.5%2 9 Kirkland & Ellis 6,841 56 14,130 -51.6%11 10 Torys 6,579 1 5,663 16.2%- 11 Veirano Advogados 4,900 1 - -
14 12 Davis Polk & Wardwell 4,066 4 4,220 -3.6%13 13 Jones Day 3,233 20 4,662 -30.7%28 14 Cleary Gottlieb Steen & Hamilton 3,000 2 1,250 140.0%36 15 Sullivan & Cromwell 2,712 5 624 334.6%80 16 Alston & Bird 2,175 5 28 7,668%17 17 Fried Frank Harris Shriver & Jacobson 1,575 6 2,902 -45.7%- 18 Greenberg Traurig 1,550 4 - -
82 19 Akin Gump Strauss Hauer & Feld 1,449 3 22 6,486%15 20 Skadden Arps Slate Meagher & Flom 1,306 7 3,255 -59.9%
* Based on the target geography only and the adviser advising the buy-side only
Press Release: mergermarket M&A Round-up for Q1-Q3 2012 35 www.mergermarket.com
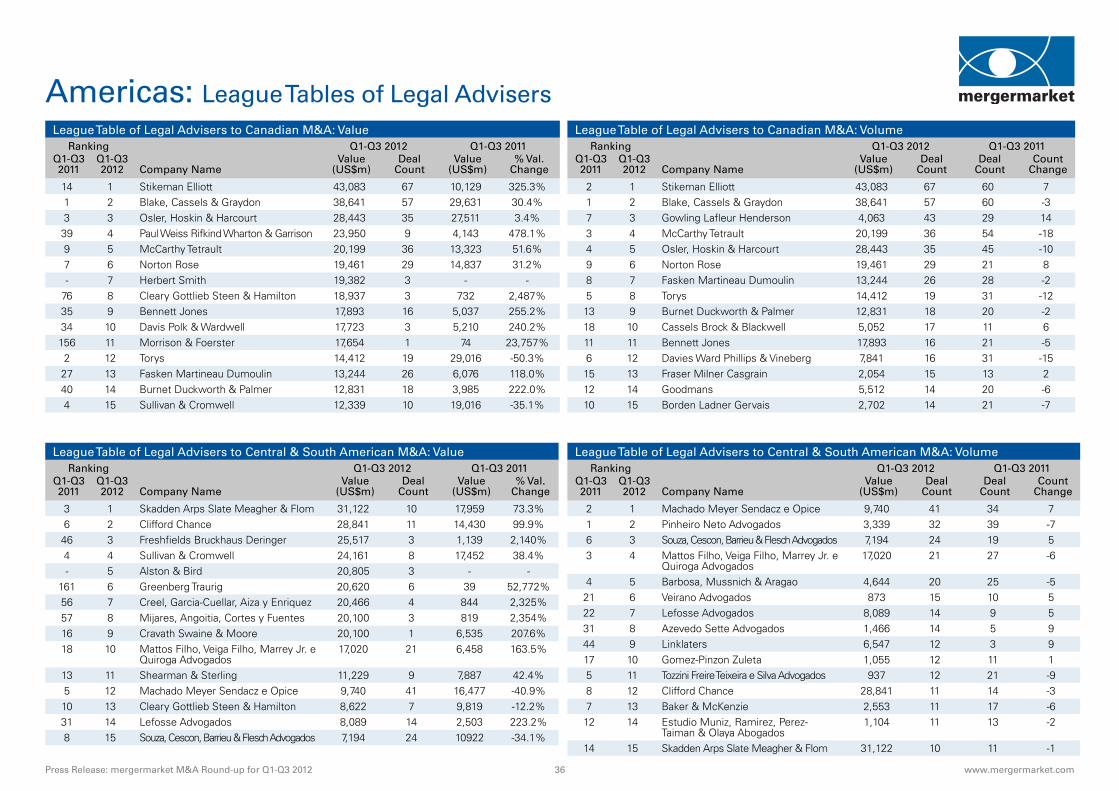
Americas: League Tables of Legal Advisers
League Table of Legal Advisers to Central & South American M&A: VolumeRanking Q1-Q3 2012 Q1-Q3 2011
Q1-Q3 2011
Q1-Q3 2012 Company Name
Value (US$m)
Deal Count
Deal Count
Count Change
2 1 Machado Meyer Sendacz e Opice 9,740 41 34 71 2 Pinheiro Neto Advogados 3,339 32 39 -76 3 Souza, Cescon, Barrieu & Flesch Advogados 7,194 24 19 53 4 Mattos Filho, Veiga Filho, Marrey Jr. e
Quiroga Advogados17,020 21 27 -6
4 5 Barbosa, Mussnich & Aragao 4,644 20 25 -521 6 Veirano Advogados 873 15 10 522 7 Lefosse Advogados 8,089 14 9 531 8 Azevedo Sette Advogados 1,466 14 5 944 9 Linklaters 6,547 12 3 917 10 Gomez-Pinzon Zuleta 1,055 12 11 15 11 Tozzini Freire Teixeira e Silva Advogados 937 12 21 -98 12 Clifford Chance 28,841 11 14 -37 13 Baker & McKenzie 2,553 11 17 -612 14 Estudio Muniz, Ramirez, Perez-
Taiman & Olaya Abogados1,104 11 13 -2
14 15 Skadden Arps Slate Meagher & Flom 31,122 10 11 -1
League Table of Legal Advisers to Central & South American M&A: ValueRanking Q1-Q3 2012 Q1-Q3 2011
Q1-Q3 2011
Q1-Q3 2012 Company Name
Value (US$m)
Deal Count
Value (US$m)
% Val. Change
3 1 Skadden Arps Slate Meagher & Flom 31,122 10 17,959 73.3%6 2 Clifford Chance 28,841 11 14,430 99.9%46 3 Freshfields Bruckhaus Deringer 25,517 3 1,139 2,140%4 4 Sullivan & Cromwell 24,161 8 17,452 38.4%- 5 Alston & Bird 20,805 3 - -
161 6 Greenberg Traurig 20,620 6 39 52,772%56 7 Creel, Garcia-Cuellar, Aiza y Enriquez 20,466 4 844 2,325%57 8 Mijares, Angoitia, Cortes y Fuentes 20,100 3 819 2,354%16 9 Cravath Swaine & Moore 20,100 1 6,535 207.6%18 10 Mattos Filho, Veiga Filho, Marrey Jr. e
Quiroga Advogados17,020 21 6,458 163.5%
13 11 Shearman & Sterling 11,229 9 7,887 42.4%5 12 Machado Meyer Sendacz e Opice 9,740 41 16,477 -40.9%10 13 Cleary Gottlieb Steen & Hamilton 8,622 7 9,819 -12.2%31 14 Lefosse Advogados 8,089 14 2,503 223.2%8 15 Souza, Cescon, Barrieu & Flesch Advogados 7,194 24 10922 -34.1%
League Table of Legal Advisers to Canadian M&A: VolumeRanking Q1-Q3 2012 Q1-Q3 2011
Q1-Q3 2011
Q1-Q3 2012 Company Name
Value (US$m)
Deal Count
Deal Count
Count Change
2 1 Stikeman Elliott 43,083 67 60 71 2 Blake, Cassels & Graydon 38,641 57 60 -37 3 Gowling Lafleur Henderson 4,063 43 29 143 4 McCarthy Tetrault 20,199 36 54 -184 5 Osler, Hoskin & Harcourt 28,443 35 45 -109 6 Norton Rose 19,461 29 21 88 7 Fasken Martineau Dumoulin 13,244 26 28 -25 8 Torys 14,412 19 31 -1213 9 Burnet Duckworth & Palmer 12,831 18 20 -218 10 Cassels Brock & Blackwell 5,052 17 11 611 11 Bennett Jones 17,893 16 21 -56 12 Davies Ward Phillips & Vineberg 7,841 16 31 -1515 13 Fraser Milner Casgrain 2,054 15 13 212 14 Goodmans 5,512 14 20 -610 15 Borden Ladner Gervais 2,702 14 21 -7
League Table of Legal Advisers to Canadian M&A: ValueRanking Q1-Q3 2012 Q1-Q3 2011
Q1-Q3 2011
Q1-Q3 2012 Company Name
Value (US$m)
Deal Count
Value (US$m)
% Val. Change
14 1 Stikeman Elliott 43,083 67 10,129 325.3%1 2 Blake, Cassels & Graydon 38,641 57 29,631 30.4%3 3 Osler, Hoskin & Harcourt 28,443 35 27,511 3.4%39 4 Paul Weiss Rifkind Wharton & Garrison 23,950 9 4,143 478.1%9 5 McCarthy Tetrault 20,199 36 13,323 51.6%7 6 Norton Rose 19,461 29 14,837 31.2%- 7 Herbert Smith 19,382 3 - -
76 8 Cleary Gottlieb Steen & Hamilton 18,937 3 732 2,487%35 9 Bennett Jones 17,893 16 5,037 255.2%34 10 Davis Polk & Wardwell 17,723 3 5,210 240.2%156 11 Morrison & Foerster 17,654 1 74 23,757%2 12 Torys 14,412 19 29,016 -50.3%27 13 Fasken Martineau Dumoulin 13,244 26 6,076 118.0%40 14 Burnet Duckworth & Palmer 12,831 18 3,985 222.0%4 15 Sullivan & Cromwell 12,339 10 19,016 -35.1%
Press Release: mergermarket M&A Round-up for Q1-Q3 2012 36 www.mergermarket.com

Americas: League Tables of Legal Advisers
League Table of Legal Advisers to US (Mid-West) M&A: VolumeRanking Q1-Q3 2012 Q1-Q3 2011
Q1-Q3 2011
Q1-Q3 2012 Company Name
Value (US$m)
Deal Count
Deal Count
Count Change
2 1 Jones Day 24,746 64 52 121 2 Kirkland & Ellis 18,934 61 67 -63 3 Latham & Watkins 26,129 34 39 -57 4 DLA Piper 929 32 25 715 5 Weil Gotshal & Manges 17,180 26 20 65 6 Sidley Austin 8,112 23 32 -99 7 McDermott Will & Emery 7,452 22 22 011 8 Paul Hastings 1,507 21 22 -14 9 Skadden Arps Slate Meagher & Flom 30,318 20 35 -1510 10 Mayer Brown 3,061 19 22 -335 11 Morgan Lewis & Bockius 1,991 19 11 814 12 Simpson Thacher & Bartlett 35,688 17 20 -319 13 Sullivan & Cromwell 11,626 17 15 28 14 Baker & McKenzie 5,901 17 23 -645 15 Blake, Cassels & Graydon 19,018 15 8 7
League Table of Legal Advisers to US (Mid-West) M&A: ValueRanking Q1-Q3 2012 Q1-Q3 2011
Q1-Q3 2011
Q1-Q3 2012 Company Name
Value (US$m)
Deal Count
Value (US$m)
% Val. Change
1 1 Simpson Thacher & Bartlett 35,688 17 87,142 -59.0%4 2 Cravath Swaine & Moore 34,581 8 67,205 -48.5%77 3 Clifford Chance 33,769 7 882 3,729%2 4 Skadden Arps Slate Meagher & Flom 30,318 20 81,404 -62.8%16 5 Cleary Gottlieb Steen & Hamilton 28,136 9 20,314 38.5%8 6 Latham & Watkins 26,129 34 46,219 -43.5%5 7 Wachtell, Lipton, Rosen & Katz 26,104 10 61,860 -57.8%13 8 Jones Day 24,746 64 27,760 -10.9%10 9 Davis Polk & Wardwell 21,400 11 32,695 -34.5%34 10 Blake, Cassels & Graydon 19,018 15 6,339 200.0%12 11 Kirkland & Ellis 18,934 61 27,801 -31.9%11 12 Weil Gotshal & Manges 17,180 26 30,419 -43.5%27 13 Slaughter and May 12,907 3 9,932 30.0%- 14 Kinstellar 12,220 2 - -
198 15 Arthur Cox 11,940 2 83 14,286%
League Table of Legal Advisers to US (North East) M&A: VolumeRanking Q1-Q3 2012 Q1-Q3 2011
Q1-Q3 2011
Q1-Q3 2012 Company Name
Value (US$m)
Deal Count
Deal Count
Count Change
1 1 Kirkland & Ellis 50,203 102 88 142 2 Latham & Watkins 57,017 80 73 74 3 Jones Day 39,079 80 72 86 4 Weil Gotshal & Manges 43,686 62 56 63 5 Simpson Thacher & Bartlett 57,701 53 72 -195 6 Skadden Arps Slate Meagher & Flom 65,230 51 56 -511 7 Morgan Lewis & Bockius 7,760 41 39 218 8 DLA Piper 14,823 40 34 69 9 Sullivan & Cromwell 30,856 36 42 -640 10 White & Case 43,724 33 19 1410 11 Davis Polk & Wardwell 31,151 31 41 -1016 12 Paul Weiss Rifkind Wharton & Garrison 14,764 31 35 -412 13 Ropes & Gray 11,615 30 39 -97 14 Goodwin Procter 5,407 29 53 -2432 15 Debevoise & Plimpton 22,988 28 22 6
League Table of Legal Advisers to US (North East) M&A: ValueRanking Q1-Q3 2012 Q1-Q3 2011
Q1-Q3 2011
Q1-Q3 2012 Company Name
Value (US$m)
Deal Count
Value (US$m)
% Val. Change
5 1 Skadden Arps Slate Meagher & Flom 65,230 51 88,409 -26.2%1 2 Simpson Thacher & Bartlett 57,701 53 134,499 -57.1%16 3 Latham & Watkins 57,017 80 34,719 64.2%17 4 Kirkland & Ellis 50,203 102 30,873 62.6%27 5 White & Case 43,724 33 19,992 118.7%8 6 Weil Gotshal & Manges 43,686 62 59,774 -26.9%12 7 Jones Day 39,079 80 42,347 -7.7%7 8 Wachtell, Lipton, Rosen & Katz 36,769 16 77,751 -52.7%13 9 Davis Polk & Wardwell 31,151 31 41,533 -25.0%3 10 Sullivan & Cromwell 30,856 36 93,922 -67.1%93 11 Vinson & Elkins 25,962 27 2,939 783.4%9 12 Shearman & Sterling 23,272 23 55,683 -58.2%11 13 Cleary Gottlieb Steen & Hamilton 23,020 15 52,473 -56.1%18 14 Debevoise & Plimpton 22,988 28 30,380 -24.3%50 15 Clifford Chance 18,737 19 10,455 79.2%
Press Release: mergermarket M&A Round-up for Q1-Q3 2012 37 www.mergermarket.com

Americas: League Tables of Legal Advisers
League Table of Legal Advisers to US (West) M&A: VolumeRanking Q1-Q3 2012 Q1-Q3 2011
Q1-Q3 2011
Q1-Q3 2012 Company Name
Value (US$m)
Deal Count
Deal Count
Count Change
1 1 Latham & Watkins 37,658 73 79 -63 2 Kirkland & Ellis 30,858 65 69 -45 3 Jones Day 20,234 52 49 34 4 Wilson Sonsini Goodrich & Rosati 10,719 46 69 -2315 5 Morrison & Foerster 18,965 45 27 182 6 DLA Piper 6,409 45 71 -268 7 Skadden Arps Slate Meagher & Flom 58,295 44 39 5
24 8 Davis Polk & Wardwell 35,160 34 21 137 9 Fenwick & West 15,911 33 45 -1220 10 Paul Hastings 3,031 31 23 822 11 Weil Gotshal & Manges 34,810 28 22 66 12 Gibson Dunn & Crutcher 24,507 26 45 -1914 13 Shearman & Sterling 36,067 25 27 -232 14 Morgan Lewis & Bockius 2,339 25 15 1013 15 Goodwin Procter 2,441 24 28 -4
League Table of Legal Advisers to US (West) M&A: ValueRanking Q1-Q3 2012 Q1-Q3 2011
Q1-Q3 2011
Q1-Q3 2012 Company Name
Value (US$m)
Deal Count
Value (US$m)
% Val. Change
9 1 Skadden Arps Slate Meagher & Flom 58,295 44 38,195 52.6%10 2 Latham & Watkins 37,658 73 36,368 3.5%2 3 Simpson Thacher & Bartlett 36,118 21 71,494 -49.5%3 4 Shearman & Sterling 36,067 25 68,716 -47.5%7 5 Davis Polk & Wardwell 35,160 34 39,580 -11.2%37 6 Weil Gotshal & Manges 34,810 28 8,385 315.1%24 7 Kirkland & Ellis 30,858 65 14,494 112.9%11 8 Gibson Dunn & Crutcher 24,507 26 34,949 -29.9%5 9 Cleary Gottlieb Steen & Hamilton 21,643 20 60,414 -64.2%16 10 Jones Day 20,234 52 20,970 -4%4 11 Sullivan & Cromwell 19,131 22 63,080 -69.7%17 12 Morrison & Foerster 18,965 45 19,955 -5.0%39 13 Fenwick & West 15,911 33 5,664 180.9%48 14 Kaye Scholer 15,898 6 4,181 280.2%20 15 White & Case 15,584 18 16,605 -6.1%
League Table of Legal Advisers to US (South) M&A: VolumeRanking Q1-Q3 2012 Q1-Q3 2011
Q1-Q3 2011
Q1-Q3 2012 Company Name
Value (US$m)
Deal Count
Deal Count
Count Change
2 1 Kirkland & Ellis 37,047 87 66 215 2 Vinson & Elkins 42,473 65 46 194 3 Jones Day 28,608 61 53 81 4 Latham & Watkins 46,287 57 69 -123 5 DLA Piper 9,019 48 60 -1213 6 Weil Gotshal & Manges 26,177 37 32 511 7 Fulbright and Jaworski 10,172 36 36 029 8 Baker Botts 26,633 35 23 1216 9 Greenberg Traurig 12,838 30 30 06 10 Skadden Arps Slate Meagher & Flom 37,678 29 44 -1510 11 King & Spalding 6,531 27 36 -912 12 Morgan Lewis & Bockius 2,154 26 33 -744 13 Bracewell & Giuliani 49,285 25 15 108 14 Hogan Lovells 7,514 25 38 -1357 15 White & Case 24,606 24 11 13
League Table of Legal Advisers to US (South) M&A: ValueRanking Q1-Q3 2012 Q1-Q3 2011
Q1-Q3 2011
Q1-Q3 2012 Company Name
Value (US$m)
Deal Count
Value (US$m)
% Val. Change
63 1 Bracewell & Giuliani 49,285 25 4,793 928.3%4 2 Latham & Watkins 46,287 57 99,617 -53.5%17 3 Vinson & Elkins 42,473 65 30,727 38.2%2 4 Wachtell, Lipton, Rosen & Katz 40,377 22 135,916 -70.3%7 5 Skadden Arps Slate Meagher & Flom 37,678 29 70,752 -46.7%18 6 Kirkland & Ellis 37,047 87 30,379 21.9%1 7 Sullivan & Cromwell 31,561 23 147,099 -78.5%24 8 Davis Polk & Wardwell 29,937 20 20,619 45.2%12 9 Jones Day 28,608 61 42,496 -32.7%10 10 Baker Botts 26,633 35 55,250 -51.8%15 11 Weil Gotshal & Manges 26,177 37 36,760 -28.8%43 12 Debevoise & Plimpton 25,592 20 8,707 193.9%69 13 White & Case 24,606 24 3,997 515.6%9 14 Fried Frank Harris Shriver & Jacobson 23,090 15 56,214 -58.9%3 15 Simpson Thacher & Bartlett 22,021 24 114,260 -80.7%
Press Release: mergermarket M&A Round-up for Q1-Q3 2012 38 www.mergermarket.com

• Asia-Pacifi c (excluding Japan) M&A YTD saw US$ 246.3bn in deals, down 13.2%
• Total deal value in Q3 2012 up 16.6% quarter-on-quarter to US$ 89.5bn • Indonesia Q1-Q3 2012 M&A total US$ 12.3bn, up 185.3% on Q1-Q3 2011 • M&A deal fl ow in South Korea and Australia down 47% and 43.9% respec-
tively
Asia-Pacifi c (excluding Japan) M&A in the fi rst three quarters of the year added up to US$ 246.3bn-worth of deals, 13.2% off Q1-Q3 2011’s total (US$ 283.9bn). However, Asia-Pacifi c’s Q3 2012 total deal value of US$ 89.5bn was up 16.6% on Q2 2012 (US$ 76.8bn) and was the largest quarterly total since Q3 2011 which saw US$ 115.8bn.
South Korea saw the largest year-on-year decline of the major economies in Asia-Pacifi c, with US$ 16.5bn-worth of M&A in Q1-Q3 2012, down 47% from Q1-Q3 2011 (US$ 31.2bn). Deal totals in Australia plummeted 43.9% from US$ 62.9bn in Q1-Q3 2011 to US$ 35.3bn in Q1-Q3 2012. Malaysia, in spite of two blockbuster IPOs in 2012, saw a 28.2% drop in overall deal value from US$ 13.2bn in 2011 to US$ 9.5bn. India was roughly at the same level at US$ 28bn.
Indonesia bucked the general downward trend. Its Q1-Q3 2012 M&A total of US$ 12.3bn was up 185.3% on Q1-Q3 2011 (US$ 4.3bn). Singapore also experienced a robust increase of 152.2% in deal value, from US$ 9.8bn in Q1-Q3 2011 to US$ 24.6bn in Q1-Q3 2012. China saw a modest increase of 9% to US$ 91bn compared to 2011.
Asia-Pacifi c (ex Japan) inbound cross-border deals added up to US$ 27.5bn in Q3 2012, up 154.6% from the previous quarter (US$10.8bn) and down 28.2% from the same period last year (US$ 38.3bn). The region’s outbound cross-border total deal value was US$ 29.8bn in Q3, up 34.2% from the previous quarter (US$ 22.2bn) and down 25.3% from the same period last year (US$ 39.9bn).
Freshfi elds Bruckhaus Deringer jumped 6 places compared to the same period last year, and became the leading legal adviser in Asia Pacifi c, having advised on US$ 29.2bn-worth of deals. The top three fi rms from the last year all fell out of the top 20 places this year.
Asia-Pacifi c (ex. Japan) M&A Overview
0
25
50
75
100
125
150
175
0
5
10
15
20
25
30
35
40
45
50
55
60
Volu
me
of D
eals
Valu
e of
Dea
ls (U
S$bn
)
Asia-Pacific (excl. Japan) Inbound/Outbound M&A
Inbound Value (US$bn) Outbound Value (US$bn) Inbound Volume Outbound Volume
Press Release: mergermarket M&A Round-up for Q1-Q3 2012 39 www.mergermarket.com

Asia-Pacifi c M&A Heat ChartSector Greater
ChinaAustral
-asiaSouth East Asia
South Asia
North Asia (excl.
Greater China)
Japan Central Asia
Total
Industrials & Chemicals 670 46 67 84 107 54 3 1,031
TMT 303 106 78 85 69 39 680
Consumer 248 94 62 71 42 57 1 575
Energy, Mining & Utilities 196 235 122 64 26 13 10 666
Pharma, Medical & Biotech 147 58 12 59 19 15 310
Financial Services 106 37 85 42 39 18 1 328
Business Services 71 68 33 58 14 36 280
Real Estate 93 30 50 10 8 14 205
Leisure 77 34 34 21 8 29 1 204
Construction 75 17 23 26 30 5 176
Agriculture 73 34 25 1 2 135
Transportation 42 21 43 43 9 17 1 176
Other 21 7 2 0 1 31
Government 2 0 2
Defence 2 3 5
Total 2,103 803 641 566 376 298 17 4,804
Hot Warm Cold
300 80 20
200 60 10
100 40 0
Greater China dominates the “Companies for sale” in Asia. In the global charts Greater China is second only to the US. In China along with the whole of North Asia, the Industrials & Chemicals sector is the main focus.
In Australia, Energy, Mining and Utilities continues to be the most buoyant sector given the resource needs of the rest of the world.
TMT ranks top in South Asia, not surprising given India’s skills in the sector as well as the increasing technological demands of its upcoming middle class. Southeast Asia’s Financial Services sector is getting increasing playtime as the region’s economy grows.
The focus in Japan is currently moving towards the Consumer sector on the heels of some private equity-related deals.
Note: The Intelligence Heat Chart are based on “companies for sale” tracked by mergermarket in the respective regions between 12 March 2012 and 11 September 2012. Opportunities are captured according to the dominant geography and sector of the potential target company. mergermarket’s Heat Chart of predicted deal flow is based on the intelligence collected in our database relating to companies rumoured to be for sale, or officially up for sale in the respective regions. It is therefore indicative of areas that are likely to be active in the months to come. The intelligence comes from a range of sources, including press reports, company statements and our own team of journalists gathering proprietary intelligence from M&A across the regions. The data does not differentiate between small and large transactions, nor between deals that could happen in the short or long-term.
©2012 Google - Map data © 2012 Google
Press Release: mergermarket M&A Round-up for Q1-Q3 2012 40 www.mergermarket.com

Asia-Pacifi c (ex. Japan) M&A Overview: Top DealsTop 10 Announced Deals for Q1-Q3 2012
Announced Date
Bidder Company Bidder Legal Adviser Target Company Target/Seller Legal Adviser Seller Company Deal Value (US$m)
22-Aug-12 China Telecom Corporation Limited
Freshfields Bruckhaus Deringer; Sullivan & Cromwell
China Telecommunication Corporation (certain CDMA Network assets)
China Telecommunications Corporation
13,307
25-Feb-12 Sesa Goa Limited Ashurst; Luthra & Luthra Law Offices (Advising Citigroup)
Sterlite Industries (India) Limited Amarchand & Mangaldas & Suresh A Shroff & Co; Skadden Arps Slate Meagher & Flom (Advising Bank of America Merrill Lynch)
10,289
13-Sep-12 TCC Group WongPartnership Fraser & Neave Limited (69.64% Stake)
Stamford Law 10,134
16-Mar-12 Investor Group Bank of Communications Ltd (16.67% Stake)
King & Wood Mallesons 8,944
02-Apr-12 DBS Group Holdings Ltd Baker & McKenzie; Shook Lin & Bok Singapore (Advising Credit Suisse; Morgan Stanley); WongPartnership
PT Bank Danamon Indonesia Tbk Allen & Gledhill; Makes & Partners
7,338
20-May-12 Alibaba Group Holding Ltd Fangda Partners; Fenwick & West; Freshfields Bruckhaus Deringer; Wachtell, Lipton, Rosen & Katz
Alibaba Group Holding Ltd (20% Stake)
Munger Tolles & Olson; O'Melveny & Myers (Advising UBS Investment Bank); Skadden Arps Slate Meagher & Flom; Weil Gotshal & Manges; White & Case (Advising Allen & Company)
Yahoo! Inc 7,100
20-Jul-12 Heineken NV Duane Morris & Selvam; Rodyk & Davidson
Asia Pacific Breweries Limited (58.1% Stake)
Allen & Gledhill; Loyens & Loeff; Stamford Law
6,593
23-Aug-12 Government of Japan; and Japan Bank for International Cooperation
Delhi Mumbai Industrial Corridor Development Corporation Limited (26% Stake)
4,500
06-Mar-12 Investor Group Industrial Bank Co Ltd (16.1% Stake)
4,181
20-Jul-12 Beijing Shougang Co Ltd Grandway Law Office Hebei Shougang Qian'an Iron and Steel Co Ltd
Shougang Group Corporation 4,168
Press Release: mergermarket M&A Round-up for Q1-Q3 2012 41 www.mergermarket.com
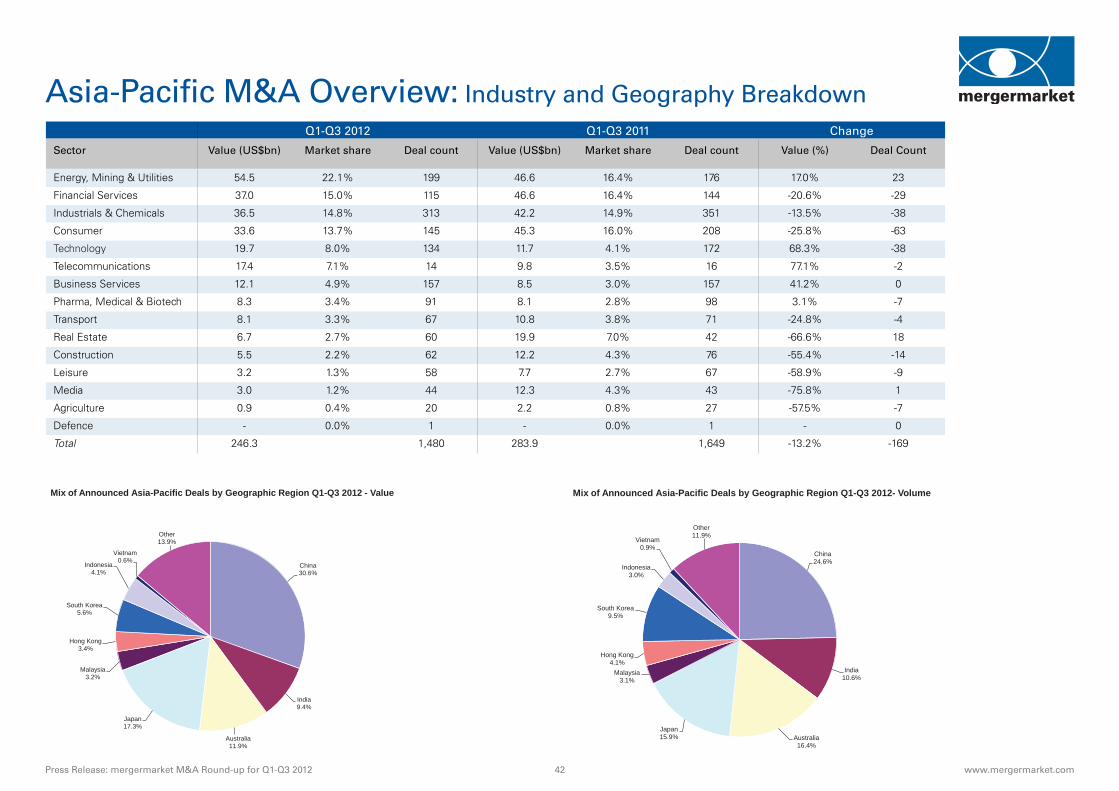
Asia-Pacifi c M&A Overview: Industry and Geography Breakdown
China 24.6%
India 10.6%
Australia 16.4%
Japan 15.9%
Malaysia 3.1%
Hong Kong 4.1%
South Korea 9.5%
Indonesia 3.0%
Vietnam 0.9%
Other 11.9%
Mix of Announced Asia-Pacific Deals by Geographic Region Q1-Q3 2012- Volume
China 30.6%
India 9.4%
Australia 11.9%
Japan 17.3%
Malaysia 3.2%
Hong Kong 3.4%
South Korea 5.6%
Indonesia 4.1%
Vietnam 0.6%
Other 13.9%
Mix of Announced Asia-Pacific Deals by Geographic Region Q1-Q3 2012 - Value
Q1-Q3 2012 Q1-Q3 2011 Change
Sector Value (US$bn) Market share Deal count Value (US$bn) Market share Deal count Value (%) Deal Count
Energy, Mining & Utilities 54.5 22.1% 199 46.6 16.4% 176 17.0% 23
Financial Services 37.0 15.0% 115 46.6 16.4% 144 -20.6% -29
Industrials & Chemicals 36.5 14.8% 313 42.2 14.9% 351 -13.5% -38
Consumer 33.6 13.7% 145 45.3 16.0% 208 -25.8% -63
Technology 19.7 8.0% 134 11.7 4.1% 172 68.3% -38
Telecommunications 17.4 7.1% 14 9.8 3.5% 16 77.1% -2
Business Services 12.1 4.9% 157 8.5 3.0% 157 41.2% 0
Pharma, Medical & Biotech 8.3 3.4% 91 8.1 2.8% 98 3.1% -7
Transport 8.1 3.3% 67 10.8 3.8% 71 -24.8% -4
Real Estate 6.7 2.7% 60 19.9 7.0% 42 -66.6% 18
Construction 5.5 2.2% 62 12.2 4.3% 76 -55.4% -14
Leisure 3.2 1.3% 58 7.7 2.7% 67 -58.9% -9
Media 3.0 1.2% 44 12.3 4.3% 43 -75.8% 1
Agriculture 0.9 0.4% 20 2.2 0.8% 27 -57.5% -7
Defence - 0.0% 1 - 0.0% 1 - 0
Total 246.3 1,480 283.9 1,649 -13.2% -169
Press Release: mergermarket M&A Round-up for Q1-Q3 2012 42 www.mergermarket.com

Asia-Pacifi c: League Tables of Legal AdvisersLeague Table of Legal Advisers to Asia-Pacifi c (ex. Japan) M&A: Volume
Ranking Q1-Q3 2012 Q1-Q3 2011Q1-Q3 2011
Q1-Q3 2012 Company Name
Value (US$m)
Deal Count
Deal Count
Count Change
4 1 King & Wood Mallesons 21,306 57 57 01 2 Baker & McKenzie 17,205 48 64 -163 3 Freehills 14,609 40 57 -179 4 Kim & Chang 7,454 40 41 -18 5 Clifford Chance 12,592 36 42 -626 6 Gilbert + Tobin 9,203 36 22 146 7 Allen & Overy 12,590 34 48 -1410 8 Lee & Ko 5,018 30 39 -92 9 Minter Ellison 3,066 30 62 -3211 10 Linklaters 18,114 29 38 -913 11 Desai & Diwanji 934 29 36 -77 12 Allens 8,016 28 44 -1618 13 Norton Rose 7,952 28 32 -424 14 Khaitan & Co 1,367 28 25 315 15 Clayton Utz 7,217 27 33 -632 16 Amarchand & Mangaldas & Suresh
A Shroff & Co15,612 26 18 8
5 17 Ashurst 10,275 26 50 -2412 18 DLA Piper 1,131 26 36 -1017 19 Allen & Gledhill 13,515 23 32 -921 20 WongPartnership 22,916 21 27 -6
League Table of Legal Advisers to Asia-Pacifi c (ex. Japan) M&A: ValueRanking Q1-Q3 2012 Q1-Q3 2011
Q1-Q3 2011
Q1-Q3 2012 Company Name
Value (US$m)
Deal Count
Value (US$m)
% Val. Change
7 1 Freshfields Bruckhaus Deringer 29,213 16 27,765 5.2%16 2 Skadden Arps Slate Meagher & Flom 23,295 20 20,026 16.3%50 3 WongPartnership 22,916 21 6,130 273.8%83 4 Paul Weiss Rifkind Wharton & Garrison 21,606 11 2,964 628.9%- 5 Herbert Smith 21,502 13 - -
136 6 Stikeman Elliott 21,334 9 1,100 1,839%21 7 King & Wood Mallesons 21,306 57 15,373 38.6%30 8 Davis Polk & Wardwell 20,814 8 10,060 106.9%29 9 Cleary Gottlieb Steen & Hamilton 20,772 11 10,286 101.9%37 10 Blake, Cassels & Graydon 20,268 10 8,490 138.7%64 11 Osler, Hoskin & Harcourt 18,837 4 4,635 306.4%102 12 Stamford Law 18,686 9 2,045 813.7%110 13 Morrison & Foerster 18,252 5 1,797 915.7%10 14 Sullivan & Cromwell 18,161 8 23,355 -22.2%6 15 Linklaters 18,114 29 27,808 -34.9%46 16 Weil Gotshal & Manges 17,747 16 6,887 157.7%8 17 Baker & McKenzie 17,205 48 26,837 -35.9%69 18 Amarchand & Mangaldas & Suresh A
Shroff & Co15,612 26 4,311 262.1%
4 19 Freehills 14,609 40 36,331 -59.8%31 20 Allen & Gledhill 13,515 23 10,018 34.9%
Press Release: mergermarket M&A Round-up for Q1-Q3 2012 43 www.mergermarket.com

Asia-Pacifi c: League Tables of Legal AdvisersLeague Table of Legal Advisers to Asia-Pacifi c (ex. Japan) Buyouts*: Volume
Ranking Q1-Q3 2012 Q1-Q3 2011Q1-Q3 2011
Q1-Q3 2012 Company Name
Value (US$m)
Deal Count
Deal Count
Count Change
22 1 Kim & Chang 2,500 7 3 44 2 Gilbert + Tobin 1,661 7 6 11 3 Minter Ellison 2,002 6 10 -417 4 AZB & Partners 290 6 3 319 5 Paul Weiss Rifkind Wharton & Garrison 2,043 4 3 120 6 Weil Gotshal & Manges 1,227 4 3 17 7 Clifford Chance 801 4 5 -127 8 Skadden Arps Slate Meagher & Flom 376 4 2 2- 9 Wadia Ghandy & Co 207 4 - -
12 10 Davis Polk & Wardwell 107 4 4 054 11 Nishith Desai Associates 39 4 1 337 12 King & Wood Mallesons 1,203 3 2 132 13 Amarchand & Mangaldas & Suresh
A Shroff & Co1,005 3 2 1
15 14 Khaitan & Co 133 3 4 -125 15 Clayton Utz 130 3 2 130 16 WongPartnership 116 3 2 12 17 Fangda Partners 1,766 2 7 -511 18 Freehills 813 2 4 -214 19 Allen & Overy 545 2 4 -2- 20 Wilson Sonsini Goodrich & Rosati 345 2 - -
League Table of Legal Advisers to Asia-Pacifi c (ex. Japan) Buyouts*: ValueRanking Q1-Q3 2012 Q1-Q3 2011
Q1-Q3 2011
Q1-Q3 2012 Company Name
Value (US$m)
Deal Count
Value (US$m)
% Val. Change
33 1 Kim & Chang 2,500 7 271 822.5%13 2 Paul Weiss Rifkind Wharton & Garrison 2,043 4 1,182 72.8%16 3 Minter Ellison 2,002 6 993 101.6%6 4 Fangda Partners 1,766 2 1457 21.2%12 5 Gilbert + Tobin 1,661 7 1,203 38.1%- 6 Stikeman Elliott 1,250 1 - -
15 7 Weil Gotshal & Manges 1,227 4 1,020 20.3%66 8 King & Wood Mallesons 1,203 3 0 -20 9 Linklaters 1,062 1 805 31.9%41 10 Simpson Grierson 1,021 1 210 386.2%47 11 Amarchand & Mangaldas & Suresh
A Shroff & Co1,005 3 123 717.1%
11 12 Ropes & Gray 1,004 1 1,249 -19.6%- 13= Hankyul Law Firm 819 1 - -
63 13= Yulchon 819 1 12 6,725%17 15 Freehills 813 2 970 -16.2%1 16 Clifford Chance 801 4 3,338 -76.0%35 17 Cleary Gottlieb Steen & Hamilton 600 1 256 134.4%24 18 Allen & Overy 545 2 610 -10.7%21 19 Skadden Arps Slate Meagher & Flom 376 4 793 -52.6%- 20 Wilson Sonsini Goodrich & Rosati 345 2 - -
* Based on the target geography only and the adviser advising the buy-side only
Press Release: mergermarket M&A Round-up for Q1-Q3 2012 44 www.mergermarket.com

Asia-Pacifi c: League Tables of Legal Advisers
League Table of Legal Advisers to Greater China M&A: VolumeRanking Q1-Q3 2012 Q1-Q3 2011
Q1-Q3 2011
Q1-Q3 2012 Company Name
Value (US$m)
Deal Count
Deal Count
Count Change
2 1 King & Wood Mallesons 12,403 21 20 11 2 Clifford Chance 10,302 21 25 -454 3 Jingtian & Gongcheng 12,456 17 3 145 4 Linklaters 11,107 16 18 -210 5 Skadden Arps Slate Meagher & Flom 10,971 15 14 13 6 Baker & McKenzie 4,610 15 19 -47 7 Freshfields Bruckhaus Deringer 28,923 11 17 -64 8 Fangda Partners 10,929 11 19 -829 9 Cleary Gottlieb Steen & Hamilton 20,387 10 6 439 10 Weil Gotshal & Manges 12,658 9 5 46 11 Jones Day 6,009 9 18 -99 12 Allen & Overy 4,153 9 15 -624 13 White & Case 8,336 8 8 011 14 Lee and Li Attorneys at Law 5,622 8 13 -515 15 Latham & Watkins 1,677 8 10 -2
League Table of Legal Advisers to Greater China M&A: ValueRanking Q1-Q3 2012 Q1-Q3 2011
Q1-Q3 2011
Q1-Q3 2012 Company Name
Value (US$m)
Deal Count
Value (US$m)
% Val. Change
2 1 Freshfields Bruckhaus Deringer 28,923 11 15,822 82.8%97 2 Stikeman Elliott 20,976 5 623 3,267%36 3 Davis Polk & Wardwell 20,612 5 3,069 571.6%- 4 Herbert Smith 20,597 6 - -7 5 Cleary Gottlieb Steen & Hamilton 20,387 10 9,523 114.1%58 6 Paul Weiss Rifkind Wharton & Garrison 19,625 5 1,751 1,021%68 7 Morrison & Foerster 17,989 3 1,246 1,344%46 8 Blake, Cassels & Graydon 17,939 4 2,432 637.6%222 9 Osler, Hoskin & Harcourt 17,654 1 - -19 10 Sullivan & Cromwell 17,444 6 5,479 218.4%61 11 Weil Gotshal & Manges 12,658 9 1,677 654.8%3 12 Jingtian & Gongcheng 12,456 17 13,940 -10.6%16 13 King & Wood Mallesons 12,403 21 6,923 79.2%5 14 Linklaters 11,107 16 11,759 -5.5%12 15 Skadden Arps Slate Meagher & Flom 10,971 15 8,276 33%
League Table of Legal Advisers to Asia (ex. Japan) M&A: VolumeRanking Q1-Q3 2012 Q1-Q3 2011
Q1-Q3 2011
Q1-Q3 2012 Company Name
Value (US$m)
Deal Count
Deal Count
Count Change
1 1 Kim & Chang 7,454 40 41 -13 2 Baker & McKenzie 13,691 31 37 -66 3 Clifford Chance 11,236 30 34 -42 4 Lee & Ko 5,018 30 39 -94 5 Desai & Diwanji 934 29 36 -716 6 Khaitan & Co 1,367 28 25 321 7 Amarchand & Mangaldas & Suresh
A Shroff & Co15,612 26 18 8
15 8 King & Wood Mallesons 13,171 26 25 15 9 Linklaters 14,305 25 35 -108 10 Allen & Gledhill 12,961 22 32 -1013 11 AZB & Partners 2,762 21 26 -512 12 WongPartnership 22,916 20 27 -711 13 Allen & Overy 9,377 20 28 -819 14 Skadden Arps Slate Meagher & Flom 22,295 19 18 19 15 Bae Kim & Lee 4,086 19 30 -11
League Table of Legal Advisers to Asia (ex. Japan) M&A: ValueRanking Q1-Q3 2012 Q1-Q3 2011
Q1-Q3 2011
Q1-Q3 2012 Company Name
Value (US$m)
Deal Count
Value (US$m)
% Val. Change
5 1 Freshfields Bruckhaus Deringer 29,213 15 20,525 42.3%34 2 WongPartnership 22,916 20 6,130 273.8%20 3 Skadden Arps Slate Meagher & Flom 22,295 19 9,392 137.4%- 4 Herbert Smith 21,502 12 - -
131 5 Stikeman Elliott 21,244 7 787 2,599%61 6 Paul Weiss Rifkind Wharton & Garrison 21,146 9 2,964 613.4%16 7 Cleary Gottlieb Steen & Hamilton 20,772 11 10,286 101.9%38 8 Davis Polk & Wardwell 20,669 7 5,528 273.9%83 9 Stamford Law 18,686 9 2,045 813.7%91 10 Morrison & Foerster 18,242 4 1,797 915.1%65 11 Blake, Cassels & Graydon 17,939 4 2,729 557.3%28 12 Sullivan & Cromwell 17,697 7 7,249 144.1%343 13 Osler, Hoskin & Harcourt 17,654 1 - -49 14 Amarchand & Mangaldas & Suresh
A Shroff & Co15,612 26 4,311 262.1%
1 15 Linklaters 14,305 25 27,188 -47.4%
Press Release: mergermarket M&A Round-up for Q1-Q3 2012 45 www.mergermarket.com
Asia-Pacifi c: League Tables of Legal Advisers
League Table of Legal Advisers to Japanese M&A: VolumeRanking Q1-Q3 2012 Q1-Q3 2011
Q1-Q3 2011
Q1-Q3 2012 Company Name
Value (US$m)
Deal Count
Deal Count
Count Change
1 1 Mori Hamada & Matsumoto 36,343 57 40 173 2 Nishimura & Asahi 24,497 40 34 62 3 Nagashima Ohno & Tsunematsu 38,869 37 38 -17 4 Baker & McKenzie 9,025 15 15 08 5 TMI Associates 1,696 14 14 04 6 Anderson Mori & Tomotsune 16,294 11 30 -1913 7 Jones Day 10,252 11 11 05 8 Morrison & Foerster 5,447 10 17 -728 9 White & Case 5,289 10 3 715 10 Davis Polk & Wardwell 9,309 9 8 19 11 Clifford Chance 10,716 8 12 -425 12 Kim & Chang 1,059 8 4 423 13 Linklaters 6,444 7 4 338 14 Ashurst 3,736 7 3 414 15 Skadden Arps Slate Meagher & Flom 6,666 6 10 -4
League Table of Legal Advisers to Japanese M&A: ValueRanking Q1-Q3 2012 Q1-Q3 2011
Q1-Q3 2011
Q1-Q3 2012 Company Name
Value (US$m)
Deal Count
Value (US$m)
% Val. Change
1 1 Nagashima Ohno & Tsunematsu 38,869 37 45,705 -15.0%3 2 Mori Hamada & Matsumoto 36,343 57 34,560 5.2%2 3 Nishimura & Asahi 24,497 40 36,549 -33.0%21 4 Anderson Mori & Tomotsune 16,294 11 4,909 231.9%12 5 Blake, Cassels & Graydon 13,345 3 13,740 -2.9%36 6 Clifford Chance 10,716 8 1,900 464.0%47 7 Jones Day 10,252 11 1,170 776.2%23 8 Davis Polk & Wardwell 9,309 9 4,641 101%30 9 Baker & McKenzie 9,025 15 2,388 277.9%- 10= A&L Goodbody 7,300 1 - -- 10= McCann FitzGerald 7,300 1 - -
40 10= Milbank Tweed Hadley & McCloy 7,300 1 1,524 379.0%6 13 Sullivan & Cromwell 6,760 5 26,436 -74.4%15 14 Skadden Arps Slate Meagher & Flom 6,666 6 10,718 -37.8%18 15 Cleary Gottlieb Steen & Hamilton 6,663 5 6,360 4.8%
League Table of Legal Advisers to Australasian M&A: VolumeRanking Q1-Q3 2012 Q1-Q3 2011
Q1-Q3 2011
Q1-Q3 2012 Company Name
Value (US$m)
Deal Count
Deal Count
Count Change
2 1 Freehills 14,609 40 54 -1410 2 Gilbert + Tobin 9,203 36 22 144 3 King & Wood Mallesons 8,526 36 41 -51 4 Minter Ellison 3,066 30 61 -317 5 Clayton Utz 7,217 27 32 -53 6 Allens 7,829 25 44 -196 7 Baker & McKenzie 3,862 22 34 -1211 8 Norton Rose 2,572 21 20 15 9 Ashurst 4,068 20 39 -199 10 Corrs Chambers Westgarth 2,675 17 22 -516 11 DLA Piper 779 17 10 712 12 McCullough Robertson 606 15 15 08 13 Allen & Overy 3,213 14 23 -923 14 Henry Davis York 339 11 7 413 15 Chapman Tripp 544 10 13 -3
League Table of Legal Advisers to Australasian M&A: ValueRanking Q1-Q3 2012 Q1-Q3 2011
Q1-Q3 2011
Q1-Q3 2012 Company Name
Value (US$m)
Deal Count
Value (US$m)
% Val. Change
3 1 Freehills 14,609 40 28,700 -49.1%12 2 Gilbert + Tobin 9,203 36 14,927 -38.3%15 3 King & Wood Mallesons 8,526 36 10,432 -18.3%1 4 Allens 7,829 25 42,559 -81.6%9 5 Clayton Utz 7,217 27 18,002 -59.9%39 6 Linklaters 7,007 7 1,943 260.6%4 7 Ashurst 4,068 20 24,318 -83.3%10 8 Latham & Watkins 4,006 3 16,466 -76%19 9 Baker & McKenzie 3,862 22 8,241 -53.1%32 10 Weil Gotshal & Manges 3,696 2 4,456 -17.1%103 11 Hengeler Mueller 3,696 1 83 4,353%5 12 Allen & Overy 3,213 14 24,179 -86.7%
137 13 CMS 3,108 3 - -16 14 Minter Ellison 3,066 30 9,459 -67.6%6 15 Corrs Chambers Westgarth 2,675 17 22,351 -88.0%
Press Release: mergermarket M&A Round-up for Q1-Q3 2012 46 www.mergermarket.com

Asia-Pacifi c: League Tables of Legal Advisers
League Table of Legal Advisers to South East Asian M&A: VolumeRanking Q1-Q3 2012 Q1-Q3 2011
Q1-Q3 2011
Q1-Q3 2012 Company Name
Value (US$m)
Deal Count
Deal Count
Count Change
1 1 Allen & Gledhill 12,961 22 27 -52 2 WongPartnership 22,515 18 25 -73 3 Baker & McKenzie 8,983 16 17 -16 4 Stamford Law 18,448 8 11 -37 5 Allen & Overy 5,378 8 9 -14 6 Linklaters 4,604 8 12 -411 7 Rajah & Tann 3,365 7 7 05 8 Shook Lin & Bok Singapore 8,126 6 12 -68 9 Clifford Chance 3,736 6 9 -3
117 10 White & Case 1,115 6 1 578 11 Loyens & Loeff 5,483 5 1 419 12 Latham & Watkins 1,982 5 4 115 13 Shearman & Sterling 1,116 5 6 -117 14 King & Wood Mallesons 768 5 5 094 15 Allens 329 5 1 4
League Table of Legal Advisers to South East Asian M&A: ValueRanking Q1-Q3 2012 Q1-Q3 2011
Q1-Q3 2011
Q1-Q3 2012 Company Name
Value (US$m)
Deal Count
Value (US$m)
% Val. Change
9 1 WongPartnership 22,515 18 4,230 432.3%19 2 Stamford Law 18,448 8 2,045 802.1%3 3 Allen & Gledhill 12,961 22 7,349 76.4%1 4 Baker & McKenzie 8,983 16 9,865 -8.9%78 5 Makes & Partners 8,733 4 170 5,037%12 6 Shook Lin & Bok Singapore 8,126 6 3,402 138.9%- 7= Duane Morris & Selvam 6,593 1 - -
74 7= Rodyk & Davidson 6,593 1 199 3,213%67 9 Loyens & Loeff 5,483 5 250 2,093%2 10 Allen & Overy 5,378 8 7,747 -30.6%5 11 Norton Rose 5,254 4 5,988 -12.3%30 12 Burnet Duckworth & Palmer 5,055 1 1,121 350.9%4 13 Linklaters 4,604 8 6,683 -31.1%16 14 Clifford Chance 3,736 6 2,496 49.7%27 15 Rajah & Tann 3,365 7 1,317 155.5%
League Table of Legal Advisers to Indian M&A: VolumeRanking Q1-Q3 2012 Q1-Q3 2011
Q1-Q3 2011
Q1-Q3 2012 Company Name
Value (US$m)
Deal Count
Deal Count
Count Change
1 1 Desai & Diwanji 909 28 36 -83 2 Khaitan & Co 1,367 27 25 24 3 Amarchand & Mangaldas & Suresh
A Shroff & Co15,470 25 18 7
2 4 AZB & Partners 2,762 20 26 -67 5 DSK Legal 1,326 12 8 46 6 J Sagar Associates 473 10 10 0
106 7 Krishnamurthy and Co 57 10 1 95 8 Trilegal 421 9 14 -513 9 Rajani Associates 340 8 5 311 10 Nishith Desai Associates 1,068 7 7 012 11 Tatva Legal 50 7 7 041 12 Luthra & Luthra Law Offices 10,416 5 2 3- 13 Herbert Smith 545 5 - -
22 14 Wadia Ghandy & Co 207 4 3 1- 15 Vaish Associates 103 4 - -
League Table of Legal Advisers to Indian M&A: ValueRanking Q1-Q3 2012 Q1-Q3 2011
Q1-Q3 2011
Q1-Q3 2012 Company Name
Value (US$m)
Deal Count
Value (US$m)
% Val. Change
10 1 Amarchand & Mangaldas & Suresh A Shroff & Co
15,470 25 4,311 258.8%
64 2 Luthra & Luthra Law Offices 10,416 5 91 11,346%- 3 Skadden Arps Slate Meagher & Flom 10,289 1 - -
17 4 Ashurst 5,644 1 1,576 258.1%1 5 AZB & Partners 2,762 20 11,344 -75.7%20 6 Paul Weiss Rifkind Wharton & Garrison 1,379 3 1,213 13.7%11 7 Khaitan & Co 1,367 27 3,885 -64.8%40 8 DSK Legal 1,326 12 473 180.3%83 9 Jones Day 1,323 3 19 6,863%3 10 Allen & Overy 1,141 2 8,693 -86.9%31 11 Latham & Watkins 1,124 2 644 74.5%23 12 Nishith Desai Associates 1,068 7 833 28.2%35 13= Cravath Swaine & Moore 1,004 1 550 82.5%- 13= Ropes & Gray 1,004 1 - -- 15= Grata Law Firm 1,000 1 - -
66 15= Simmons & Simmons 1,000 1 81 1,135%
Press Release: mergermarket M&A Round-up for Q1-Q3 2012 47 www.mergermarket.com

Asia-Pacifi c: League Tables of Legal AdvisersLeague Table of Legal Advisers to South Korean M&A: Volume
Ranking Q1-Q3 2012 Q1-Q3 2011Q1-Q3 2011
Q1-Q3 2012 Company Name
Value (US$m)
Deal Count
Deal Count
Count Change
1 1 Kim & Chang 7,454 40 40 02 2 Lee & Ko 5,018 30 39 -94 3 Bae Kim & Lee 4,086 19 30 -113 4 Shin & Kim 1,366 15 34 -195 5 Yulchon 6,065 14 17 -38 6 Kim, Choi & Lim 300 9 8 16 7 Jipyong Jisung 2,962 7 10 -37 8 Yoon & Yang 1,344 6 10 -49 9 Hyun Attorneys At Law 66 4 3 1- 10 Weil Gotshal & Manges 1,522 3 - -
31 11 Wilson Sonsini Goodrich & Rosati 467 3 1 238 12 Latham & Watkins 3,994 2 1 166 13 Linklaters 1,691 2 1 120 14 Hankyul Law Firm 832 2 2 0- 15 Skadden Arps Slate Meagher & Flom 629 2 - -
League Table of Legal Advisers to South Korean M&A: ValueRanking Q1-Q3 2012 Q1-Q3 2011
Q1-Q3 2011
Q1-Q3 2012 Company Name
Value (US$m)
Deal Count
Value (US$m)
% Val. Change
2 1 Kim & Chang 7,454 40 9,565 -22.1%5 2 Yulchon 6,065 14 3,717 63.2%1 3 Lee & Ko 5,018 30 20,617 -75.7%3 4 Bae Kim & Lee 4,086 19 7,677 -46.8%31 5 Latham & Watkins 3,994 2 242 1,550%- 6 Freehills 3,655 1 - -
19 7 Jipyong Jisung 2,962 7 643 360.7%66 8 Linklaters 1,691 2 - -- 9 Weil Gotshal & Manges 1,522 3 - -4 10 Shin & Kim 1,366 15 6,848 -80.1%23 11 Yoon & Yang 1,344 6 482 178.8%29 12 Hankyul Law Firm 832 2 288 188.9%- 13 Jehyun Attorneys At Law 732 1 - -- 14 Skadden Arps Slate Meagher & Flom 629 2 - -- 15 De Brauw Blackstone Westbroek 629 1 - -
Press Release: mergermarket M&A Round-up for Q1-Q3 2012 48 www.mergermarket.com

• Total deal value for 2012 of US$ 31.1bn, down 13.2% on same period in 2011
• Africa & Middle East saw second slowest third quarter since 2005 • Freshfi elds Bruckhaus Deringer tops league table with deals worth US$
6.1bn
In the fi rst three quarters of 2012, Africa and the Middle East saw M&A deals with a total value of US$ 31.1bn, 13.2% lower than the same period in 2011 (US$ 35.8bn). The region accounted for 2.1% of the US$ 1,461.1bn total value of global M&A, just over the 2% market share last year.
The total for Q3 was, however, the second lowest for a third quarter since Q3 2005 (US$ 5.9bn). After an encouraging 46.9% increase in Middle East & Africa deal making from Q1 (US$ 9.2bn) to Q2 (US$ 13.5bn) 2012, activity slumped again - by 37.5% - in Q3, in contrast to the 42.8% increase seen between Q2 and Q3 last year.
In the Middle East and Africa, Telecoms deals skyrocketed by 381.7% from US$ 1.5bn in Q1-Q3 2011 to US$ 7.1bn for the same period this year, France Telecom’s US$ 3.3bn offer for ECMS/Mo-binil being the standout deal. The top ten deals also included three telecommunications transac-tions.
Africa & Middle East M&A Overview
Q1-Q3 2012 Q1-Q3 2011 Change
Sector Value (US$bn) Market share Deal count Value (US$bn) Market share Deal count Value (%) Deal Count
Energy, Mining & Utilities 7.8 25.1% 29 12.59 35.2% 36 -38.1% -7
Telecommunications 7.1 22.88% 6 1.5 4.1% 6 381.7% 0
Financial Services 5.8 18.5% 41 2.9 8.0% 32 101.3% 9
Consumer 4.2 13.4% 31 4.3 11.9% 40 -2.4% -9
Industrials & Chemicals 1.6 5.14% 29 5.4 15.1% 42 -70.4% -13
Technology 1.3 4.3% 14 1.9 5.4% 24 -30.4% -10
Pharma, Medical & Biotech 1.0 3.3% 13 1.3 3.6% 17 -18.6% -4
Business Services 0.77 2.47% 27 1.2 3.3% 19 -35.3% 8
Construction 0.8 2.4% 11 0.22 0.62% 12 242.5% -1
Media 0.3 1.0% 10 0.2 0.5% 1 62.6% 9
Transport 0.25 0.79% 5 0.4 1.2% 9 -40.9% -4
Agriculture 0.1 0.2% 7 0.0 0.0% 1 453.8% 6
Leisure 0.1 0.2% 5 0.10 0.3% 5 -32.6% 0
Real Estate 0.0 0.2% 3 3.8 10.7% 7 -98.8% -4
Defence 0.0 0.0% 0 0.1 0.2% 3 -100.0% -3
Total 31.1 231 35.8 254 -13.2% -23
Press Release: mergermarket M&A Round-up for Q1-Q3 2012 49 www.mergermarket.com
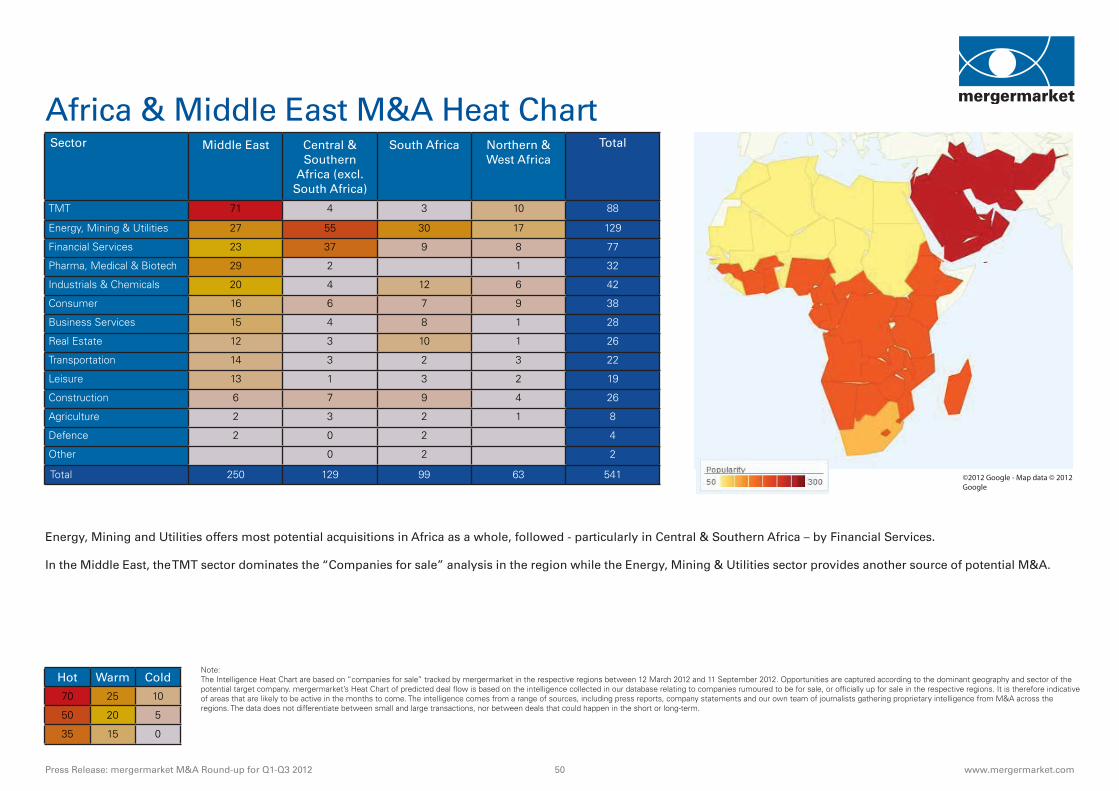
Africa & Middle East M&A Heat ChartSector Middle East Central &
Southern Africa (excl.
South Africa)
South Africa Northern & West Africa
Total
TMT 71 4 3 10 88
Energy, Mining & Utilities 27 55 30 17 129
Financial Services 23 37 9 8 77
Pharma, Medical & Biotech 29 2 1 32
Industrials & Chemicals 20 4 12 6 42
Consumer 16 6 7 9 38
Business Services 15 4 8 1 28
Real Estate 12 3 10 1 26
Transportation 14 3 2 3 22
Leisure 13 1 3 2 19
Construction 6 7 9 4 26
Agriculture 2 3 2 1 8
Defence 2 0 2 4
Other 0 2 2
Total 250 129 99 63 541
Hot Warm Cold
70 25 10
50 20 5
35 15 0
Energy, Mining and Utilities offers most potential acquisitions in Africa as a whole, followed - particularly in Central & Southern Africa – by Financial Services.
In the Middle East, the TMT sector dominates the “Companies for sale” analysis in the region while the Energy, Mining & Utilities sector provides another source of potential M&A.
©2012 Google - Map data © 2012 Google
Note: The Intelligence Heat Chart are based on “companies for sale” tracked by mergermarket in the respective regions between 12 March 2012 and 11 September 2012. Opportunities are captured according to the dominant geography and sector of the potential target company. mergermarket’s Heat Chart of predicted deal flow is based on the intelligence collected in our database relating to companies rumoured to be for sale, or officially up for sale in the respective regions. It is therefore indicative of areas that are likely to be active in the months to come. The intelligence comes from a range of sources, including press reports, company statements and our own team of journalists gathering proprietary intelligence from M&A across the regions. The data does not differentiate between small and large transactions, nor between deals that could happen in the short or long-term.
Press Release: mergermarket M&A Round-up for Q1-Q3 2012 50 www.mergermarket.com
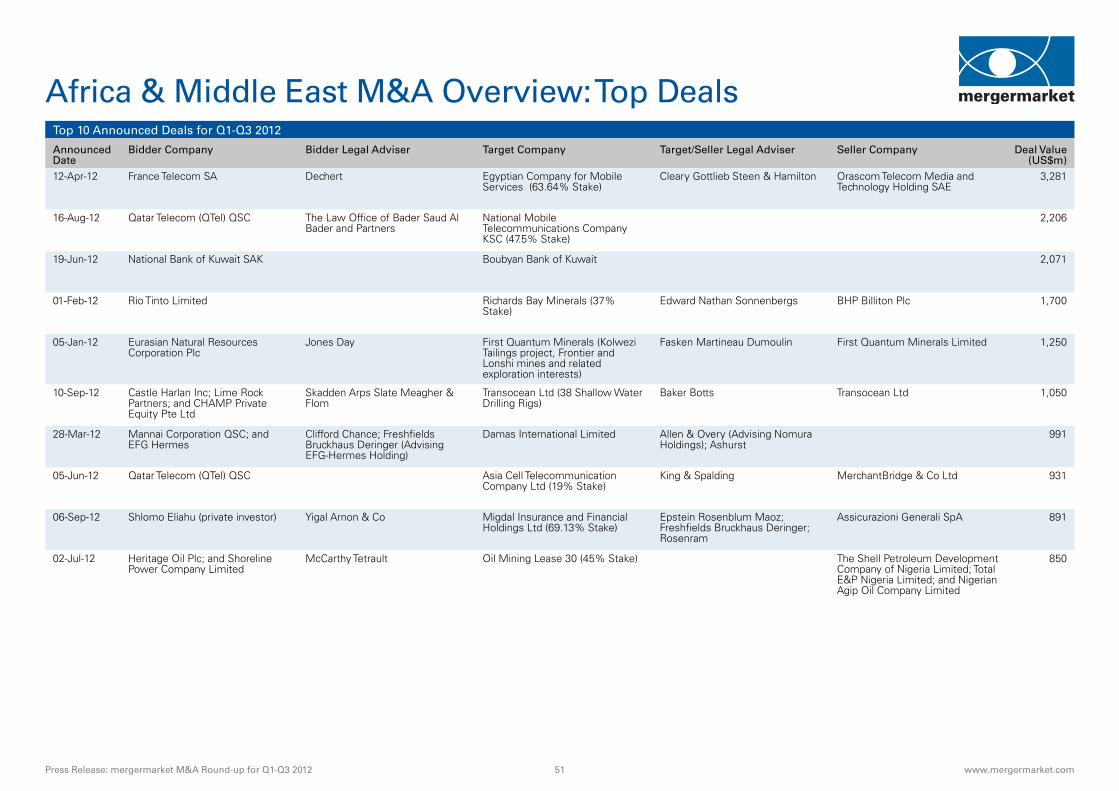
Africa & Middle East M&A Overview: Top DealsTop 10 Announced Deals for Q1-Q3 2012
Announced Date
Bidder Company Bidder Legal Adviser Target Company Target/Seller Legal Adviser Seller Company Deal Value (US$m)
12-Apr-12 France Telecom SA Dechert Egyptian Company for Mobile Services (63.64% Stake)
Cleary Gottlieb Steen & Hamilton Orascom Telecom Media and Technology Holding SAE
3,281
16-Aug-12 Qatar Telecom (QTel) QSC The Law Office of Bader Saud Al Bader and Partners
National Mobile Telecommunications Company KSC (47.5% Stake)
2,206
19-Jun-12 National Bank of Kuwait SAK Boubyan Bank of Kuwait 2,071
01-Feb-12 Rio Tinto Limited Richards Bay Minerals (37% Stake)
Edward Nathan Sonnenbergs BHP Billiton Plc 1,700
05-Jan-12 Eurasian Natural Resources Corporation Plc
Jones Day First Quantum Minerals (Kolwezi Tailings project, Frontier and Lonshi mines and related exploration interests)
Fasken Martineau Dumoulin First Quantum Minerals Limited 1,250
10-Sep-12 Castle Harlan Inc; Lime Rock Partners; and CHAMP Private Equity Pte Ltd
Skadden Arps Slate Meagher & Flom
Transocean Ltd (38 Shallow Water Drilling Rigs)
Baker Botts Transocean Ltd 1,050
28-Mar-12 Mannai Corporation QSC; and EFG Hermes
Clifford Chance; Freshfields Bruckhaus Deringer (Advising EFG-Hermes Holding)
Damas International Limited Allen & Overy (Advising Nomura Holdings); Ashurst
991
05-Jun-12 Qatar Telecom (QTel) QSC Asia Cell Telecommunication Company Ltd (19% Stake)
King & Spalding MerchantBridge & Co Ltd 931
06-Sep-12 Shlomo Eliahu (private investor) Yigal Arnon & Co Migdal Insurance and Financial Holdings Ltd (69.13% Stake)
Epstein Rosenblum Maoz; Freshfields Bruckhaus Deringer; Rosenram
Assicurazioni Generali SpA 891
02-Jul-12 Heritage Oil Plc; and Shoreline Power Company Limited
McCarthy Tetrault Oil Mining Lease 30 (45% Stake) The Shell Petroleum Development Company of Nigeria Limited; Total E&P Nigeria Limited; and Nigerian Agip Oil Company Limited
850
Press Release: mergermarket M&A Round-up for Q1-Q3 2012 51 www.mergermarket.com

Africa & Middle East: League Tables of Legal AdvisersLeague Table of Legal Advisers to Africa & Middle East M&A: Volume
Ranking Q1-Q3 2012 Q1-Q3 2011Q1-Q3 2011
Q1-Q3 2012 Company Name
Value (US$m)
Deal Count
Deal Count
Count Change
11 1 Edward Nathan Sonnenbergs 3,476 17 13 49 2 Allen & Overy 4,586 15 7 86 3 DLA Cliffe Dekker Hofmeyr 1,631 15 25 -102 4 Freshfields Bruckhaus Deringer 6,109 13 9 41 5 Linklaters 4,998 12 12 014 6 Clifford Chance 2,509 12 11 115 7 Herzog, Fox and Neeman 1,878 10 15 -520 8 Webber Wentzel 1,043 10 12 -213 9 Bowman Gilfillan 444 8 17 -953 10 Shearman & Sterling 2,947 7 2 533 11 Meitar Liquornik Geva & Leshem
Brandwein1,814 7 10 -3
10 12 Werksmans 1,172 7 23 -1627 13 Gibson Dunn & Crutcher 1,019 7 6 13 14 Skadden Arps Slate Meagher & Flom 2,506 6 5 1
59 15 Jones Day 2,321 5 2 326 16 Fasken Martineau Dumoulin 2,204 5 2 318 17 GKH Law Offices 886 5 5 04 18 Latham & Watkins 784 5 4 1
129 19 Mayer Brown 579 5 3 221 20 Baker & McKenzie 159 5 3 2
League Table of Legal Advisers to Africa & Middle East M&A: ValueRanking Q1-Q3 2012 Q1-Q3 2011
Q1-Q3 2011
Q1-Q3 2012 Company Name
Value (US$m)
Deal Count
Value (US$m)
% Val. Change
2 1 Freshfields Bruckhaus Deringer 6,109 13 12,972 -52.9%1 2 Linklaters 4,998 12 13,220 -62.2%9 3 Allen & Overy 4,586 15 6,310 -27.3%- 4 Dechert 3,501 3 - -
11 5 Edward Nathan Sonnenbergs 3,476 17 4,394 -20.9%70 6 Cleary Gottlieb Steen & Hamilton 3,281 1 504 551.0%53 7 Shearman & Sterling 2,947 7 736 300.4%14 8 Clifford Chance 2,509 12 3,533 -29.0%3 9 Skadden Arps Slate Meagher & Flom 2,506 6 10,076 -75.1%7 10 Dewey & LeBoeuf 2,485 3 7160 -65.3%96 11 Yigal Arnon & Co 2,419 3 265 812.8%59 12 Jones Day 2,321 5 600 286.8%159 13 Davis Polk & Wardwell 2,300 2 - -32 14 Sullivan & Cromwell 2,273 1 1,504 51.1%- 15 The Law Office of Bader Saud Al
Bader and Partners2,206 1 - -
26 16 Fasken Martineau Dumoulin 2,204 5 1,831 20.4%- 17= Lefosse Advogados 2,000 1 - -- 17= Mattos Filho, Veiga Filho, Marrey Jr.
e Quiroga Advogados2,000 1 - -
- 17= Souza, Cescon, Barrieu & Flesch Advogados 2,000 1 - -- 20= Epstein Rosenblum Maoz 1,989 2 - -- 20= Rosenram 1,989 2 - -
Press Release: mergermarket M&A Round-up for Q1-Q3 2012 52 www.mergermarket.com

About mergermarket
mergermarket is a mergers & acquisitions (M&A) intelligence service.
mergermarket is part of The Mergermarket Group which has over 450 employees worldwide and regional head offi ces in New York, London and Hong Kong.
In any market, the life blood of advisors is deal fl ow. mergermarket is unique in the provision of origination intelligence to the investment banking, legal, private equity, acquisition fi nance, public relations (PR) and corporate markets.
With an unrivalled network of analysts covering M&A in the Americas, Europe, Mid-dle-East, Africa and Asia-Pacifi c, mergermarket generates proprietary intelligence and delivers it together with daily aggregated content, on its mergermarket.com platform and by real-time email alerts to subscribers.
This wealth of intelligence, together with a series of deal databases, individual and house league tables, profi les and editorial have proven time and time again that this product can and does generate real revenues for clients. This is apparent when you see that mergermarket is used by over 1500 of the world’s foremost advisory fi rms to assist in their origination process.
Part of The Mergermarket Group
www.mergermarket.com80 StrandLondon, WC2R 0RLUnited Kingdom
t: +44(0)20 7059 0000f: +44(0)20 0000 [email protected]
11 West 19th Street2nd FloorNew York NY 10011. USA
t: +1 212-686-5606f:+1 [email protected]
Suite 2401-3Grand Millennium Plaza181 Queen’s Road, CentralHong Kong
t:+852 2158 9700f:+852 2158 [email protected]
All data is based on transactions over US$5m announced between 1 January 2012 and 30 September 2012, unless stated otherwise. Deals with undisclosed deal values are included where the target’s turnover exceeds US$10m. Deals where the stake acquired is less than 30% will only be included if their value is greater than US$100m. Activities excluded from the league tables include property transactions and restructurings where the ultimate shareholders’ interests are not changed.
The M&A activity table and league tables are based on the dominant geography of any of the target, bidder or seller. The overall trend graph and pie charts are based on the domi-nant geography of the target only. The cross-border trend graph and pie charts are based on the dominant geography of the target and the bidder. All sector breakdowns are based on the dominant sector of the target only.
The trend graphs are based on transactions announced in the given time periods.
For this report, “inbound” refers to deals where the dominant geography of the target is X and the dominant geography of the bidder is outside X; “outbound” refers to deals where the dominant geography of the target is outside X and the dominant geography of the bidder is X.
All data correct as of 08 October 2012.
Criteria: http://www.mergermarket.com/pdf/deal_criteria.pdf
Criteria
Press Release: mergermarket M&A Round-up for Q1-Q3 2012 53 www.mergermarket.com