Embed Size (px)
Citation preview

Legacies of Conflict: Evidence from the Poverty and Social Exclusion Survey 2012
24th October 2013
Mike Tomlinson School of Sociology, Social Policy and Social Work
Queen’s University Belfast

2
Summary1
1. The Poverty and Social Exclusion Survey 20122 included questions designed to capture the impact of the ‘Troubles’ on people’s lives. The seminar presents the findings on the prevalence of conflict-related events, who those events affected and explores impacts in terms of health and deprivation. 2. Just under a half of all adults (45%) experienced either the death or injury of someone they knew personally. For more than a third of adults (35%), someone they knew was killed. 10.7% lost a ‘close friend’ and 10.0% a ‘close relative’. 3. A similar pattern emerges for conflict-related injury. A third of adults knew someone who was injured. 3.9% answered: ‘I was physically injured’, equivalent to 53,800 people. 11.6% said a close relative was physically injured and 10.3%, a close friend. 4. More than half the adult population (56.6%) have witnessed violent events of some sort. These include ‘a bomb explosion’ (33.0%), gunfire (22.4%), rioting (35%) and ‘someone being assaulted’ (19.6%). 5. The survey found that 3.0% of adults (about 41,000 people) had witnessed a murder. 6. People were asked to think about the worst thing that happened to them because of the Troubles and to say when this was. Almost a fifth (18.4%) of ‘worst things’ happened in the very early years (1969-1973) and a half (48.5%) in the period up to 1983. Surprisingly, a quarter of ‘worst things’ happened to people after 1994, with 13.5% occurring after 1998. 7. Some violent events are more prevalent in the later years. Over a third of assaults witnessed (36.6%) occurred after 1994. In contrast, a half of witnessed murders occurred before 1978. 8. Men are twice more likely than women to have experienced a close friend killed, 2.4 times as likely to have witnessed murder and 3.2 times as likely to have been injured themselves. Men are 12.5 times as likely as women to have been in prison because of the conflict. 9. Protestants are slightly more likely than Catholics to have experienced some events: a close friend killed, close relative killed, close friend injured, witnessed a bomb explosion and a close friend in prison. Catholics are more likely to have witnessed a murder (1.6 times) and to have had a close relative in prison (1.9 times). House searches carried out by the police and/or army were 4.4 times more likely for Catholics than Protestants. 10. When comparing the 45-64 year old age group with 16-34 year olds, the older group is 3.9 times as likely to have witnessed a bomb explosion but less likely to have witnessed an assault. The younger group is more likely to say they know someone who has spent time in prison because of the Troubles – twice as likely in the case of a ‘close relative’. Witnessing rioting varies little by age group. 11. Compared to adults living in other types of household, single non-pensioner households (mainly men) have much higher rates of experience of injury to self, a close friend killed and witnessing murder. 12. Those who have experienced one or more of four types of injury (to self, close friend etc) and those who have experienced both death and injury of people close to them have significantly raised deprivation levels and marginally raised unemployment. 13. Conflict-related experience is associated with low ‘life satisfaction’ – a quarter of those who have witnessed murder have very low life satisfaction scores. Those with no Troubles experience have higher scores than those for the GB population as a whole. 14. All of the conflict experiences (except one) are associated with a higher risk of poor physical and mental health. People injured are 2.7 times as likely to be in bad or very bad health. Losing a close friend appears to be more important to adverse health than losing a close relative. Witnessing a murder, assault and other serious violence are all associated with high risk ratios, as are being forced to move house or a job, and house searches. 15. The evidence on conflict experience is of direct relevance to a number of policy areas including health, disability, labour market activation and welfare reform.
1. All of the results presented here are subject to further validation and possible revision. 2. Poverty and Social Exclusion in the UK is a project funded by the Economic and Social Research Council (RES-060-25-0052). See www.poverty.ac.uk.

3
Introduction Population-wide evidence of the impact of ‘the Troubles’ on people’s lives is almost entirely absent from most discussions of the legacies of conflict. For example, a Northern Ireland Social Services Inspectorate report spoke of ‘an ever widening circle of individuals affected, socially, psychologically and economically...’. The report acknowledged, however, that ‘no-one knows the total number of people affected’.3 Ten years later, the Consultative Group on the Past stated,
Some 47,000 people sustained injuries in 16,200 bombing and 37,000 shooting incidents. There were 22,500 armed robberies, 2,200 arson attacks and some 19,600 people were imprisoned for scheduled offences. 4
Beyond the death toll, there were few other numbers in the Eames/Bradley report. Instead the Group relied largely on oral statements to assess the impact on communities, young people and victims and survivors.
The Poverty and Social Exclusion (PSE) study carried out in 2002/03 was the first attempt to gather survey evidence on the conflict from across Northern Ireland.5 It found that 14 per cent of adults had lost a ‘close relative’ and almost 8 per cent (about double the Eames/Bradley figure) had been physically injured, a half of these on more than one occasion. Some 8.6 per cent of respondents had had to move house due to attack, intimidation or harassment and 4.4 per cent had been forced to leave a job for the same reasons. Almost a quarter had themselves spent time in prison or knew someone else who had.
The PSE survey (see footnote 2) was repeated in 2012, with a slightly modified set of Troubles questions. The survey gathered evidence from a representative sample of 988 households with 2,311 individuals – 624 children (under 18 years old) and 1,687 adults. Of the adults, 80 per cent agreed to answer the ten Troubles questions.
The questions cover the death and injury of close friends and relatives, and asked if people had directly witnessed particular events such as a bomb explosion, gunfire, rioting and so on. There were questions on house searches carried out by the police or army, and on whether people had had to move house or a job because of attack, intimidation, threats or harassment. People were asked whether they, or anyone they knew had spent time in prison because of the Troubles. They were also asked to think about the worst thing that had happened to them because of the Troubles and to say when this was. Finally they were asked if they had followed up the worst experience by taking action of some kind, such as joining a support group or seeing their GP. The full set of questions is listed in Tables 1 and 2.
The results are discussed in three sections. First we give the basic findings on what happened to people because of the conflict. For each question, the proportion of the adult population who experienced each conflict-related event is presented. Many people experienced more than one event and we attempt to capture this intensity by looking at multiple experience of death and injury (excluding violence witnessed). In the second section, we look at who experienced conflict-related events in terms of age, gender, community background and household type. The social patterns of conflict experience are complex and need to be related to time, or ‘when the worst thing happened’. The impacts are considered in the third section. Some, but not all, conflict experience is associated with increased risk of mental and physical illness, poverty, unemployment and low ‘life satisfaction’.
3. Northern Ireland Social Services Inspectorate (1998) Living with the Trauma of the Troubles. Belfast. 4. Eames/Bradley Report (2009) Report of the Consultative Group on the Past, p. 62. http://cain.ulst.ac.uk/victims/docs/consultative_group/cgp_230109_report_sum.pdf 5. Hillyard, P., Kelly, G., McLaughlin, E., Patsios, D. and Tomlinson, M. (2003) Bare Necessities: Poverty and Social Exclusion in Northern Ireland. Belfast: Democratic Dialogue. The conflict data was further analysed in Hillyard, P., Rolston, B. and Tomlinson, M. (2005) Poverty and Conflict in Ireland: An International Perspective. Dublin: Combat Poverty Agency/Institute of Public Administration.
Introduction to the Troubles section of the PSE questionnaire: “The next set of questions is about your experience of the Troubles. This includes questions about physical injury you personally experienced or the injury or death to a close friend or relative. Questions about imprisonment are also included. If you feel uncomfortable answering these questions, then you do not need to answer them. All answers will be kept strictly confidential.
Are you willing to answer questions about your experience of the Troubles?”
1. YES 80% 2. NO 20%

4
1. What happened?
Table 1: Experience of killing and injury
PSE-NI ‘Troubles’ questions: death and injury Abbreviation % of adults
Thinking of the Troubles, did you experience any of the following?
A close friend was killed CFK 10.7
A close relative was killed CRK 10.0 Someone else that you knew personally was killed SEK 24.7 No close friend or relative was killed NOK 65.2
Again, thinking of the Troubles, did you experience any of the following? I was physically injured SelfI 3.9 A close friend was physically injured CFI 10.3 A close relative was physically injured CRI 11.6 Someone else you know personally was injured SEI 20.5
No-one you knew was injured NOI 67.0 Intensity of experience
Killing Either CFK or CRK 17.1
Two or more of CFK, CRK and SEK 6.7
Both CFK and CRK 3.3 Injury Either CFI, CRI or SEI 24.4
Two or more of CFI, CRI and SEI 7.4
All three of CFI, CRI and SEI 2.9
Table 1 shows the results for experience of killing and injury. For more than third of adults (35%), someone they knew was killed. For a third, someone they knew was injured. The survey found that 3.9 per cent of adults were physically injured in a Troubles incident – equivalent to 53,800 people. Just under a half of all adults (45%) experienced either the death or injury of someone they knew personally (not shown). Under ‘intensity of experience’ in Table 1 we can see that just under 7 per cent of adults experienced two or more of a close friend, a close relative and someone else they knew personally, being killed and over seven per cent experiencing injury of people in the same categories. Around three per cent of adults have lost both close friends and relatives to the conflict, and know close friends, close relatives and others (all three) who have been injured.
The majority of adults (56.6%) have witnessed at least one of the events listed under the first question in Table 2, the most common being rioting followed by a bomb explosion. More than a fifth say they have witnessed gunfire and a fifth, someone being assaulted. Three per cent of adults (approximately 41,000 people) have witnessed a murder according to the survey.
Not shown in Table 2 are the results for the number of house searches, when the ‘worst thing happened’ and the sort of action taken as a result of the worst thing. Around 121,000 adults have experienced a house search by the police or army. For a third of these, it was a one-off experience and a further third say their house was searched two or three times. Eighteen per cent had between four and ten searches, and 16 per cent, more than ten.
Introduction to questions on experience of killing and injury “I’m going to ask you about close friends and relatives. By close friends, I mean no more than the few people who you would confide in and trust most closely. By close relatives, I mean those who are part of your household, parents and grand-parents, and any other relatives (such as uncles, aunts and cousins) who you would see on a regular basis.”

5
Table 2: Violence witnessed and other conflict-related experience
Have you yourself directly witnessed any of the following events? Abbreviation % of adults A bomb explosion WitB 33.0 A murder WitM 3.0 Gunfire WitG 22.4 Rioting WitR 35.6 Someone being assaulted WitA 19.6 Other serious violence WitO 10.0 None of these NOWit 43.4 Have you or anyone you know spent time in prison because of the Troubles? YES PRIS 19.0 Did these people include? Yourself SPris 3.3 Close friends CFPris 26.3 Close relatives CRPris 27.4 Other relatives ORPris 23.1 Others OPris 47.9 Did you ever have your house searched by the police or army? YES HSE 8.8 How many times was your house searched? Did you ever have to move house due to attack, intimidation, threats or harassment? YES
MVH 4.4
Did you ever have to leave a job because of an attack, intimidation, threats or harassment? YES
MVJ 3.7
Asked of all with Troubles experience: Thinking of the worst thing that happened to you because of the Troubles, when was this? (7 time periods)
WYR
Because of this event, did you… ? (6 options: visit GP [AGP], join support group [ASG], visit counselor or other mental health professional [AMHP], join campaign group [ACG], do something else [ASE])
ACT
Only a small minority of people have taken some sort of action as a result of a conflict-related experience – 13.4 per cent. A third of those taking action of some kind had sought help from their GP. Going to a counsellor of other mental health professional was the next most popular option (22%).
0 2 4 6 8
10 12 14 16 18 20 %
Figure 1: When was the worst thing that happened to you because of the Troubles?
Figure 1 shows that of all the ‘worst things’ that happened, the highest proportion were in the earliest period of the conflict, as might be expected. Interestingly, the proportion for ‘after 1998’ is higher than for two earlier time periods – 1984-88 and 1994-98. One factor in particular appears to be pushing up the post-1998 value: witnessing an assault. Only 8 per cent of assaults witnessed took place in 1974-78, but this climbs to 18 per cent for 1989-93 and 21 per cent for ‘after 1998’.

6
2. To whom did it happen?
It is clear from Figure 2 that men were more likely than women to experience conflict-related events. There are 26 points on the scatter plot and for 21 of these, men have a greater risk than women of experiencing particular events. Men are twice as likely to have experienced a close friend killed, 2.4 times as likely to have witnessed murder and 3.2 times as likely to have been injured themselves. Men are 12.5 times as likely than women to have been in prison.
The pattern for community background shows that for six of the 26 conflict events, Protestants are slightly more likely than Catholics to have experienced the event: close friend killed, close relative killed, close friend injured, witnessed a bomb explosion and close friend in prison. Catholics are more likely to have witnessed a murder (1.6 times) and to have had a close relative in prison (1.9 times). Catholics were 4.4 times as likely than Protestants to have a house search.
Table 3 gives the risk ratio for conflict-related events comparing older to younger age bands. For example, the older group is 3.9 times as likely to have witnessed a bomb explosion as the younger group, a finding that corresponds with the incidence of this event by time period found in the ‘worst thing’ data.
Not all events follow this pattern however. Witnessing an assault is more associated with the 1990s onwards than with the earlier years and this is reflected in Table 3 where the older group is less likely (0.7) to have witnessed an assault than the younger group. The younger group is more likely to say they know someone who has spent time in prison because of the Troubles. They are twice as likely to give this answer for ‘close relative’ and ‘others’ than respondents in the older group.
One of most commonly witnessed events – rioting – has a very similar risk level between the age bands: the older group is 1.2 times as likely to mention this as a conflict experience.
Table 4 shows how the experience of selected conflict events varies by household type. The last column gives the overall proportion for all adults as a comparison. Adults living in households with children –
Figure 2: Experience of Troubles by gender Figure 3: Experience of Troubles by community
background
Table 3: Risk ratio of older (45-64) to younger (16-34) age bands
CFK 3.7 WitO 0.8
CRK 1.5 Pris 0.8
SEK 4.0 PrisS 1.8
SelfI 1.6 PrisCF 2.1
CFI 3.0 PrisCR 0.5
CRI 1.7 HSE 2.5
SEI 2.2 MVH 1.7
WitB 3.9 MVJ 3.3
WitM 3.2 AGP 1.4
WitG 3.2 ASG 0.4
WitR 1.2 AMHP 0.7
WitA 0.7 ACG 0.8
7
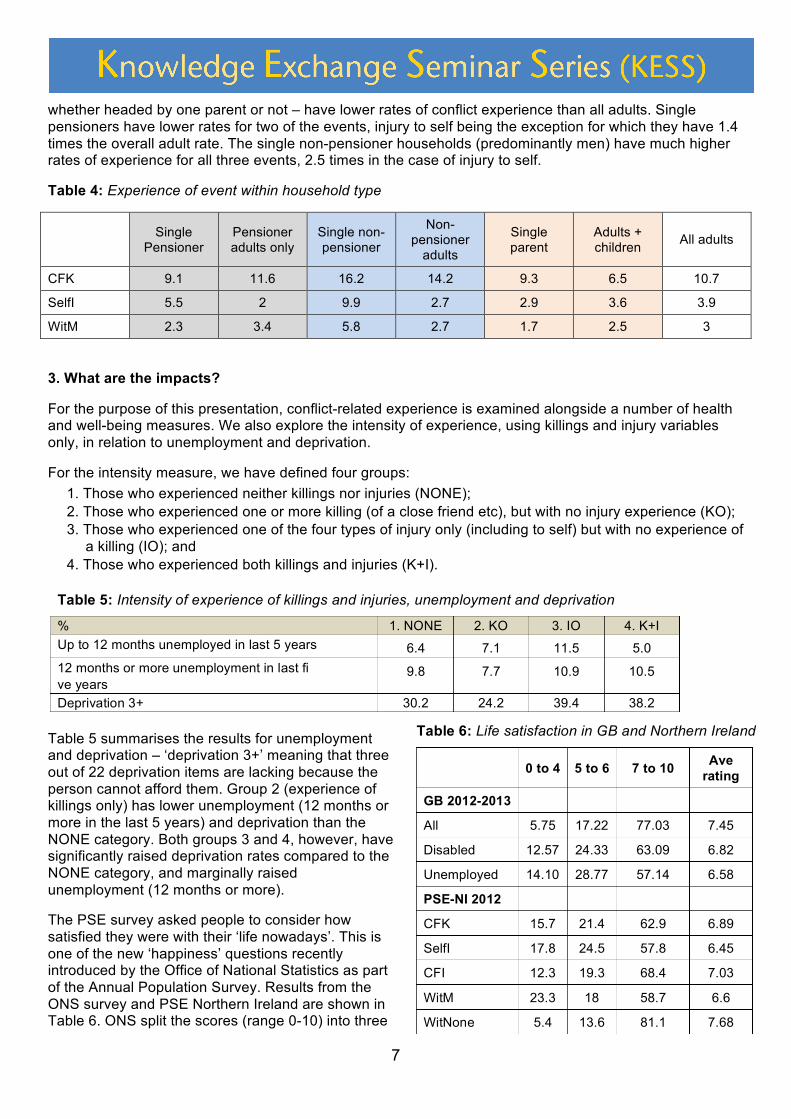
whether headed by one parent or not – have lower rates of conflict experience than all adults. Single pensioners have lower rates for two of the events, injury to self being the exception for which they have 1.4 times the overall adult rate. The single non-pensioner households (predominantly men) have much higher rates of experience for all three events, 2.5 times in the case of injury to self.
Table 4: Experience of event within household type
Single Pensioner
Pensioner adults only
Single non-pensioner
Non-pensioner
adults
Single parent
Adults + children All adults
CFK 9.1 11.6 16.2 14.2 9.3 6.5 10.7
SelfI 5.5 2 9.9 2.7 2.9 3.6 3.9
WitM 2.3 3.4 5.8 2.7 1.7 2.5 3
3. What are the impacts?
For the purpose of this presentation, conflict-related experience is examined alongside a number of health and well-being measures. We also explore the intensity of experience, using killings and injury variables only, in relation to unemployment and deprivation.
For the intensity measure, we have defined four groups: 1. Those who experienced neither killings nor injuries (NONE);
2. Those who experienced one or more killing (of a close friend etc), but with no injury experience (KO); 3. Those who experienced one of the four types of injury only (including to self) but with no experience of
a killing (IO); and 4. Those who experienced both killings and injuries (K+I).
Table 5 summarises the results for unemployment and deprivation – ‘deprivation 3+’ meaning that three out of 22 deprivation items are lacking because the person cannot afford them. Group 2 (experience of killings only) has lower unemployment (12 months or more in the last 5 years) and deprivation than the NONE category. Both groups 3 and 4, however, have significantly raised deprivation rates compared to the NONE category, and marginally raised unemployment (12 months or more).
The PSE survey asked people to consider how satisfied they were with their ‘life nowadays’. This is one of the new ‘happiness’ questions recently introduced by the Office of National Statistics as part of the Annual Population Survey. Results from the ONS survey and PSE Northern Ireland are shown in Table 6. ONS split the scores (range 0-10) into three
Table 6: Life satisfaction in GB and Northern Ireland
0 to 4 5 to 6 7 to 10 Ave rating
GB 2012-2013
All 5.75 17.22 77.03 7.45
Disabled 12.57 24.33 63.09 6.82
Unemployed 14.10 28.77 57.14 6.58
PSE-NI 2012
CFK 15.7 21.4 62.9 6.89
SelfI 17.8 24.5 57.8 6.45
CFI 12.3 19.3 68.4 7.03
WitM 23.3 18 58.7 6.6
WitNone 5.4 13.6 81.1 7.68
Table 5: Intensity of experience of killings and injuries, unemployment and deprivation
% 1. NONE 2. KO 3. IO 4. K+I Up to 12 months unemployed in last 5 years 6.4 7.1 11.5 5.0 12 months or more unemployment in last fi ve years
9.8 7.7 10.9 10.5
Deprivation 3+ 30.2 24.2 39.4 38.2

8
bands and also calculate the average score, which for the last two years has been above 7.40. In other words, the vast majority (>75%) will position themselves at a point between 7 and 10 on the scale. Less than 8 per cent will choose a value of 4 or below. The bottom row gives the life satisfaction scores of those who have not witnessed any conflict-related events: they are higher than the overall GB average for 2012-13.
This points towards a general finding that conflict-related experience has had a distinct affect on life satisfaction (yet to be fully explored). Certainly, particular experiences – witnessing a murder, close friend killed, injury to self – are associated with low life satisfaction scores, on a par with, or below, those of the disabled and unemployed in GB. Nearly a quarter of those who have witnessed a murder have a life satisfaction score of 0-4.
Table 7 adds to this picture by comparing the risk of poor health for those who have experienced conflict-related events with those who have not. For example, those who were themselves injured are 2.7 times as likely to be in ‘bad or very bad’ health compared to those with no injury. Similarly, those who had to move house are 1.9 times more likely to be in psychological stress (a GHQ score of 4 or more) than not moving house.
All of the conflict experiences are associated with a higher risk of poor mental and physical health except one: those who said they had been in prison were slightly less at risk (a risk ratio of 0.9) of a GHQ score of 4 or more. They are, however, 2.7 times as likely to be in bad or very bad health. For some conflict experiences, the risk of poor health is only marginally increased. Those witnessing a bombing have 1.2 times the risk of bad/very bad health; those who lost a close relative are only 1.1 times more likely to have a long-standing illness than those who did not. But other events are more significantly associated with poor health. Losing a close friend appears to be more important to adverse health than losing a close relative. Injury to self stands out as having the highest risk ratios across the board. Witnessing a murder, assault and other serious violence are all associated with high risk ratios, as are moving house, moving job and house searches (though less so). Conclusion
This is the first presentation of conflict-related data from the Poverty and Social Exclusion survey carried out in 2012. It shows that close to half the adult population have experienced death or injury of people close to them or of people they knew personally. More than half of all adults have witnessed a conflict-related violent event of some kind, such as a murder, bomb explosion, rioting or assault. Some events are more associated with the past but others, such as assaults and rioting, are an enduring part of conflict experience post-1998. A number of specific experiences are strongly imprinted on sections of the adult population in terms of physical and mental health. Such evidence is of direct relevance to a number of broad policy areas – health, disability, labour market activation and welfare reform – as well as the more specialist concerns of victims and survivors.
Table 7: Risk ratios of troubles experience vs no experience
Risk ratios GHQ 4+ General Health bad/very bad
Illness for 12 months
CFK 1.6 2.2 1.6 CRK 1.5 1.8 1.1 SEK 1.4 1.4 1.5 SelfI 2.4 2.7 2.1 CFI 1.5 1.7 1.5 CRI 1.5 2.3 1.3 SEI 1.4 1.7 1.5 WitB 1.3 1.2 1.4 WitM 1.8 2.4 1.4 WitG 1.6 1.7 1.5 WitR 1.4 1.5 1.3 WitA 1.9 2.3 1.4 WitO 2.2 2.1 1.3 PrisS 0.9 2.7 1.4 HSE 1.6 1.9 1.7 MVH 1.9 2.7 1.8 MVJ 1.9 1.9 1.4