Embed Size (px)
Citation preview

Leeds, Grenville & Lanark
District Health Unit
2019-22 Strategic Plan:
Information on the Health
of the Population in
Leeds, Grenville & Lanark

2
Introduction
WHAT IS CONTAINED IN THIS DOCUMENT
This document has been produced as a supporting population health information report to the Leeds, Grenville &
Lanark District Health Unit Strategic Plan 2019—2022. The purpose of the document is to provide a situational
assessment that informs the population health goals presented in the strategic plan. The population-level infor-
mation presented here helps to provide a baseline snapshot about the health and health-related behaviours of
the residents of Leeds, Grenville and Lanark, and includes indicators related to health equity, healthy infants and
children, healthy youth, healthy communities, and infectious diseases.
This link will take you to the Leeds, Grenville & Lanark District Health Unit Strategic Plan 2019—2022
WHAT IS HEALTH INEQUITY AND INEQUALITY
Inequality and inequity are two different concepts and are well defined here1: “The World Health Organization
(WHO) defines a health inequality as any difference in the distribution of health status or health determinants be-
tween different population groups. Health inequalities can be attributed to free choice, biological variations, the
physical environment, and factors beyond the control of the individuals concerned. For example, differences in
physical capabilities between elderly and younger people in the population would be considered an inequality. In
contrast, inequity is an ethical concept which reflects principles of social justice. Health inequities are defined as
inequalities in which the outcome is unnecessary and avoidable as well as unjust and unfair. For example, differ-
ences in health care accessibility between socio-economic groups may be interpreted as an inequality as well as
an inequity, while some differences in physical capabilities between elderly and younger people would not be con-
sidered an inequity as it is unavoidable. In general, differences due to biological variations, fully informed deci-
sions to participate in higher risk behaviours, and chance are not considered inequities. Many would describe
health inequalities across socioeconomic groups as unjust because they often reflect an unfair distribution of the
social determinants of health.”
“Health inequalities can be measured quantitatively while health inequities cannot. This is because identifying
health inequities requires the use of judgment regarding the social justice of an inequality, which may depend on
the causes of the inequality and the context of the local community. Better understanding of the causes and con-
text of health inequalities can also help PHUs to better target interventions and advocate for necessary changes.”
This report will focus on quantitative measures of health inequalities. Identifying inequalities is a first and im-
portant step in the identification of inequities.
NOTES:
1. Summary Measures of Socioeconomic Inequalities in Health. Toronto: Ontario Agency for Health Protection and Promotion (Public Health Ontario), 2013

3
Health Equity
KEY POINTS: INCOME STATUS BY NEIGHBOURHOOD
The income variable below is in Dissemination Area or DA format. The DA is a geographic measure created by
Statistics Canada that represents a geographic area containing between 400 and 700 persons. The size of the DA
can vary geographically depending upon the population density. An urban DA may only be a couple of city blocks
in size, whereas a DA in a rural area may be hundreds of square kilometers in size.
The highest income neighbourhoods tend to cluster in the municipalities to the north and east of the Leeds,
Grenville & Lanark (LGL) territory that border the Ottawa region. As well, there is clustering of high income
neighbourhoods along the St. Lawrence River shoreline and just to the south of Perth in the Municipalities of Tay
Valley and Rideau Lakes. Lower income category neighbourhoods tend to cluster around the larger population
centres.
NOTES:
The analysis presented above was originally included in the Leeds, Grenville & Lanark Community Health Profile that determined that some income, gender, age group and urban/rural health inequalities appear to exist within the Leeds, Grenville & Lanark District Health Unit’s geographic boundaries. The full profile can be found here: https://healthunit.org/about/health-statistics-reports/

4
Health Equity
KEY POINTS: HEALTH INEQUALITY RELATED TO INCOME
Individuals in the lowest income group were markedly different from individuals in the highest income group for
15 of the health indicators examined.
Diagnoses of chronic diseases, smoking cigarettes, a weak sense of community belonging, a lack of dental insur-
ance, food insecurity, physical inactivity, certain chronic diseases, and self-reported poor physical and mental
health were all higher among individuals with low income.
NOTES:
The analysis presented above was originally included in the Leeds, Grenville & Lanark Community Health Profile that determined that some income, gender, age group and urban/rural health inequalities appear to exist within the Leeds, Grenville & Lanark District Health Unit’s geographic boundaries. The full profile can be found here: https://healthunit.org/about/health-statistics-reports/
Indicator
Low Income > High Income High Income > Low Income No Difference
Diagnosis of an anxiety disorder Alcohol use above low risk drinking
guidelines Not having a flu shot in past 2-years
Diagnosis of asthma Never having a mammogram Less than 5 servings of daily fruit &
vegetables
Self-reported weak sense of community
belonging Never having a PAP test Injury in past 12-months
Not having dental insurance Injury due to fall in past 12-months
Diagnosis of diabetes Self rated moderate to extreme life
stress
Not taking folic acid supplementation
before last pregnancy Marijuana use in past 12-months
Food insecurity Self rated moderate to extreme
work stress
Self rated fair to poor health
Diagnosis of heart disease
Diagnosis of high blood pressure
Self rated fair to poor mental health
Diagnosis of a mood disorder
Physical Inactivity
Not having a regular medical doctor
Daily or occasional smoking

5
Health Equity
KEY POINTS: HEALTH INEQUALITY RELATED TO GENDER
Women were more likely than men to be physically inactive, food insecure, report moderate to extreme life and
work stress, have a diagnosed mood or anxiety disorder, and be injured due to a fall in the past 12-months.
Men were more likely than women to report drinking in excess of low risk drinking guidelines, use of marijuana,
smoking cigarettes, be injured in the past 12-months and be diagnosed with either diabetes and/or heart dis-
ease.
NOTES:
The analysis presented above was originally included in the Leeds, Grenville & Lanark Community Health Profile that determined that some income, gender, age group and urban/rural health inequalities appear to exist within the Leeds, Grenville & Lanark District Health Unit’s geographic boundaries. The full profile can be found here: https://healthunit.org/about/health-statistics-reports/
Indicator
Women > Men Men > Women No Difference
Physical Inactivity Alcohol use above low risk drinking
guidelines Not having dental insurance
Diagnosis of an anxiety disorder Not having a flu shot in past 2-years Diagnosis of high blood pressure
Diagnosis of asthma Less than 5 servings of daily fruit &
vegetables
Self rated fair to poor mental
health
Self-reported weak sense of communi-
ty belonging Marijuana use in past 12-months
Food insecurity Not having a regular medical doctor
Self rated fair to poor health Daily or occasional smoking
Injury due to fall in past 12-months Diagnosis of diabetes
Self rated moderate to extreme life
stress Diagnosis of heart disease
Diagnosis of a mood disorder Injury in past 12-months
Self rated moderate to extreme work
stress

6
Health Equity
KEY POINTS: HEALTH INEQUALITY RELATED TO URBAN/RURAL LIVING
Urban residents were more likely than rural residents to not have dental insurance, smoke cigarettes, be diag-
nosed with an anxiety and/or mood disorder, be diagnosed with diabetes and/or heart disease, not have a mam-
mogram for women, report high levels or life and work stress, poor physical health, and be food insecure.
Rural residents were more likely than urban residents to drink alcohol above low risk drinking guidelines, use ma-
rijuana, not have a PAP test for women, and be injured from a fall.
NOTES:
The analysis presented above was originally included in the Leeds, Grenville & Lanark Community Health Profile that determined that some income, gender, age group and urban/rural health inequalities appear to exist within the Leeds, Grenville & Lanark District Health Unit’s geographic boundaries. The full profile can be found here: https://healthunit.org/about/health-statistics-reports/
Indicator
Urban > Rural Rural > Urban No Difference
Not having dental insurance Alcohol use above low risk drinking
guidelines Not having a flu shot in past 2-years
Not taking folic acid supplementation
before last pregnancy Marijuana use in past 12-months
Less than 5 servings of daily fruit &
vegetables
Never having a mammogram Never having a PAP test Diagnosis of high blood pressure
Daily or occasional smoking Injury due to fall in past 12-months Physical Inactivity
Diagnosis of an anxiety disorder Not having a regular medical doctor
Self-reported weak sense of commu-
nity belonging Diagnosis of asthma
Diagnosis of diabetes Injury in past 12-months
Food insecurity
Self rated fair to poor health
Diagnosis of heart disease
Self rated moderate to extreme life
stress
Self rated fair to poor mental health
Diagnosis of a mood disorder
Self rated moderate to extreme work
stress

7
Health Equity
KEY POINTS: HEALTH INEQUALITY RELATED TO AGE
Older residents in LGL were more likely than younger residents to report being physically inactive, not have den-
tal insurance, smoke cigarettes, be diagnosed with a chronic disease such as diabetes, high blood pressure or
heart disease, be injured from a fall in the past 12-months, and report fair or poor physical and mental health.
Younger residents were more likely than older residents to report drinking in excess of low risk drinking guide-
lines, use of marijuana, be food insecure, have a weak sense of community belonging, and have suffered from an
injury in the past 12-months.
NOTES:
The analysis presented above was originally included in the Leeds, Grenville & Lanark Community Health Profile that determined that some income, gender, age group and urban/rural health inequalities appear to exist within the Leeds, Grenville & Lanark District Health Unit’s geographic boundaries. The full profile can be found here: https://healthunit.org/about/health-statistics-reports/
Indicator
Older > Younger Younger > Older No Difference
Not having dental insurance Alcohol use above low risk drinking
guidelines
Less than 5 servings of daily fruit &
vegetables
Diagnosis of high blood pressure Self-reported weak sense of commu-
nity belonging Diagnosis of an anxiety disorder
Physical Inactivity Not taking folic acid supplementa-
tion before last pregnancy
Self rated moderate to extreme life
stress
Not having a regular medical doctor Food insecurity
Self rated moderate to extreme work
stress Not having a flu shot in past 2-years
Daily or occasional smoking Marijuana use in past 12-months
Diagnosis of diabetes Never having a mammogram
Self rated fair to poor health Never having a PAP test
Diagnosis of heart disease Diagnosis of asthma
Injury due to fall in past 12-months Injury in past 12-months
Self rated fair to poor mental health
Diagnosis of a mood disorder

8
Health Equity
KEY POINTS: SHELTER COST OF LIVING STRESS
About 23% of the all households in LGL report spending 30% or more of monthly household income on shelter
costs.
Higher proportions of households in Smiths Falls and Prescott report spending 30% or more of monthly house-
hold income on shelter costs.
Lower proportions of households in Augusta and Beckwith report spending 30% or more of monthly household
income on shelter costs.
NOTES:
The 'Shelter-cost-to-income ratio' refers to the proportion of average total monthly income of a household which is spent on shelter costs including: mortgage, utilities, taxes, municipal services, and home maintenance and up-keep. Spending more than 30% of monthly household income on housing can be considered to be an indicator of potential household financial stress.

9
Health Equity
KEY POINTS: HOUSEHOLD INCOME AND LOW INCOME STATUS
Higher proportions of the population living below the low income measure after-tax (LIM-AT) are associated with
lower overall median household income.
Higher proportions of households in Prescott, Smiths Falls and Brockville report living below the low income
measure after-tax measure than those in Beckwith, North Grenville and Augusta.
NOTES:
The low income measure after tax (LIM-AT) refers to a fixed percentage (50%) of median adjusted after-tax house-hold income. The household after-tax income is adjusted by an equivalence scale to take economies of scale into account. This adjustment for differences in household sizes reflects the fact that a household’s needs increase, but at a decreasing rate, as the number of members increases.
Municipality Median HH Income ($) LIM-AT (%)
Prescott 42624 25.9 Smiths Falls 43813 24.7 Brockville 46473 20.9 Westport 45483 18.8 Perth 46966 18.2 Gananoque 49536 16.4 Lanark Highlands 59502 16.2 Edwardsburgh/Cardinal 62405 12.3 Montague 65621 12.1 Carleton Place 62560 12.0 Rideau Lakes 63264 11.8 Merrickville-Wolford 63795 11.3 Tay Valley 68181 11.2 Front of Yonge 64811 10.9 Athens 63648 10.5 Elizabethtown-Kitley 68873 10.1 Mississippi Mills 72540 9.4 Drummond/North Elmsley 70229 9.1 Leeds and the Thousand Islands 67152 8.7 Augusta 69212 7.6 North Grenville 77279 7.1 Beckwith 86202 4.9 UCLG 60569 13.0 Lanark County 63058 12.8

10
Health Equity
KEY POINTS: SOCIAL DETERMINANTS OF HEALTH SURVEY (SDOH)
Access to quality and timely healthcare is rated as the top SDOH factor as being very or extremely important in
helping make a person healthy at about 97% overall by survey respondents aged 18+ years in LGL.
Lifestyle choices, ability to cope, safe and affordable housing and social networks all scored in the top 5 SDOH
factors as being very or extremely important in helping make a person healthy by LGL survey respondents.
How much money a person has was rated as the bottom SDOH factor as being very or extremely important in
helping make a person healthy at about 31% overall by survey respondents aged 18+ years in LGL .
NOTES:
In this survey, LGL adults aged 18+ years were asked to rate how important (not at all, not very, somewhat, very, or extremely) they felt 10 factors related to the Social Determinants of Health were in helping make a person healthy. The survey defined “healthy” as “a person’s physical and mental health, being free from disease and pain, and be-ing satisfied with life”.

11
Healthy Infants and Children
KEY POINTS: PERINATAL & REPRODUCTIVE HEALTH—PREGNANCY RATE
The pregnancy rate for women of reproductive age (15—49 years) in Ontario overall has been decreasing slightly
since 2004. The pregnancy rate for women of reproductive age in LGL has been increasing steadily since 2004
and is now similar to that of Ontario overall.
NOTES:
The pregnancy rate is the ratio of the number of pregnancies (live births, still births, therapeutic abortions) during
a calendar year per 1,000 females of the population aged between 15 and 49 years. The pregnancy rate focusses
on mothers only and controls for age distribution.

12
KEY POINTS: PERINATAL & REPRODUCTIVE HEALTH—LOW BIRTH WEIGHT & PRETERM BIRTHS
Rates for low birthweight live births have been trending upwards in Ontario overall since 2004 but have trended
downwards in LGL during this same timeframe.
The overall trends for rates of premature births in both Ontario overall and LGL have been downward since 2009.
NOTES:
Birth weights are the weight of an infant at the time of delivery and are measured within the first hour of life for
live births. Birth weight categories are defined as follows: Low birth weight: live birth weighing between 1501
grams and 2499 grams, Very low birth weight: live birth weighing 1500 grams or less.
Preterm births are defined as the ratio of live births with a gestational age of less than 37 weeks per total live
births for women aged 15 to 49 years.
Healthy Infants and Children

13
KEY POINTS: PERINATAL & REPRODUCTIVE HEALTH—THERAPUTIC ABORTIONS
The trend for rates of therapeutic abortions in Ontario overall has been downwards since 2007 and downwards in
LGL since 2012.
Teen therapeutic abortion rates have been downwards in Ontario overall since 2007 and LGL since 2010.
NOTES:
Therapeutic abortion is a term used to describe a deliberate termination of a pregnancy. This termination is not a
result of miscarriages or spontaneous abortions. The therapeutic abortion rate is the ratio of therapeutic abor-
tions per thousand women aged 15 to 49 years (15 to 19 years for teens).
Healthy Infants and Children

14
KEY POINTS: DRUG & ALCOHOL USE DURING PREGNANCY
About 14% of women in LGL report smoking during pregnancy. The majority of women who smoke report smok-
ing less than ten cigarettes per day.
About 2% of women in LGL report drinking alcohol during pregnancy. Alcohol use ranges from one drink per
month to binge drinking.
About 5.5% of women in LGL report some drug use during pregnancy. Cannabis was the most common reported
drug used.
NOTES:
The following indicators of tobacco, drug and alcohol use were created by dividing the number of women who
smoked or took one or more drugs and substances or drank alcohol during pregnancy expressed as a percentage
of the total number of women who had live or still births in 2017.
Healthy Infants and Children

15
KEY POINTS: INFANT FEEDING STATUS
About 75% of mothers in LGL report exclusive breastfeeding at 72-hours post-partum compared to about 58% in
Ontario overall.
Exclusive breastfeeding declines to about 51% at six months post-partum in LGL.
NOTES:
Slight discrepancies between the BORN and LGLDHU Infant Feeding Survey are an artifact of the differing sur-
vey methodologies.
Healthy Infants and Children

16
KEY POINTS: HEALTHY BABIES—HEALTHY CHILDREN (HBHC) ASSESSMENTS
About 10% of HBHC assessments received were confirmed to be identified with risk in 2017 in LGL.
The trend since 2015 has been quite variable year-over-year.
NOTES:
Assessments “identified with risk” identifies vulnerable families that would most benefit from targeted interven-
tions during the time between pregnancy and a child’s transition to school.
Healthy Infants and Children

17
KEY POINTS: EARLY DEVELOPMENT INSTRUMENT
The two highest vulnerability categories in terms of developmental expectations for kindergarten-aged children
in LGL are Physical Health & Well Being and Emotional Maturity.
NOTES:
The Early Development Instrument (EDI) measures a child’s ability to meet age-appropriate expectations at
school entry.
Healthy Infants and Children

18
Healthy Youth
KEY POINTS: RECREATIONAL DRUG USE AMONG HIGH SCHOOL STUDENTS
The trends for the use of cigarettes, cannabis and alcohol by students in grades 9 to 12 have been downwards in
LGL since 2009.
The trends for the non-medicinal use of over-the-counter (OTC) cough medicine and opioid pain relievers by stu-
dents in grades 9 to 12 have been downwards in LGL since 2009.
NOTES:
The use of all of the drugs presented on this page was stated as being for recreational purposes and not drugs
prescribed by a doctor or nurse practitioner for medical reasons.

19
KEY POINTS: RECREATIONAL DRUG USE AMONG HIGH SCHOOL STUDENTS
The majority of students who reported using cannabis, report first trying it in secondary school.
About a third of students report first trying cannabis in primary school.
NOTES:
About 10% of grade 9 to 12 students in LGL who do not currently use cannabis said that they would consider try-
ing cannabis if it were legalized.
Healthy Youth

20
KEY POINTS: ALCOHOL USE AMONG STUDENTS
About 61% of primary and secondary school students report using alcohol in the past 12-months.
The trend for alcohol use is associated with age.
Similar proportions of males and females report using alcohol.
NOTES:
Estimates excludes students who reported only having a few sips of alcohol but includes those who drank only on
special occasions.
Healthy Youth
21
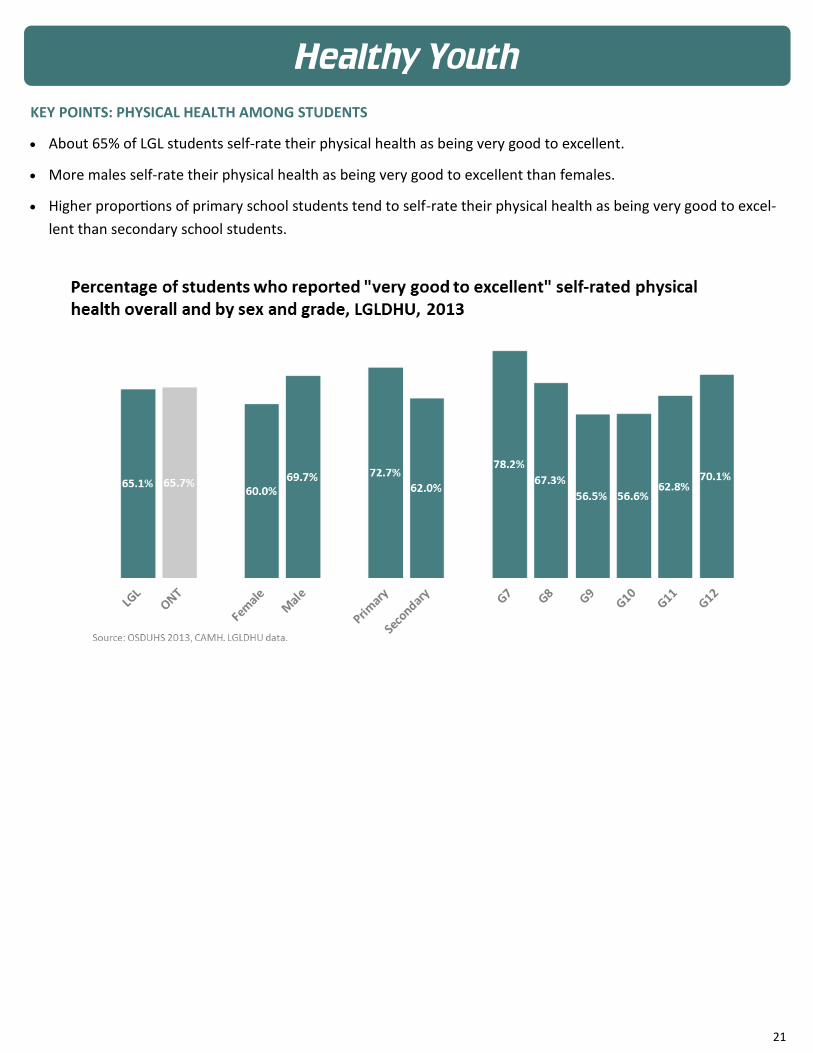
KEY POINTS: PHYSICAL HEALTH AMONG STUDENTS
About 65% of LGL students self-rate their physical health as being very good to excellent.
More males self-rate their physical health as being very good to excellent than females.
Higher proportions of primary school students tend to self-rate their physical health as being very good to excel-
lent than secondary school students.
Healthy Youth

22
KEY POINTS: PHYSICAL ACTIVITY AMONG STUDENTS
About 56% of LGL students report that they are physically active for at least 60-minutes a day for 5 or more days
per week.
About 12% of students report that they are physically active for 60-minutes per day for 1 or fewer days per week.
A total of 57% of students report that they spend 2 or more hours per day watching TV, gaming, watching videos.
NOTES:
In Canada, an accumulation of at least 60-minutes of moderate to vigorous physical activity per day is recom-
mended for children and youth.
Screen time of 2 hours or less per day is recommended. Screen time also includes texting, Skype, social media,
etc.
Healthy Youth

23
KEY POINTS: YOUTH MENTAL HEALTH
About 19% of LGL students self-rate that their mental health is fair to poor.
Female and secondary school students report higher proportions of fair to poor mental health.
NOTES:
Questions asking respondents to self-rate their health have been shown to be reliable and valid measures and
predictors of emotional well-being among adolescents.
Healthy Youth

24
KEY POINTS: FEELING SAFE AT SCHOOL
About 17% of LGL students report that they do not feel safe at their school.
The highest proportions of students reporting not feeling safe at school are in primary schools.
NOTES:
This question asked students if they were worried whether someone would harm or threaten them or take some-
thing from them.
Healthy Youth

25
KEY POINTS: BULLYING
The overall trend in bullying behaviour is downward. However, about one in three students still report being bul-
lied in LGL.
The most common way students are bullied is through verbal attacks at about 81% followed by physical attacks at
about 15%.
NOTES:
Bullying is defined as when one or more people tease, hurt or upset a weaker person on purpose repeatedly. It
also includes deliberately leaving someone out on things on purpose.
Healthy Youth

26
KEY POINTS: STUDENT IMMUNIZATION
The percentage of 7 and 8 year olds in compliance with ISPA increased about 3% from 2015/2016 to 2016/2017
school years.
The percentage of 16 and 17 year olds in compliance with ISPA decreased about 4% from 2015/2016 to
2016/2017 school years.
The percentage of school-aged children completing HPV, Hepatitis B and Meningococcus vaccinations have been
consistent or have increased from 2014 to 2017.
NOTES:
ISPA is the Immunization of School Pupils Act.
Healthy Youth

27
Healthy Youth
KEY POINTS: CARIES-FREE DENTAL EXAMS
The percentage of caries-free Junior Kindergarten, Senior Kindergarten and Grade 2 students in LGL has increased
from about 80% in 2012 to about 90% in 2016.

28
Healthy Communities
KEY POINTS: PHYSICAL HEALTH
About 87% of the overall population of LGL self-report having good to excellent overall health. About 13% of the
population self-report fair to poor overall health.
Self-reporting of higher proportions of fair to poor overall health is more common in older age groups.
NOTES:
This question dealt with overall health status. The respondent was asked to rate their health on a 5-point scale as
being between excellent to poor. The response categories of fair and poor were combined to demonstrate poor
self-rated health.

29
KEY POINTS: MENTAL HEALTH
About 93% of the overall population of LGL self-report having good to excellent mental health. About 8% of the
population self-report fair to poor mental health.
Higher proportions in the 25 to 64-year age groups self-report fair to poor mental health more often than other
age groups.
NOTES:
This question dealt with mental health status. The respondent was asked to rate their mental health on a 5-point
scale as being between excellent to poor. The response categories of fair and poor were combined to demon-
strate poor self-rated mental health.
Healthy Communities

30
KEY POINTS: ANXIETY DISORDER DIAGNOSIS
About 92% of the overall population of LGL report not being diagnosed with an anxiety disorder. About 8% of the
population report being diagnosed with an anxiety disorder.
Higher proportions in the 45 to 64-year age group report being diagnosed with an anxiety disorder more often
than other age groups.
NOTES:
Survey respondent were asked if they had been diagnosed with a phobia, obsessive-compulsive disorder or panic
disorder by a health care professional, and if the diagnosis was expected to last for at least 6-months or had al-
ready lasted for 6-months or more.
Healthy Communities

31
KEY POINTS: MOOD DISORDER DIAGNOSIS
About 89% of the overall population of LGL report not being diagnosed with a mood disorder. About 11% of the
population report being diagnosed with a mood disorder.
Higher proportions in the 45 to 64-year age group report being diagnosed with a mood disorder more often than
other age groups.
NOTES:
Survey respondents were asked if they had been diagnosed with depression, bipolar, mania or dysthymia by a
health care professional, and if the diagnosis was expected to last for at least 6-months or had already lasted for 6
-months or more.
Healthy Communities

32
KEY POINTS: ASTHMA DIAGNOSIS
About 90% of the overall population of LGL report not being diagnosed with asthma. About 10% of the popula-
tion report being diagnosed with asthma.
Higher proportions in the 12 to 44-year age groups report being diagnosed with asthma more often than older
age groups.
NOTES:
Survey respondent were asked if they had been diagnosed with asthma by a health care professional, and if the
diagnosis was expected to last for at least 6-months or had already lasted for 6-months or more.
Healthy Communities
33
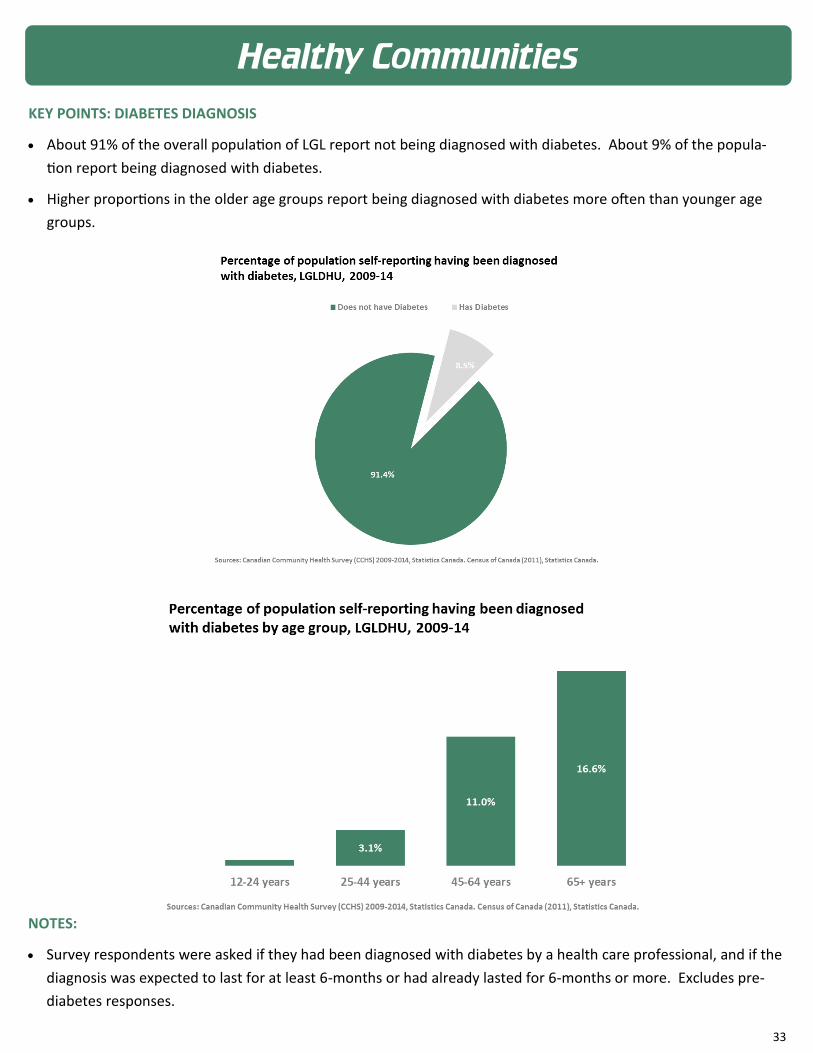
KEY POINTS: DIABETES DIAGNOSIS
About 91% of the overall population of LGL report not being diagnosed with diabetes. About 9% of the popula-
tion report being diagnosed with diabetes.
Higher proportions in the older age groups report being diagnosed with diabetes more often than younger age
groups.
NOTES:
Survey respondents were asked if they had been diagnosed with diabetes by a health care professional, and if the
diagnosis was expected to last for at least 6-months or had already lasted for 6-months or more. Excludes pre-
diabetes responses.
Healthy Communities

34
KEY POINTS: HEART DISEASE DIAGNOSIS
About 94% of the overall population of LGL report not being diagnosed with heart disease. About 6% of the pop-
ulation report being diagnosed with heart disease.
Higher proportions in the oldest age group report being diagnosed with heart disease more often than younger
age groups.
NOTES:
Survey respondent were asked if they had been diagnosed with heart disease by a health care professional, and if
the diagnosis was expected to last for at least 6-months or had already lasted for 6-months or more.
Healthy Communities

35
KEY POINTS: FALL-RELATED INJURY
About 64% of the overall population of LGL report not being injured due to a fall. About 36% of the population
report being injured due to a fall.
Higher proportions of the population in both the youngest and oldest age groups report being injured due to a
fall.
NOTES:
Survey respondents asked if they had sustained an injury in the past 12-months which was serious enough to limit
their normal activities the day after the injury occurred and if the injury was the result of a fall.
Healthy Communities

36
KEY POINTS: ALCOHOL USE ABOVE LOW RISK DRINKING GUIDELINES
About 91% of the overall population of LGL report not drinking above low risk drinking guidelines. About 9% of
the population report drinking above low risk drinking guidelines.
Higher proportions in the younger age groups report drinking in excess of low risk drinking guidelines.
Income does not appear to affect drinking in excess of low risk drinking guidelines.
Men are more likely than women to report exceeding low risk drinking guidelines. However, women in the high-
est income group are more likely to engage in high risk alcohol use.
NOTES:
Survey respondents were asked the average number of drinks consumed per day during the week prior to the
interview. This variable was then calculated to determine if drinking behaviour was above low risk drinking guide-
lines set out by the Centre for Addiction and Mental Health (CAMH).
Healthy Communities

37
KEY POINTS: DENTAL INSURANCE
About 65% of the overall population of LGL report having dental insurance. About 35% of the population report
not having dental insurance.
Higher proportions in the oldest age group report not having dental insurance.
About 65% in the lowest income group compared to about 16% in the highest income group report not having
dental insurance.
Men and women have an equal likelihood of not having dental insurance in all income groups.
NOTES:
Survey respondents were asked if they had insurance that covered all or part of the cost of dental expenses. This could include government sponsored, employer sponsored or private plans.
Healthy Communities

38
KEY POINTS: FOOD INSECURITY
About 93% of the overall population of LGL report being food secure. About 7% of the population report being
food insecure.
Higher proportions in the youngest age groups report being food insecure.
About 19% in the lowest income group compared to about 1% in the highest income group report being food in-
secure.
Women are more likely than men to report being food insecure.
NOTES:
This variable was based on a set of 18 questions and described the food security situation of the household in the previous 12 months. It captured three kinds of situations: 1- Food secure: No, or one, indication of difficulty with income-related food access. 2- Moderately food insecure: Indication of compromise in quality and/or quantity of food consumed. 3- Severely food insecure: Indication of reduced food intake and disrupted eating patterns. The response categories of moderate and severe were combined to demonstrate food insecurity.
Healthy Communities

39
KEY POINTS: DAILY FRUIT & VEGETABLE CONSUMPTION
About 40% of the overall population of LGL report eating 5 or more servings of fruits or vegetables daily. About
60% of the population report eating less than 5 servings of fruits or vegetables daily.
Similar proportions in all age groups report eating less than 5 servings of fruits or vegetables daily. However, the
oldest age group report consuming more daily fruits and vegetables than all other age groups.
Similar proportions in all income groups report eating less than 5 servings of fruits or vegetables daily.
Men are more likely than women to report eating less than 5 servings of fruits or vegetables daily.
NOTES:
This question classified the respondent based on the total number of times per day he/she ate fruits and vegeta-bles but not the amount consumed. This indicator was used as a proxy for a healthy diet, which is related to the risk for chronic disease.
Healthy Communities

40
KEY POINTS: SELF-RATED LIFE STRESS
About 78% of the overall population of LGL self report little to no life stress. About 22% of the population self
report quite a bit or extreme life stress.
Quit a bit or extreme life stress increased with age group until dropping off after the age of 65+ years.
Similar proportions in all income groups self report quite a bit or extreme life stress.
Women are more likely than men to self report quite a bit or extreme life stress across all income groups except
for the lowest income group.
NOTES:
This question dealt with the amount of perceived stress in a person’s life. The respondent was asked to rate their life stress on a 5-point scale as being between not at all stressful and extremely stressful. The response categories of quite a bit and extreme were combined to demonstrate life stress.
Healthy Communities

41
KEY POINTS: PHYSICAL INACTIVITY
About 60% of the overall population of LGL report being physically active during their leisure time. About 40% of
the population report being physically inactive during their leisure time.
Physical inactivity increases with age. A higher proportion of individuals in the 65+ age group report being physi-
cally inactive than those in younger age groups.
About 51% of respondents in the lowest income group report being physically inactive compared to about 33% in
the highest income group.
Women are more likely than men to report being physically inactive in both the intermediate and highest income
groups.
NOTES:
This variable classified respondents according to their pattern or regularity of leisure time physical activity lasting more than 15-minutes. The variable used physical activity not related to work. The variable categorized respond-ents as being “active”, “moderately active” or “inactive based on their calculated total daily energy expenditure values.
Healthy Communities

42
KEY POINTS: CIGARETTE SMOKING
About 76% of the overall population of LGL report currently being a non-smoker. About 24% of the population
report currently smoking cigarettes.
Higher proportions of individuals in the 25 to 44 and 45 to 64 year age groups report being a current cigarette
smoker.
About 38% of respondents in the lowest income group report being a current cigarette smoker compared to
about 16% in the highest income group.
Men are more likely than women to report being a current cigarette smoker across all income groups.
NOTES:
Survey respondents were asked if they currently smoke daily, occasionally or not at all. Both daily and occasionally constituted smoking for the purposes of this report.
Healthy Communities

43
KEY POINTS: WORK STRESS
About 73% of the overall population of LGL self-report little to no work stress. About 27% of the population self
report having quite a bit to extreme amounts of work stress.
Higher proportions of individuals in the 45 to 64 year age group self report having quite a bit to extreme work
stress compared to other age groups.
A similar proportion in all income groups self-report quite a bit to extreme amounts of work stress.
Women were more likely to report quite a bit to extreme amounts of work stress than men in both the lowest
and intermediate income groups.
NOTES:
This question dealt with the amount of perceived stress in a person’s work life. The respondent was asked to rate their work stress on a 5-point scale as being between not at all stressful and extremely stressful. The response cat-egories of quite a bit and extreme were combined to demonstrate work stress.
Healthy Communities

44
KEY POINTS: FALL-RELATED INJURY
About 80% of falls that require a hospital admission occur in the oldest age group.
About 59% of falls requiring a hospital admission occur in the home followed by about 18% that occur in an assist-
ed living or long-term care facility.
NOTES:
Data supplied from provincial hospital admission databases for residents of LGL (Discharge Abstract Database).
Healthy Communities

45
KEY POINTS: HARM REDUCTION—NEEDLE EXCHANGE
About a quarter million needles were provided to needle exchange clients by the Health Unit in 2017. This is
more than 2.5 times the number provided in 2013.
The number of client interactions for the needle exchange program has increased about 4-fold since 2013. The
largest increase has occurred in the male population.
NOTES:
Data supplied from internal health unit Smart Works databases. Smart Works is a program that works in our com-
munities to limit the harm associated with drug use.
Healthy Communities

46
KEY POINTS: HARM REDUCTION—OPIOIDS
The trend of both counts and the crude rate per 100,000 population for emergency department visits related to
narcotics has been increasing in LGL since 2007.
NOTES:
Data supplied from provincial hospital emergency department visit databases for residents of LGL (National Am-
bulatory Care Database).
Healthy Communities

47
KEY POINTS: FOOD & WATER INSPECTIONS
The Health Unit does inspections for food preparation facilities on a yearly basis. In 2017 a total of 2204 premises
were inspected across LGL to ensure adherence to provincial regulations.
Inspections related to public beaches, drinking water systems, spas and swimming pools are also carried out an-
nually across LGL.
NOTES:
Data supplied from LGLDHU Community Health Protection databases.
Healthy Communities

48
KEY POINTS: WATER TESTING FOR PRIVATE WELLS
The Health Unit provides water testing for privately owned wells to the public. In 2017, just under 12,000 water
samples were submitted for testing.
In 2017, water testing done by the Health Unit determined that about 18% of submitted samples showed contam-
ination from bacterial pathogens rendering the water unsafe to use domestically.
NOTES:
Data supplied from LGLDHU Community Health Protection databases.
Healthy Communities

49
Infectious Diseases
KEY POINTS: SEXUALLY TRANSMITTED INFECTIONS
The trend for rates of diagnosed Chlamydial infections continues to increase in LGL year-over-year.
The trend for rates of diagnosed Gonorrhoea infections continues to increase in LGL year-over-year.
The trend for rates of diagnosed Syphilis infections continues to increase in LGL year-over-year.
NOTES:
Rates smoothed to a 3-year moving average to eliminate year-over-year variability in the crude rates.

50
KEY POINTS: SEXUALLY TRANSMITTED INFECTIONS
The trend for rates of diagnosed Hepatitis C infections continues to decrease in LGL year-over-year.
NOTES:
Rates smoothed to a 3-year moving average to eliminate year-over-year variability in the crude rates.
Infectious Diseases

51
KEY POINTS: ENTERIC INFECTIONS
The trend for rates of diagnosed Campylobacter infections continues to increase in LGL year-over-year.
The trend for rates of diagnosed Salmonellosis infections continues to increase in LGL year-over-year.
The trend for rates of diagnosed Giardiasis infections continues to increase in LGL year-over-year.
NOTES:
Rates smoothed to a 3-year moving average to eliminate year-over-year variability in the crude rates.
Infectious Diseases

52
KEY POINTS: PERTUSSIS (WHOOPING COUGH)
The trend for rates of diagnosed Pertussis infections has been variable in LGL year-over-year.
NOTES:
Rates smoothed to a 3-year moving average to eliminate year-over-year variability in the crude rates.
Infectious Diseases
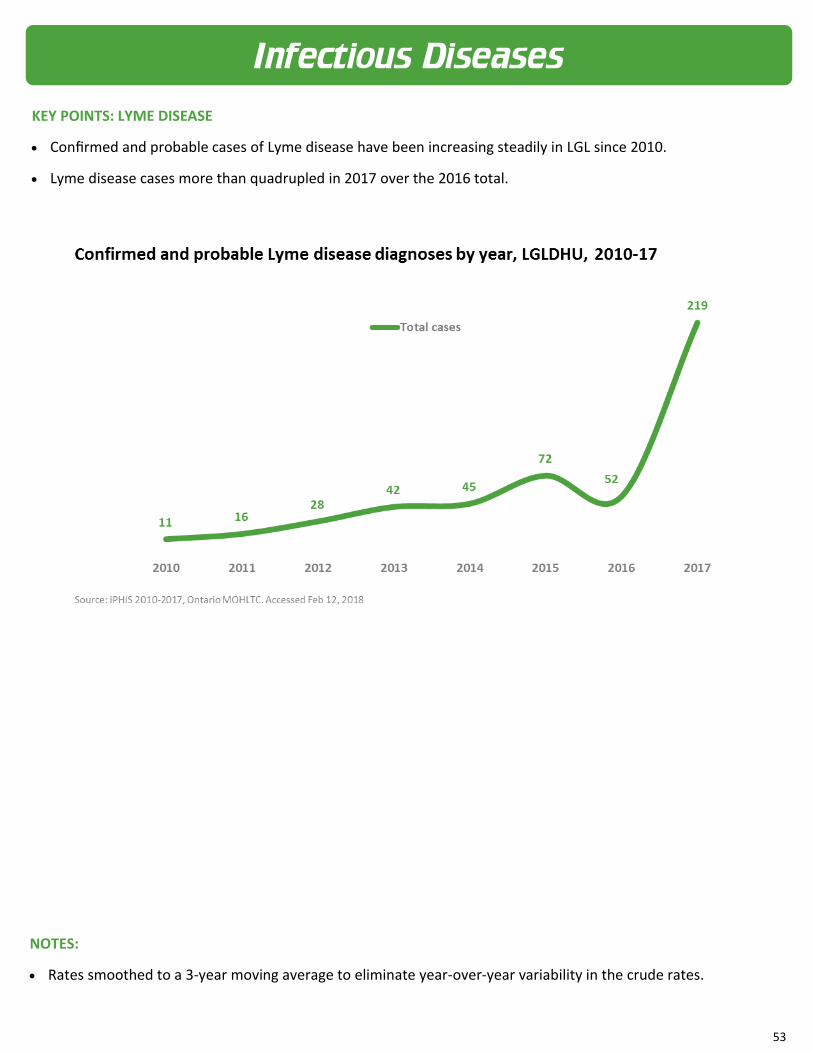
53
KEY POINTS: LYME DISEASE
Confirmed and probable cases of Lyme disease have been increasing steadily in LGL since 2010.
Lyme disease cases more than quadrupled in 2017 over the 2016 total.
NOTES:
Rates smoothed to a 3-year moving average to eliminate year-over-year variability in the crude rates.
Infectious Diseases

54
KEY POINTS: LYME DISEASE
The geographic distribution of confirmed and probable cases of Lyme disease has been increasing steadily in LGL
since 2010.
The initial geographic concentration of Lyme disease cases was in the south-west areas of LGL in 2010 (top
graphic). By 2017 the case distribution has increased to more northern and north-eastern geographic areas in
LGL (bottom graphic).
NOTES:
About 100 case addresses were not able to be plotted on these maps suggesting that the mapped geographic
distribution may be an underreporting of the actual Lyme case distribution.
Infectious Diseases