Embed Size (px)
Citation preview

LEE COUNTY BUSINESS
CLIMATE SURVEY REPORT Second Quarter, 2016
Prepared in partnership with:
and
The Regional Economic Research Institute • Florida Gulf Coast University

Project Staff
Dr. Christopher Westley, Director
John Shannon, Economist
Nicholas Holst, Lead Student Researcher
Monique Carlone, Student Researcher
Alesa Whitehead, Student Researcher
Report Information
This report is conducted quarterly by the Horizon Council of Lee County, Florida, and
Florida Gulf Coast University’s Regional Economic Research Institute. This work would not
be possible without considerable cooperation from the Horizon Council’s Chairs, the RERI’s
student researchers, and the Lee County Economic Development Council.
The Regional Economic Research Institute studies, analyzes are reports on the regional
economy encompassing Collier, Lee, Charlotte, Hendry, and Glades counties. Established
in 2005, it serves as a public service and economic development unit of the Lutgert College
of Business’ Dean’s Office and strives to connect Southwest Florida to the resources of
Florida Gulf Coast University.
The Institute’s Business Climate Survey group specializes in sampling design and analysis,
including program evaluation, policy research, and needs assessment. The Business
Climate Survey group involves FGCU students in every stage of survey development,
allowing them to develop professional skills and networks that add value to their degrees
and, by extension, to their future employers.
Regional Economic Research Institute
Lutgert College of Business
Florida Gulf Coast University
10501 FGCU Blvd, S.
Fort Myers, FL 33965-6565
(239) 590-1000
http://www.fgcu.edu/cob/reri/
Photo Credits: Shutterstock, Lee County Economic Development Office
1 Regional Economic Research Institute
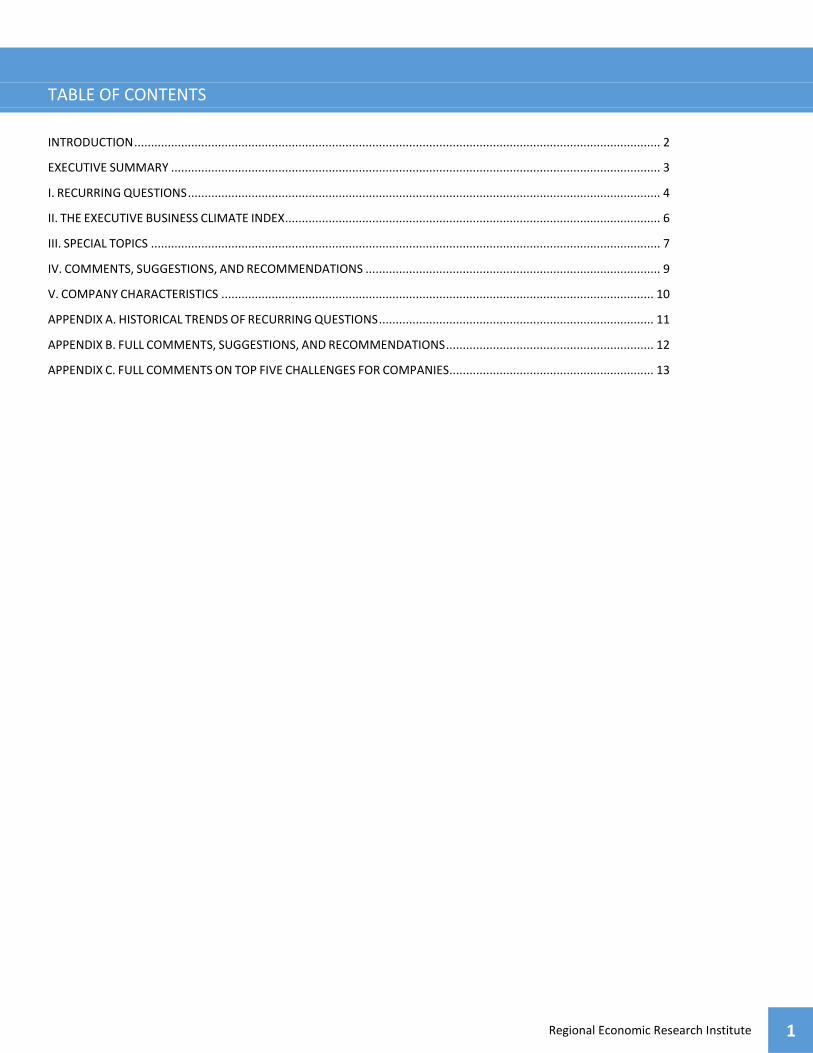
TABLE OF CONTENTS
INTRODUCTION ............................................................................................................................................................. 2
EXECUTIVE SUMMARY .................................................................................................................................................. 3
I. RECURRING QUESTIONS ............................................................................................................................................. 4
II. THE EXECUTIVE BUSINESS CLIMATE INDEX ................................................................................................................ 6
III. SPECIAL TOPICS ........................................................................................................................................................ 7
IV. COMMENTS, SUGGESTIONS, AND RECOMMENDATIONS ........................................................................................ 9
V. COMPANY CHARACTERISTICS ................................................................................................................................. 10
APPENDIX A. HISTORICAL TRENDS OF RECURRING QUESTIONS .................................................................................. 11
APPENDIX B. FULL COMMENTS, SUGGESTIONS, AND RECOMMENDATIONS .............................................................. 12
APPENDIX C. FULL COMMENTS ON TOP FIVE CHALLENGES FOR COMPANIES ............................................................. 13
2 Executive Business Climate Survey Report, 2016 Q2
INTRODUCTION
The Lee County Business Climate Survey Report, published in partnership
between the Horizon Council and Florida Gulf Coast University, provides primary
research to the business community, elected officials, and other concerned
citizens in an effort to gauge the state of Lee County’s economy over time as well
as impressions and concerns about it in the future.
Since the beginning of this partnership, the BCS has been comprised of three
areas of focus. The first area—encompassed in the first seven questions of the
survey—focuses on Lee County business executives’ impressions of economic conditions and trends with respect to hiring and
investment. The second area has been the calculation of an Executive Business Climate Index. This EBCI provides a summary number
which will allow one to quickly gauge whether the business climate in Lee County is improving or declining. Finally, the third area has
been various questions that change from survey to survey. In the past, these “Special Topics” have focused on areas such as business
executives’ concerns about interest rates and access to capital, firms’ demand for critical occupations and their ability to find workers
within those occupations, the cost of doing business in Lee County, and even concern for employee wellness and wellness programs.
The BCS also allows respondents to voice concerns, kudos, and criticisms of Lee County’s economic environment. Every effort is made
to include these comments in each survey.
The Horizon Council FGCU Business Climate Survey is administered, written, and published by the staff and students working with the
Regional Economic Research Institute in the Lutgert College of Business. We very much welcome your comments and suggestions
regarding the report, including suggestions for Special Topics questions for future editions.
This survey would not have been possible without the many busy business owners and executives who took the time to respond to it.
I also thank John Boland, Glen Salyer, and their colleagues at the Lee County Economic Development Office; Robert Beatty, Dean of
Lutgert College of Business at FGCU; Russell Schropp, Chair of the Horizon Council’s Business Issues Taskforce; and Michael Quaintance
of Keiser University. CareerSource Southwest Florida’s James Wall and Peg Elmore provided valuable input and advice.
Christopher Westley Dr. Christopher Westley Director, Regional Economic Research Institute Lutgert College of Business Florida Gulf Coast University Fort Myers, Florida 33965-6565

3 Regional Economic Research Institute
EXECUTIVE SUMMARY
The Executive Business Climate Survey provides a view of the local economy that is based on responses from senior executives from
a range of industries across the county. An invitation to complete the internet survey was sent to 565 executives and business owners
in Lee County. Eighty-eight executives completed the survey from April 18, 2016, through May 2, 2016. Four reminders were sent
during the survey period.
This survey provides a key economic indicator for Lee County, the Executive Business Climate Index. This index value is computed each
quarter and released to the public as a way to provide an established economic indicator on the state of the local economy. The index
is computed using the two questions concerning the current and future economic conditions and a third question concerning the
expected industry economic conditions. The index is an average of the responses, with substantially better equal to 100, moderately
better equal to 75, same equal to 50, moderately worse equal to 25 and substantially worse equal to zero. The index value can range
from 0 to 100.
The results from the second quarter survey reflect a five-point decline from the first quarter 2016 measure, with the index falling from
68 to 63. This marks the lowest EBCI since the second quarter 2012, when the EBCI was calculated at 62.
The current survey’s Special Topics section focuses on the cost of doing business, prices, the state of the economy, and primary
business challenges for business in Lee County. Other findings of the Business Climate Survey for the second quarter of 2016 include:
59 percent of executives stated that the current economic conditions have improved over last year, while 33 percent stated
that they were the same;
50 percent of the executives expect the economy to improve over the next year;
50 percent of the executives stated that the current economic conditions for their industry have improved over last year, but
32 percent stated that economic conditions remained approximately the same, and 18 percent indicated they are moderately
worse;
49 percent of executives expect economic conditions for their industry to improve over the next year;
58 percent of companies expect to increase investment next year while 2 percent expect to reduce investment levels;
50 percent of executives had increased employment over the last year, while 2 percent had reduced employment;
44 percent of executives expect to increase employment at their companies during the next year, while 56 percent of
executives plan to remain at the same level;
79 percent of executives indicate that the cost of doing business has increased by no more than 5 percent over the past year;
12 percent of executives believe that the cost of doing business will increase by at least 5 percent over the next year;
41 percent of executives indicate that they have increased prices by at least 2 percent over the past year;
87 percent of executives stated they are optimistic about the Southwest Florida economy over the next year;
88 percent of executives indicate that they are optimistic about the state of Florida economy over the next year;
58 percent of executives stated that they are optimistic about the United States economy over the next year, while 42 percent
are pessimistic about the United States economy over the next year; and
63 percent of executives believe that finding qualified employees will be a top 5 challenge over the next year.

4 Executive Business Climate Survey Report, 2016 Q2
I. RECURRING QUESTIONS
Each quarter, the Horizon Council FGCU Business Climate
Survey polls Lee County’s business leaders about the state of
the economy in Lee County. These seven questions are
designed to provide a snapshot of short-term trends and
perceptions regarding the state of the local economy,
employment, and capital investment. Asking the same
recurring questions allows for a side-by-side comparison of the
economy during each quarter. The results from these questions
for the second quarter of 2016 can be found in Figures 1
through 7 below.
Figure 1 reports that 59 percent of surveyed executives
indicated that economic conditions in Lee County were better
compared to a year ago. This marks a significant decline from
the first quarter 2016 measure of 73 percent as well as the
measure from the second quarter 2015 measure of 82 percent.
These results indicate that local business owners and executives
are generally less pleased with the direction of the local
economy over the past year.
Figure 1: Current Economic Condition
Figure 2 tracks business leaders’ perceptions about economic
conditions going into the next year. The survey found that 50
percent of executives indicated they expect economic
conditions in Lee County to be better in the next year. This is a
decline from the 2016 first quarter reported figure of 72
percent, as well as a decline from the second quarter 2015
report, which found that 74 percent of surveyed executives
expected conditions in Lee County to be better in the next year.
Figure 2: Future Economic Condition
Figure 3 reports on executives’ perceptions about their
particular industry and is more narrowly focused. The survey
found that 50 percent of surveyed executives believe that
current conditions in their industry were better compared to a
year ago. This was a decline from the 61 percent recorded in
the first quarter 2016 survey and the 75 percent reported a year
ago on the second quarter 2015 report.
Figure 3: Current Industry Condition
Figure 4 reports that 49 percent of surveyed executives expect
conditions in their industry to be better in the next year. This is
a slight decline from the 2016 first quarter report, which
reported that 65 percent of surveyed executives expect
conditions in their industry to be better in the next year, as well
6%
53%
33%
9%
0%
13%
69%
17%
1% 0%
15%
67%
18%
0% 0%0%
10%
20%
30%
40%
50%
60%
70%
80%
Substantiallybetter
Moderatelybetter
Same Moderatelyworse
Substantiallyworse
Pe
rcen
t o
f R
esp
on
ses
How are the Current Lee County economic conditions compared to one year ago?
2016 Q2
2015 Q2
2014 Q2
4%
46% 46%
3%0%
23%
51%
24%
2% 0%
17%
62%
21%
1% 0%0%
10%
20%
30%
40%
50%
60%
70%
80%
Substantiallybetter
Moderatelybetter
Same Moderatelyworse
Substantiallyworse
Pe
rcen
t o
f R
esp
on
ses
What are your expectations for the Lee County one year ahead?
2016 Q2
2015 Q2
2014 Q2
5%
45%
32%
18%
0%
16%
59%
22%
4%0%
13%
61%
26%
0% 0%0%
10%
20%
30%
40%
50%
60%
70%
80%
Substantiallybetter
Moderatelybetter
Same Moderatelyworse
Substantiallyworse
Pe
rce
nt
of
Res
po
nse
s
What are the current conditions in your industry in Lee County compared to one year ago?
2016 Q2
2015 Q2
2014 Q2
5 Regional Economic Research Institute
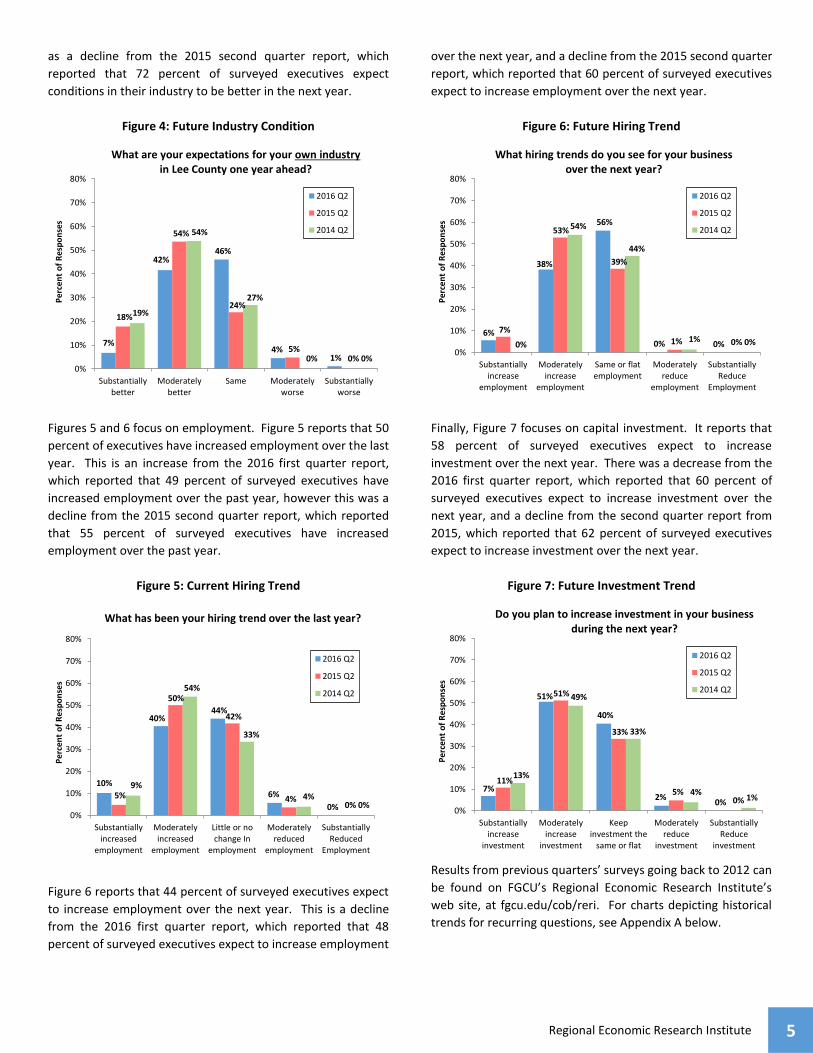
as a decline from the 2015 second quarter report, which
reported that 72 percent of surveyed executives expect
conditions in their industry to be better in the next year.
Figure 4: Future Industry Condition
Figures 5 and 6 focus on employment. Figure 5 reports that 50
percent of executives have increased employment over the last
year. This is an increase from the 2016 first quarter report,
which reported that 49 percent of surveyed executives have
increased employment over the past year, however this was a
decline from the 2015 second quarter report, which reported
that 55 percent of surveyed executives have increased
employment over the past year.
Figure 5: Current Hiring Trend
Figure 6 reports that 44 percent of surveyed executives expect
to increase employment over the next year. This is a decline
from the 2016 first quarter report, which reported that 48
percent of surveyed executives expect to increase employment
over the next year, and a decline from the 2015 second quarter
report, which reported that 60 percent of surveyed executives
expect to increase employment over the next year.
Figure 6: Future Hiring Trend
Finally, Figure 7 focuses on capital investment. It reports that
58 percent of surveyed executives expect to increase
investment over the next year. There was a decrease from the
2016 first quarter report, which reported that 60 percent of
surveyed executives expect to increase investment over the
next year, and a decline from the second quarter report from
2015, which reported that 62 percent of surveyed executives
expect to increase investment over the next year.
Figure 7: Future Investment Trend
Results from previous quarters’ surveys going back to 2012 can
be found on FGCU’s Regional Economic Research Institute’s
web site, at fgcu.edu/cob/reri. For charts depicting historical
trends for recurring questions, see Appendix A below.
7%
42%46%
4%1%
18%
54%
24%
5%0%
19%
54%
27%
0% 0%0%
10%
20%
30%
40%
50%
60%
70%
80%
Substantiallybetter
Moderatelybetter
Same Moderatelyworse
Substantiallyworse
Pe
rcen
t o
f R
esp
on
ses
What are your expectations for your own industryin Lee County one year ahead?
2016 Q2
2015 Q2
2014 Q2
10%
40%44%
6%
0%
5%
50%
42%
4%0%
9%
54%
33%
4%0%
0%
10%
20%
30%
40%
50%
60%
70%
80%
Substantiallyincreased
employment
Moderatelyincreased
employment
Little or nochange In
employment
Moderatelyreduced
employment
SubstantiallyReduced
Employment
Pe
rcen
t o
f R
esp
on
ses
What has been your hiring trend over the last year?
2016 Q2
2015 Q2
2014 Q2
6%
38%
56%
0% 0%
7%
53%
39%
1% 0%0%
54%
44%
1% 0%0%
10%
20%
30%
40%
50%
60%
70%
80%
Substantiallyincrease
employment
Moderatelyincrease
employment
Same or flatemployment
Moderatelyreduce
employment
SubstantiallyReduce
Employment
Pe
rcen
t o
f R
esp
on
ses
What hiring trends do you see for your business over the next year?
2016 Q2
2015 Q2
2014 Q2
7%
51%
40%
2%0%
11%
51%
33%
5%0%
13%
49%
33%
4%1%
0%
10%
20%
30%
40%
50%
60%
70%
80%
Substantiallyincrease
investment
Moderatelyincrease
investment
Keepinvestment the
same or flat
Moderatelyreduce
investment
SubstantiallyReduce
investment
Pe
rce
nt
of
Re
spo
nse
s
Do you plan to increase investment in your business during the next year?
2016 Q2
2015 Q2
2014 Q2
6 Executive Business Climate Survey Report, 2016 Q2
II. THE EXECUTIVE BUSINESS CLIMATE INDEX
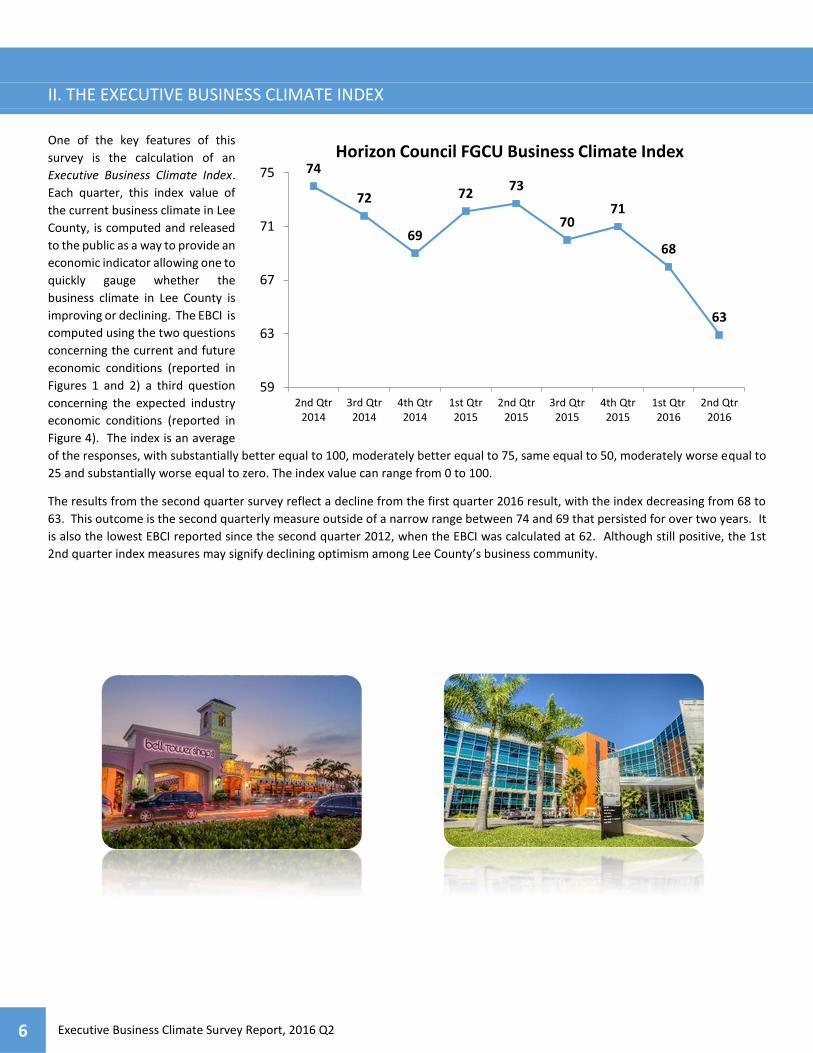
One of the key features of this
survey is the calculation of an
Executive Business Climate Index.
Each quarter, this index value of
the current business climate in Lee
County, is computed and released
to the public as a way to provide an
economic indicator allowing one to
quickly gauge whether the
business climate in Lee County is
improving or declining. The EBCI is
computed using the two questions
concerning the current and future
economic conditions (reported in
Figures 1 and 2) a third question
concerning the expected industry
economic conditions (reported in
Figure 4). The index is an average
of the responses, with substantially better equal to 100, moderately better equal to 75, same equal to 50, moderately worse equal to
25 and substantially worse equal to zero. The index value can range from 0 to 100.
The results from the second quarter survey reflect a decline from the first quarter 2016 result, with the index decreasing from 68 to
63. This outcome is the second quarterly measure outside of a narrow range between 74 and 69 that persisted for over two years. It
is also the lowest EBCI reported since the second quarter 2012, when the EBCI was calculated at 62. Although still positive, the 1st
2nd quarter index measures may signify declining optimism among Lee County’s business community.
74
72
69
7273
7071
68
63
59
63
67
71
75
2nd Qtr2014
3rd Qtr2014
4th Qtr2014
1st Qtr2015
2nd Qtr2015
3rd Qtr2015
4th Qtr2015
1st Qtr2016
2nd Qtr2016
Horizon Council FGCU Business Climate Index

7 Regional Economic Research Institute
III. SPECIAL TOPICS
Each Executive Business Climate Survey contains a set of
questions not asked on a recurring basis. These special topic
questions focus on areas of importance to the economic
development of our region with the intention of accessing the
business community’s input and feedback to development
officials, industry agents, and government officials.
The present survey attempted to mimic questions asked in the
second quarter 2013 EBCS and obtain information relating to
the current challenges facing local businesses, along with
current and expected future cost changes in Southwest Florida.
Results from the second quarter 2013 survey and present
survey are reported in figures 8 through 10. In addition, the
survey also asked local business executives to provide their
expectations for the Southwest Florida, state of Florida, and
U.S. economy over the next year.
Figure 8: Costs over Past Year
As shown in Figure 8, there appears to be no significant
difference between the second quarter 2013 and present
survey results, with 79 percent of business executives reporting
the costs of doing business over the past year have increased
less than 5 percent or been lower.
Figure 9: Costs over Next Year
As shown in figure 9, there also seems to be no significant
change in the expectations of how costs will change over the
next year, with only 12 percent of business executives indicating
they believe their cost of doing business will increase over 5
percent over the next year.
Figure 10: Prices over Past Year
Figure 10 shows business executives’ impressions about how
their prices have changed over the past year. 41 percent of
business executives reported that they have increased prices by
at least 2 percent over the past year, a significant increase from
the second quarter 2013 report, which reported that 23 percent
had increased prices by at least 2 percent.
5%
31%
43%
15%
6%2%
33%
45%
19%
1%
0%
10%
20%
30%
40%
50%
60%
70%
80%
Lower 0 to 2 percentincrease
2 to 5 percentincrease
5 to 10 percentincrease
More than 10percent increase
Pe
rcen
t o
f R
esp
on
ses
How has your cost of doing business changed over the past year?
2016 Q2
2013 Q2
2%
43% 42%
9%3%2%
44%40%
11%
3%
0%
10%
20%
30%
40%
50%
60%
70%
80%
Lower 0 to 2 percentincrease
2 to 5 percentincrease
5 to 10 percentincrease
More than 10percent increase
Pe
rcen
t o
f R
esp
on
ses
How do you expect your costs to change over the next year?
2016 Q2
2013 Q2
12%
47%
27%
12%
2%
16%
61%
17%
5%1%
0%
10%
20%
30%
40%
50%
60%
70%
80%
Lower 0 to 2 percentincrease
2 to 5 percentincrease
5 to 10 percentincrease
More than 10percent increase
Pe
rcen
t o
f R
esp
on
ses
How have your prices changed over the last year?
2016 Q2
2013 Q2
8 Executive Business Climate Survey Report, 2016 Q2
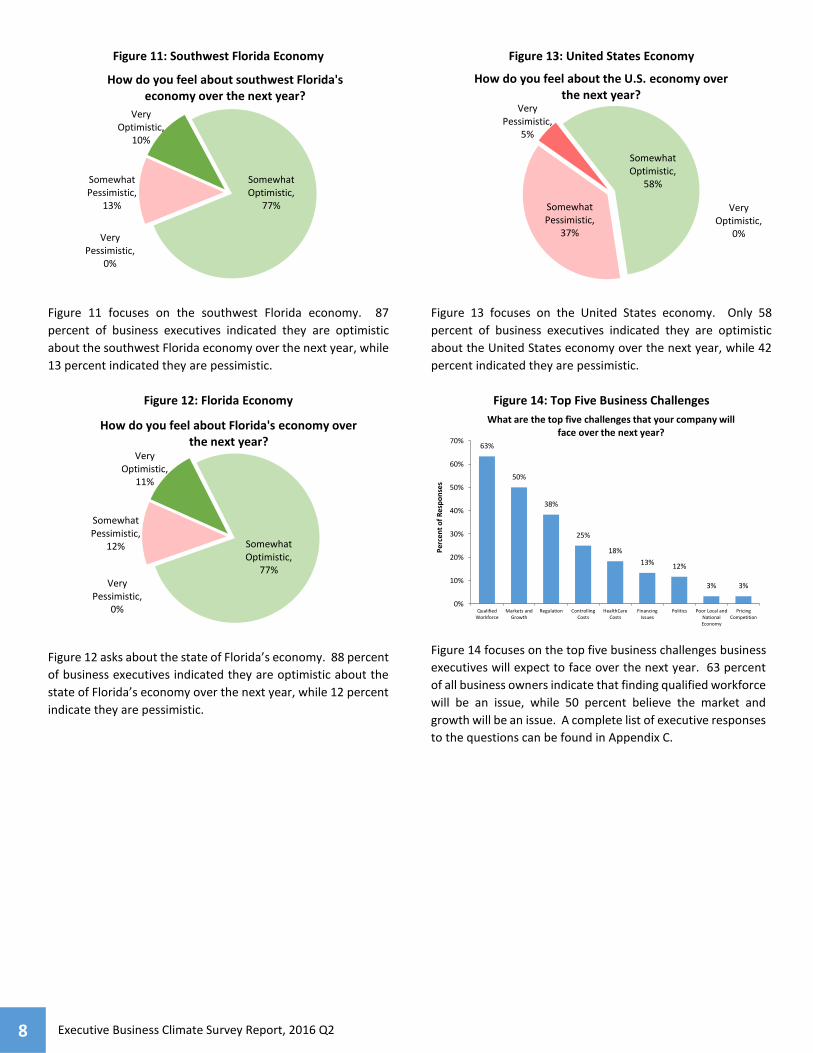
Figure 11: Southwest Florida Economy
Figure 11 focuses on the southwest Florida economy. 87
percent of business executives indicated they are optimistic
about the southwest Florida economy over the next year, while
13 percent indicated they are pessimistic.
Figure 12: Florida Economy
Figure 12 asks about the state of Florida’s economy. 88 percent
of business executives indicated they are optimistic about the
state of Florida’s economy over the next year, while 12 percent
indicate they are pessimistic.
Figure 13: United States Economy
Figure 13 focuses on the United States economy. Only 58
percent of business executives indicated they are optimistic
about the United States economy over the next year, while 42
percent indicated they are pessimistic.
Figure 14: Top Five Business Challenges
Figure 14 focuses on the top five business challenges business
executives will expect to face over the next year. 63 percent
of all business owners indicate that finding qualified workforce
will be an issue, while 50 percent believe the market and
growth will be an issue. A complete list of executive responses
to the questions can be found in Appendix C.
Very Optimistic,
10%
Somewhat Optimistic,
77%
Somewhat Pessimistic,
13%
Very Pessimistic,
0%
How do you feel about southwest Florida's economy over the next year?
Very Optimistic,
11%
Somewhat Optimistic,
77%
Somewhat Pessimistic,
12%
Very Pessimistic,
0%
How do you feel about Florida's economy over the next year?
Very Optimistic,
0%
Somewhat Optimistic,
58%
Somewhat Pessimistic,
37%
Very Pessimistic,
5%
How do you feel about the U.S. economy over the next year?
63%
50%
38%
25%
18%
13% 12%
3% 3%
0%
10%
20%
30%
40%
50%
60%
70%
QualifiedWorkforce
Markets andGrowth
Regulation ControllingCosts
HealthCareCosts
FinancingIssues
Politics Poor Local andNationalEconomy
PricingCompetition
Per
cen
t o
f R
esp
on
ses
What are the top five challenges that your company will face over the next year?

9 Regional Economic Research Institute
IV. COMMENTS, SUGGESTIONS, AND RECOMMENDATIONS
The comments indicated that executives were concerned with the national and international economy as it relates to local activity, as
well as some general comments of the workforce. There are concerns and comments about:
Public Infrastructure
Proper training
Governmental regulation
Increasing costs
Wage rates
Executive responses to this question are found in Appendix B.
10 Executive Business Climate Survey Report, 2016 Q2
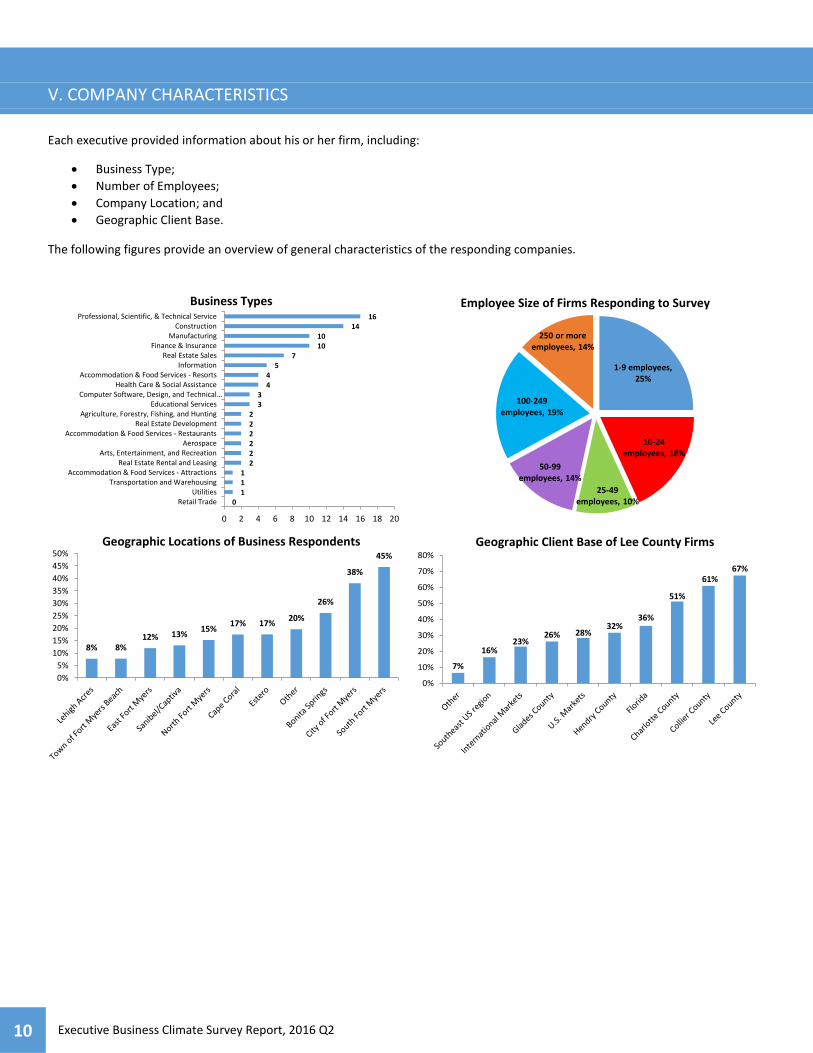
V. COMPANY CHARACTERISTICS
Each executive provided information about his or her firm, including:
Business Type;
Number of Employees;
Company Location; and
Geographic Client Base.
The following figures provide an overview of general characteristics of the responding companies.
0111
222222
33
44
57
1010
1416
0 2 4 6 8 10 12 14 16 18 20
Retail TradeUtilities
Transportation and WarehousingAccommodation & Food Services - Attractions
Real Estate Rental and LeasingArts, Entertainment, and Recreation
AerospaceAccommodation & Food Services - Restaurants
Real Estate DevelopmentAgriculture, Forestry, Fishing, and Hunting
Educational ServicesComputer Software, Design, and Technical…
Health Care & Social AssistanceAccommodation & Food Services - Resorts
InformationReal Estate Sales
Finance & InsuranceManufacturing
ConstructionProfessional, Scientific, & Technical Service
Business Types
1-9 employees, 25%
10-24 employees, 18%
25-49 employees, 10%
50-99 employees, 14%
100-249 employees, 19%
250 or more employees, 14%
Employee Size of Firms Responding to Survey
8% 8%12% 13%
15%17% 17%
20%
26%
38%
45%
0%
5%
10%
15%
20%
25%
30%
35%
40%
45%
50%Geographic Locations of Business Respondents
7%
16%23%
26% 28%32%
36%
51%
61%67%
0%
10%
20%
30%
40%
50%
60%
70%
80%
Geographic Client Base of Lee County Firms
11 Regional Economic Research Institute
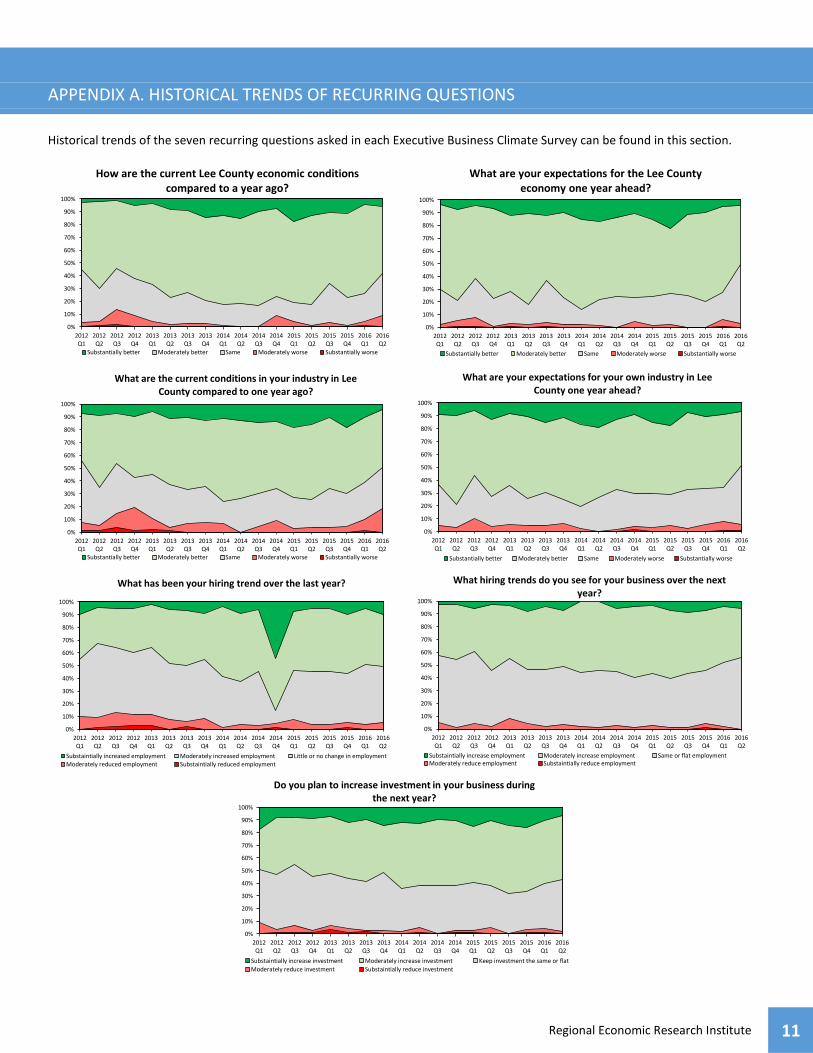
APPENDIX A. HISTORICAL TRENDS OF RECURRING QUESTIONS
Historical trends of the seven recurring questions asked in each Executive Business Climate Survey can be found in this section.
0%
10%
20%
30%
40%
50%
60%
70%
80%
90%
100%
2012Q1
2012Q2
2012Q3
2012Q4
2013Q1
2013Q2
2013Q3
2013Q4
2014Q1
2014Q2
2014Q3
2014Q4
2015Q1
2015Q2
2015Q3
2015Q4
2016Q1
2016Q2
How are the current Lee County economic conditions compared to a year ago?
Substantially better Moderately better Same Moderately worse Substantially worse
0%
10%
20%
30%
40%
50%
60%
70%
80%
90%
100%
2012Q1
2012Q2
2012Q3
2012Q4
2013Q1
2013Q2
2013Q3
2013Q4
2014Q1
2014Q2
2014Q3
2014Q4
2015Q1
2015Q2
2015Q3
2015Q4
2016Q1
2016Q2
What are your expectations for the Lee County economy one year ahead?
Substantially better Moderately better Same Moderately worse Substantially worse
0%
10%
20%
30%
40%
50%
60%
70%
80%
90%
100%
2012Q1
2012Q2
2012Q3
2012Q4
2013Q1
2013Q2
2013Q3
2013Q4
2014Q1
2014Q2
2014Q3
2014Q4
2015Q1
2015Q2
2015Q3
2015Q4
2016Q1
2016Q2
What are the current conditions in your industry in Lee County compared to one year ago?
Substantially better Moderately better Same Moderately worse Substantially worse
0%
10%
20%
30%
40%
50%
60%
70%
80%
90%
100%
2012Q1
2012Q2
2012Q3
2012Q4
2013Q1
2013Q2
2013Q3
2013Q4
2014Q1
2014Q2
2014Q3
2014Q4
2015Q1
2015Q2
2015Q3
2015Q4
2016Q1
2016Q2
What are your expectations for your own industry in Lee County one year ahead?
Substantially better Moderately better Same Moderately worse Substantially worse
0%
10%
20%
30%
40%
50%
60%
70%
80%
90%
100%
2012Q1
2012Q2
2012Q3
2012Q4
2013Q1
2013Q2
2013Q3
2013Q4
2014Q1
2014Q2
2014Q3
2014Q4
2015Q1
2015Q2
2015Q3
2015Q4
2016Q1
2016Q2
What has been your hiring trend over the last year?
Substaintially increased employment Moderately increased employment Little or no change in employmentModerately reduced employment Substaintially reduced employment
0%
10%
20%
30%
40%
50%
60%
70%
80%
90%
100%
2012Q1
2012Q2
2012Q3
2012Q4
2013Q1
2013Q2
2013Q3
2013Q4
2014Q1
2014Q2
2014Q3
2014Q4
2015Q1
2015Q2
2015Q3
2015Q4
2016Q1
2016Q2
What hiring trends do you see for your business over the next year?
Substaintially increase employment Moderately increase employment Same or flat employmentModerately reduce employment Substaintially reduce employment
0%
10%
20%
30%
40%
50%
60%
70%
80%
90%
100%
2012Q1
2012Q2
2012Q3
2012Q4
2013Q1
2013Q2
2013Q3
2013Q4
2014Q1
2014Q2
2014Q3
2014Q4
2015Q1
2015Q2
2015Q3
2015Q4
2016Q1
2016Q2
Do you plan to increase investment in your business during the next year?
Substaintially increase investment Moderately increase investment Keep investment the same or flat
Moderately reduce investment Substaintially reduce investment
12 Executive Business Climate Survey Report, 2016 Q2
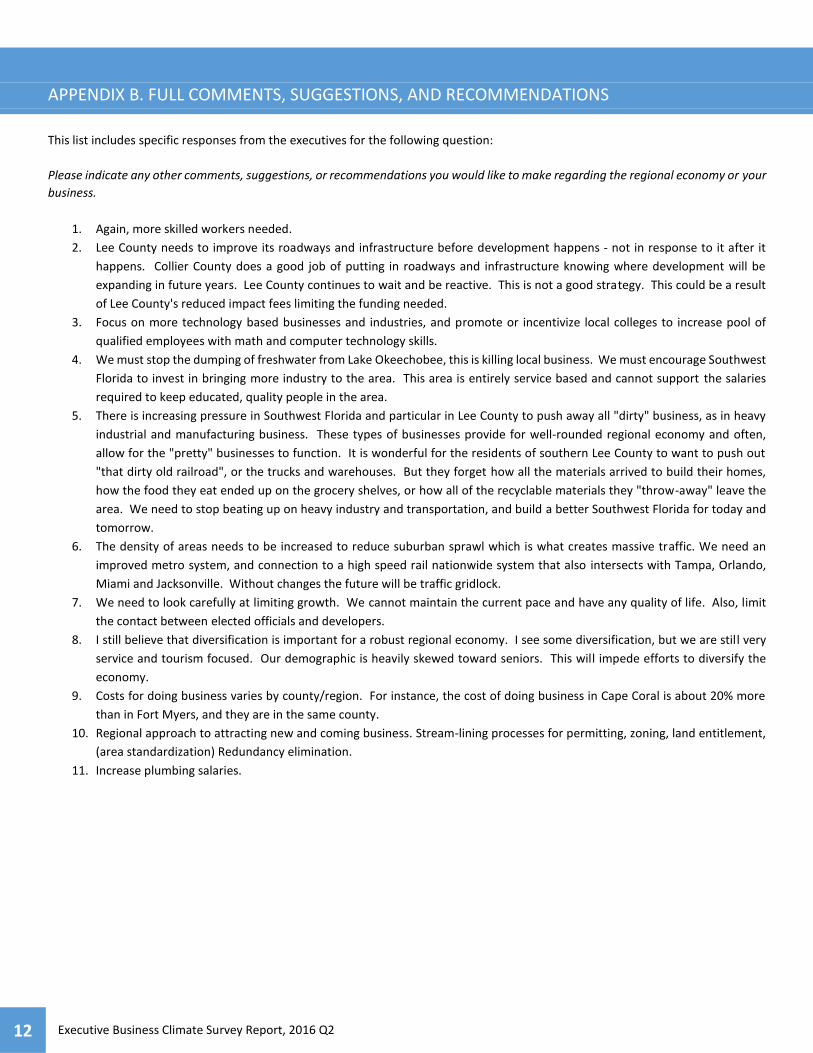
APPENDIX B. FULL COMMENTS, SUGGESTIONS, AND RECOMMENDATIONS
This list includes specific responses from the executives for the following question:
Please indicate any other comments, suggestions, or recommendations you would like to make regarding the regional economy or your
business.
1. Again, more skilled workers needed.
2. Lee County needs to improve its roadways and infrastructure before development happens - not in response to it after it
happens. Collier County does a good job of putting in roadways and infrastructure knowing where development will be
expanding in future years. Lee County continues to wait and be reactive. This is not a good strategy. This could be a result
of Lee County's reduced impact fees limiting the funding needed.
3. Focus on more technology based businesses and industries, and promote or incentivize local colleges to increase pool of
qualified employees with math and computer technology skills.
4. We must stop the dumping of freshwater from Lake Okeechobee, this is killing local business. We must encourage Southwest
Florida to invest in bringing more industry to the area. This area is entirely service based and cannot support the salaries
required to keep educated, quality people in the area.
5. There is increasing pressure in Southwest Florida and particular in Lee County to push away all "dirty" business, as in heavy
industrial and manufacturing business. These types of businesses provide for well-rounded regional economy and often,
allow for the "pretty" businesses to function. It is wonderful for the residents of southern Lee County to want to push out
"that dirty old railroad", or the trucks and warehouses. But they forget how all the materials arrived to build their homes,
how the food they eat ended up on the grocery shelves, or how all of the recyclable materials they "throw-away" leave the
area. We need to stop beating up on heavy industry and transportation, and build a better Southwest Florida for today and
tomorrow.
6. The density of areas needs to be increased to reduce suburban sprawl which is what creates massive traffic. We need an
improved metro system, and connection to a high speed rail nationwide system that also intersects with Tampa, Orlando,
Miami and Jacksonville. Without changes the future will be traffic gridlock.
7. We need to look carefully at limiting growth. We cannot maintain the current pace and have any quality of life. Also, limit
the contact between elected officials and developers.
8. I still believe that diversification is important for a robust regional economy. I see some diversification, but we are still very
service and tourism focused. Our demographic is heavily skewed toward seniors. This will impede efforts to diversify the
economy.
9. Costs for doing business varies by county/region. For instance, the cost of doing business in Cape Coral is about 20% more
than in Fort Myers, and they are in the same county.
10. Regional approach to attracting new and coming business. Stream-lining processes for permitting, zoning, land entitlement,
(area standardization) Redundancy elimination.
11. Increase plumbing salaries.
13 Regional Economic Research Institute
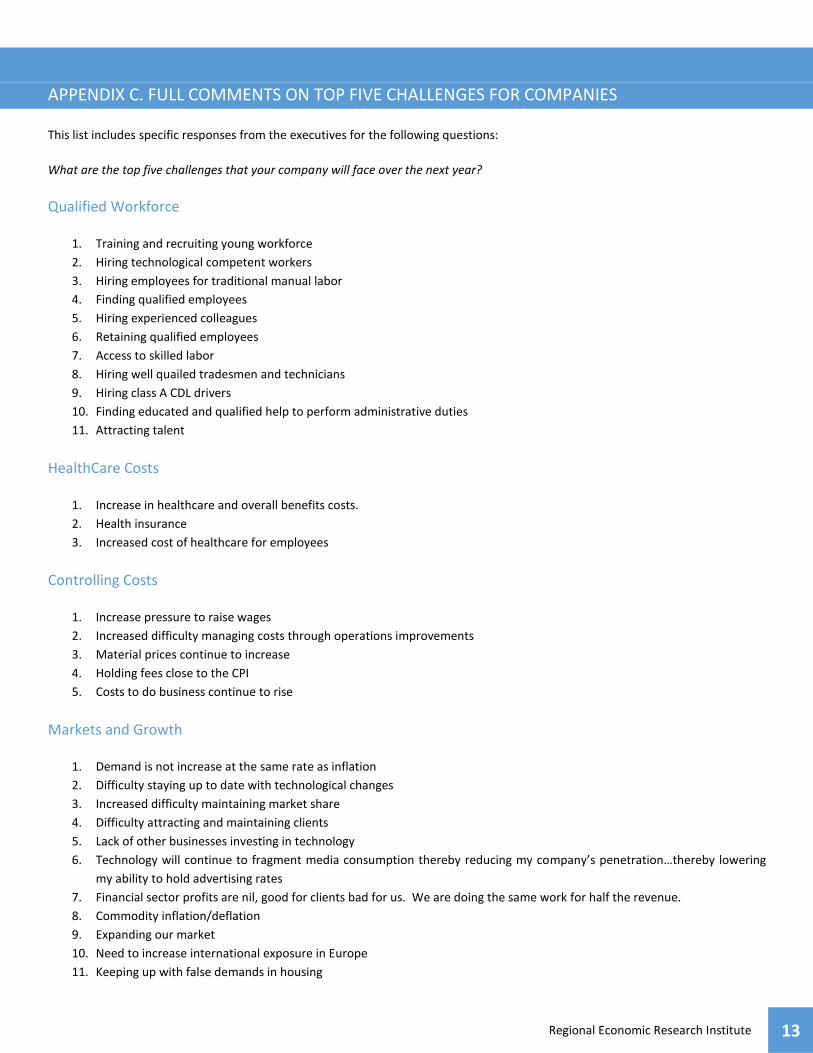
APPENDIX C. FULL COMMENTS ON TOP FIVE CHALLENGES FOR COMPANIES
This list includes specific responses from the executives for the following questions:
What are the top five challenges that your company will face over the next year?
Qualified Workforce
1. Training and recruiting young workforce
2. Hiring technological competent workers
3. Hiring employees for traditional manual labor
4. Finding qualified employees
5. Hiring experienced colleagues
6. Retaining qualified employees
7. Access to skilled labor
8. Hiring well quailed tradesmen and technicians
9. Hiring class A CDL drivers
10. Finding educated and qualified help to perform administrative duties
11. Attracting talent
HealthCare Costs
1. Increase in healthcare and overall benefits costs.
2. Health insurance
3. Increased cost of healthcare for employees
Controlling Costs
1. Increase pressure to raise wages
2. Increased difficulty managing costs through operations improvements
3. Material prices continue to increase
4. Holding fees close to the CPI
5. Costs to do business continue to rise
Markets and Growth
1. Demand is not increase at the same rate as inflation
2. Difficulty staying up to date with technological changes
3. Increased difficulty maintaining market share
4. Difficulty attracting and maintaining clients
5. Lack of other businesses investing in technology
6. Technology will continue to fragment media consumption thereby reducing my company’s penetration…thereby lowering
my ability to hold advertising rates
7. Financial sector profits are nil, good for clients bad for us. We are doing the same work for half the revenue.
8. Commodity inflation/deflation
9. Expanding our market
10. Need to increase international exposure in Europe
11. Keeping up with false demands in housing

14 Executive Business Climate Survey Report, 2016 Q2
12. Slowdown of home sales
13. Excessive hotel rates and rental housing become issues for consumer spending and hiring of personnel. Disposable income
for tourism is limited to hotel stays and bare essentials, when the average cost of a hotel in Southwest Florida is in excess of
$250 per night. Also, lack of affordable housing and limited rental housing makes it difficult to recruit talented personnel to
the SWFL region. We have experienced several staff members resign and return "home" to other areas due to the housing
crisis. Our employment cost has gone up as a result.
Regulation
1. Increased federal and state requirements not related to delivery of service
2. Increase in regulations from the EPA
3. Increase in government bureaucracy is slowing down permit processes
4. Dealing with governmental regulations
5. Swings in direction of local governing body
6. Ever changing HR laws
7. Dealing with financial and administrative headaches of increase federal regulation
Financing Issues
1. Holding onto cash and freezing new projects
2. Devaluation of foreign currency
3. Lack of funding and access to capital
Poor Local and National Economy
1. Economic conditions of the country
2. Potential second housing bubble
3. Fed interest rate policy
4. Low interest rate environment
5. Broad economic growth
6. Material shortages
Pricing Competition
1. Competing with lower cost imports
2. Increased pressure to lower prices
3. Competition willing to “lower the bar” by inadequate fees and free labor
4. Heavy international competitive pressure
5. Increase competition
Politics
1. Concerned that we are going towards a socialist government
2. Concerned about political and taxation activism
3. Uncertainty of upcoming election