Embed Size (px)
Citation preview
LED SYSTEMATICSIN TRANSMISSION
LENGTH MEASUREMENTS
Harold Yepes-Ramirez15/11/2011
STRATEGY:
•Comparison of transmission length measurements and number of hits as a function of the distance for neighboring lines by OB faces, in order to see which line collects the largest amount of signal, probably the candidate to measure, this to reduce the shadowing effect.
•Lines 4 and 2 multi-faces runs (f1, f2, f3, f4, f5, f6 respectively):
L2: 52693, 52696, 52698, 52700, 52702, 52704.L4: 36035, 36041, 36043, 36044, 36045, 36047.
•L2 run with large statistics (1M events): 44552.
•New consideration to define the minimum and the maximum distance to fit:
Rmin The storey where Nhits/Nflashes < 0.10 (mean value of the OMs).Rmax Rmin + 6 storeys.
•Links to all plots in the conclusions section.
SAME FACES DIFFERENT TARGET LINES:L4 MULTI-FACES RUNS

•Largest amount of data for f1 on L4.•L1 and L2 seems to collect the same amount of light from 125 m, where the fits normally start. The same is seen for L3 and L6.•L8 and L10 are the more distant lines, transmission length in L8 slightly differ concerning to other target lines. L10 signal is not collected, only noise not well selected as signal is registered (time distributions in next pages).

TIME DISTRIBUTIONS: l4_f1_tl1
•TIME DISTRIBUTIONS DELAYED 500 NS????
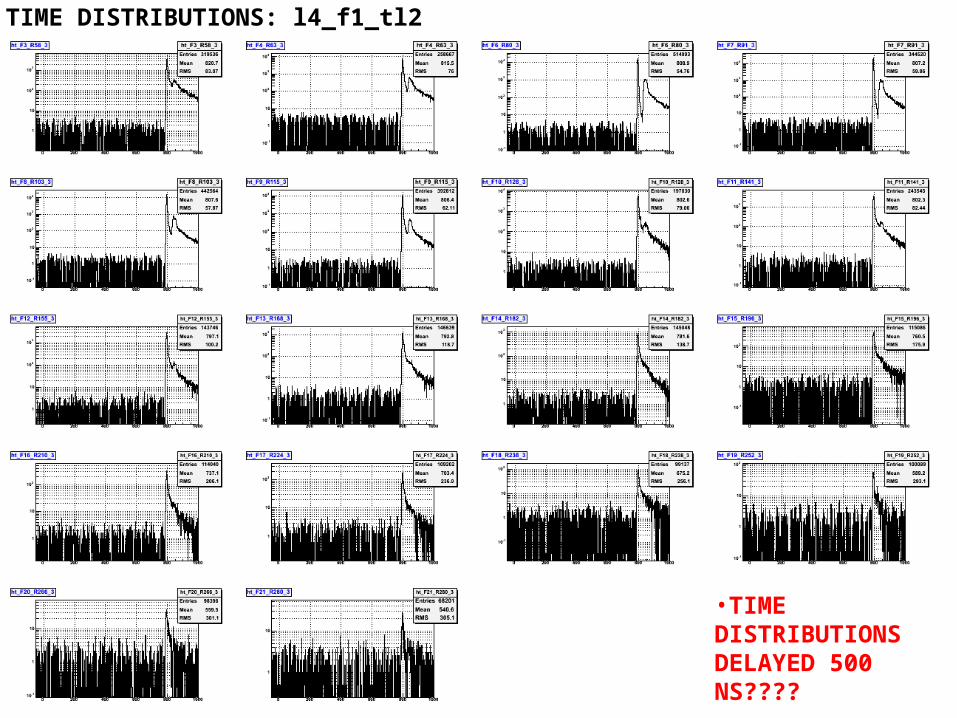
TIME DISTRIBUTIONS: l4_f1_tl2
•TIME DISTRIBUTIONS DELAYED 500 NS????
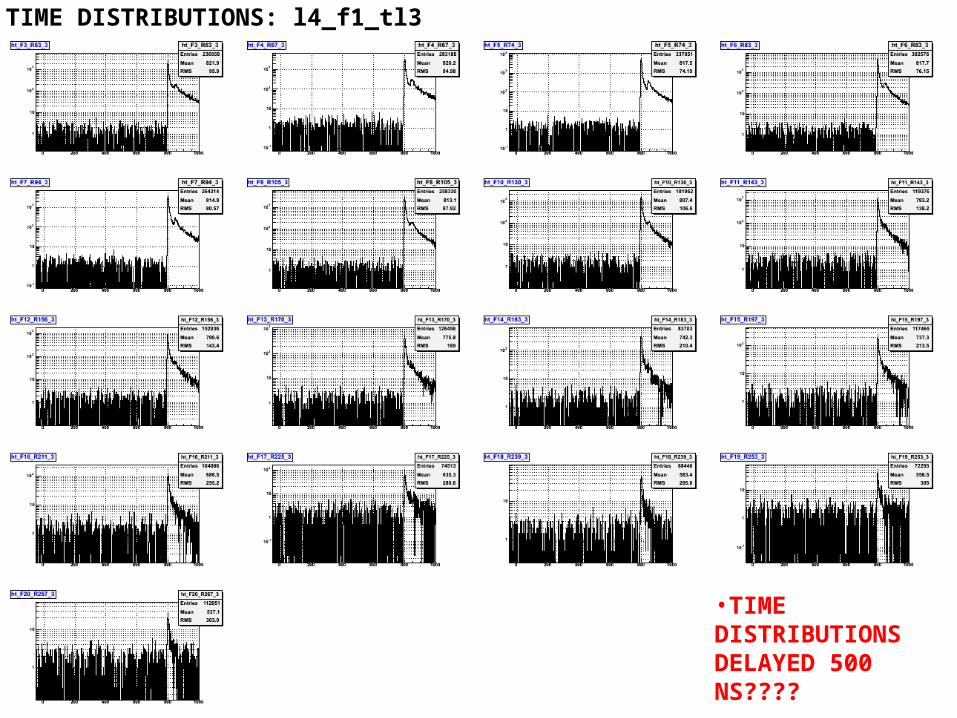
TIME DISTRIBUTIONS: l4_f1_tl3
•TIME DISTRIBUTIONS DELAYED 500 NS????
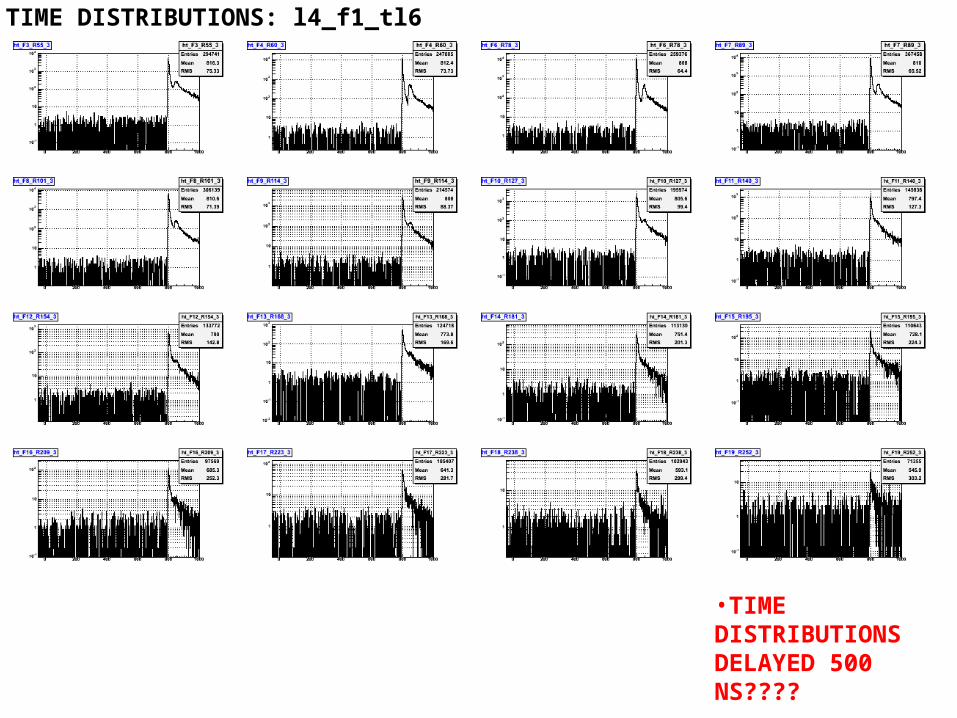
TIME DISTRIBUTIONS: l4_f1_tl6
•TIME DISTRIBUTIONS DELAYED 500 NS????
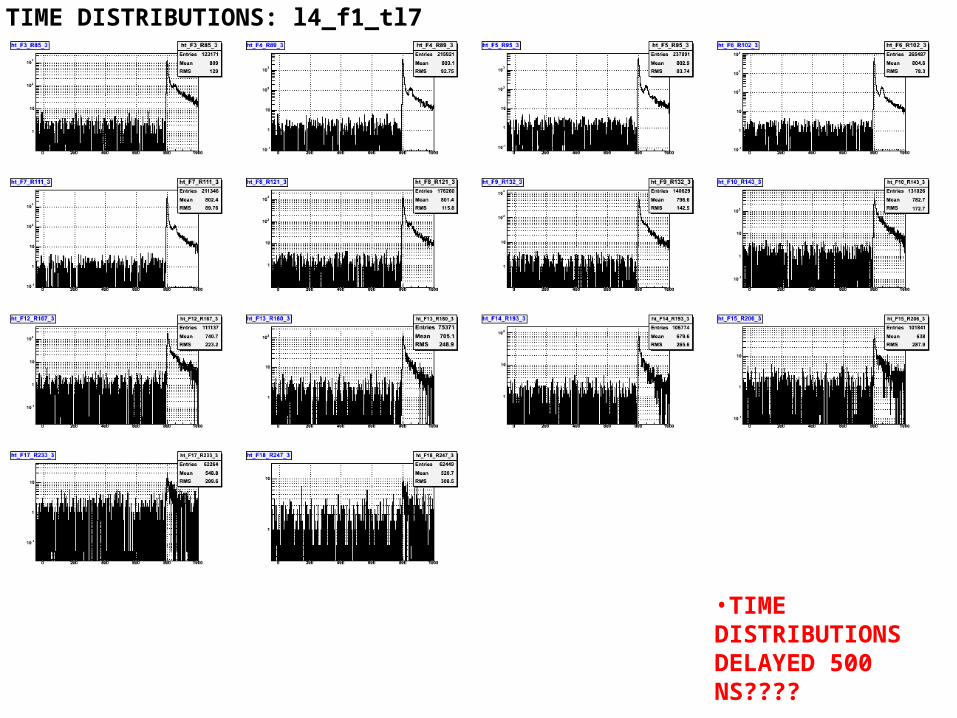
TIME DISTRIBUTIONS: l4_f1_tl7
•TIME DISTRIBUTIONS DELAYED 500 NS????

TIME DISTRIBUTIONS: l4_f1_tl8
•TIME DISTRIBUTIONS DELAYED 500 NS????

TIME DISTRIBUTIONS: l4_f1_tl10
•ONLY NOISE IS COLLECTED.
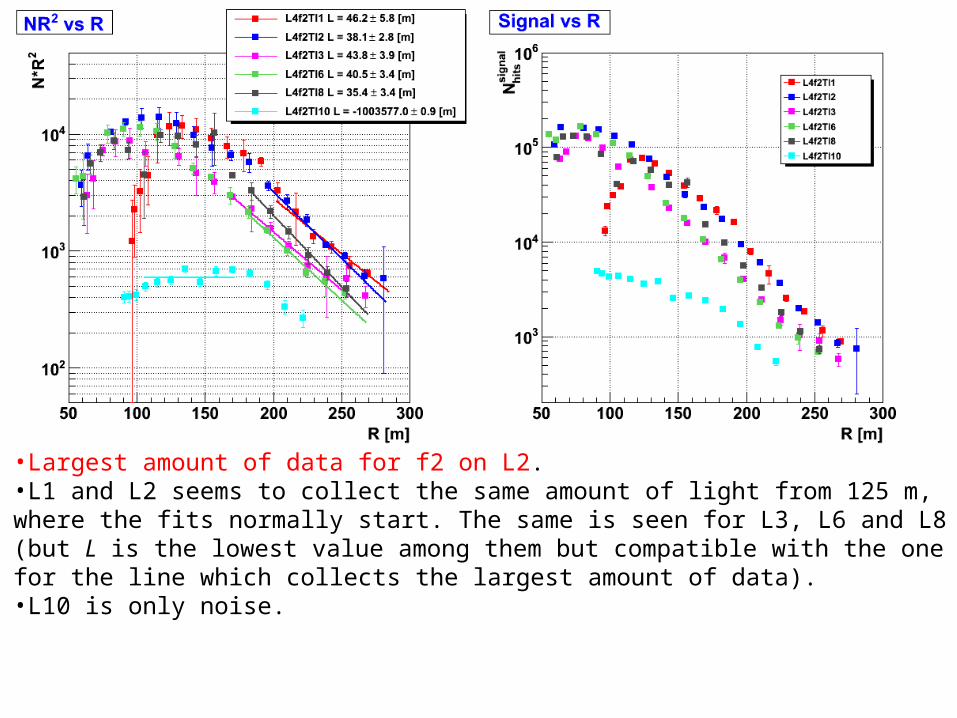
•Largest amount of data for f2 on L2.•L1 and L2 seems to collect the same amount of light from 125 m, where the fits normally start. The same is seen for L3, L6 and L8 (but L is the lowest value among them but compatible with the one for the line which collects the largest amount of data).•L10 is only noise.

TIME DISTRIBUTIONS: l4_f2_tl1

TIME DISTRIBUTIONS: l4_f2_tl2
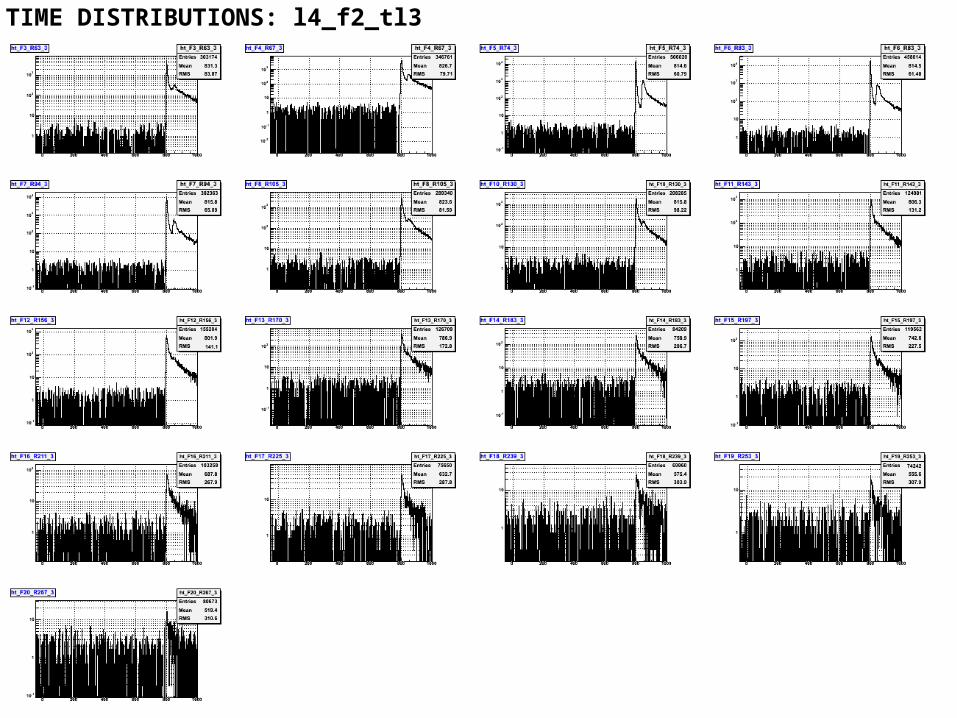
TIME DISTRIBUTIONS: l4_f2_tl3
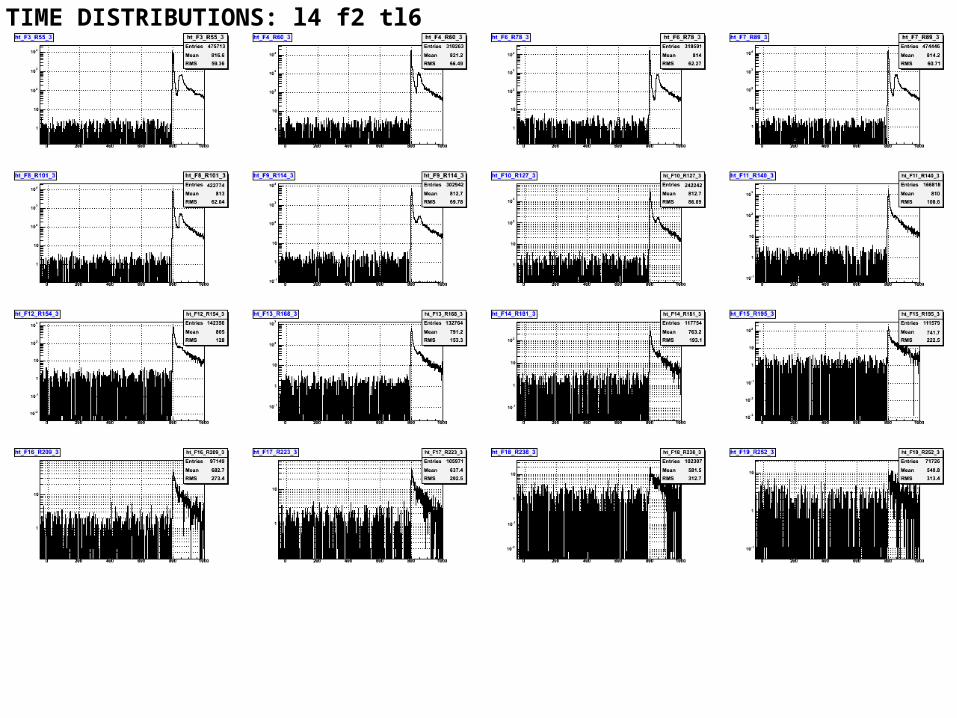
TIME DISTRIBUTIONS: l4_f2_tl6
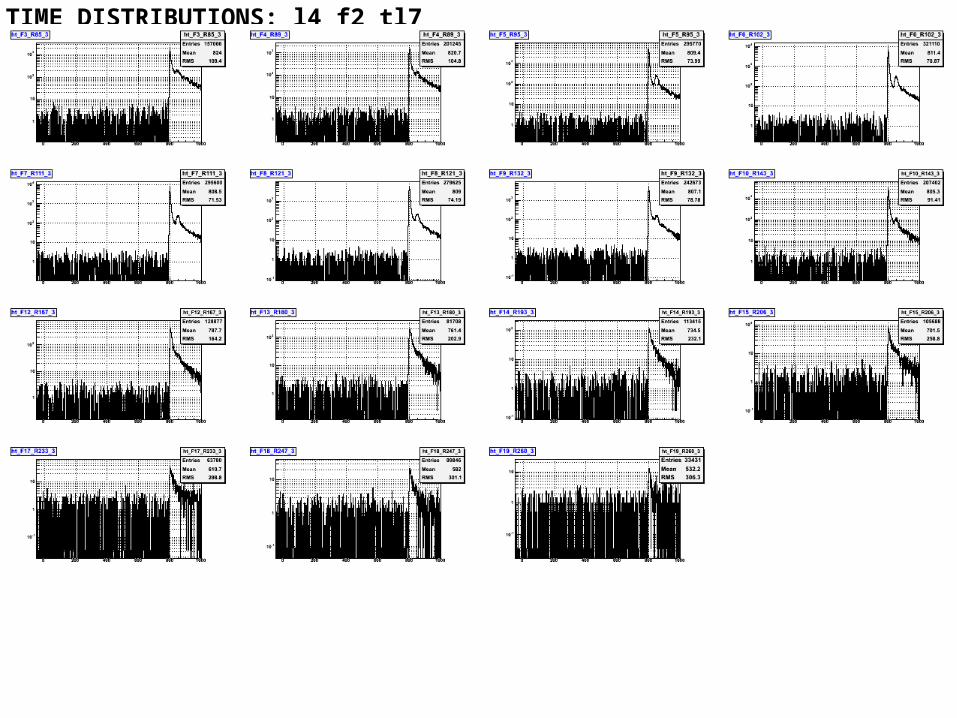
TIME DISTRIBUTIONS: l4_f2_tl7
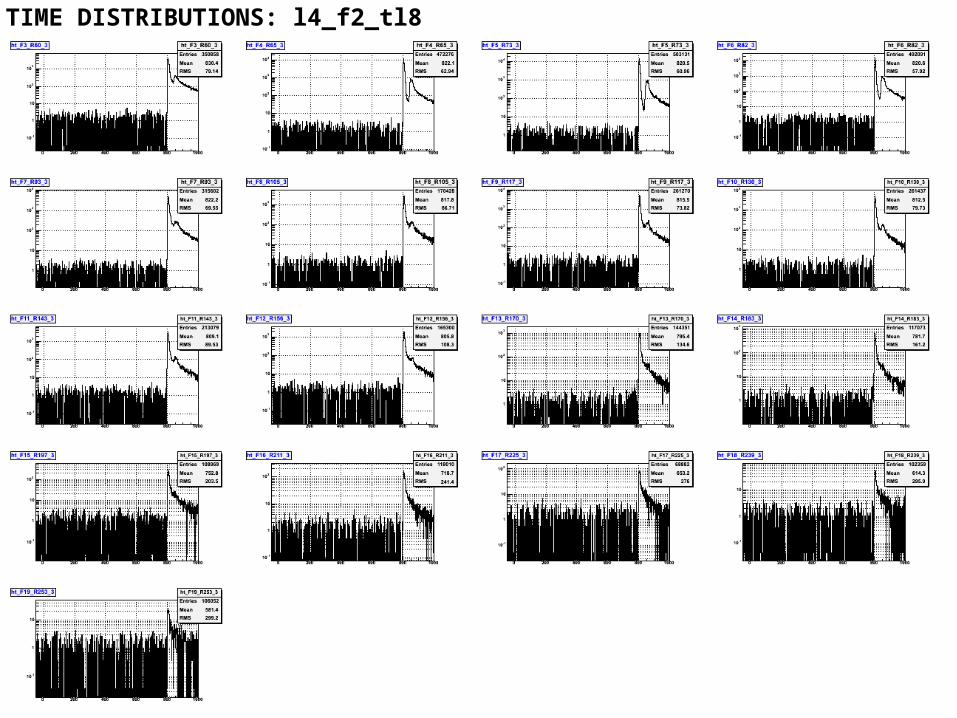
TIME DISTRIBUTIONS: l4_f2_tl8
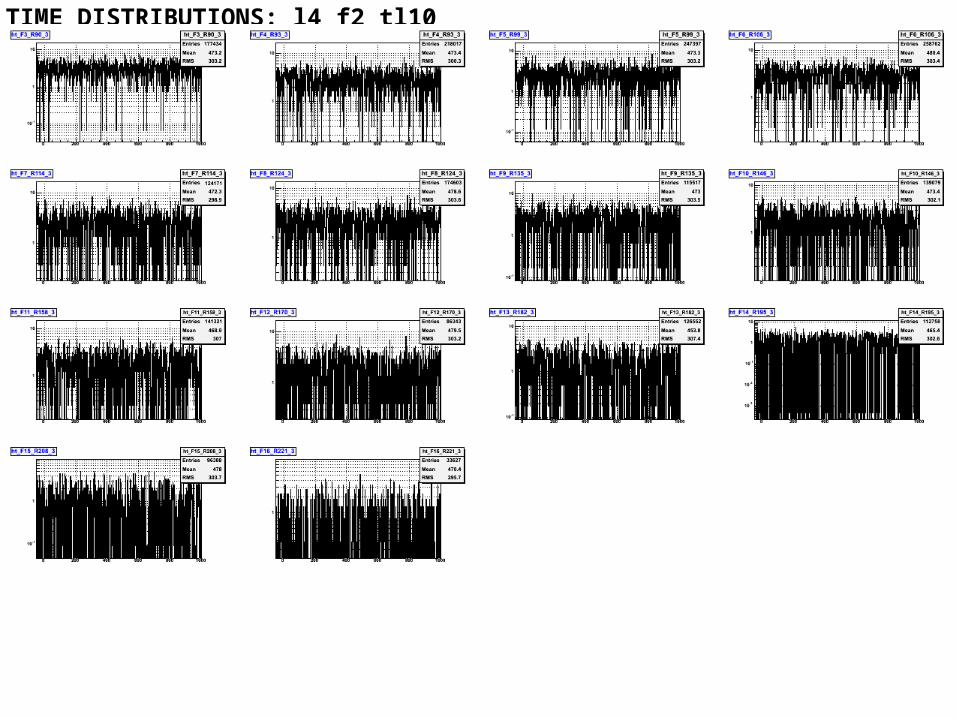
TIME DISTRIBUTIONS: l4_f2_tl10
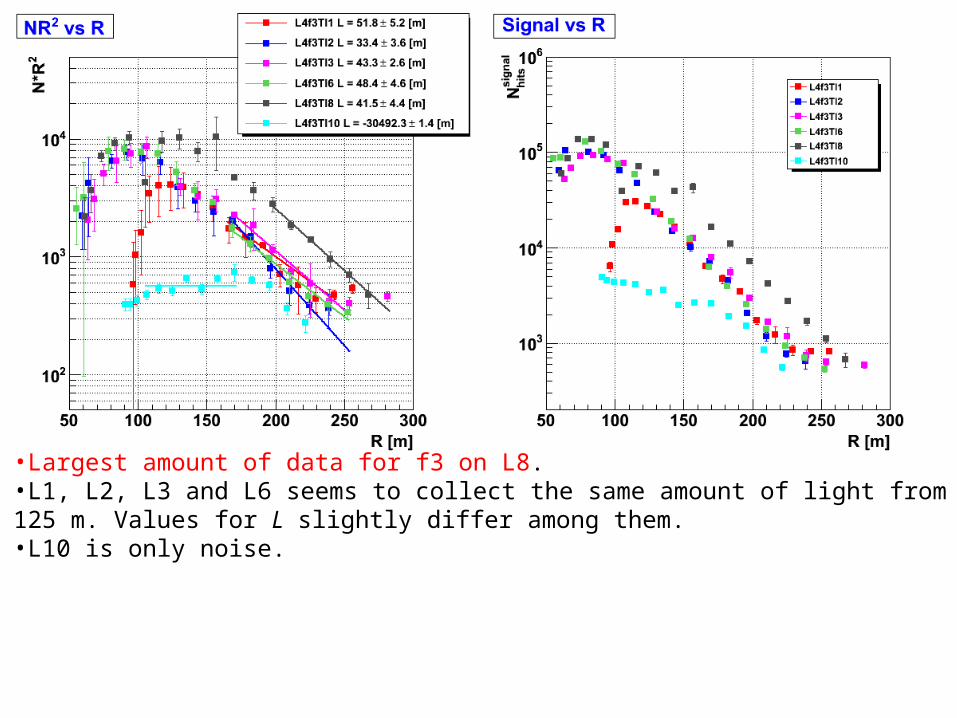
•Largest amount of data for f3 on L8.•L1, L2, L3 and L6 seems to collect the same amount of light from 125 m. Values for L slightly differ among them.•L10 is only noise.
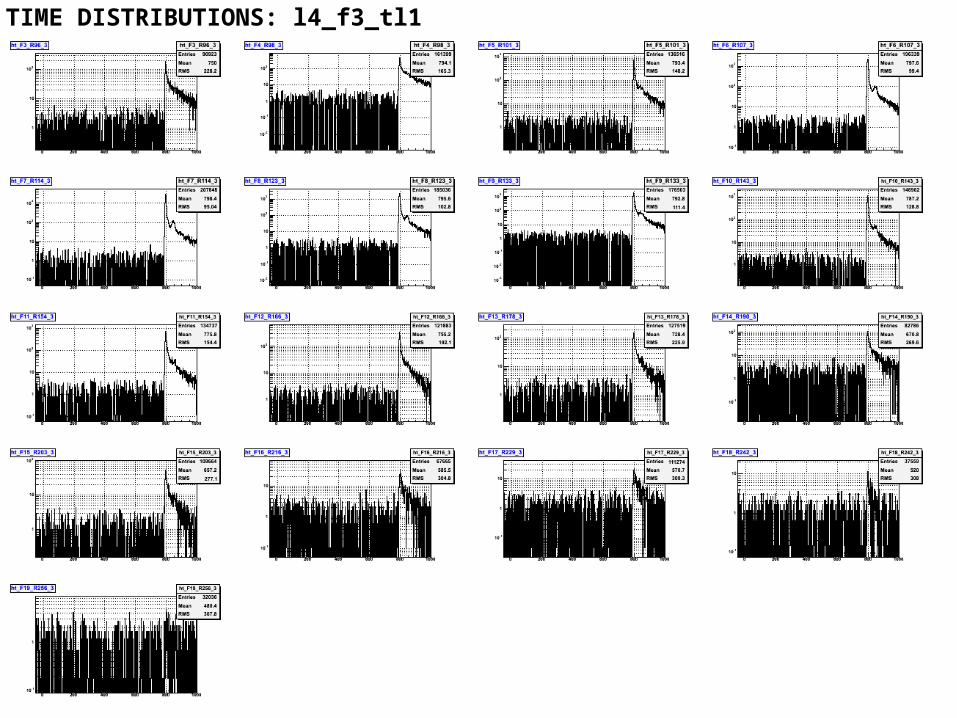
TIME DISTRIBUTIONS: l4_f3_tl1
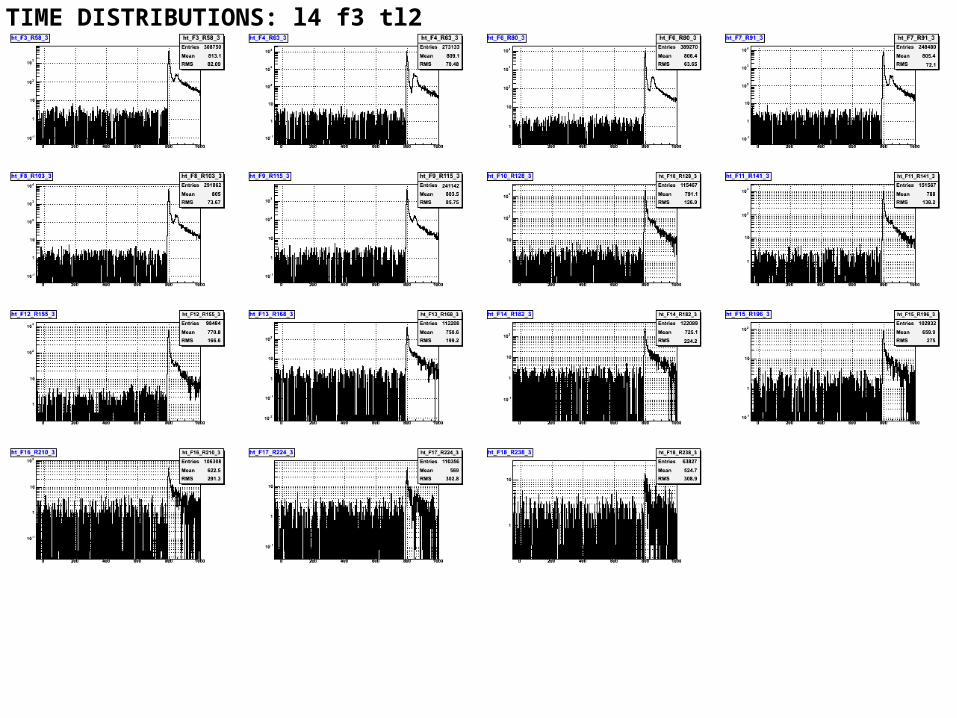
TIME DISTRIBUTIONS: l4_f3_tl2
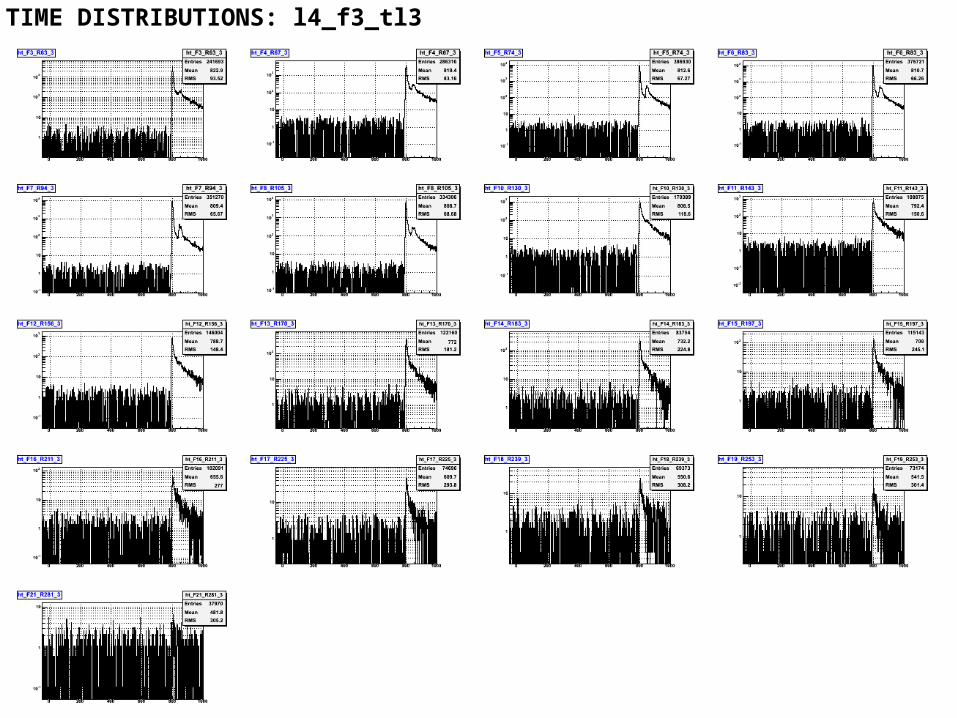
TIME DISTRIBUTIONS: l4_f3_tl3
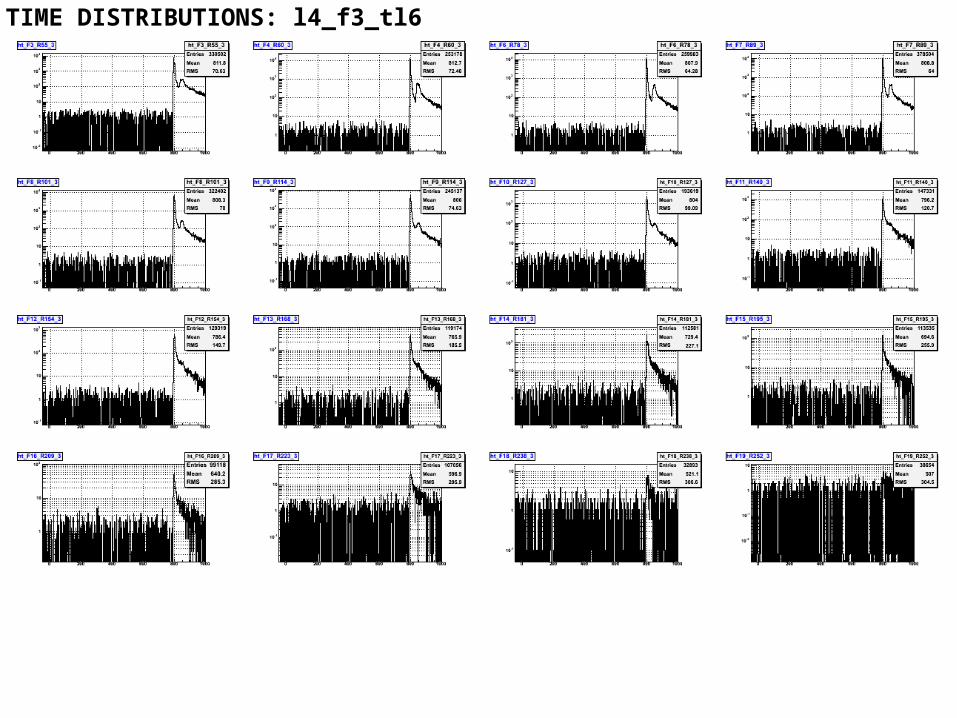
TIME DISTRIBUTIONS: l4_f3_tl6
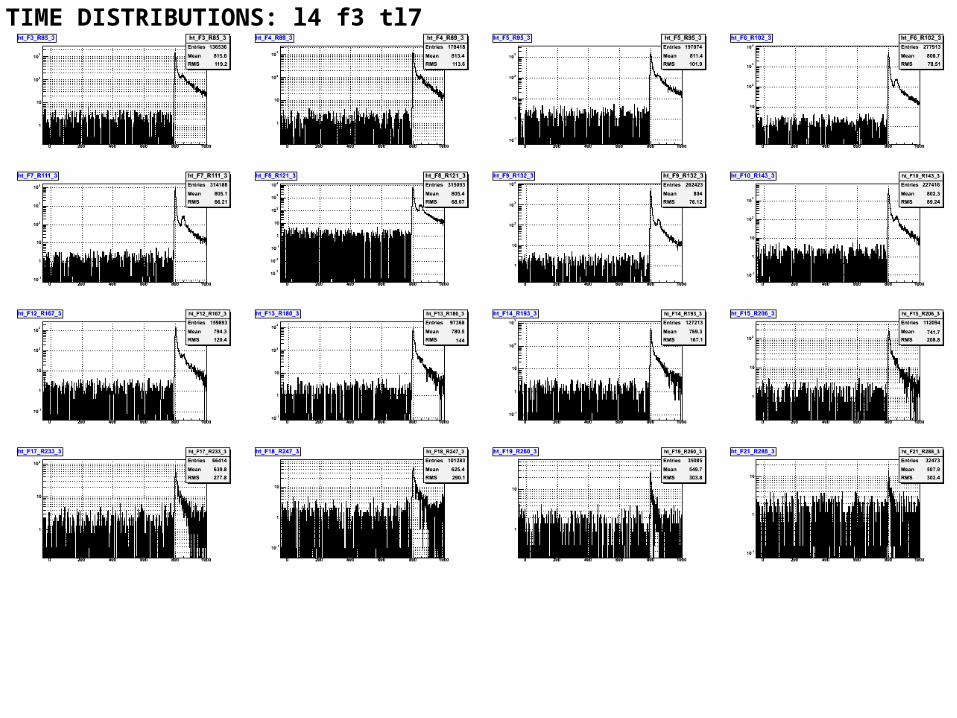
TIME DISTRIBUTIONS: l4_f3_tl7
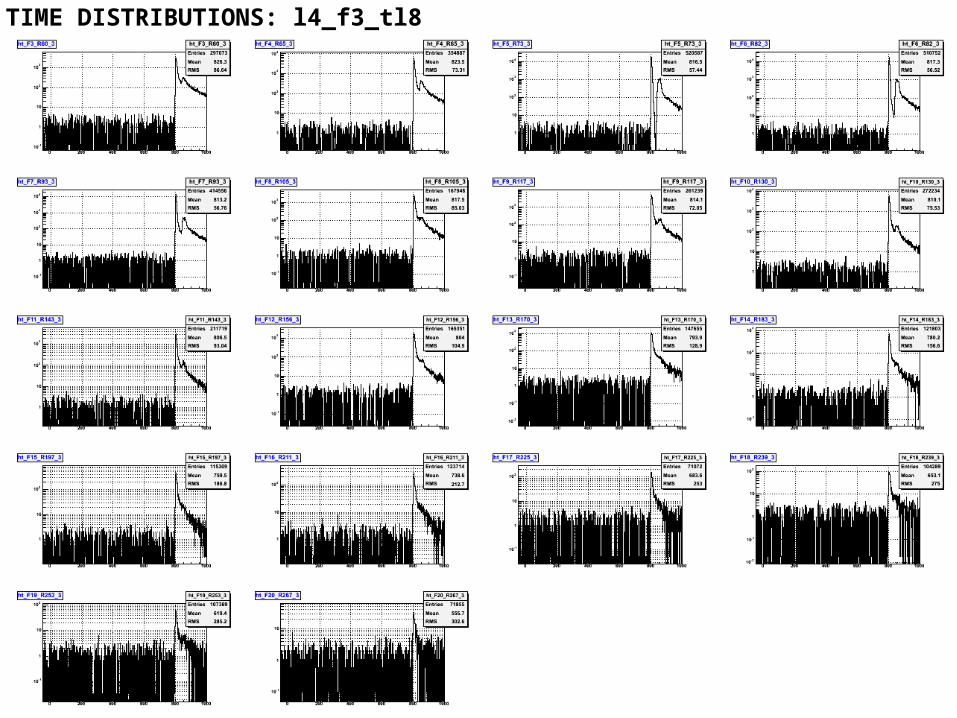
TIME DISTRIBUTIONS: l4_f3_tl8

TIME DISTRIBUTIONS: l4_f3_tl10
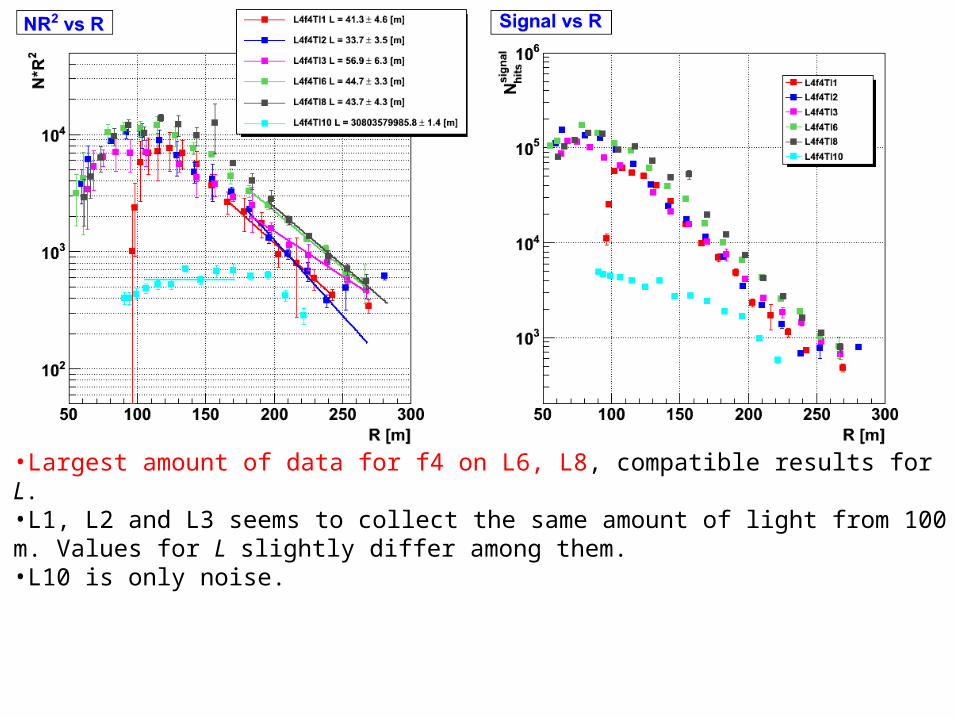
•Largest amount of data for f4 on L6, L8, compatible results for L.•L1, L2 and L3 seems to collect the same amount of light from 100 m. Values for L slightly differ among them.•L10 is only noise.

TIME DISTRIBUTIONS: l4_f4_tl1
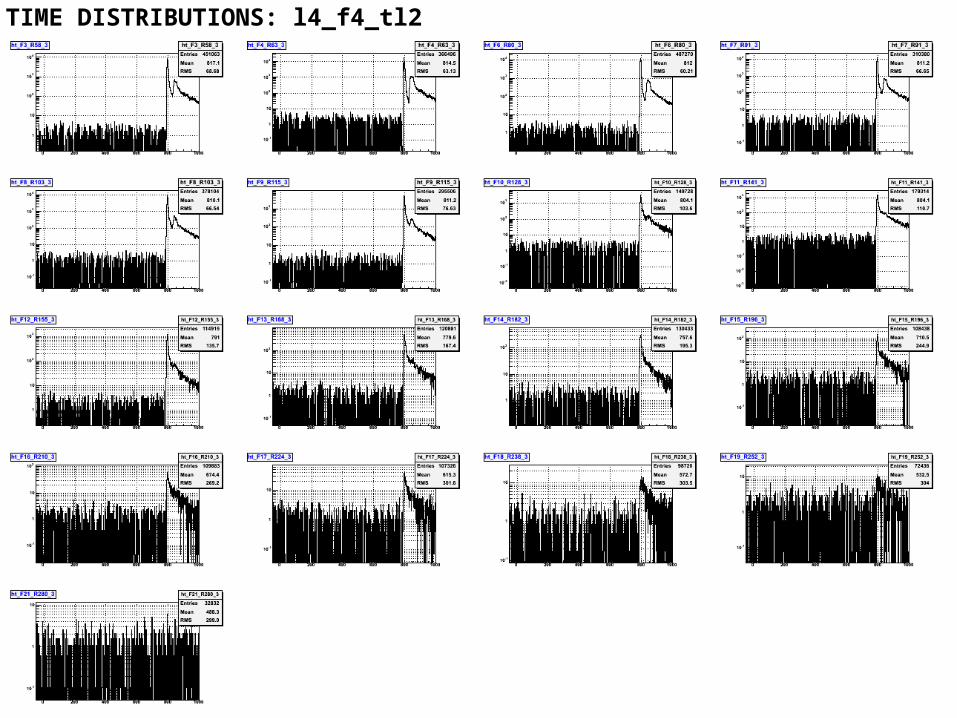
TIME DISTRIBUTIONS: l4_f4_tl2
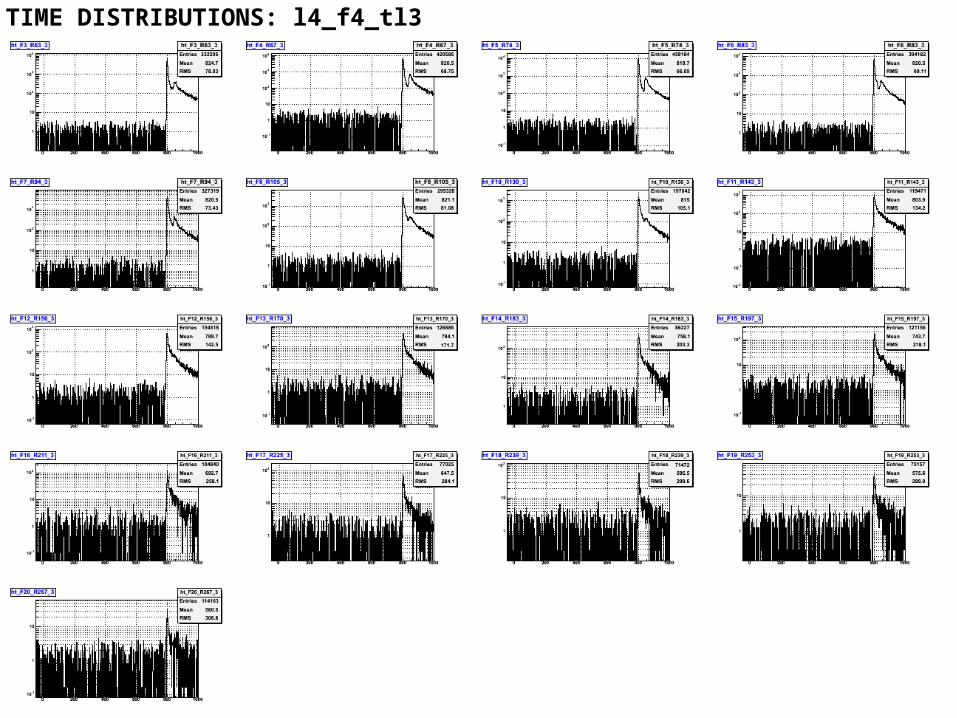
TIME DISTRIBUTIONS: l4_f4_tl3

TIME DISTRIBUTIONS: l4_f4_tl6
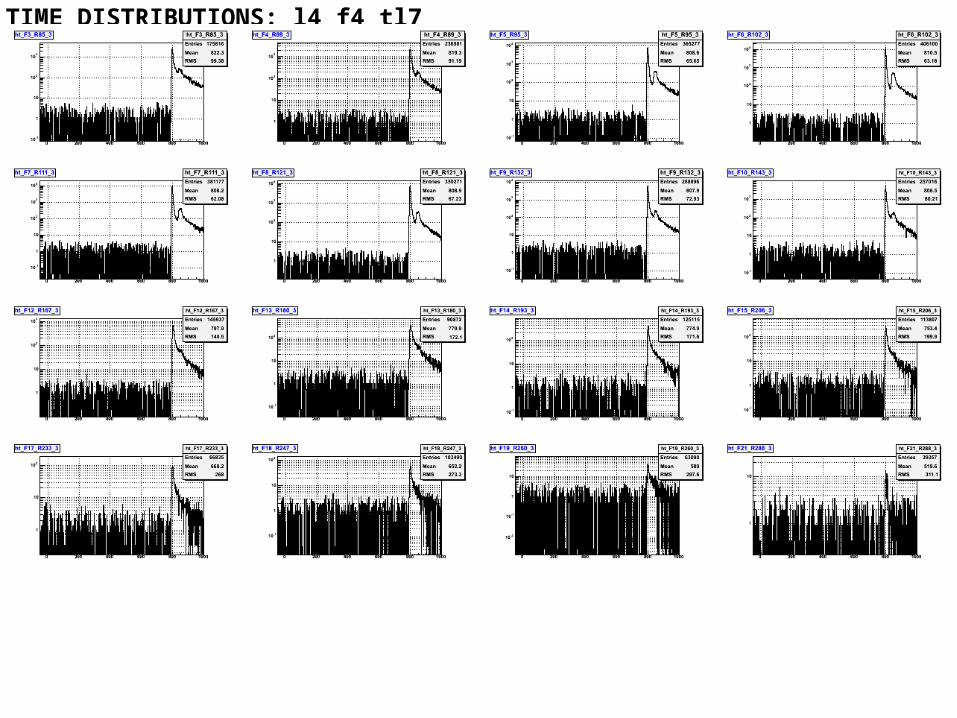
TIME DISTRIBUTIONS: l4_f4_tl7
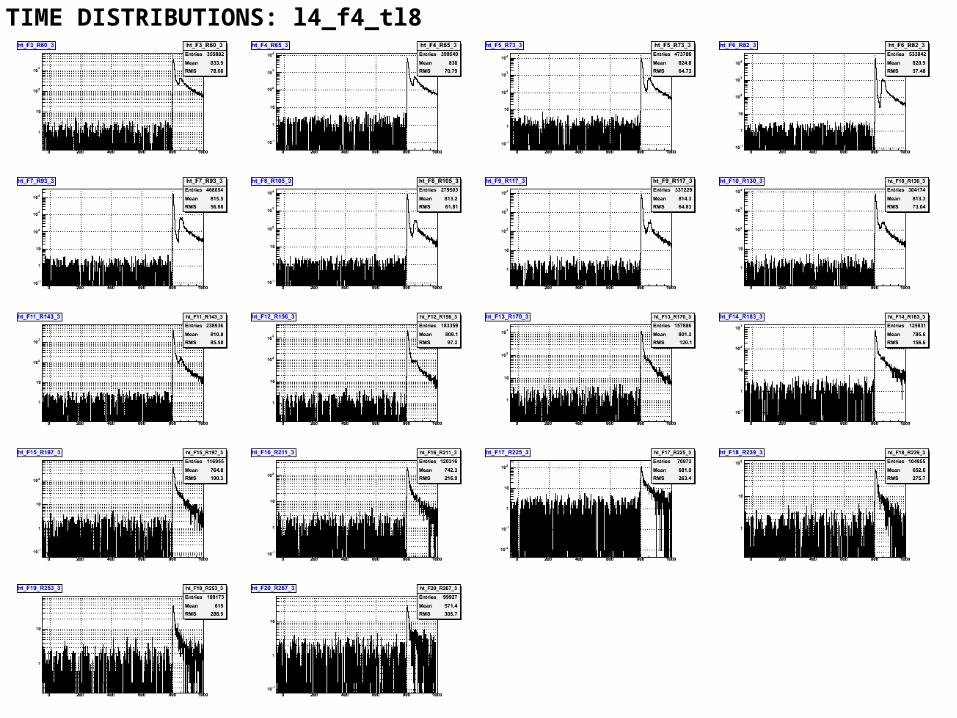
TIME DISTRIBUTIONS: l4_f4_tl8
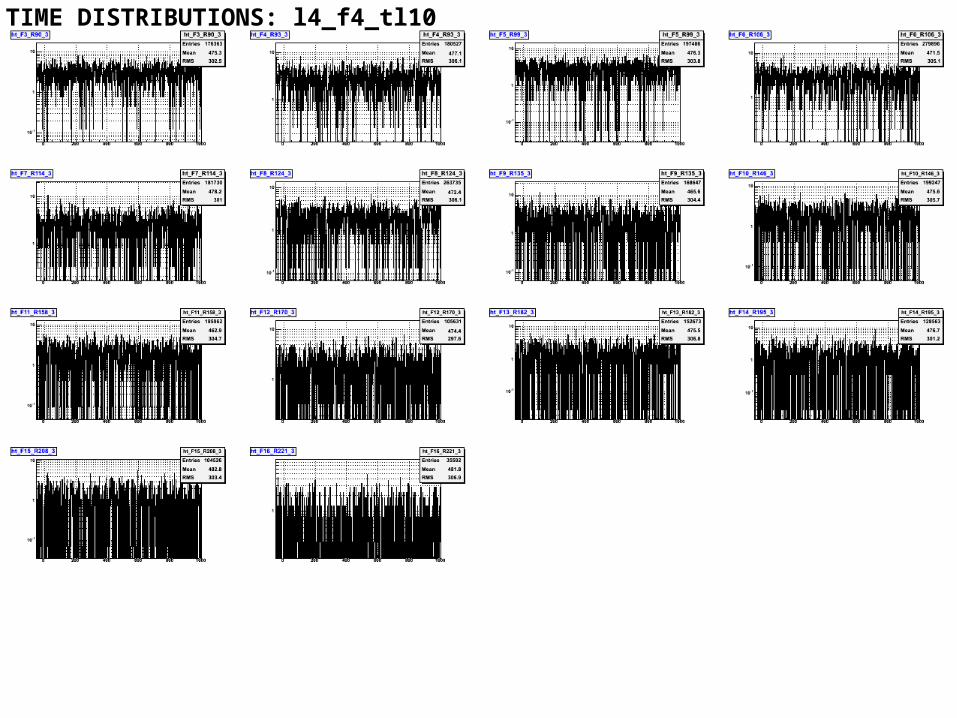
TIME DISTRIBUTIONS: l4_f4_tl10
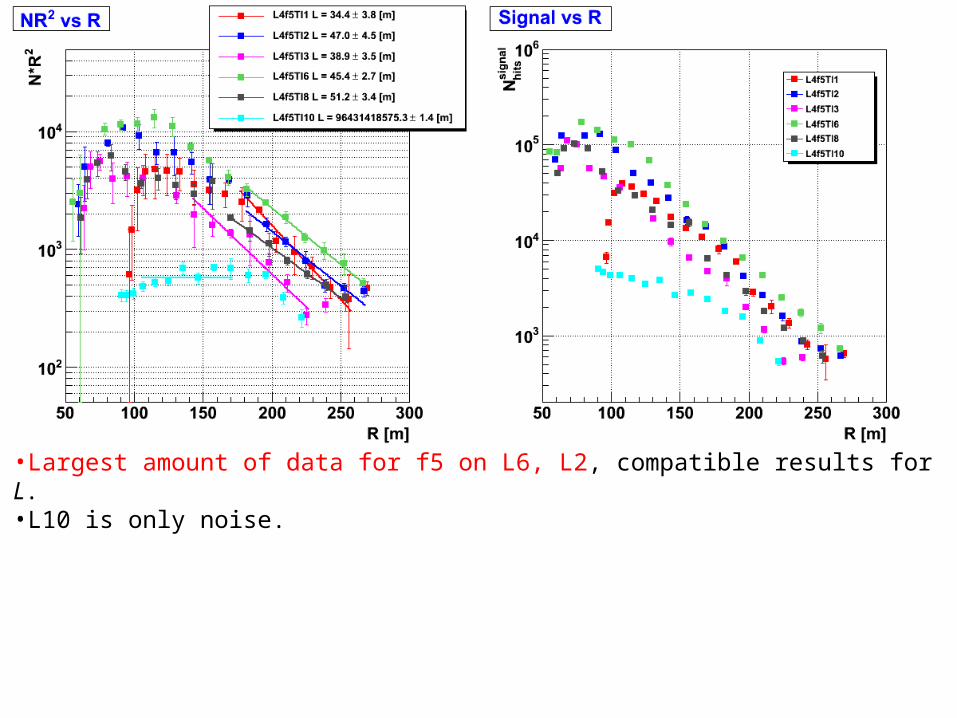
•Largest amount of data for f5 on L6, L2, compatible results for L.•L10 is only noise.
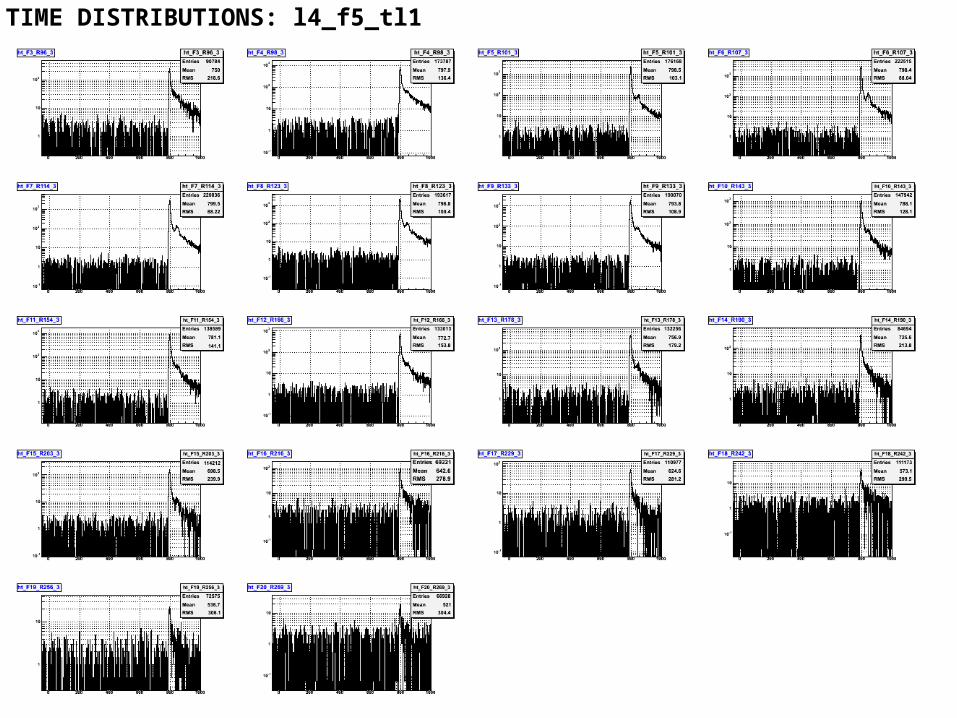
TIME DISTRIBUTIONS: l4_f5_tl1
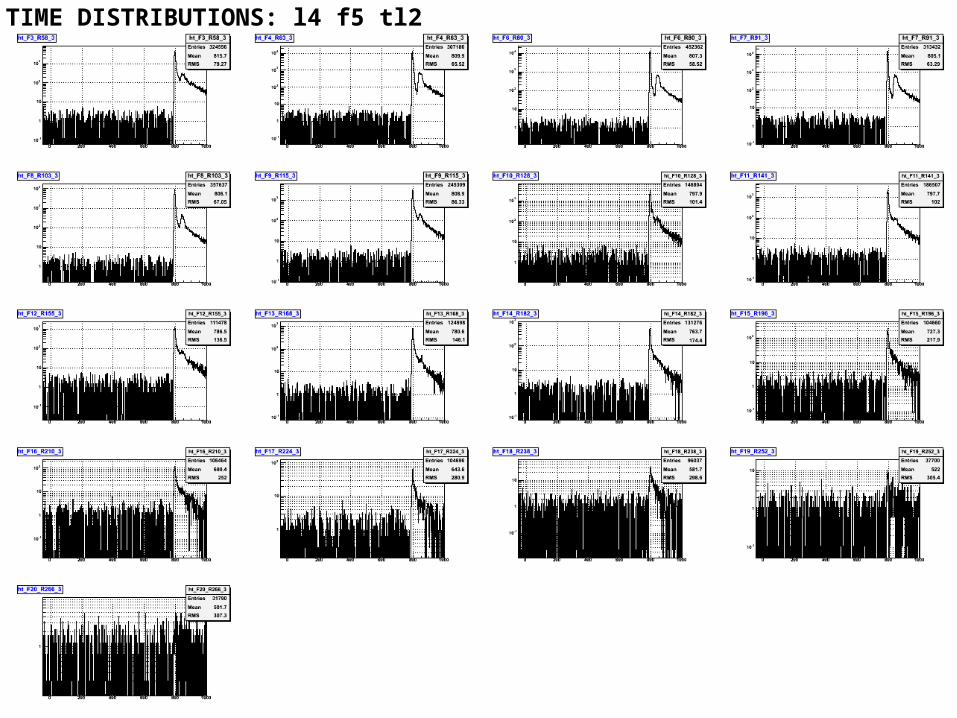
TIME DISTRIBUTIONS: l4_f5_tl2
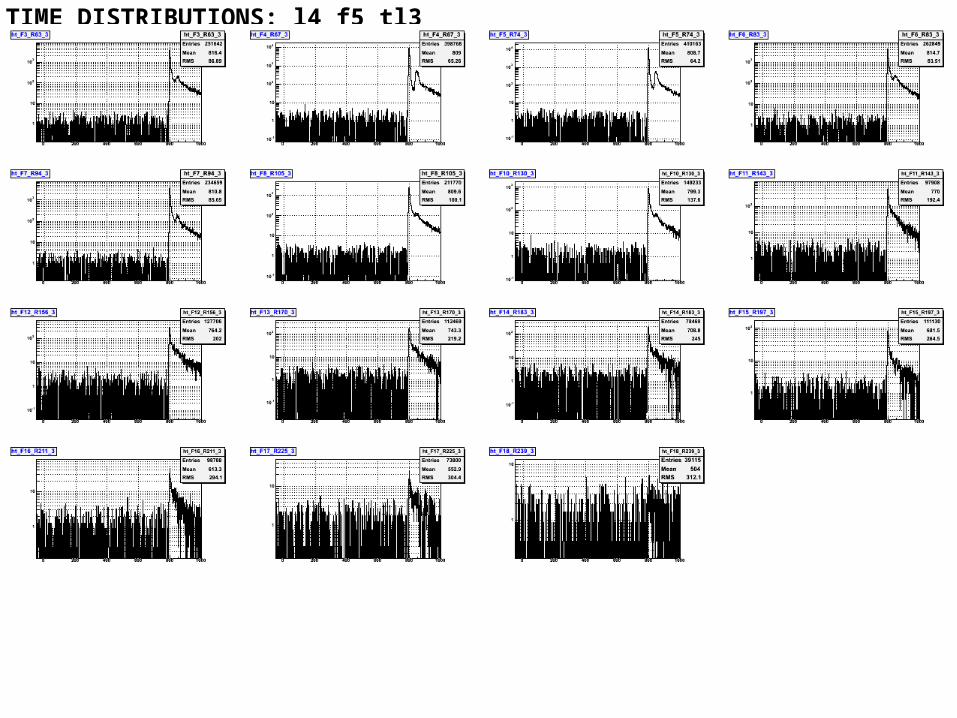
TIME DISTRIBUTIONS: l4_f5_tl3
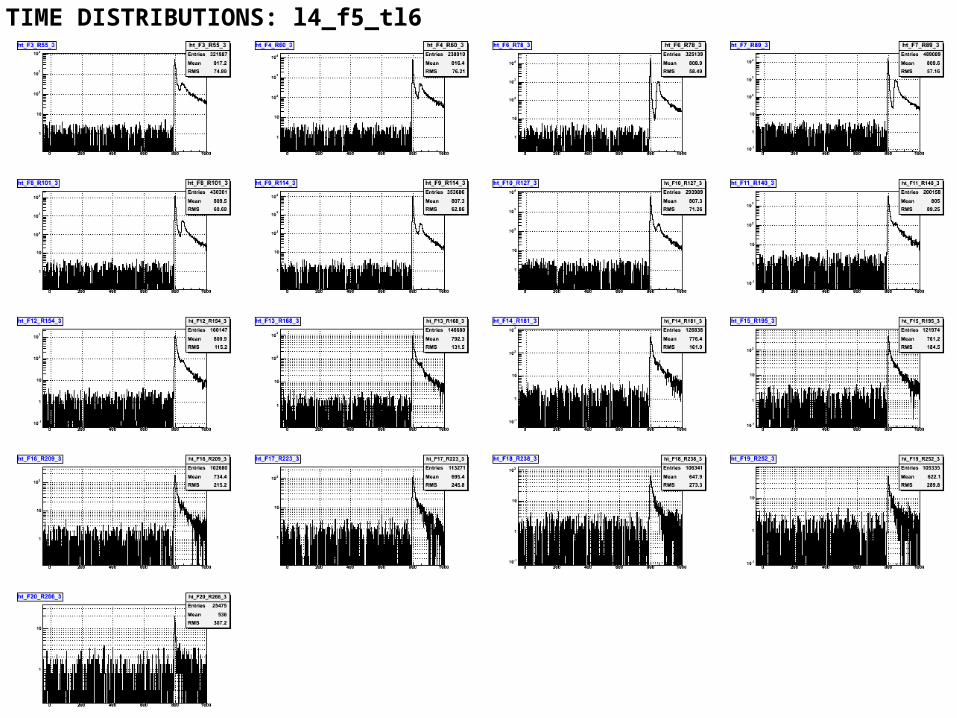
TIME DISTRIBUTIONS: l4_f5_tl6
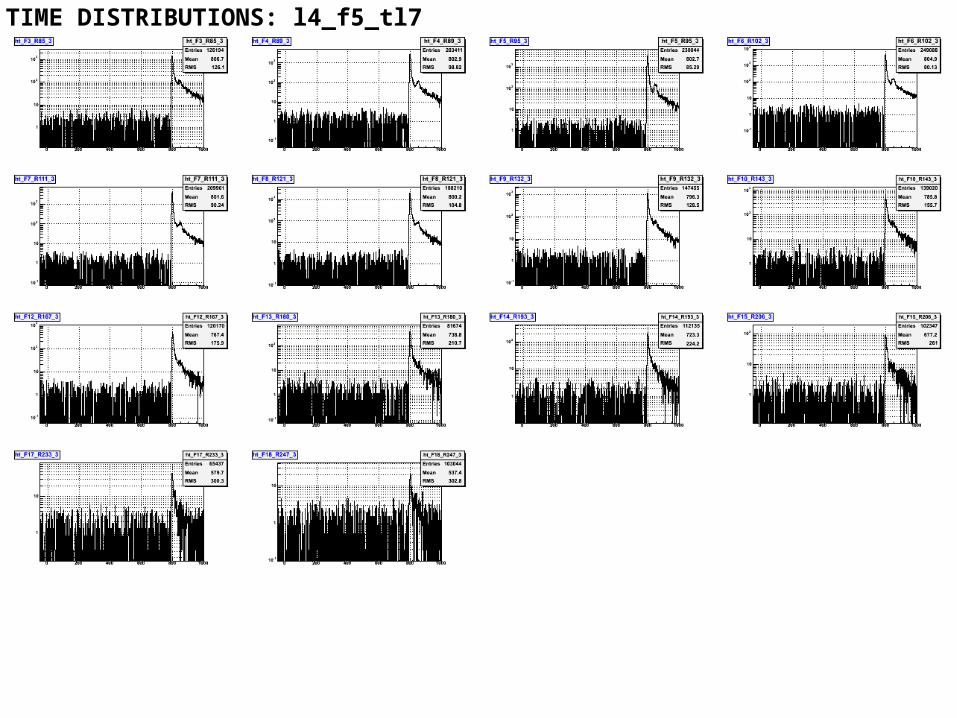
TIME DISTRIBUTIONS: l4_f5_tl7
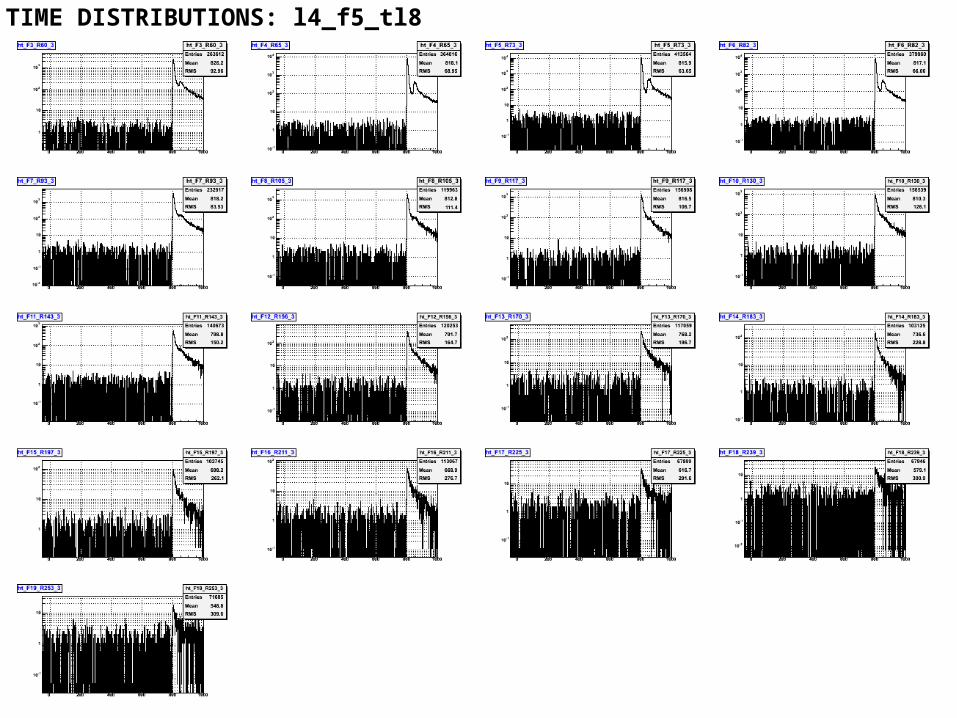
TIME DISTRIBUTIONS: l4_f5_tl8
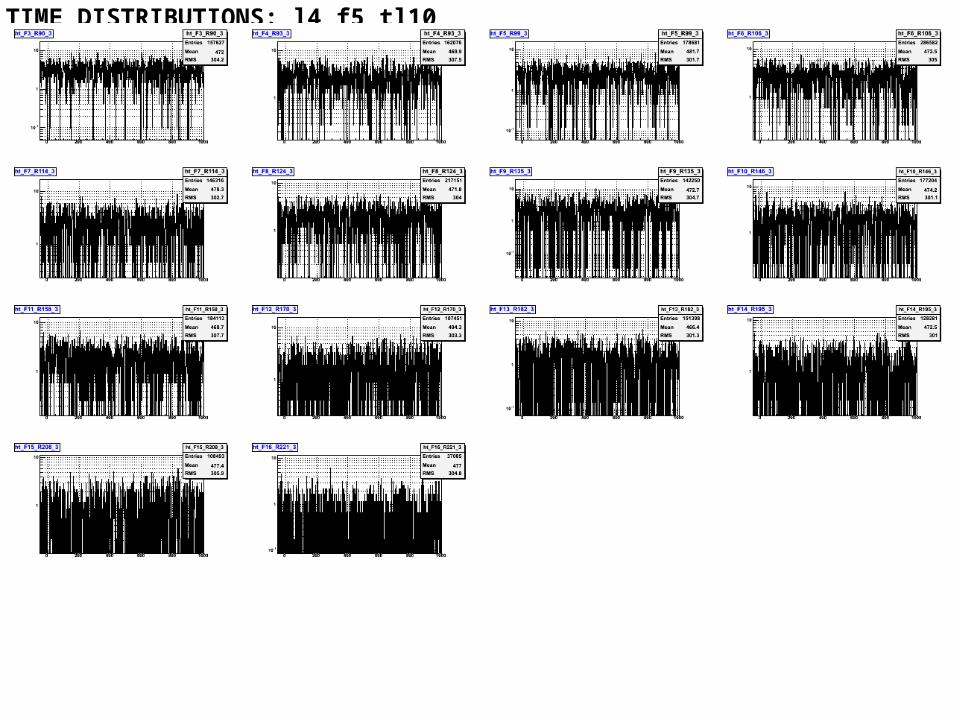
TIME DISTRIBUTIONS: l4_f5_tl10

•Largest amount of data for f6 on L6, L2, compatible results for L.•L10 is only noise.
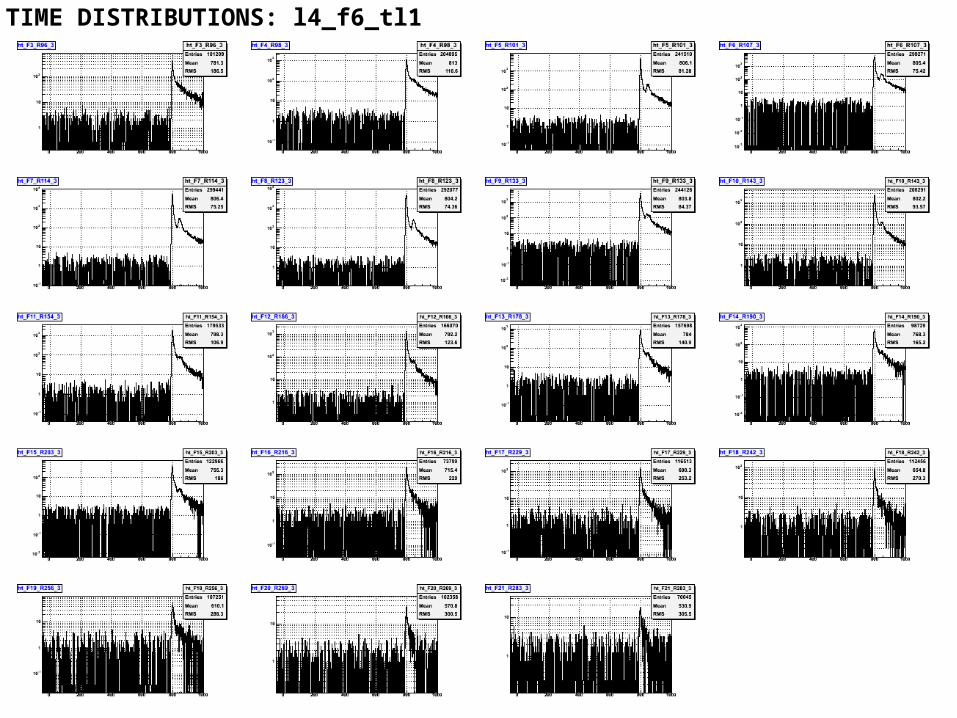
TIME DISTRIBUTIONS: l4_f6_tl1
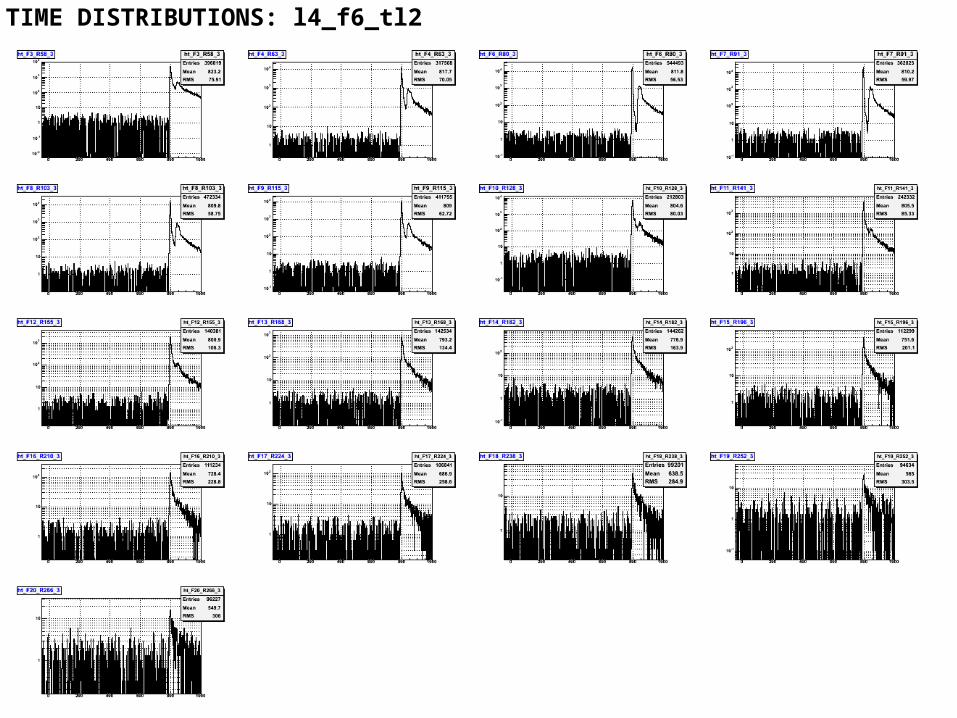
TIME DISTRIBUTIONS: l4_f6_tl2
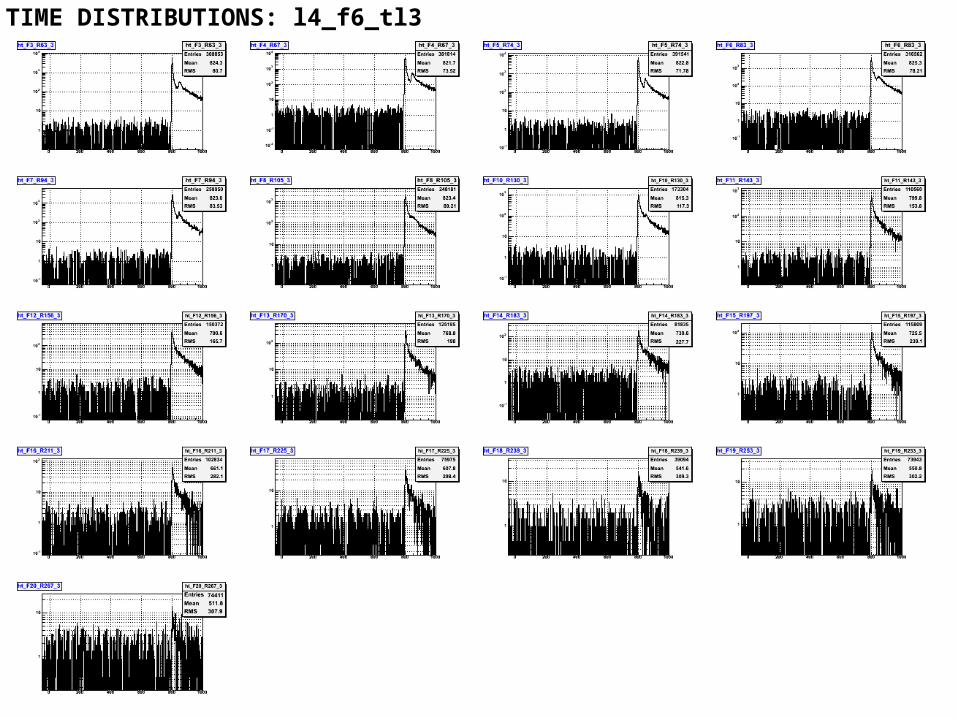
TIME DISTRIBUTIONS: l4_f6_tl3
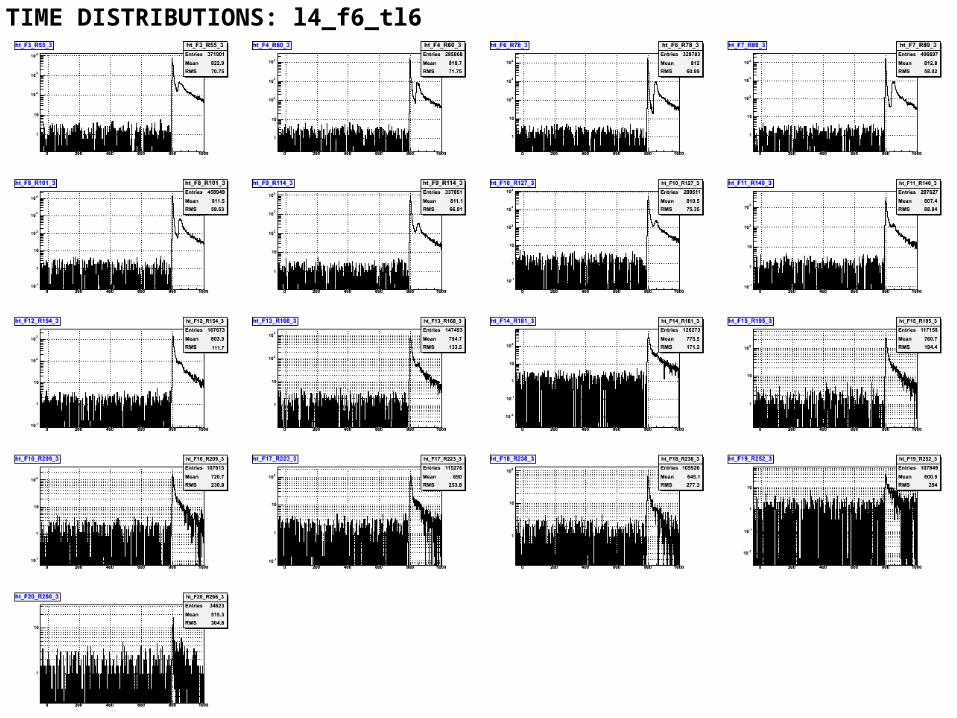
TIME DISTRIBUTIONS: l4_f6_tl6
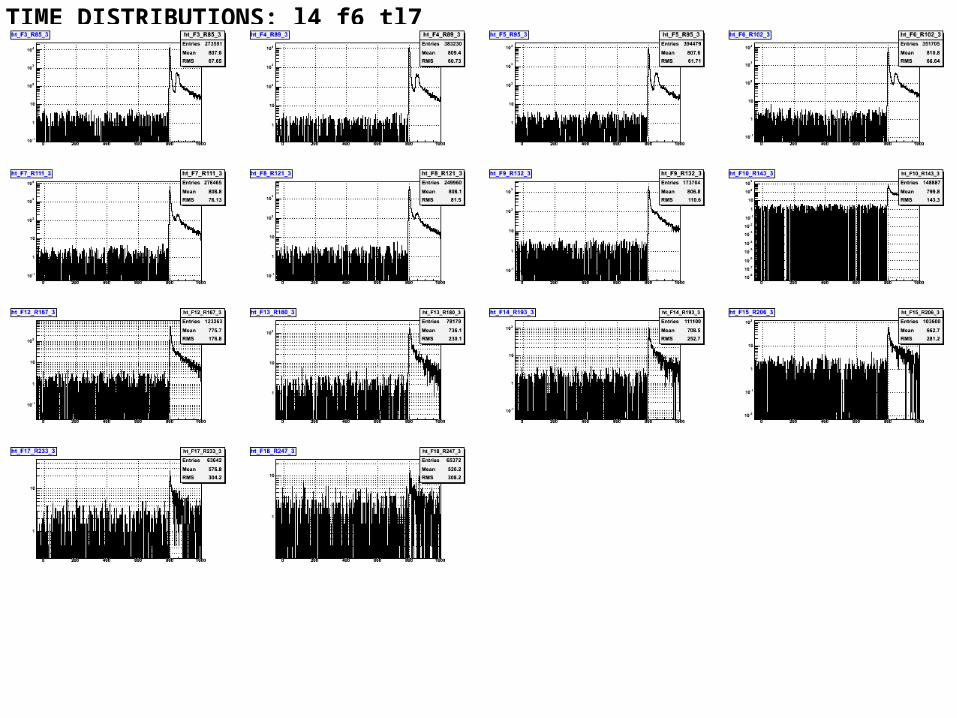
TIME DISTRIBUTIONS: l4_f6_tl7

TIME DISTRIBUTIONS: l4_f6_tl8
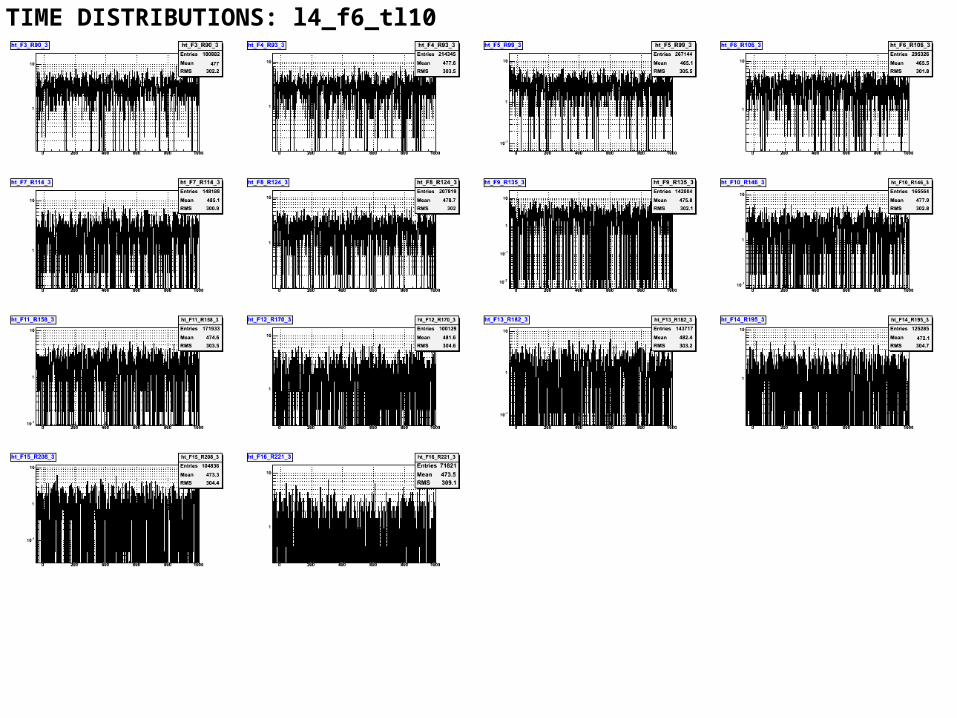
TIME DISTRIBUTIONS: l4_f6_tl10
SAME TARGET LINE FOR DIFFERENT FACES: L4 MULTI-FACES RUNS

•The amount of light collected in a same target line due to different LEDs in the OB can differs up to 63 %. This change in the amount of light has an impact on the value of L and its error, this in target line L1.
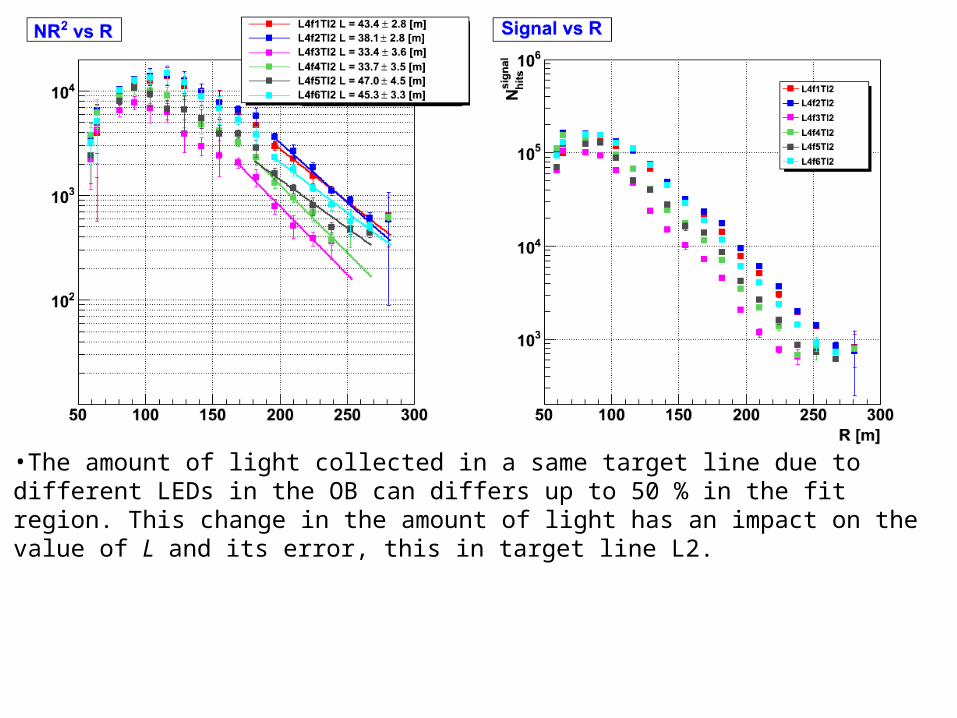
•The amount of light collected in a same target line due to different LEDs in the OB can differs up to 50 % in the fit region. This change in the amount of light has an impact on the value of L and its error, this in target line L2.
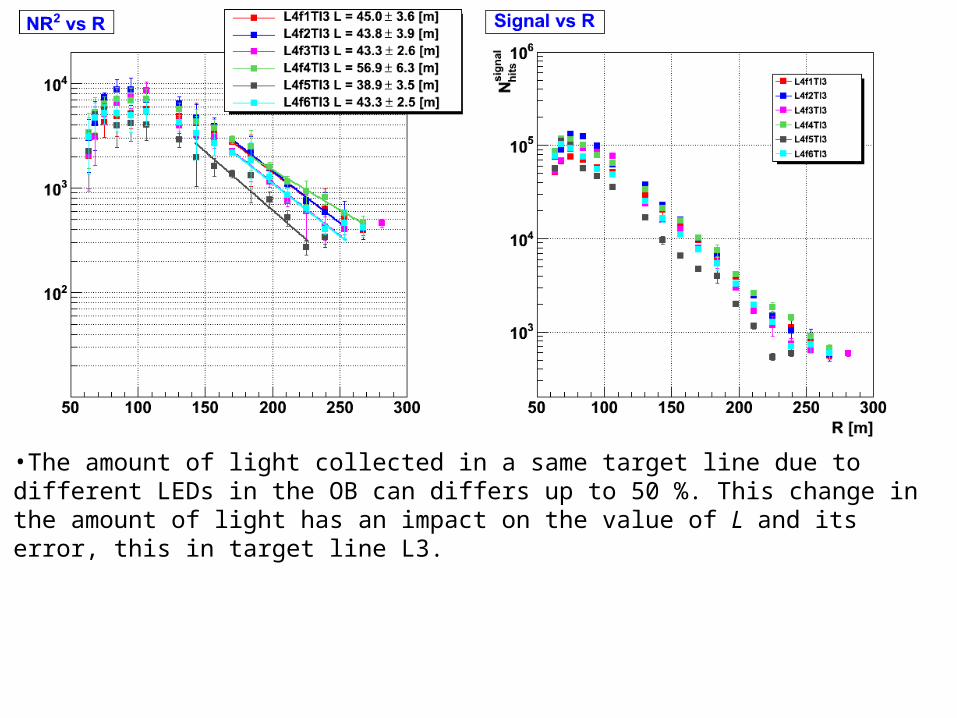
•The amount of light collected in a same target line due to different LEDs in the OB can differs up to 50 %. This change in the amount of light has an impact on the value of L and its error, this in target line L3.
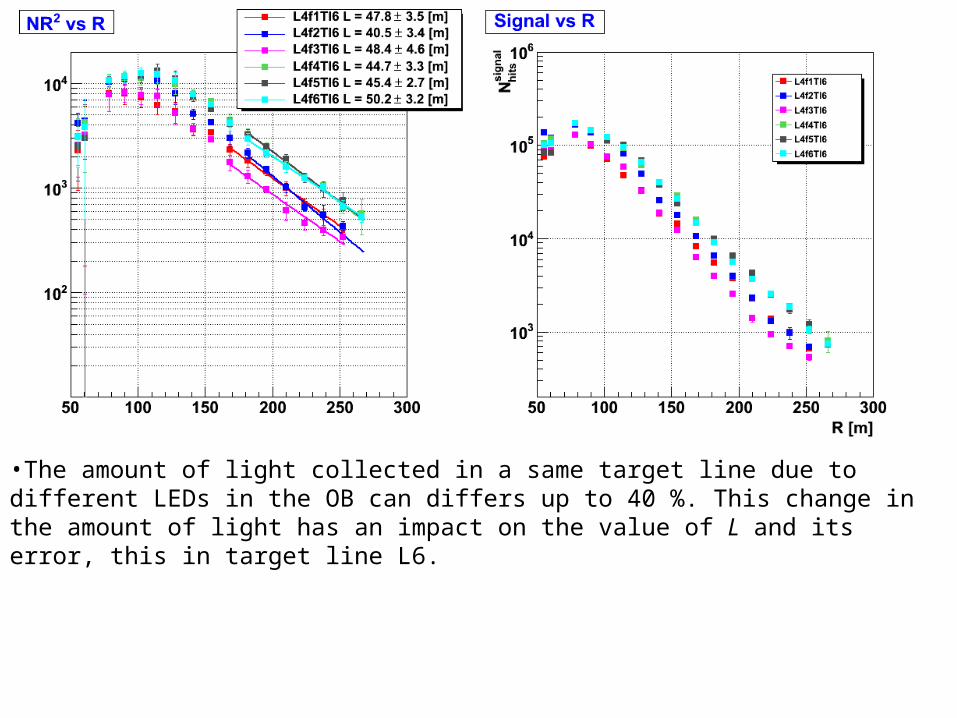
•The amount of light collected in a same target line due to different LEDs in the OB can differs up to 40 %. This change in the amount of light has an impact on the value of L and its error, this in target line L6.
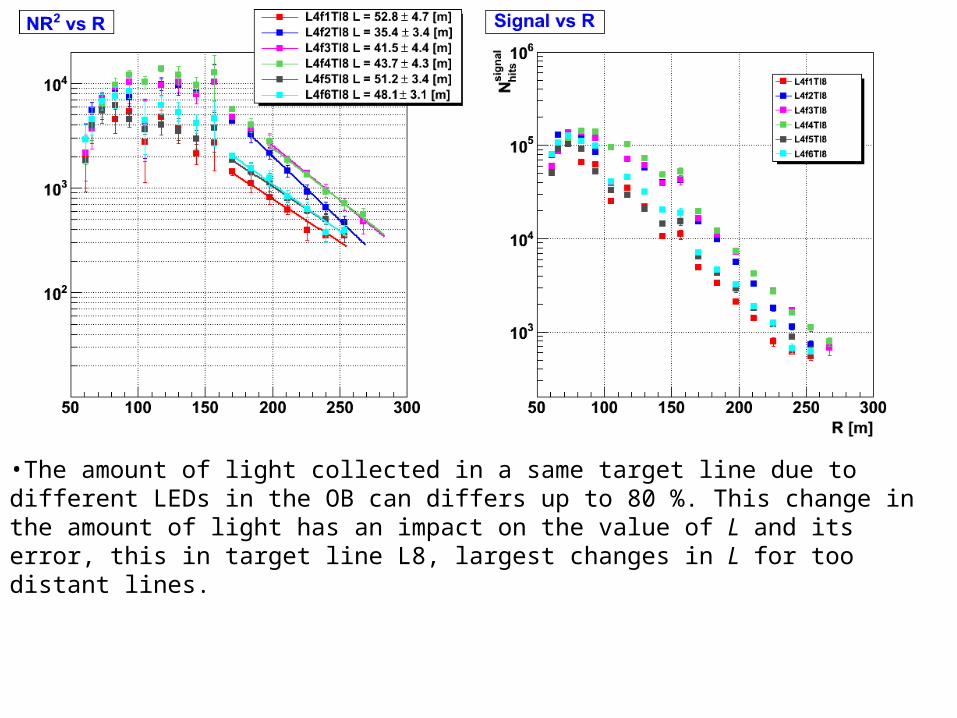
•The amount of light collected in a same target line due to different LEDs in the OB can differs up to 80 %. This change in the amount of light has an impact on the value of L and its error, this in target line L8, largest changes in L for too distant lines.
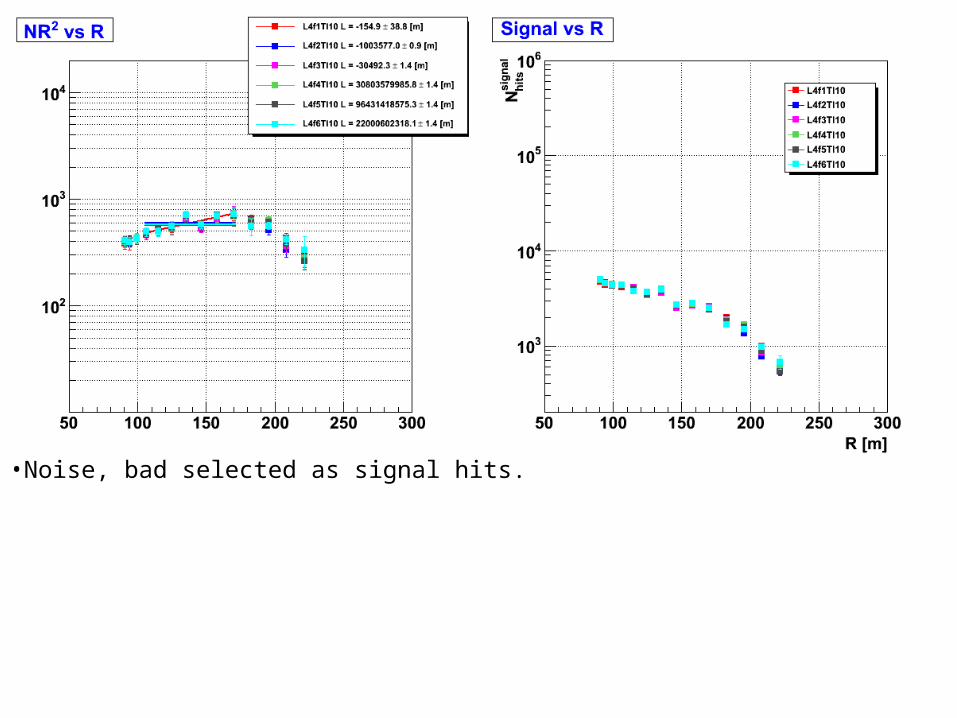
•Noise, bad selected as signal hits.

SAME FACES DIFFERENT TARGET LINES:L2 MULTI-FACES RUNS
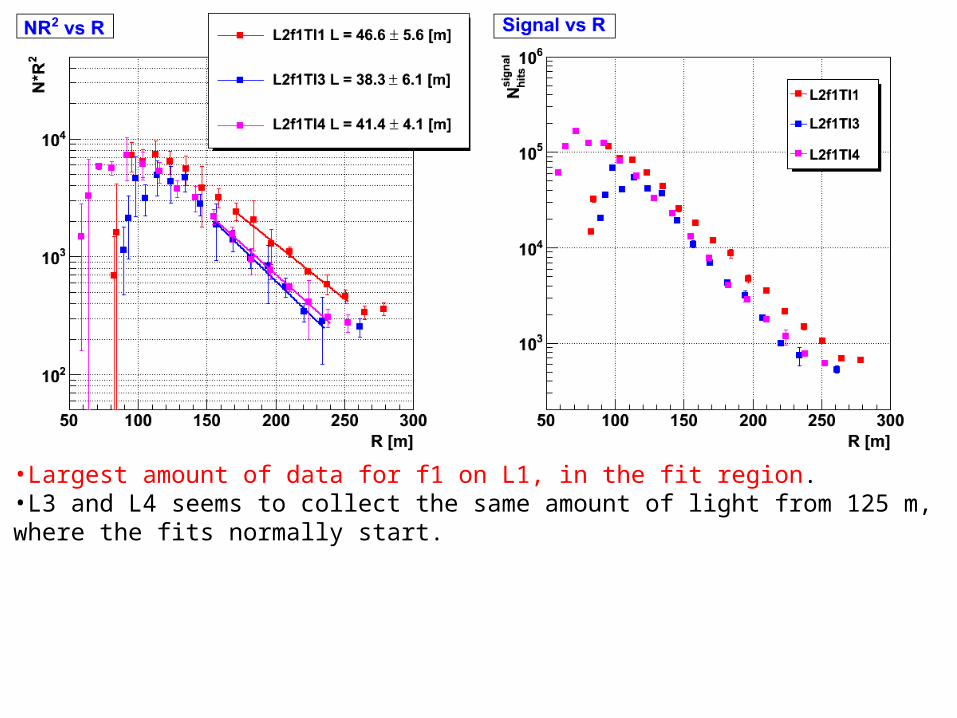
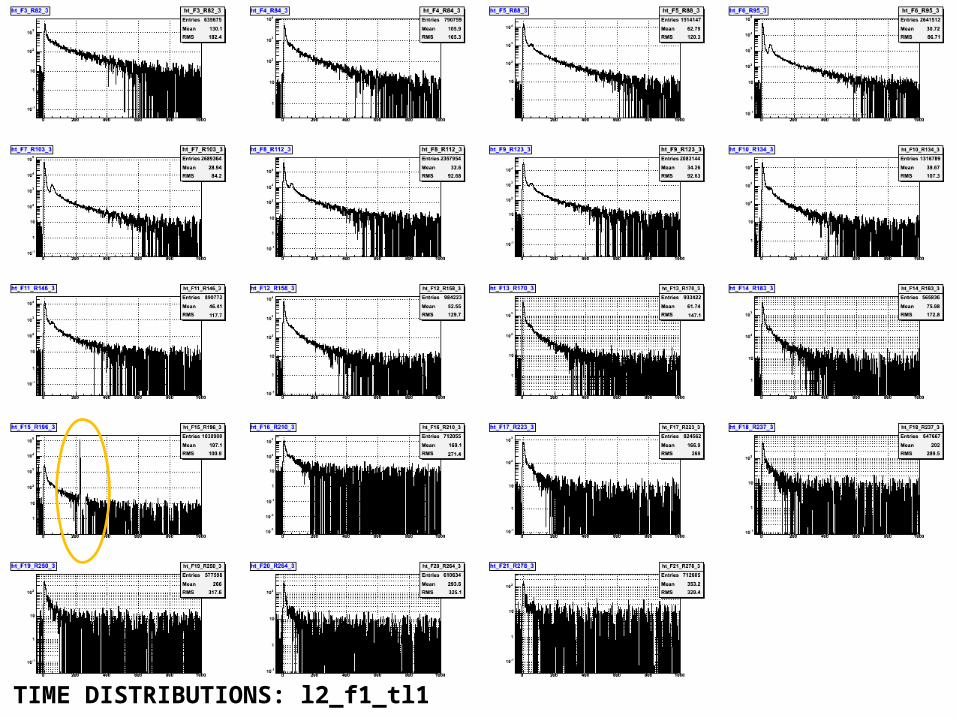
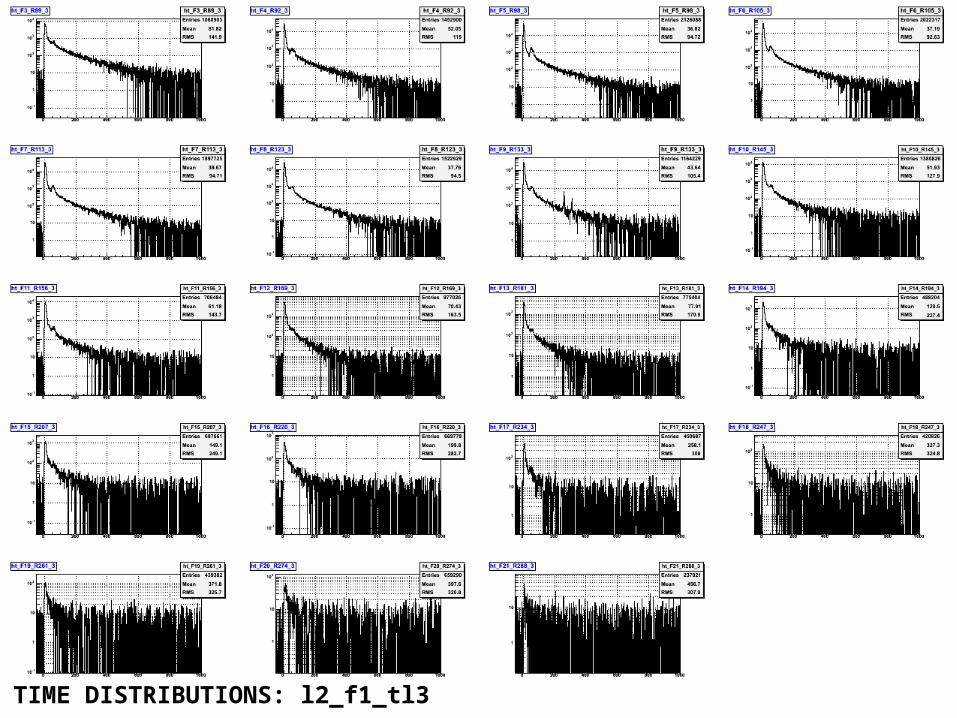
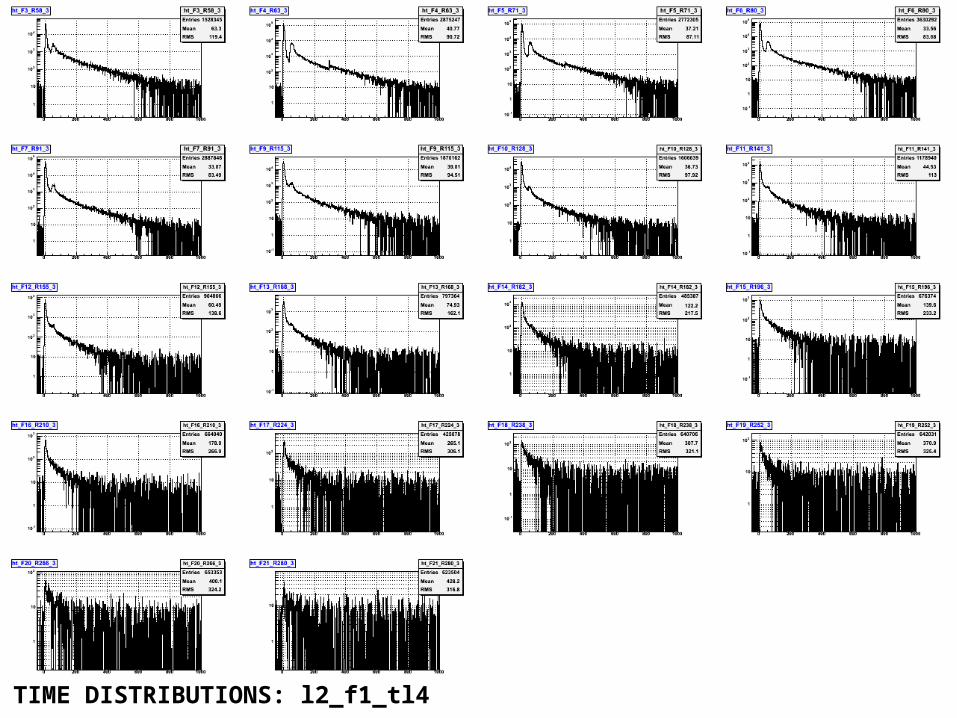
•Largest amount of data for f1 on L1, in the fit region.•L3 and L4 seems to collect the same amount of light from 125 m, where the fits normally start.
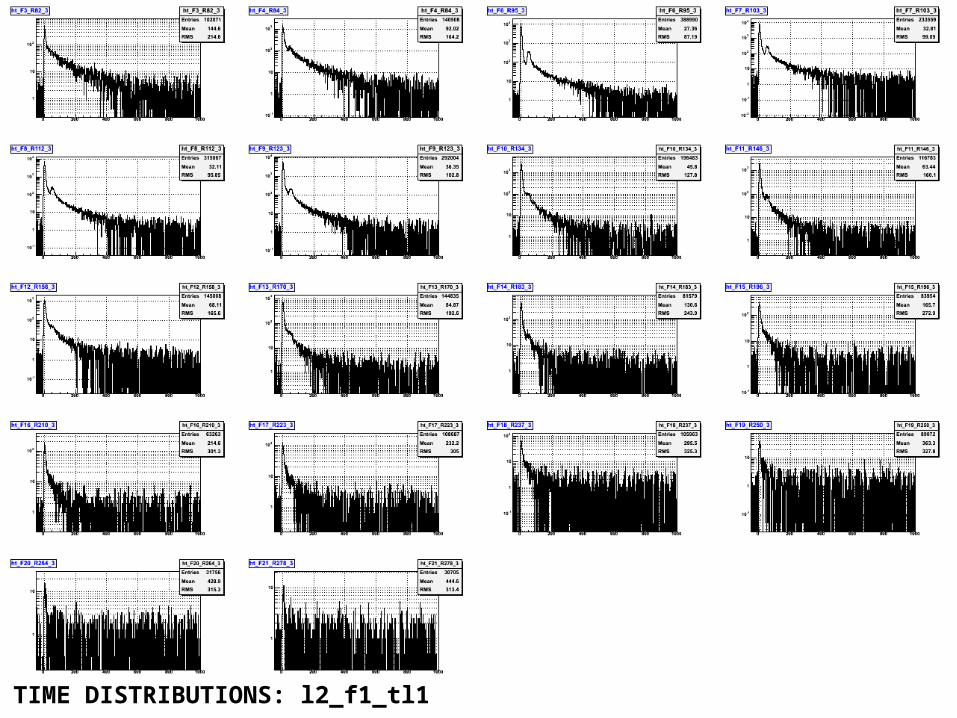
TIME DISTRIBUTIONS: l2_f1_tl1
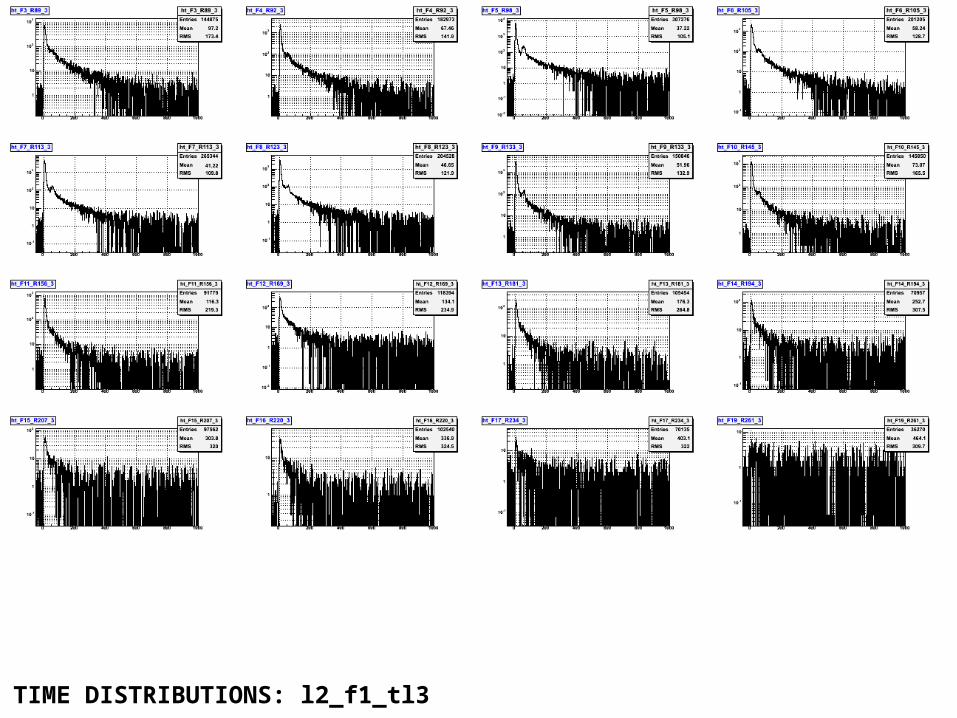
TIME DISTRIBUTIONS: l2_f1_tl3

TIME DISTRIBUTIONS: l2_f1_tl4
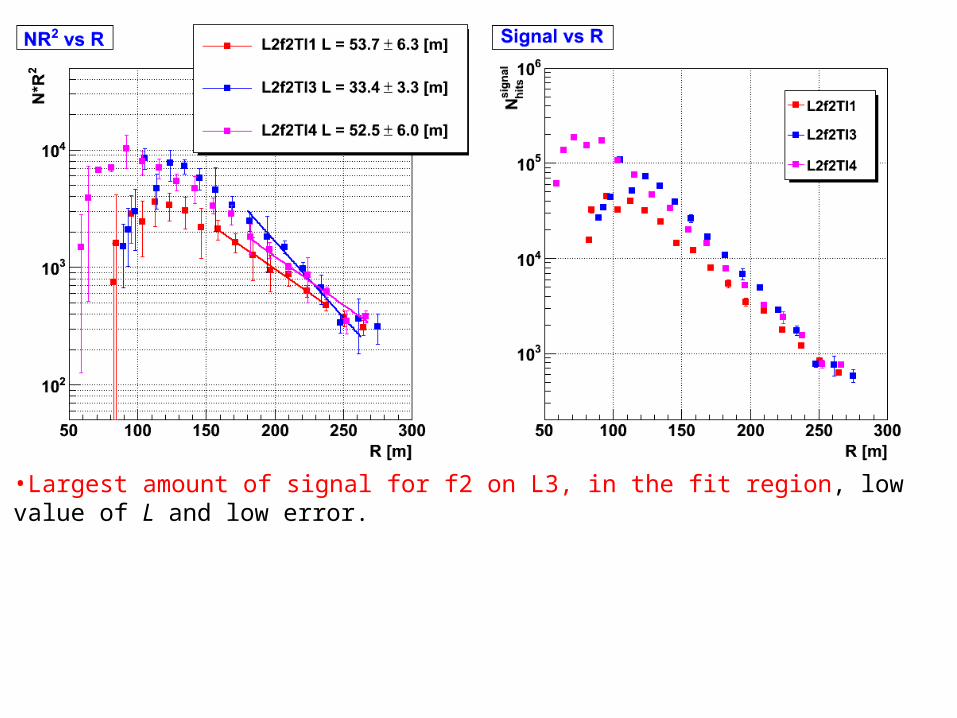
•Largest amount of signal for f2 on L3, in the fit region, low value of L and low error.

TIME DISTRIBUTIONS: l2_f2_tl1

TIME DISTRIBUTIONS: l2_f2_tl3

TIME DISTRIBUTIONS: l2_f2_tl4
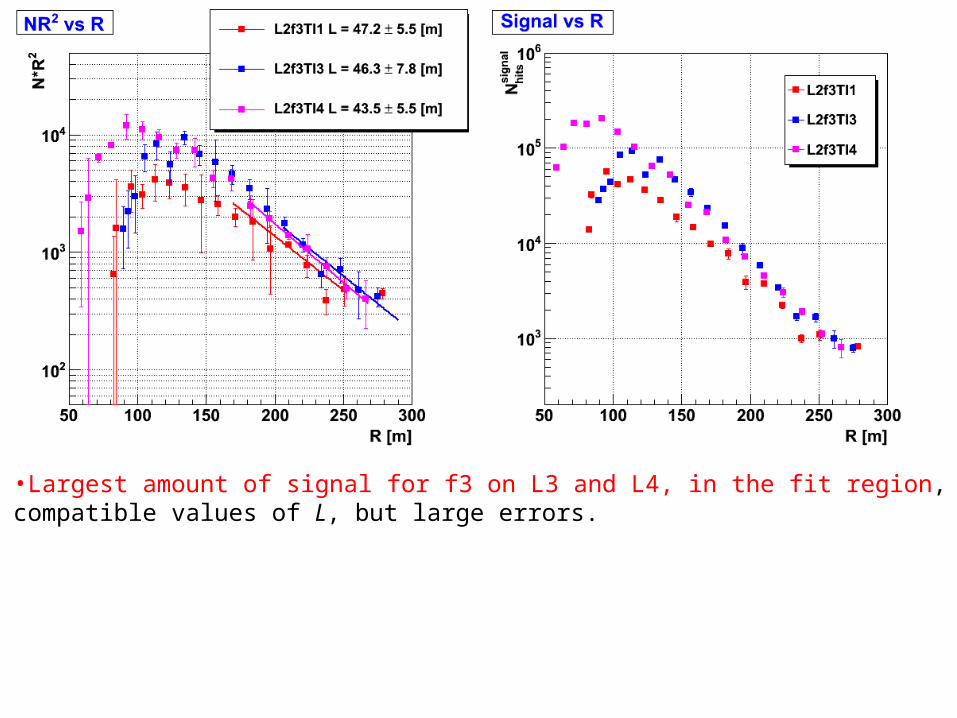
•Largest amount of signal for f3 on L3 and L4, in the fit region, compatible values of L, but large errors.

TIME DISTRIBUTIONS: l2_f3_tl1
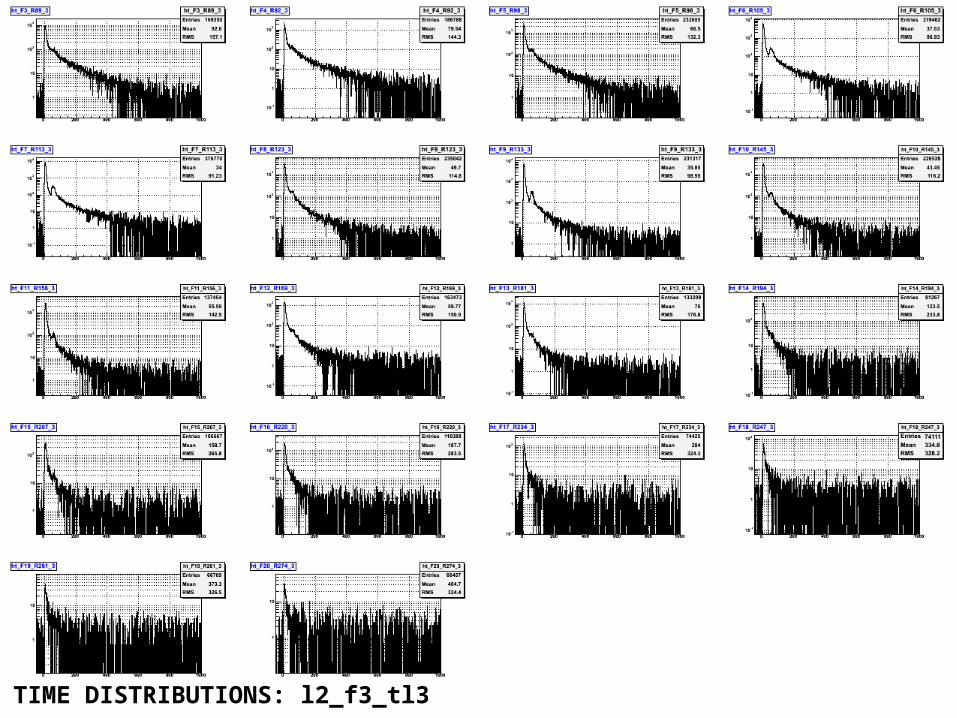
TIME DISTRIBUTIONS: l2_f3_tl3
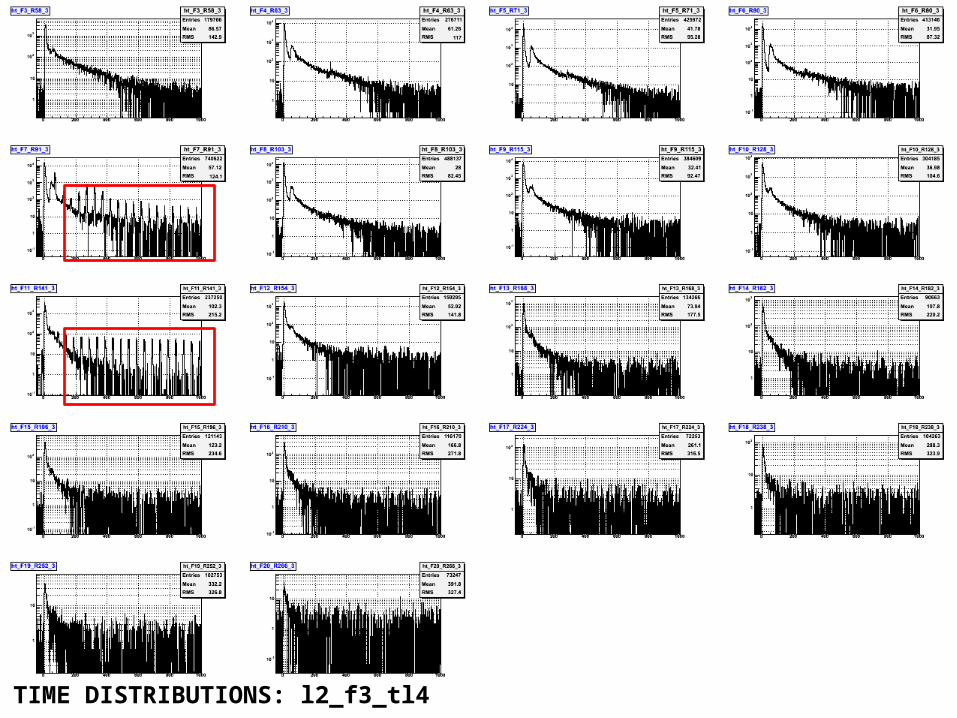
TIME DISTRIBUTIONS: l2_f3_tl4

•Largest amount of signal for f4 on L3 and L4, in the fit region, non-compatible values of L, but errors decrease.
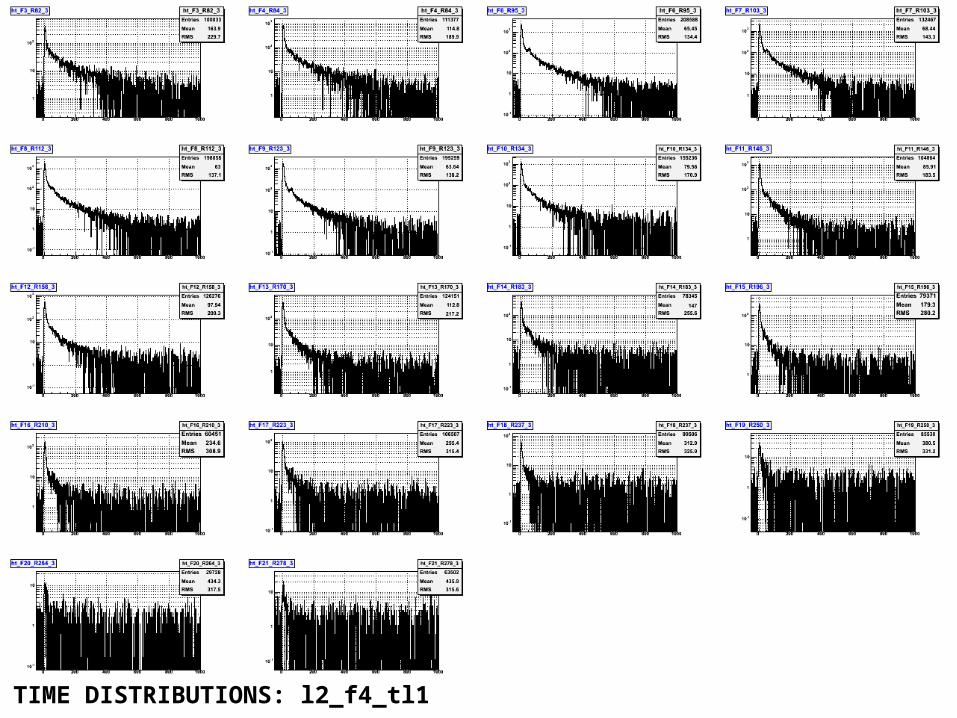
TIME DISTRIBUTIONS: l2_f4_tl1
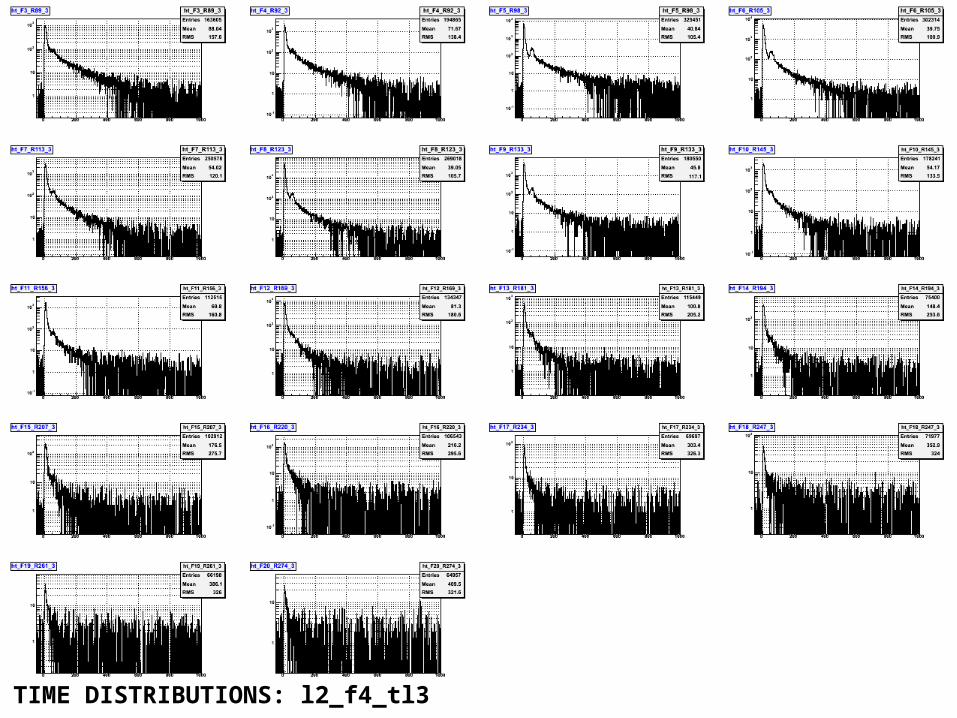
TIME DISTRIBUTIONS: l2_f4_tl3
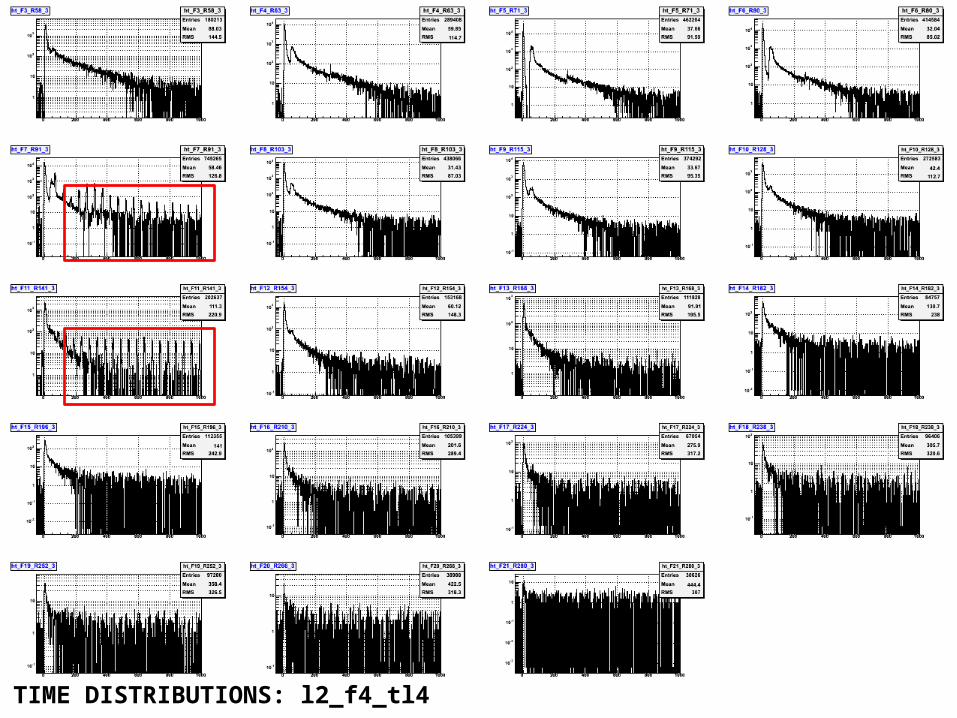
TIME DISTRIBUTIONS: l2_f4_tl4
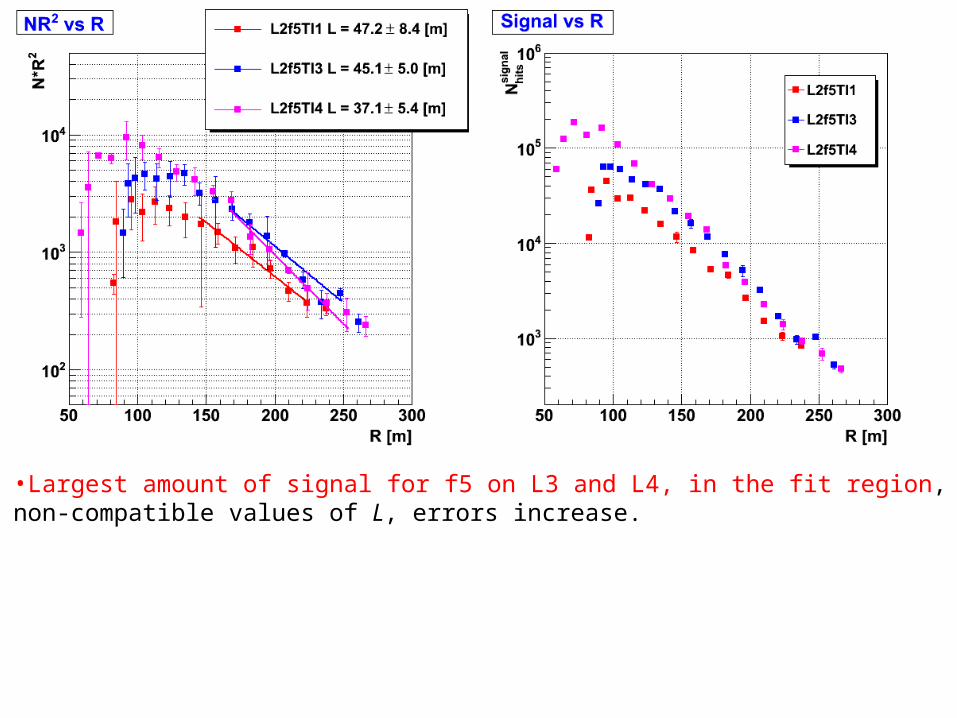
•Largest amount of signal for f5 on L3 and L4, in the fit region, non-compatible values of L, errors increase.
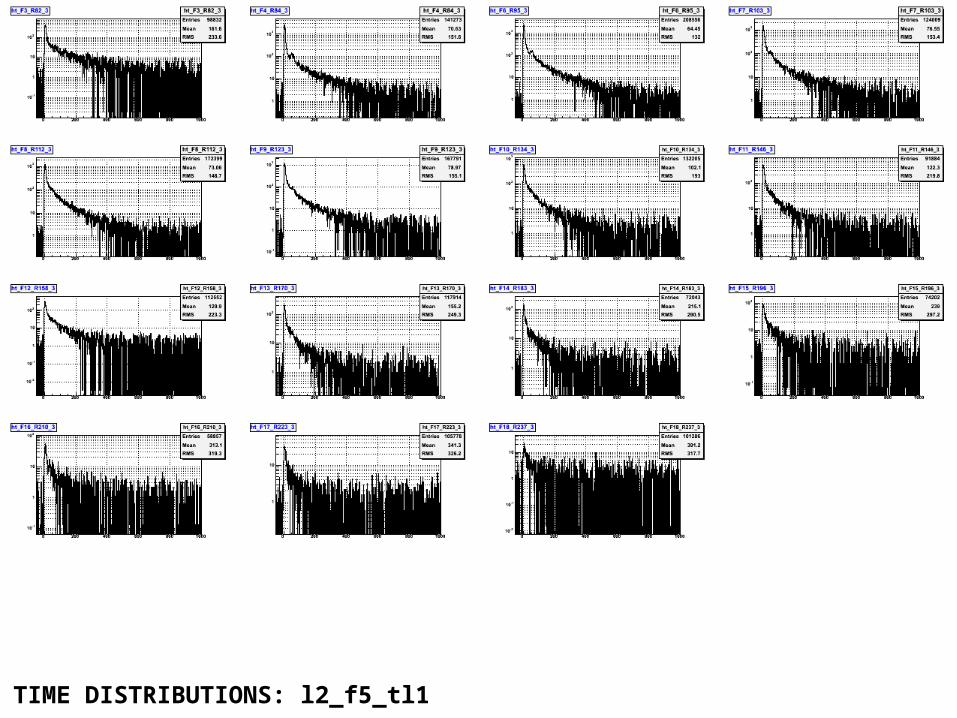
TIME DISTRIBUTIONS: l2_f5_tl1
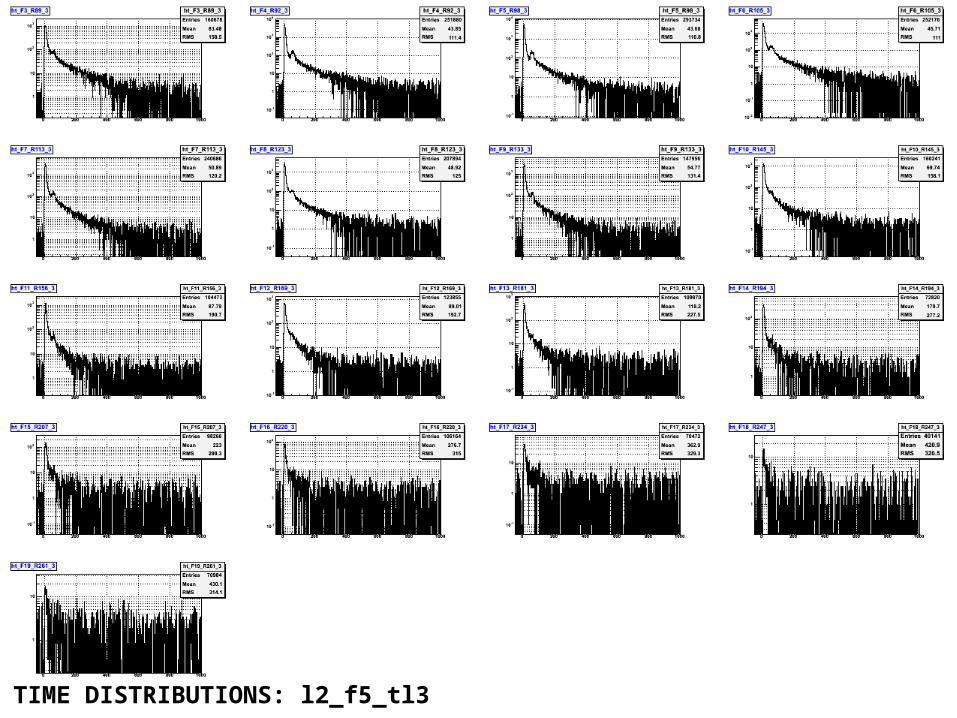
TIME DISTRIBUTIONS: l2_f5_tl3

TIME DISTRIBUTIONS: l2_f5_tl4
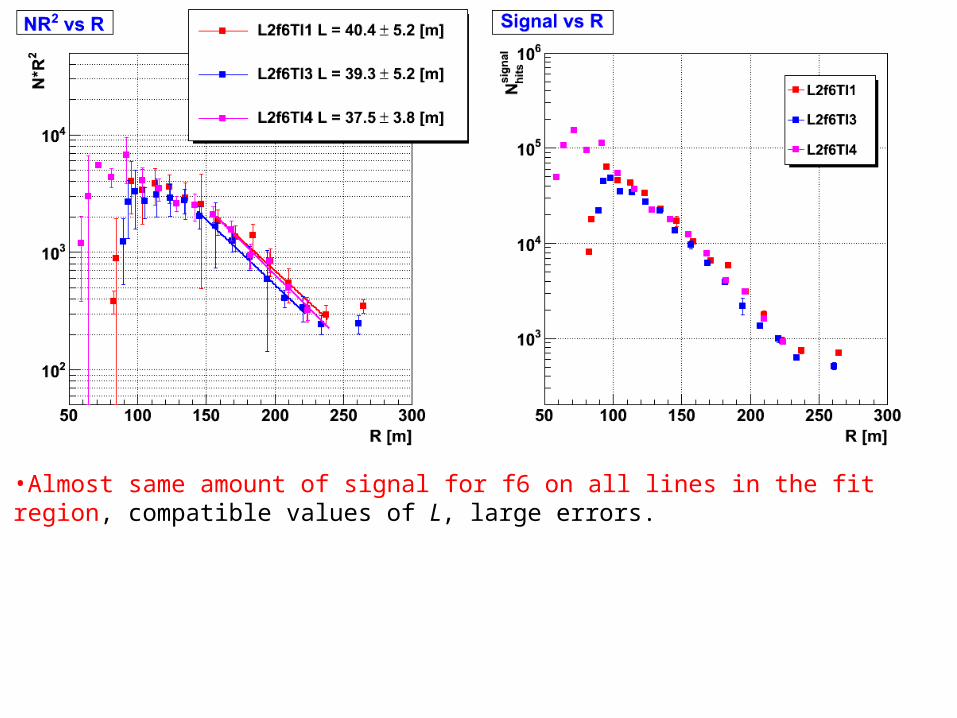
•Almost same amount of signal for f6 on all lines in the fit region, compatible values of L, large errors.
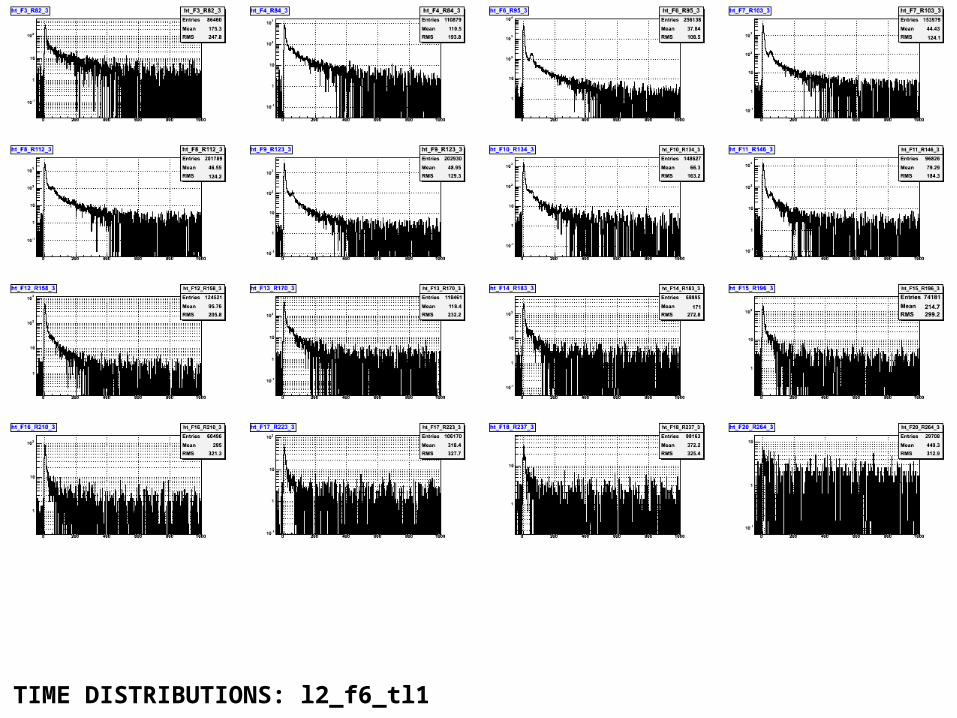
TIME DISTRIBUTIONS: l2_f6_tl1
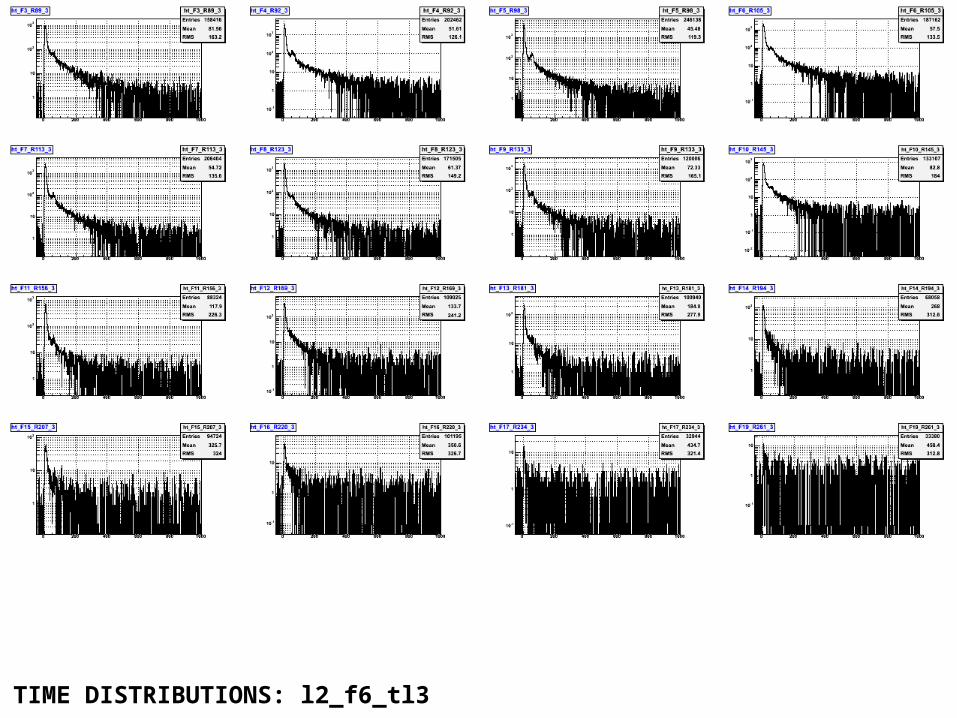
TIME DISTRIBUTIONS: l2_f6_tl3
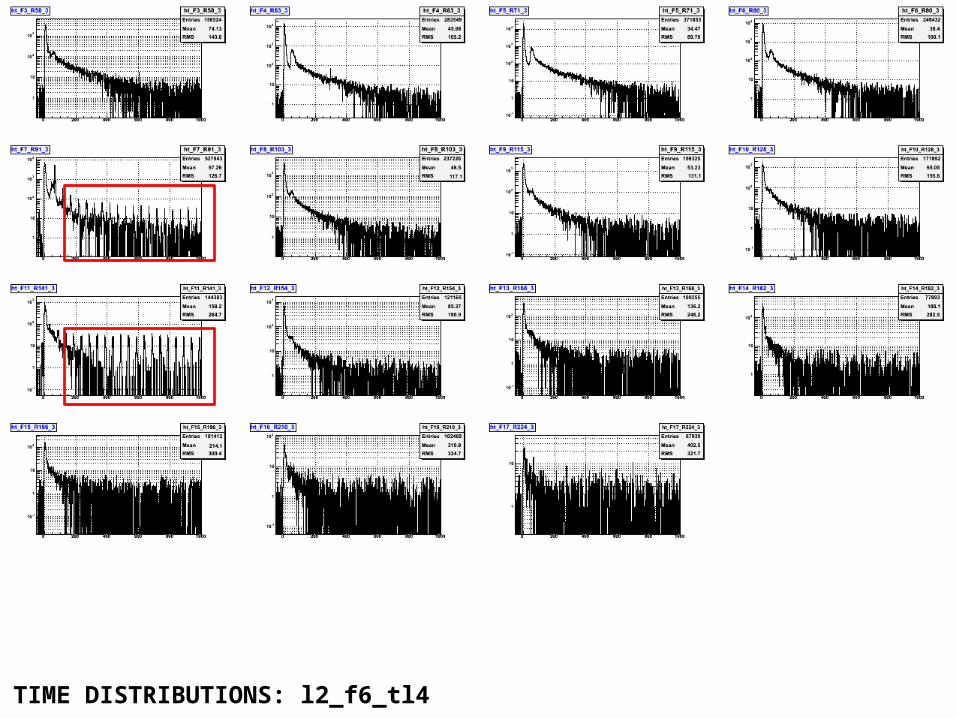
TIME DISTRIBUTIONS: l2_f6_tl4

SAME TARGET LINE FOR DIFFERENT FACES: L2 MULTI-FACES RUNS

•The amount of light collected in a same target line due to different LEDs in the OB can differs up to 50 %. This change in the amount of light has an impact on the value of L and its error, this in target line L1.
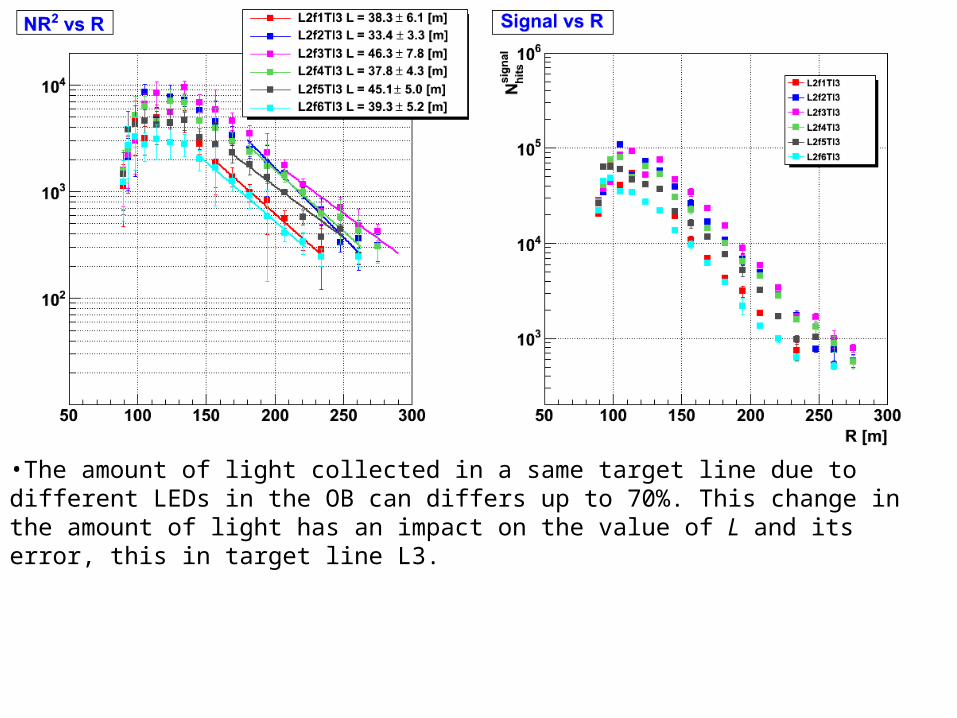
•The amount of light collected in a same target line due to different LEDs in the OB can differs up to 70%. This change in the amount of light has an impact on the value of L and its error, this in target line L3.
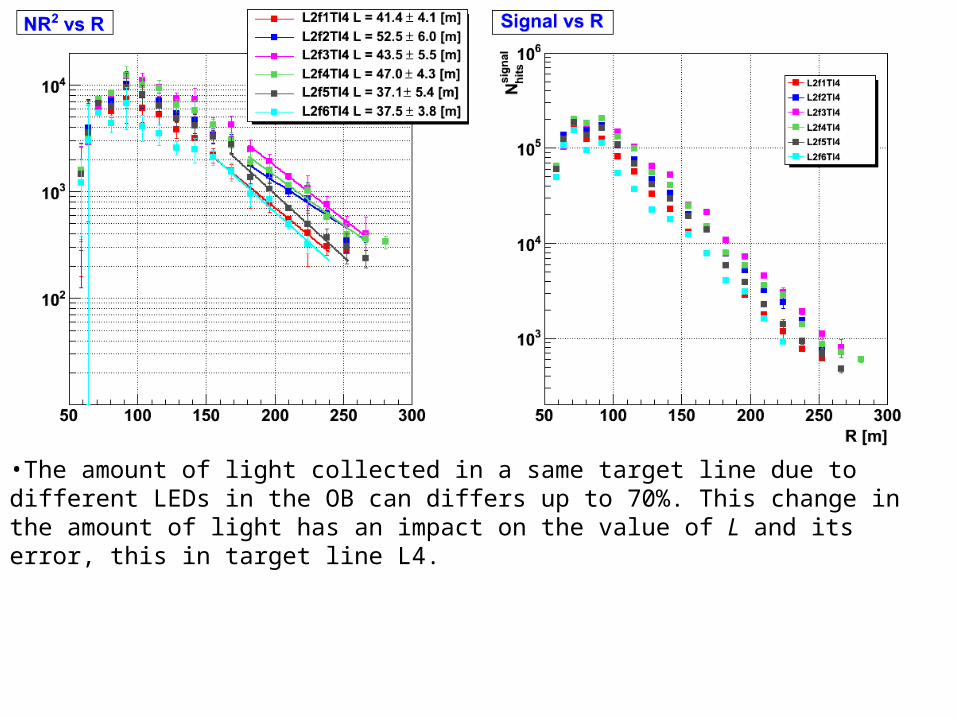
•The amount of light collected in a same target line due to different LEDs in the OB can differs up to 70%. This change in the amount of light has an impact on the value of L and its error, this in target line L4.
LARGE STATISTICS: L2 44552 RUN (1M events)
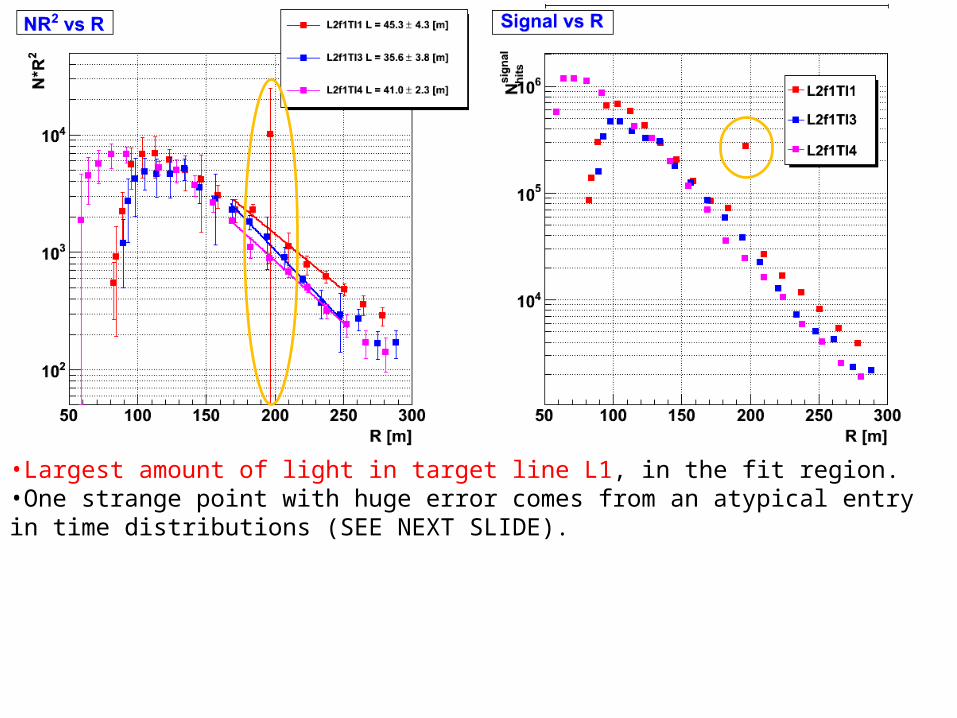
•Largest amount of light in target line L1, in the fit region.•One strange point with huge error comes from an atypical entry in time distributions (SEE NEXT SLIDE).
TIME DISTRIBUTIONS: l2_f1_tl1
TIME DISTRIBUTIONS: l2_f1_tl3
TIME DISTRIBUTIONS: l2_f1_tl4

CONCLUSIONS:
•All the target lines for all the flashing lines considered, show the same behaviour: for the different OB faces flashing to the same target line, the amount of light collected can differs up to 80 % and its impact on the transmission length is clear.
•For the other side, when we measure with only one face for different target lines, it reveals that the more stable value for the transmission length is reached for the line which collects more light than the other ones.
•Taking into account the below statements, i propose to measure the transmission length of line in the neighboring line which collects more light than the other ones, it will require to change the code substantially, then we can see how the distribution of transmission length is, for all the blue runs we have.
•Source of plots:
L2 multi-faces:http://ific.uv.es/~yepes/optical_properties/new_analisis/cal_141111/plotsHoy/l2_multi/•L2 large statistics:http://ific.uv.es/~yepes/optical_properties/new_analisis/cal_141111/plotsHoy/l2_largeStats/•L4 multi-faces:http://ific.uv.es/~yepes/optical_properties/new_analisis/cal_141111/plotsHoy/