Embed Size (px)
Citation preview
Feb.2008_jxh_Introduction 1.1ComputerArchitecture_Introduction11
Lecture for Storage System
Type of Storage Devices Buses—Connecting I/O Devices to CPU/Memory
Reliability,Availability,and DependabilityRAID: Redundant Arrays of Inexpensive Disks
Error and Failures in Real Systems
I/O Performance MeasuresA Little Queuing Theory

Feb.2008_jxh_Introduction 1.2ComputerArchitecture_Introduction2
7.1 Introduction
2
The prejudiceHistorically neglected by CPU enthusiasts
CPU time which by definition ignores I/OCitizenship of I/O is even apparent in the label peripheral applied to I/O devices.
The factA computer without I/O devices is like a car without wheels
You can’t get very far without them.response time
The time between when the user types a command and when results appear—is surely a better measure of performance.

Feb.2008_jxh_Introduction 1.3ComputerArchitecture_Introduction3
Does I/O Performance Matter?
3
One argument : I/O speed doesn’t matterIf a process waits for a peripheral, run another taskThroughput does not descendI/O performance doesn’t matter in a multiprogrammedenvironment.
Several points to make in replyif users didn’t care about response time
Interactive software never would have been inventedBe no workstations or personal computers today;
Expensive to rely on running other processesPaging traffic from process switching might actually increase I/O.Mobile devices and desktop computing, there is only one person per computer and thus fewer processes than in timesharing.
Many times the only waiting process is the human being!

Feb.2008_jxh_Introduction 1.4ComputerArchitecture_Introduction4
I/O’s Revenge is at handAmdahl's Law: system speed-up limited by the slowest part!10% IO & 10x CPU => (lose 50%)
10% IO & 100x CPU => (lose 90%)I/O bottleneck:
Diminishing fraction of time in CPUDiminishing value of faster CPUs
I/O performance increasingly limits system performance and effectiveness
CPU Performance: 55% per year and I/O did not improveEvery task would become I/O bound.There would be no reason to buy faster CPUs—and no jobs for CPU designers.
Speedup=1
0.1+0.09 =5
Speedup=1
0.1+0.009=10

Feb.2008_jxh_Introduction 1.5ComputerArchitecture_Introduction5
Does CPU Performance Matter?Why still important to keep CPUs busy vs. IO devices ("CPU time"), as CPUs not costly?
Moore's Law leads to both large, fast CPUs but also to very small, cheap CPUs2001 Hypothesis: 600 MHz PC is fast enough for Office Tools?PC slowdown since fast enough unless games, new apps?
People care more about storing information and communicating information than calculating
"Information Technology" vs. "Computer Science"1960s and 1980s: Computing Revolution1990s and 2000s: Information Age
This shift in focus from computation to communication and storage of information
emphasizes reliability, availability and scalability as well as cost-performance.

Feb.2008_jxh_Introduction 1.6ComputerArchitecture_Introduction6
Types of Storage Devices-1
Device Providing InformationSensor Key CRT
1~1000B/S 10B/S 2000B/S
Printer Communication Cable1800B/S 30~200000B/S
Multimedia Data Devicehigh speed graphics video display Audio frequency
1MB/S 100MB/S 64KB/S
Network CommunicationDIX ( Ethernet network standard Digital, Intel, Xerox)、TB2、
RJ45

Feb.2008_jxh_Introduction 1.7ComputerArchitecture_Introduction7
Types of Storage Devices-2
Device Behavior Partner Data Rate (KB/sec)
Keyboard Input Human 0.01Mouse Input Human 0.02Printer Output Human 3.00Floppy disk Storage Machine 50.00Laser Printer Output Human 100.00Optical Disk Storage Machine 500.00Magnetic Disk Storage Machine 5,000.00Network-LAN Input or Output Machine 20 --1,000.00Graphics Display Output Human 30,000.00
Feb.2008_jxh_Introduction 1.8ComputerArchitecture_Introduction8
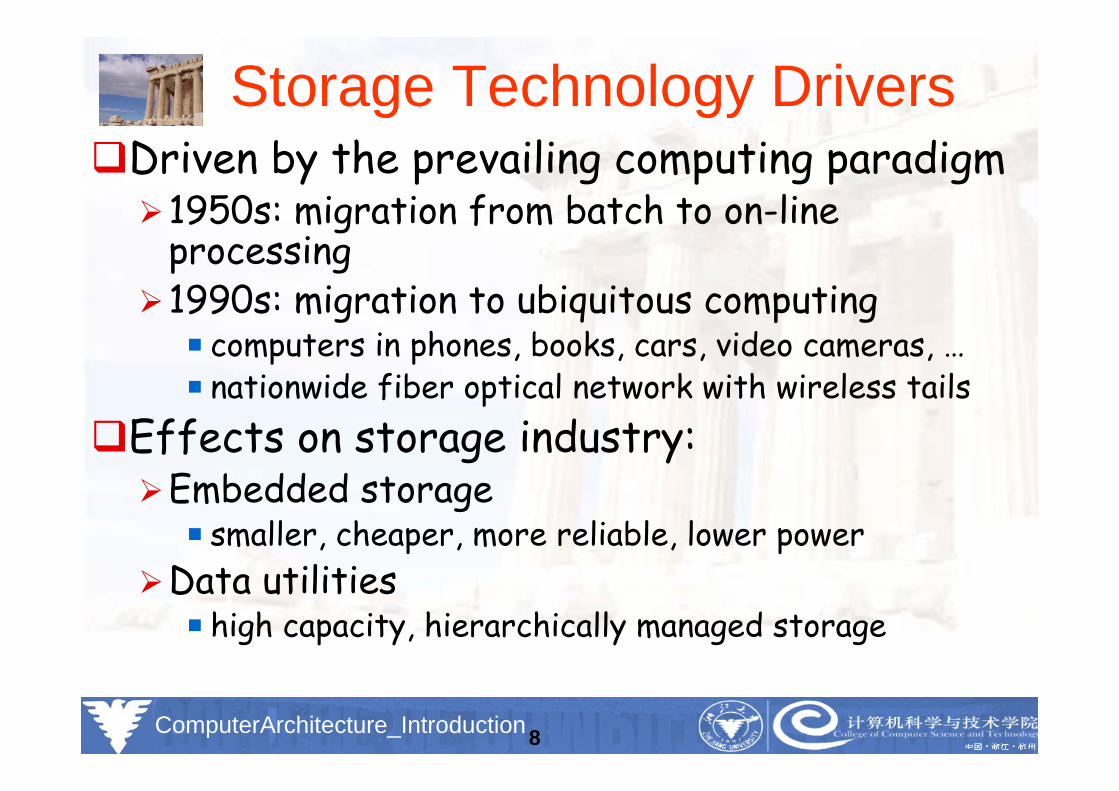
Storage Technology DriversDriven by the prevailing computing paradigm
1950s: migration from batch to on-line processing1990s: migration to ubiquitous computing
computers in phones, books, cars, video cameras, …nationwide fiber optical network with wireless tails
Effects on storage industry:Embedded storage
smaller, cheaper, more reliable, lower powerData utilities
high capacity, hierarchically managed storage

Feb.2008_jxh_Introduction 1.9ComputerArchitecture_Introduction9
I/O SystemsProcessor
Cache
Memory - I/O Bus
MainMemory
I/OController
Disk Disk
I/OController
I/OController
Graphics Network
interruptsinterrupts

Feb.2008_jxh_Introduction 1.10ComputerArchitecture_Introduction10
Disk Device Terminology
Several platters, with information recorded magnetically on both surfaces (usually)
Platter
OuterTrack
InnerTrackSector
Actuator
HeadArm

Feb.2008_jxh_Introduction 1.11ComputerArchitecture_Introduction11
Disk Device Terminology
Actuator moves head (end of arm,1/surface) over track (“seek”), select surface, wait for sector rotate under head, then read or write “Cylinder”: all tracks under heads
Bits recorded in tracks, which in turn divided into sectors (e.g., 512 Bytes)

Feb.2008_jxh_Introduction 1.12ComputerArchitecture_Introduction12
What’s Inside A Disk Drive?

Feb.2008_jxh_Introduction 1.13ComputerArchitecture_Introduction13
Disk Device Performance
Seek time: move head to the desired tracktoday’s drives - 5 to 15 msaverage seek = time for all possible seeks/no. of possible seeksactual average seek = 25% to 33% due to locality
Rotational latencytoday’s drives - 5,400 to 12,000 RPM ;approximately 12 ms to 5 msaverage rotational latency = (0.5)(rotational latency)
Transfer timetime to transfer a sector (1 KB/sector)function of rotation speed, recording densitytoday’s drives - 10 to 40 MBytes/second
Controller timeoverhead on drive electronics adds to manage drivebut also gives prefetching and caching
Disk Latency = Seek Time + Rotation Time + Transfer Time + Controller Overhead

Feb.2008_jxh_Introduction 1.14ComputerArchitecture_Introduction14
Disk Device Performance-2Average access time = (seek time) + (rotational latency) + (transfer) + (controller time)
Track and cylinder skewcylinder switch time
delay to change from one cylinder to the nextmay have to wait an extra rotation
solution - drives incorporate skewoffset sectors between cylinders to account for switch time
head switch timechange heads to go from one track to next on same cylinder
incur additional settling time
Prefetchingdisks usually read an entire track at a timeassumes that request for the next sector will come soon
Cachinglimited amount of caching across requests, but prefetching is preferred

Feb.2008_jxh_Introduction 1.15ComputerArchitecture_Introduction15
Disk Device Performance-3Average distance sector from head?1/2 time of a rotation
10000 Revolutions Per Minute 166.67 Rev/sec1 revolution = 1/ 166.67 sec 6.00 milliseconds1/2 rotation (revolution) 3.00 ms
Average no. tracks move arm?Sum all possible seek distances from all possible tracks / # possible
Assumes average seek distance is randomDisk industry standard benchmark

Feb.2008_jxh_Introduction 1.16ComputerArchitecture_Introduction16
Data Rate: Inner vs. Outer Tracks
To keep things simple, originally kept same number of sectors per track
Since outer track longer, lower bits per inchCompetition decided to keep BPI the same for all tracks (“constant bit density”)
More capacity per diskMore of sectors per track towards edgeSince disk spins at constant speed, outer tracks have faster data rate
Bandwidth outer track 1.7X inner track!Inner track highest density, outer track lowest, so not really constant2.1X length of track outer / inner, 1.7X bits outer / inner

Feb.2008_jxh_Introduction 1.17ComputerArchitecture_Introduction17
Devices: Magnetic DisksPurpose:
Long-term, nonvolatile storageLarge, inexpensive, slow level in the storage hierarchy
Characteristics:Seek Time (~8 ms avg)
positional latencyrotational latency
Transfer rate10-40 MByte/secBlocks
CapacityGigabytesQuadruples every 2 years (aerodynamics)
Response time= Queue + Controller + Seek + Rot + Xfer
Service time

Feb.2008_jxh_Introduction 1.18ComputerArchitecture_Introduction18
State of the Art: Barracuda 180
181.6 GB, 3.5 inch disk12 platters, 24 surfaces24,247 cylinders7,200 RPM; (4.2 ms avg. latency)7.4/8.2 ms avg. seek (r/w)64 to 35 MB/s (internal)0.1 ms controller time10.3 watts (idle)
source: www.seagate.com
Latency = Queuing Time + Controller time +Seek Time + Rotation Time + Size / Bandwidth
per access
per byte{+
Sector
Track
Cylinder
Head PlatterArmTrack Buffer

Feb.2008_jxh_Introduction 1.19ComputerArchitecture_Introduction19
Disk Performance ExampleDisk characteristics
512 byte sector, rotate at 5400 RPM, advertised seeks is 5 ms,transfer rate is 40 MB/sec, it rotates at 10,000RPM, controller overhead is 0.1 ms, queue idle so no service time.
Answer Access Time = Seek time + Rotational Latency + Transfer time + Controller Time + Queuing Delay
=5ms +0.5
10,000PRM+
0.5KB
40MB/sec+ 0.1ms
=5ms + 3.0 + 0.013 + 0.1 =8.11ms

Feb.2008_jxh_Introduction 1.20ComputerArchitecture_Introduction20
Disk Performance Example(cont.)
Assuming the measured seek time is 33% of the calculated average, the answer is
Access Time =33%×5ms + 3.0 ms+ 0.013ms + 0.1ms =4.783ms
Note that only 0.013 /4.783 or 0.3% of the time is the disk transferring data in this example. Even page-sized transfers often take less than 5%, so disks normally spend most of their time waiting for the head to get over the data rather than reading or writing the data.

Feb.2008_jxh_Introduction 1.21ComputerArchitecture_Introduction21
The Future of Magnetic DisksBits recorded along a track
Metric is Bits Per Inch (BPI)Number of tracks per surface
Metric is Tracks Per Inch (TPI)Disk Designs Brag about bit density per unit area
Metric is Bits Per Square InchCalled Areal DensityAreal Density = BPI x TPI

Feb.2008_jxh_Introduction 1.22ComputerArchitecture_Introduction22
Areal Density
Year Areal Density1973 1.71979 7.71989 631997 30902000 17100
1
10
100
1000
10000
100000
1970 1980 1990 2000Year
Are
al D
ensi
Areal Density = BPI x TPIChange slope 29%/yr to 60%/yr about 1996

Feb.2008_jxh_Introduction 1.23ComputerArchitecture_Introduction23
1 inch disk drive!2000 IBM MicroDrive:
1.7” x 1.4” x 0.2”1 GB, 3600 RPM, 5 MB/s, 15 ms seekDigital camera, PalmPC?
2006 MicroDrive?9 GB, 50 MB/s!
Assuming it finds a niche in a successful productAssuming past trends continue

Feb.2008_jxh_Introduction 1.24ComputerArchitecture_Introduction24
Optical Disks
One challengerHigh capacity、Low costRead-only→Write once→ReWritableCD-DA、CD-ROM、CD-I、CD-R、VCD、DVDPits(0.5μm)、lands、

Feb.2008_jxh_Introduction 1.25ComputerArchitecture_Introduction25
Magnetic Tapes vs. DiskLongitudinal tape uses same technology as hard disk; tracks its density improvementsDisk head flies above surface, tape head lies on surfaceDisk fixed, tape removableInherent cost-performance based on geometries:fixed rotating platters with gaps
(random access, limited area, 1 media / reader)
removable long strips wound on spool(sequential access, "unlimited" length, multiple / reader)
Helical Scan (VCR, Camcoder, DAT) Spins head at angle to tape to improve density

Feb.2008_jxh_Introduction 1.26ComputerArchitecture_Introduction26
Current Drawbacks to TapeTape wear out:
Helical 100s of passes to 1000s for longitudinal Head wear out:
2000 hours for helicalBoth must be accounted for in economic / reliability modelBits stretchReaders must be compatible with multiple generations of mediaLong rewind, eject, load, spin-up times; not inherent, just no need in marketplace Designed for archival

Feb.2008_jxh_Introduction 1.27ComputerArchitecture_Introduction27
Automated Tape LibrariesStorageTek Powderhorn9310
6000 x 50 GB 9830 tapes = 300 TBytes in 2000 (uncompressed)
Library of Congress: all information in the world; in 1992, ASCII of all books = 30 TBExchange up to 450 tapes per hour (8 secs/tape)
1.7 to 7.7 Mbyte/sec per reader, up to 10 readers
7.7 feet
10.7 feet8200 pounds,1.1 kilowatts

Feb.2008_jxh_Introduction 1.28ComputerArchitecture_Introduction28
Library vs. StorageGetting books today as quaint as the way I learned to program
punch cards, batch processingwander thru shelves, anticipatory purchasing
Cost $1 per book to check out$30 for a catalogue entry30% of all books never checked outWrite only journals?Digital library can transform campuses

Feb.2008_jxh_Introduction 1.29ComputerArchitecture_Introduction29
Whither tape?Investment in research:
90% of disks shipped in PCs; 100% of PCs have disks~0% of tape readers shipped in PCs; ~0% of PCs have disks
Before, N disks / tape; today, N tapes / disk40 GB/DLT tape (uncompressed)80 to 192 GB/3.5" disk (uncompressed)
Cost per GB:In past, 10X to 100X tape cartridge vs. diskJan 2001: 40 GB for $53 (DLT cartridge), $2800 for reader$1.33/GB cartridge, $2.03/GB 100 cartridges + 1 reader($10995 for 1 reader + 15 tape autoloader, $10.50/GB)Jan 2001: 80 GB for $244 (IDE,5400 RPM), $3.05/GBWill $/GB tape v. disk cross in 2001? 2002? 2003?
Storage field is based on tape backup; what should we do? Discussion if time permits?

Feb.2008_jxh_Introduction 1.30ComputerArchitecture_Introduction30
What about FLASHCompact Flash Cards
Intel Strata Flash16 Mb in 1 square cm. (.6 mm thick)
100,000 write/erase cycles.Standby current = 100uA, write = 45mACompact Flash 256MB~=$120 512MB~=$542Transfer @ 3.5MB/s
IBM Microdrive 1G~370Standby current = 20mA, write = 250mAEfficiency advertised in wats/MB
DisksNearly instant standby wake-up timeRandom access to data storedTolerant to shock and vibration (1000G of operating shock)

Feb.2008_jxh_Introduction 1.31ComputerArchitecture_Introduction31
7.3 Buses--Connecting I/O Devices to CPU/Memory
Lots of sub-systems need to communicate
Busses: Shared wires for common communication

Feb.2008_jxh_Introduction 1.32ComputerArchitecture_Introduction32
Bus Classifications
CPU-memory bussesFastProprietaryClosed and controlledSupport only memory transactions
IO bussesStandardized (SCSI, PCI, AGP)More diversityMore length
Bus Bridges/AdapterStandardized (RS-232, )Cross from one bus to another

Feb.2008_jxh_Introduction 1.33ComputerArchitecture_Introduction33
Bus Design Decisionsgoals
decisions depend on cost and performancehigher performance at more cost.
The first three options in the figure are clearseparate address and data lines,wider data lines, and multipleword transfers

Feb.2008_jxh_Introduction 1.34ComputerArchitecture_Introduction34
Structure, Width, and Transfer Length
Separate vs. Multiplexed Address/DataMultiplexed: save wiresSeparate: more performance
Wide words: higher throughput, less control per transferOn-chip cache to CPU busses: 256 bits wideSerial Busses
Data Transfer LengthMore data per address/control transfer
Example: Multiplexed Addr/Data with Data transfer of 4
Feb.2008_jxh_Introduction 1.35ComputerArchitecture_Introduction35
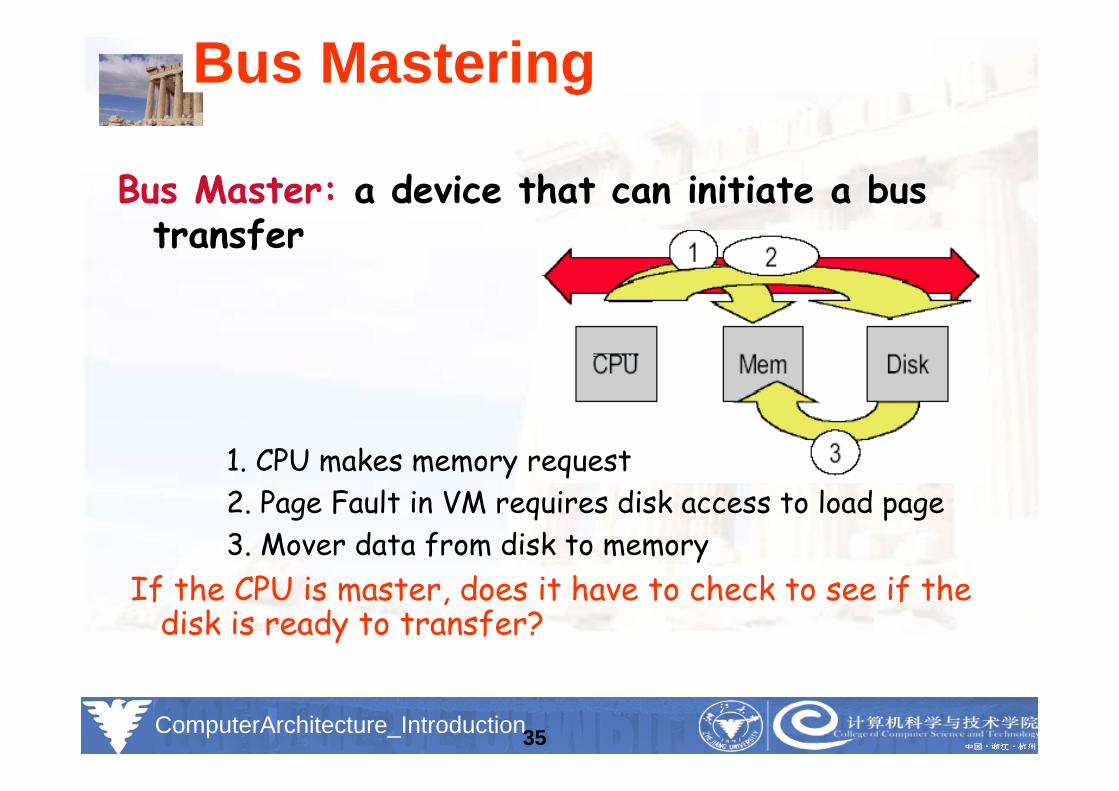
Bus Mastering
Bus Master: a device that can initiate a bus transfer
1. CPU makes memory request2. Page Fault in VM requires disk access to load page3. Mover data from disk to memory
If the CPU is master, does it have to check to see if the disk is ready to transfer?

Feb.2008_jxh_Introduction 1.36ComputerArchitecture_Introduction36
Multiple Bus Masters
What if multiple devices could initiate transfers?
Update might take place in background while CPU operates
Multiple CPUs on shared memory systemsChallenge: Arbitration
If two or more masters want the bus at the same time, who gets it?

Feb.2008_jxh_Introduction 1.37ComputerArchitecture_Introduction37
Bus Clocking: Synchronous
SynchronousSample the control signals at edge of clock
Pro: Fast and High PerformanceCon:
• Can’t be long (skew) or fast at same time• All bus members must run at the right speed

Feb.2008_jxh_Introduction 1.38ComputerArchitecture_Introduction38
Bus Clocking: Asynchronous
AsynchronousEdge of control signals determines communication“Handshake Protocol”
Pros:• No clock• Slow and fast components on the same bus
Con:• Inefficient: two round tripsLike somebody who always repeats what was said to them
1. Request (with actual transaction)2. Acknowledge causes de-assert of Request3. De-assert of Request causes de-assert of Ack4. De-assert of Ack allows re-assertion of Request

Feb.2008_jxh_Introduction 1.39ComputerArchitecture_Introduction39
Preferred bus type as a function of length/clock skew and variation in I/O device speed.Synchronous is best when the distance is short and the I/O devices on the bus all transfer at similar speeds.
Synchronous vsAsynchronous

Feb.2008_jxh_Introduction 1.40ComputerArchitecture_Introduction40
Split TransactionsProblem: Long wait times
Solution: Split Transaction Bus

Feb.2008_jxh_Introduction 1.41ComputerArchitecture_Introduction41
Bus StandardsI/O bus --- interface---devices
Standardslet the computer designer and I/O-device designer work independently play a large role in buses. Any I/O device can connect to any computer.
Document Defines how to connect devices to computers
De facto standardsMachines sometimes grow to be so popular that their I/O buses become de facto standardsPDP-11 Unibus、IBM PC-AT

Feb.2008_jxh_Introduction 1.42ComputerArchitecture_Introduction42
Examples of Buses
Buses in common useCommon desktop I/O buses, I/O buses found in embedded devices,CPU-memory interconnects found in servers
Summary of parallel I/O buses.
Summary of serial I/O buses ( Embedded computers)
Summary of CPU-memory interconnects found in 2000 servers.

Feb.2008_jxh_Introduction 1.43ComputerArchitecture_Introduction43
Summary of parallel I/O buses
IDE---Integrated Drive ElectronicsEarly disk standard that connects two disks to a PC.It has been extended by AT-bus Attachment (ATA), to be both wider and faster.
SCSI---Small Computer System Interconnectconnects up to 7 devices for 8-bit busses and up to 15 devices for 16-bit busses. They can even be different speeds, but they run at the rate of the slowest device.The peak bandwidth of a SCIS bus is the width (1 or 2 bytes) times the clock rate (10 to 160 MHz). Most SCSI buses today are 16-bits.
PCI---Peripheral Component InterconnectPCI-X ,PCI Extended
Connect main memory to peripheral devices

Feb.2008_jxh_Introduction 1.44ComputerArchitecture_Introduction44
Summary of parallel I/O buses

Feb.2008_jxh_Introduction 1.45ComputerArchitecture_Introduction45
Summary of serial I/O buses
Often used in embedded computers.I2C ----- invented by Phillips in the early 1980s.1-wire -- developed by Dallas Semiconductor.RS-232 -introduced in 1962. SPI ----- created by Motorola in the early 1980s.

Feb.2008_jxh_Introduction 1.46ComputerArchitecture_Introduction46
Summary of CPU-memory interconnects found in 2000 serversShared bus
crossbars switchesEach bus connects up to four processors and memory controllers, and then the crossbar connects the busses together. The number of slots in the crossbar is 16, 8, and 16, respectively.These servers use crossbars switches to connect nodes processors together instead of a shared bus interconnect.

Feb.2008_jxh_Introduction 1.47ComputerArchitecture_Introduction47
7.5 RAID: Redundant Arrays of Inexpensive Disks
A disk arrays replace larger disk

Feb.2008_jxh_Introduction 1.48ComputerArchitecture_Introduction48
David patterson, Garth Gibson, and Randy Katz, A Case for Redundant Arrays of Inexpensive Disks (RAID), ACM SIGMOD conference, 1988

Feb.2008_jxh_Introduction 1.49ComputerArchitecture_Introduction49
Use Arrays of Small Disks?
Low End High End
3.5”
Disk Array: 1 disk design
14”10”5.25”3.5”
Conventional: 4 disk designs
•Katz and Patterson asked in 1987: Can smaller disks be used to close gap in performance between disks and CPUs?

Feb.2008_jxh_Introduction 1.50ComputerArchitecture_Introduction50
Replace Small Number of Large Disks with Large Number of Small Disks! (1988 Disks)
Capacity Volume PowerData Rate I/O Rate MTTF Cost
IBM 3390K20 GBytes97 cu. ft.
3 KW15 MB/s
600 I/Os/s250 KHrs$250K
IBM 3.5" 0061320 MBytes0.1 cu. ft.
11 W1.5 MB/s55 I/Os/s50 KHrs
$2K
x7023 GBytes11 cu. ft.
1 KW120 MB/s
3900 IOs/s??? Hrs$150K
Disk Arrays have potential for large data and I/O rates, high MB per cu. ft., high MB per KW, but what about reliability?
9X3X
8X
6X

Feb.2008_jxh_Introduction 1.51ComputerArchitecture_Introduction51
Array Reliability
Reliability of N disks = Reliability of 1 Disk ÷ N
50,000 Hours ÷ 70 disks = 700 hours
Disk system MTTF: Drops from 6 years to 1 month!
• Arrays (without redundancy) too unreliable to be useful!
Hot spares support reconstruction in parallel with access: very high media availability can be achieved
Hot spares support reconstruction in parallel with access: very high media availability can be achieved

Feb.2008_jxh_Introduction 1.52ComputerArchitecture_Introduction52
Redundant Arrays of (Inexpensive) Disks
Files are "striped" across multiple disksRedundancy yields high data availability
Availability: service still provided to user, even if some components failed
Disks will still failContents reconstructed from data redundantly stored in the array Capacity penalty to store redundant info Bandwidth penalty to update redundant info

Feb.2008_jxh_Introduction 1.53ComputerArchitecture_Introduction53
RAID 0: No RedundancyData is striped across a disk array but there is no redundancy to tolerate disk failureIt also improves performance for large accesses, since many diskscan operate at once.RAID 0 something of a misnomer as there is no redundancy,

Feb.2008_jxh_Introduction 1.54ComputerArchitecture_Introduction54
RAID 1: Disk Mirroring/Shadowing
• Each disk is fully duplicated onto its “mirror”Very high availability can be achieved
• Bandwidth sacrifice on write:Logical write = two physical writes
• Reads may be optimized• Most expensive solution: 100% capacity overhead
• (RAID 2 not interesting, so skip)
recoverygroup

Feb.2008_jxh_Introduction 1.55ComputerArchitecture_Introduction55
RAID 3: Bit-Interleaved Parity Disk
100100111100110110010011
. . .logical record
P contains sum ofother disks per stripe mod 2 (“parity”)If disk fails, subtract P from sum of other disks to find missing information
Striped physicalrecords
P
10100011
11001101
10100011
11001101

Feb.2008_jxh_Introduction 1.56ComputerArchitecture_Introduction56
RAID 3Sum computed across recovery group to protect against hard disk failures, stored in P diskLogically, a single high capacity, high transfer rate disk: good for large transfersWider arrays reduce capacity costs, but decreases availability33% capacity cost for parity in this configuration

Feb.2008_jxh_Introduction 1.57ComputerArchitecture_Introduction57
Inspiration for RAID 4
RAID 3 relies on parity disk to discover errors on ReadBut every sector has an error detection fieldRely on error detection field to catch errors on read, not on the parity diskAllows independent reads to different disks simultaneously

Feb.2008_jxh_Introduction 1.58ComputerArchitecture_Introduction58
RAID 4: High I/O Rate Parity
D0 D1 D2 D3 P
D4 D5 D6 PD7
D8 D9 PD10 D11
D12 PD13 D14 D15
PD16 D17 D18 D19
D20 D21 D22 D23 P...
.
.
.
.
.
.
.
.
.
.
.
.Disk Columns
IncreasingLogicalDisk
Address
Stripe
Insides of 5 disksInsides of 5 disks
Example:small read D0 & D5, large write D12-D15
Example:small read D0 & D5, large write D12-D15

Feb.2008_jxh_Introduction 1.59ComputerArchitecture_Introduction59
Inspiration for RAID 5RAID 4 works well for small readsSmall writes (write to one disk):
Option 1: read other data disks, create new sum and write to Parity DiskOption 2: since P has old sum, compare old data to new data, add the difference to P
Small writes are limited by Parity Disk: Write to D0, D5 both also write to P disk
D0 D1 D2 D3 P
D4 D5 D6 PD7

Feb.2008_jxh_Introduction 1.60ComputerArchitecture_Introduction60
RAID 5: High I/O Rate Interleaved Parity
Independent writespossible because ofinterleaved parity
Independent writespossible because ofinterleaved parity
D0 D1 D2 D3 P
D4 D5 D6 P D7
D8 D9 P D10 D11
D12 P D13 D14 D15
P D16 D17 D18 D19
D20 D21 D22 D23 P...
.
.
.
.
.
.
.
.
.
.
.
.Disk Columns
IncreasingLogicalDisk
Addresses
Example: write to D0, D5 uses disks 0, 1, 3, 4

Feb.2008_jxh_Introduction 1.61ComputerArchitecture_Introduction61
Problems of Disk Arrays: Small Writes
D0 D1 D2 D3 PD0'
+
+
D0' D1 D2 D3 P'
newdata
olddata
old parity
XOR
XOR
(1. Read) (2. Read)
(3. Write) (4. Write)
RAID-5: Small Write Algorithm1 Logical Write = 2 Physical Reads + 2 Physical Writes

Feb.2008_jxh_Introduction 1.62ComputerArchitecture_Introduction62
System Availability: Orthogonal RAIDs
Data Recovery Group: unit of data redundancyRedundant Support Components: fans, power supplies, controller, cables
ArrayController
StringController
StringController
StringController
StringController
StringController
StringController
. . .
. . .
. . .
. . .
. . .
. . .
End to End Data Integrity: internal parity protected data paths

Feb.2008_jxh_Introduction 1.63ComputerArchitecture_Introduction63
System-Level Availability
Fully dual redundantI/O Controller I/O Controller
Array Controller Array Controller
. . .
. . .
. . .
. . . . . .
.
.
.RecoveryGroup
Goal: No SinglePoints ofFailure
Goal: No SinglePoints ofFailure
host host
with duplicated paths, higher performance can beobtained when there are no failures

Feb.2008_jxh_Introduction 1.64ComputerArchitecture_Introduction64
Summary: RAID Techniques: Goal was performance, popularity due to reliability of storage• Disk Mirroring, Shadowing (RAID 1)
Each disk is fully duplicated onto its "shadow"
Logical write = two physical writes
100% capacity overhead
• Parity Data Bandwidth Array (RAID 3)
Parity computed horizontally
Logically a single high data bw disk
• High I/O Rate Parity Array (RAID 5)Interleaved parity blocks
Independent reads and writes
Logical write = 2 reads + 2 writes
10010011
11001101
10010011
00110010
10010011
10010011

Feb.2008_jxh_Introduction 1.65ComputerArchitecture_Introduction65
7.7 I/O Performance Measures
I/O System performance depends on many aspects of the system (‘limited by weakest link in the chain’)
The CPUThe memory system:
Internal and external cachesMain Memory
The underlying interconnection (buses)The I/O controllerThe I/O deviceThe speed of the I/O software (Operating System)The efficiency of the software¡¯s use of the I/O devices
Two common performance metrics:Throughput: I/O bandwidthResponse time: Latency

Feb.2008_jxh_Introduction 1.66ComputerArchitecture_Introduction66
Simple Producer-Server Model
ThroughputThe number of tasks completed by the server in unit timeIn order to get the highest possible throughput:
The server should never be idleThe queue should never be empty
Response timeBegins when a task is placed in the queueEnds when it is completed by the serverIn order to minimize the response time:
The queue should be emptyThe server will be idle

Feb.2008_jxh_Introduction 1.67ComputerArchitecture_Introduction67
Throughput versus Respond Time

Feb.2008_jxh_Introduction 1.68ComputerArchitecture_Introduction68
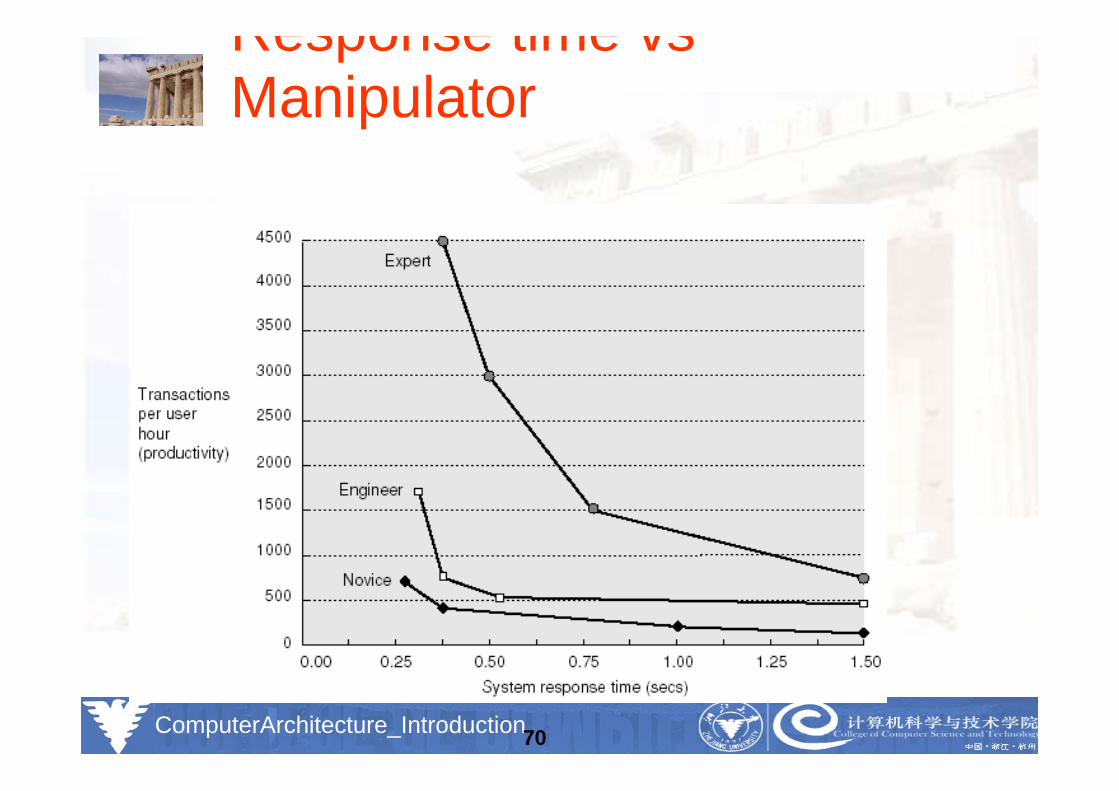
Response time relate to InteractionAn interaction, or transaction, with a computer is
divided into three parts:1. Entry time---The time for the user to enter the
command.The graphics system required 0.25 seconds on average to enter a command versus 4.0 seconds for the keyboard system.
2. System response time---The time between when the user enters the command and the complete response is displayed.
3. Think time---The time from the reception of the response until the user begins to enter the next command.

Feb.2008_jxh_Introduction 1.69ComputerArchitecture_Introduction69
Response time relate to Interaction
Feb.2008_jxh_Introduction 1.70ComputerArchitecture_Introduction70
Response time vsManipulator

Feb.2008_jxh_Introduction 1.71ComputerArchitecture_Introduction71
7.8 A Little Queuing Theory
Assumption: steady state characteristics, FIFOLittle’s Law:
LengthSystem = Arrival rate x TimeSystem
(LengthQueue + LengthServer) = l x (TimeQueue + TimeServer)

Feb.2008_jxh_Introduction 1.72ComputerArchitecture_Introduction72
How busy a system is !Server Utilization (U)
U = l x TimeServer(Arrival Rate < Service Rate)
Example:Single disk (server) gets 10 requests per secondAvg time to service a request: 50 ms
What is the utilization?Arrival rate: 10 IOPSService rate: 1/50ms = 20 IOPSHow many requests at the disk on average?
LengthServer = Arrival rate x TimeServer = 10 IOPS x 0.05s= 0.5 in disk at any one time
Server Utilization = -------------------Arrival rateService rate
Server Utilization = ------- =50%1020

Feb.2008_jxh_Introduction 1.73ComputerArchitecture_Introduction73
For I/O systems(making some assumptions + doing a little algebra)
Tqueue = Tserver x U / (1-U)Lqueue= U2 / (1-U)
Feb.2008_jxh_Introduction 1.74ComputerArchitecture_Introduction74
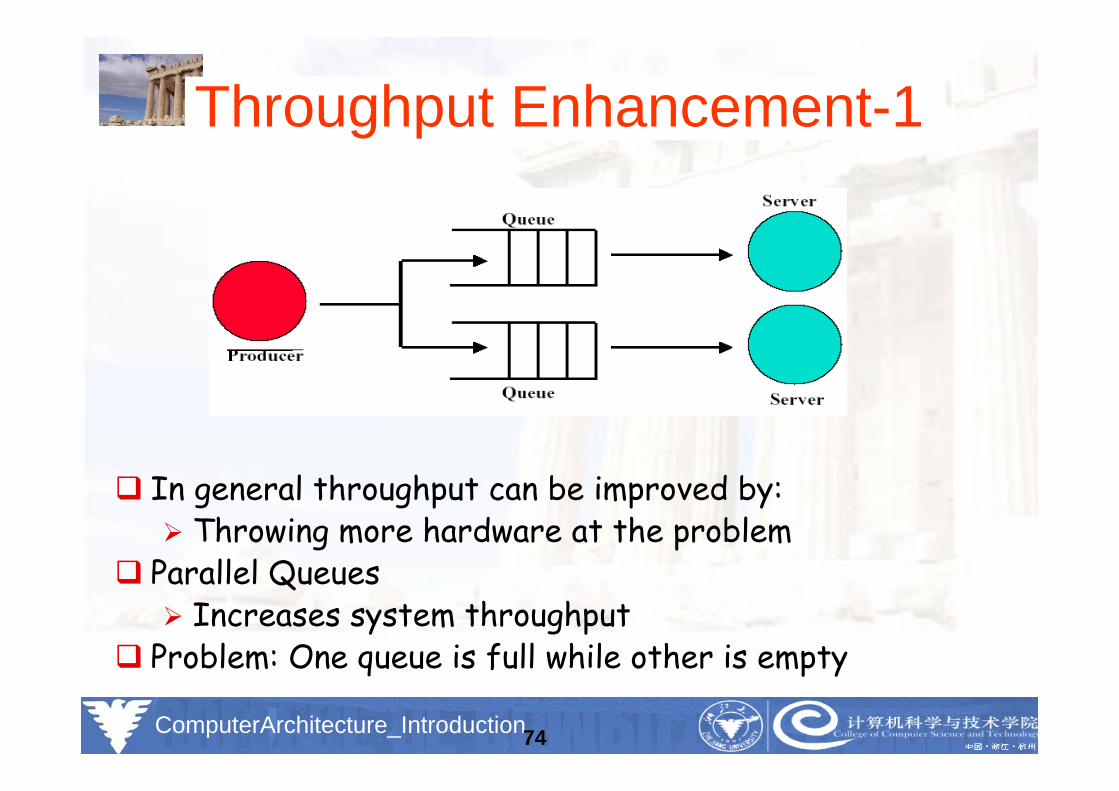
Throughput Enhancement-1
In general throughput can be improved by:Throwing more hardware at the problem
Parallel QueuesIncreases system throughput
Problem: One queue is full while other is empty
Feb.2008_jxh_Introduction 1.75ComputerArchitecture_Introduction75
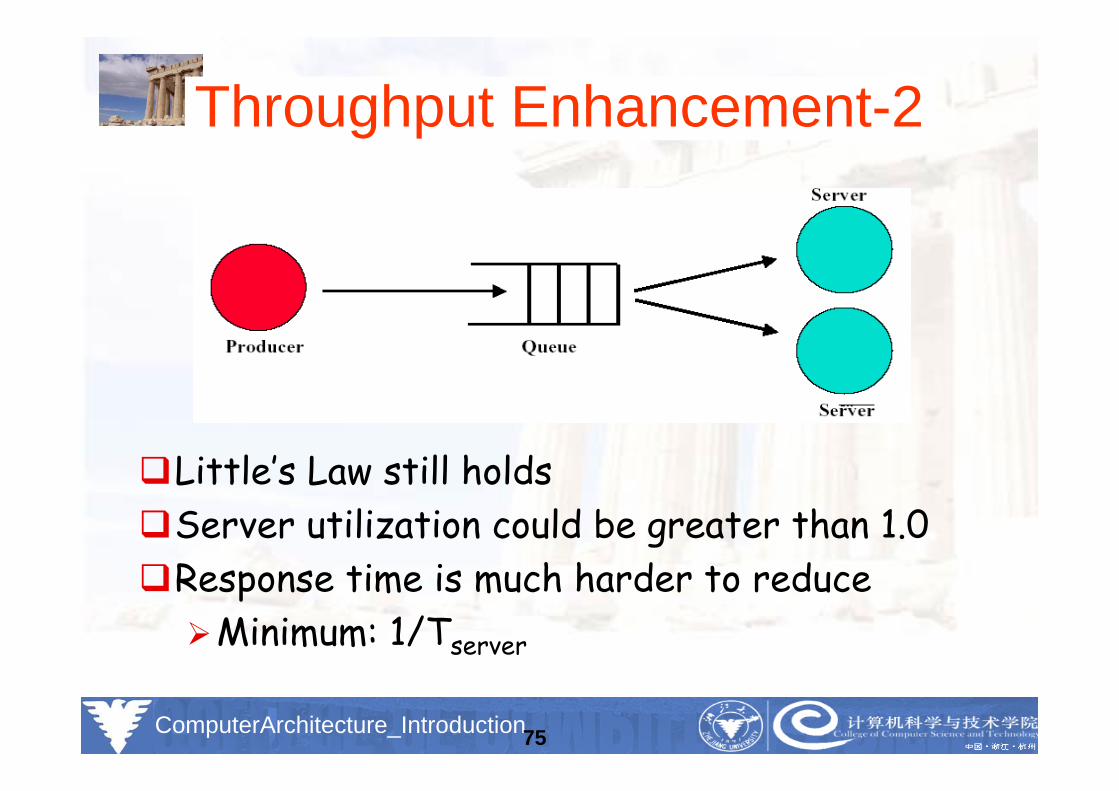
Throughput Enhancement-2
Little’s Law still holdsServer utilization could be greater than 1.0Response time is much harder to reduce
Minimum: 1/Tserver