Embed Size (px)
Citation preview

Lecture 5Regression
Homework Issueshellippast
1 Bad Objective Conduct an experiment because I have to for this class
2 Commas ndash ugh 3 Do not write out symbols (lsquopirsquo) use the
symbol (lsquoprsquo)4 Summarize results (donrsquot give me everything
and then some)5 Report mean plusmn std dev
Homework Issueshellippast
1 A confidence interval should be reported as an interval eg 12 ndash 15
2 Define abbreviations when first used eg CI3 However there were too many conjunctive
adverbs at the start of sentences4 Equation formatting
Homework Issueshellippresent
1 Do not show 27 digits of accuracy2 UNITS UNITS INCLUDE UNITS3 Every table and figure should have a caption
and be referred to in the text4 A section (eg results) should be more than
just a table and a figure
On to the lecturehellip
In Excelhellipbull three ways to perform a linear regression1 Built-in functions SLOPE() and INTERCEPT() --
no details2 Adding a trendline to a chart and showing the
regression equation on the chart (simplest)3 Regression analysis using the Data Analysis
Toolkit (best option ndash more information)
Option 3 in Excel
Excel Results
bull Recall that we forced the intercept = 0
Interpretation of resultshellipbull Excel reports the Standard Error not the standard
deviation They are not equal See next slidebull The P-value is the probability that the observed result
could be explained by random chance The tiny P-value for the slope (191 x 10-25) indicates that there is a miniscule probability that the observed result can be explained by random chance That is you REALLY NEED the slope term to explain the data
Interpretation of resultshellipbull The 95 confidence interval for the true value of
the slope (true value of π in this example) is presented in the output table In this example with 95 confidence the true value of π is somewhere between 3138 and 3307
bull The 90 confidence interval is 315233 to 3292408 which does not contain the true value Measurement bias ndash not small random additive error
Calculating std dev
bull Slope se =00405bull Slope sd = 00405 sqrt(20) = 0181bull Our experimental results arendash ldquoThe experimental value of π was found to be 322
plusmn 0181rdquondash ldquoThe 95 confidence interval for true value of π
ranges from 3138 to 3307rdquo
Nsesd
Multivariable Regressionbull Fit this data to an equation
of the form2
210 xbxbby p
Plot
0 2 4 6 8 10 120
50
100
150
200
250
300
350
400
450
Multivariable Regressionbull y is the response
variablebull Order of the other
columns does not matter
In Excelhellip
Resultshellip (bug)
Interpretationhellipbull The coefficients plusmn s arebull b0 = 553 plusmn 2045
bull b1 = 212 plusmn 854
bull b2 = 398 plusmn 078bull Standard deviations are significantly larger than the
mean values for b0 and b1 bull p-values for these coefficients are 042 and 045bull These p-values are well over 005 so these terms are
statistically insignificant (at 5) We can regress this data nearly as well with 2
2xby p
p-valuebull Recall The lower the p-value the less likely the
result assuming the null hypothesis so the more significant the result in the sense of statistical significance
bull The null hypothesis here is simplistically that the coefficient is zero
t-Test on a Regression Slope
bull Comparison of b1 from regression with another value b
bull The t-test is a hypothesis test Here are the hypotheses for this t-testndash H0 (null hypothesis) ndash The slope b1 is equal to
the known value βndash H1 (test hypothesis) ndash The slope b1 is not
equal to the known value β
xbby p 10
t-Statistic
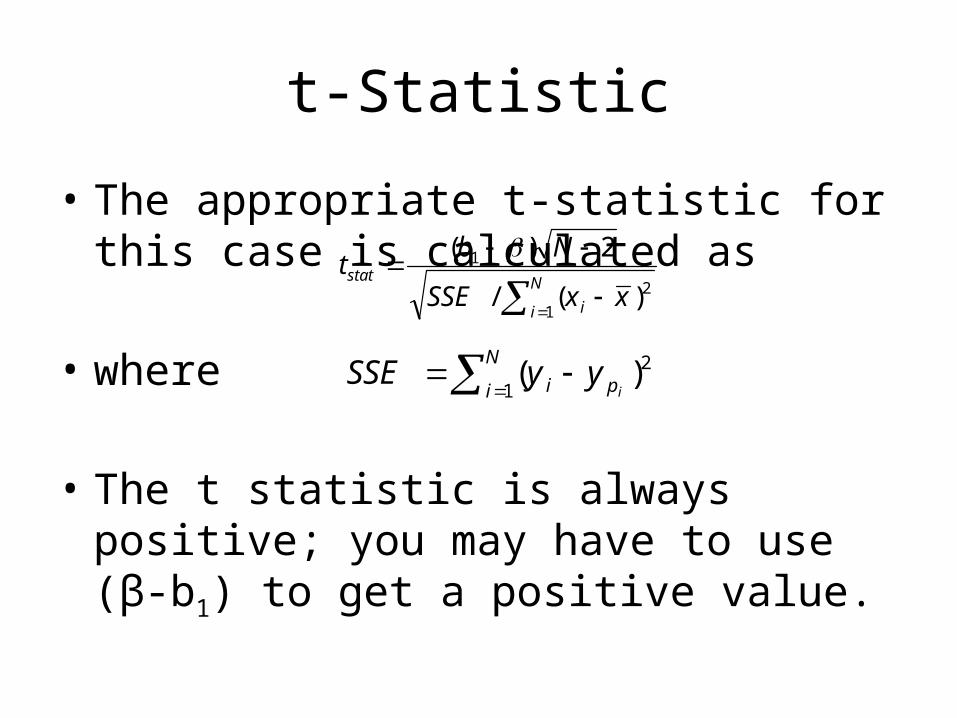
bull The appropriate t-statistic for this case is calculated as
bull where
bull The t statistic is always positive you may have to use (β-b1) to get a positive value
N
i i
stat
xxSSE
Nbt
1
2
1
)(
2)(
N
i pi iyySSE
1
2)(
Critical t Value
bull If tstat gt tcrit ndash Reject the null hypothesis that the slope b1 is equal to the known value β
bull If tstat le tcrit ndash Fail to reject the null hypothesis
bull Get tcrit from a t-Table or Excel (see example)bull degrees of freedom DOF = N-2
Example
bull We are comparing b1 = 322 (first example in lecture) to b = pbull Get SSE = 85954 from regression outputbull Calculate tstat = 0952bull Choose α = 005bull DOF = 20 ndash 2 = 18bull In Excel calculate TINV(αDOF) which returns the value
tcrit=2101 when α = 005 and DOF = 18
bull Since tstat le tcrit (0952 lt 2101) we fail to reject the null hypothesis
bull Conclusion We cannot say with 95 confidence that b1 is not equal to b
Example
bull Choose α = 040bull DOF = 20 ndash 2 = 18bull In Excel calculate TINV(αDOF) which returns the value
tcrit=086 when α = 040 and DOF = 18
bull Since tcirt le tstat we reject the null hypothesis
bull Conclusion We can say with 60 confidence that b1 is not equal to b
bull Hmmmhellipthatrsquos a coin flip

Homework Issueshellippast
1 Bad Objective Conduct an experiment because I have to for this class
2 Commas ndash ugh 3 Do not write out symbols (lsquopirsquo) use the
symbol (lsquoprsquo)4 Summarize results (donrsquot give me everything
and then some)5 Report mean plusmn std dev
Homework Issueshellippast
1 A confidence interval should be reported as an interval eg 12 ndash 15
2 Define abbreviations when first used eg CI3 However there were too many conjunctive
adverbs at the start of sentences4 Equation formatting
Homework Issueshellippresent
1 Do not show 27 digits of accuracy2 UNITS UNITS INCLUDE UNITS3 Every table and figure should have a caption
and be referred to in the text4 A section (eg results) should be more than
just a table and a figure
On to the lecturehellip
In Excelhellipbull three ways to perform a linear regression1 Built-in functions SLOPE() and INTERCEPT() --
no details2 Adding a trendline to a chart and showing the
regression equation on the chart (simplest)3 Regression analysis using the Data Analysis
Toolkit (best option ndash more information)
Option 3 in Excel
Excel Results
bull Recall that we forced the intercept = 0
Interpretation of resultshellipbull Excel reports the Standard Error not the standard
deviation They are not equal See next slidebull The P-value is the probability that the observed result
could be explained by random chance The tiny P-value for the slope (191 x 10-25) indicates that there is a miniscule probability that the observed result can be explained by random chance That is you REALLY NEED the slope term to explain the data
Interpretation of resultshellipbull The 95 confidence interval for the true value of
the slope (true value of π in this example) is presented in the output table In this example with 95 confidence the true value of π is somewhere between 3138 and 3307
bull The 90 confidence interval is 315233 to 3292408 which does not contain the true value Measurement bias ndash not small random additive error
Calculating std dev
bull Slope se =00405bull Slope sd = 00405 sqrt(20) = 0181bull Our experimental results arendash ldquoThe experimental value of π was found to be 322
plusmn 0181rdquondash ldquoThe 95 confidence interval for true value of π
ranges from 3138 to 3307rdquo
Nsesd
Multivariable Regressionbull Fit this data to an equation
of the form2
210 xbxbby p
Plot
0 2 4 6 8 10 120
50
100
150
200
250
300
350
400
450
Multivariable Regressionbull y is the response
variablebull Order of the other
columns does not matter
In Excelhellip
Resultshellip (bug)
Interpretationhellipbull The coefficients plusmn s arebull b0 = 553 plusmn 2045
bull b1 = 212 plusmn 854
bull b2 = 398 plusmn 078bull Standard deviations are significantly larger than the
mean values for b0 and b1 bull p-values for these coefficients are 042 and 045bull These p-values are well over 005 so these terms are
statistically insignificant (at 5) We can regress this data nearly as well with 2
2xby p
p-valuebull Recall The lower the p-value the less likely the
result assuming the null hypothesis so the more significant the result in the sense of statistical significance
bull The null hypothesis here is simplistically that the coefficient is zero
t-Test on a Regression Slope
bull Comparison of b1 from regression with another value b
bull The t-test is a hypothesis test Here are the hypotheses for this t-testndash H0 (null hypothesis) ndash The slope b1 is equal to
the known value βndash H1 (test hypothesis) ndash The slope b1 is not
equal to the known value β
xbby p 10
t-Statistic
bull The appropriate t-statistic for this case is calculated as
bull where
bull The t statistic is always positive you may have to use (β-b1) to get a positive value
N
i i
stat
xxSSE
Nbt
1
2
1
)(
2)(
N
i pi iyySSE
1
2)(
Critical t Value
bull If tstat gt tcrit ndash Reject the null hypothesis that the slope b1 is equal to the known value β
bull If tstat le tcrit ndash Fail to reject the null hypothesis
bull Get tcrit from a t-Table or Excel (see example)bull degrees of freedom DOF = N-2
Example
bull We are comparing b1 = 322 (first example in lecture) to b = pbull Get SSE = 85954 from regression outputbull Calculate tstat = 0952bull Choose α = 005bull DOF = 20 ndash 2 = 18bull In Excel calculate TINV(αDOF) which returns the value
tcrit=2101 when α = 005 and DOF = 18
bull Since tstat le tcrit (0952 lt 2101) we fail to reject the null hypothesis
bull Conclusion We cannot say with 95 confidence that b1 is not equal to b
Example
bull Choose α = 040bull DOF = 20 ndash 2 = 18bull In Excel calculate TINV(αDOF) which returns the value
tcrit=086 when α = 040 and DOF = 18
bull Since tcirt le tstat we reject the null hypothesis
bull Conclusion We can say with 60 confidence that b1 is not equal to b
bull Hmmmhellipthatrsquos a coin flip

Homework Issueshellippast
1 A confidence interval should be reported as an interval eg 12 ndash 15
2 Define abbreviations when first used eg CI3 However there were too many conjunctive
adverbs at the start of sentences4 Equation formatting
Homework Issueshellippresent
1 Do not show 27 digits of accuracy2 UNITS UNITS INCLUDE UNITS3 Every table and figure should have a caption
and be referred to in the text4 A section (eg results) should be more than
just a table and a figure
On to the lecturehellip
In Excelhellipbull three ways to perform a linear regression1 Built-in functions SLOPE() and INTERCEPT() --
no details2 Adding a trendline to a chart and showing the
regression equation on the chart (simplest)3 Regression analysis using the Data Analysis
Toolkit (best option ndash more information)
Option 3 in Excel
Excel Results
bull Recall that we forced the intercept = 0
Interpretation of resultshellipbull Excel reports the Standard Error not the standard
deviation They are not equal See next slidebull The P-value is the probability that the observed result
could be explained by random chance The tiny P-value for the slope (191 x 10-25) indicates that there is a miniscule probability that the observed result can be explained by random chance That is you REALLY NEED the slope term to explain the data
Interpretation of resultshellipbull The 95 confidence interval for the true value of
the slope (true value of π in this example) is presented in the output table In this example with 95 confidence the true value of π is somewhere between 3138 and 3307
bull The 90 confidence interval is 315233 to 3292408 which does not contain the true value Measurement bias ndash not small random additive error
Calculating std dev
bull Slope se =00405bull Slope sd = 00405 sqrt(20) = 0181bull Our experimental results arendash ldquoThe experimental value of π was found to be 322
plusmn 0181rdquondash ldquoThe 95 confidence interval for true value of π
ranges from 3138 to 3307rdquo
Nsesd
Multivariable Regressionbull Fit this data to an equation
of the form2
210 xbxbby p
Plot
0 2 4 6 8 10 120
50
100
150
200
250
300
350
400
450
Multivariable Regressionbull y is the response
variablebull Order of the other
columns does not matter
In Excelhellip
Resultshellip (bug)
Interpretationhellipbull The coefficients plusmn s arebull b0 = 553 plusmn 2045
bull b1 = 212 plusmn 854
bull b2 = 398 plusmn 078bull Standard deviations are significantly larger than the
mean values for b0 and b1 bull p-values for these coefficients are 042 and 045bull These p-values are well over 005 so these terms are
statistically insignificant (at 5) We can regress this data nearly as well with 2
2xby p
p-valuebull Recall The lower the p-value the less likely the
result assuming the null hypothesis so the more significant the result in the sense of statistical significance
bull The null hypothesis here is simplistically that the coefficient is zero
t-Test on a Regression Slope
bull Comparison of b1 from regression with another value b
bull The t-test is a hypothesis test Here are the hypotheses for this t-testndash H0 (null hypothesis) ndash The slope b1 is equal to
the known value βndash H1 (test hypothesis) ndash The slope b1 is not
equal to the known value β
xbby p 10
t-Statistic
bull The appropriate t-statistic for this case is calculated as
bull where
bull The t statistic is always positive you may have to use (β-b1) to get a positive value
N
i i
stat
xxSSE
Nbt
1
2
1
)(
2)(
N
i pi iyySSE
1
2)(
Critical t Value
bull If tstat gt tcrit ndash Reject the null hypothesis that the slope b1 is equal to the known value β
bull If tstat le tcrit ndash Fail to reject the null hypothesis
bull Get tcrit from a t-Table or Excel (see example)bull degrees of freedom DOF = N-2
Example
bull We are comparing b1 = 322 (first example in lecture) to b = pbull Get SSE = 85954 from regression outputbull Calculate tstat = 0952bull Choose α = 005bull DOF = 20 ndash 2 = 18bull In Excel calculate TINV(αDOF) which returns the value
tcrit=2101 when α = 005 and DOF = 18
bull Since tstat le tcrit (0952 lt 2101) we fail to reject the null hypothesis
bull Conclusion We cannot say with 95 confidence that b1 is not equal to b
Example
bull Choose α = 040bull DOF = 20 ndash 2 = 18bull In Excel calculate TINV(αDOF) which returns the value
tcrit=086 when α = 040 and DOF = 18
bull Since tcirt le tstat we reject the null hypothesis
bull Conclusion We can say with 60 confidence that b1 is not equal to b
bull Hmmmhellipthatrsquos a coin flip

Example
bull Choose α = 040bull DOF = 20 ndash 2 = 18bull In Excel calculate TINV(αDOF) which returns the value
tcrit=086 when α = 040 and DOF = 18
bull Since tcirt le tstat we reject the null hypothesis
bull Conclusion We can say with 60 confidence that b1 is not equal to b
bull Hmmmhellipthatrsquos a coin flip