Embed Size (px)
Citation preview

Lecture 5 Raster Data AnalysisLecture 5 Raster Data Analysis

23/4/2023/4/20 22
Introduction
Analysis with raster data is simple Analysis with raster data is simple and efficient for it’s feature based and efficient for it’s feature based on positionon position
Analysis with raster data can be Analysis with raster data can be in a single, group, cellin a single, group, cell
The algorithm in raster data The algorithm in raster data analysis is different from that in analysis is different from that in vector datavector data

23/4/2023/4/20 33
Environment
Range Range specific grid give specific grid give region by max and min coordinateregion by max and min coordinate cell combined cell combined
merge merge intersectionintersection
mask gridmask grid Input gridInput grid
More than or equal to the input grid sizeMore than or equal to the input grid size

23/4/2023/4/20 44
Local function
Single cellSingle cell Not related to neighbor cellNot related to neighbor cell No effected by neighbor cellNo effected by neighbor cell New gridNew grid

23/4/2023/4/20 55
Mask grid
A region that exclude no data cell A region that exclude no data cell Data query and reclassificationData query and reclassification No data is not zero volume in cell, No data is not zero volume in cell,
zero is efficient data, the region zero is efficient data, the region which is no data is lack of datawhich is no data is lack of data

23/4/2023/4/20 66
Local function (Cont.)
Arithmetic operationTrigonometric function
logarithmpower
U= f (A, B,…)
A
A
B
C
U
U

23/4/2023/4/20 77
Local function (Cont.)
Numerical dataNumerical data max, minmax, min mean, summean, sum standards derritations valuefieldstandards derritations valuefield
measuremeasure majoritymajority minorityminority variety variety

23/4/2023/4/20 88
Local function (Cont.): Combination
3 2 1
2 1 2
1 2 3
3 2 4
3 2 4
2 4 1
1 3 6
2 4 5
4 5 7
1: 0-20%
2: 20%-40%
3: >40%
North: 1
East : 2
South : 3
West : 4
Combine code
Slope and aspect
1 3 , 3
2 2 , 3
3 2 , 2
4 1 , 2
5 2 , 4
6 1 , 4
7 3 , 1

23/4/2023/4/20 99
Local function in ArcView
Cell statistics
Map calculator
23/4/2023/4/20 1010
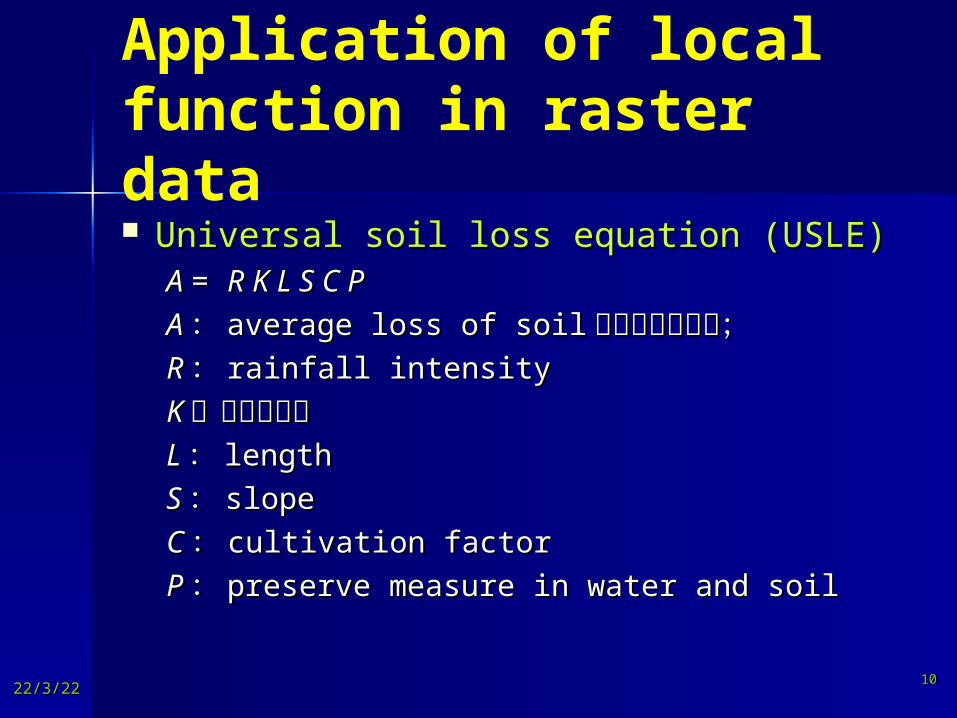
Application of local function in raster data Universal soil loss equation (USLE)Universal soil loss equation (USLE)
A A = = R K L S C PR K L S C P
AA :: average loss of soilaverage loss of soil 平均土壤流失量;平均土壤流失量;RR :: rainfall intensityrainfall intensity
KK:土壤可蚀性:土壤可蚀性LL :: lengthlength
SS :: slopeslope
CC :: cultivation factorcultivation factor
PP :: preserve measure in water and soilpreserve measure in water and soil

23/4/2023/4/20 1111
Neighborhood function
Method involving a square window Method involving a square window over the surface and computing a new over the surface and computing a new value of the central cell of the windowvalue of the central cell of the window
Elements of neighborhood functionsElements of neighborhood functions central pointcentral point size and shape of neighborhoodsize and shape of neighborhood function function
Only in single layerOnly in single layer Moving windows scan all cellsMoving windows scan all cells

23/4/2023/4/20 1212
Neighborhood function: size and shape of neighbor

23/4/2023/4/20 1313
Functions of neighbor operation
mi
mi
nj
njijijij cfC )(
statisticsstatistics max, minmax, min
mean, summean, sum standards derritations standards derritations
valuefieldvaluefieldmeasuremeasure majoritymajority minorityminority varietyvariety

23/4/2023/4/20 1414
Application of neighbor operation: data smooth

23/4/2023/4/20 1515
Application of neighbor operation: variety

23/4/2023/4/20 1616
Loop pass filter
Application of neighbor operation: filter
High pass filter
23/4/2023/4/20 1717
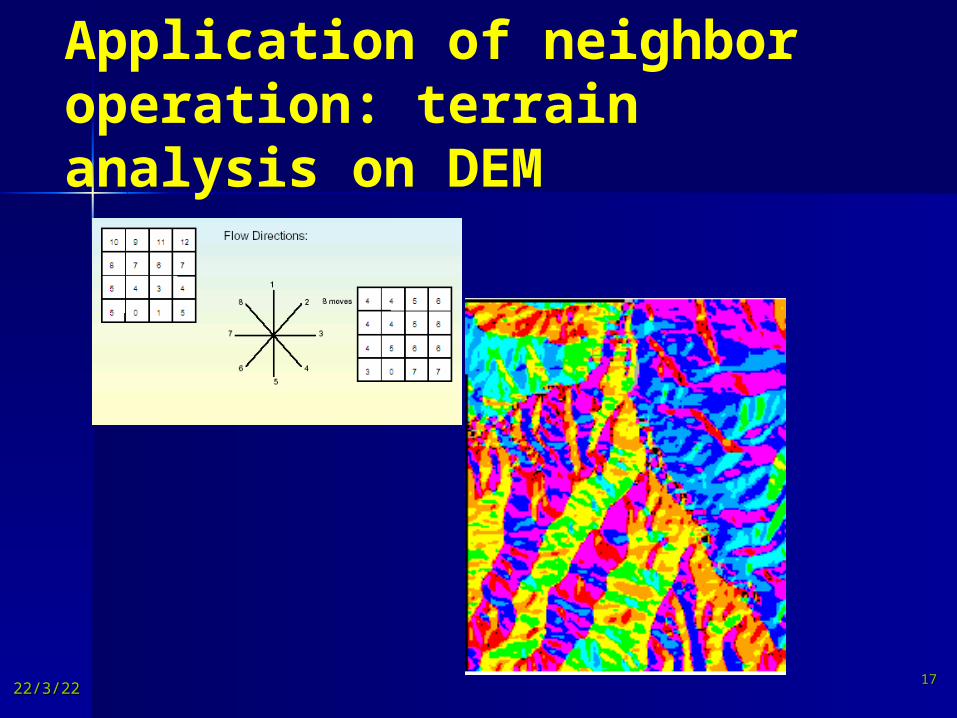
Application of neighbor operation: terrain analysis on DEM

23/4/2023/4/20 1818
Distance measurement
Calculate distance from the given Calculate distance from the given grid cell to source cellgrid cell to source cell same layersame layer global and extend neighbor global and extend neighbor
operationoperation Type of distanceType of distance
nature distancenature distance cost distancecost distance

23/4/2023/4/20 1919
Distance measurement: rules
1.414 X Grid Cell
Grid Cell

23/4/2023/4/20 2020
Distance measurement: nature distance Unit is grid sizeUnit is grid size TypesTypes Application in ArcViewApplication in ArcView
Continuous Continuous :: Find DistanceFind Distanceneatestneatest :: Assign proximityAssign proximity

23/4/2023/4/20 2121
Nature distance measurement
23/4/2023/4/20 2222
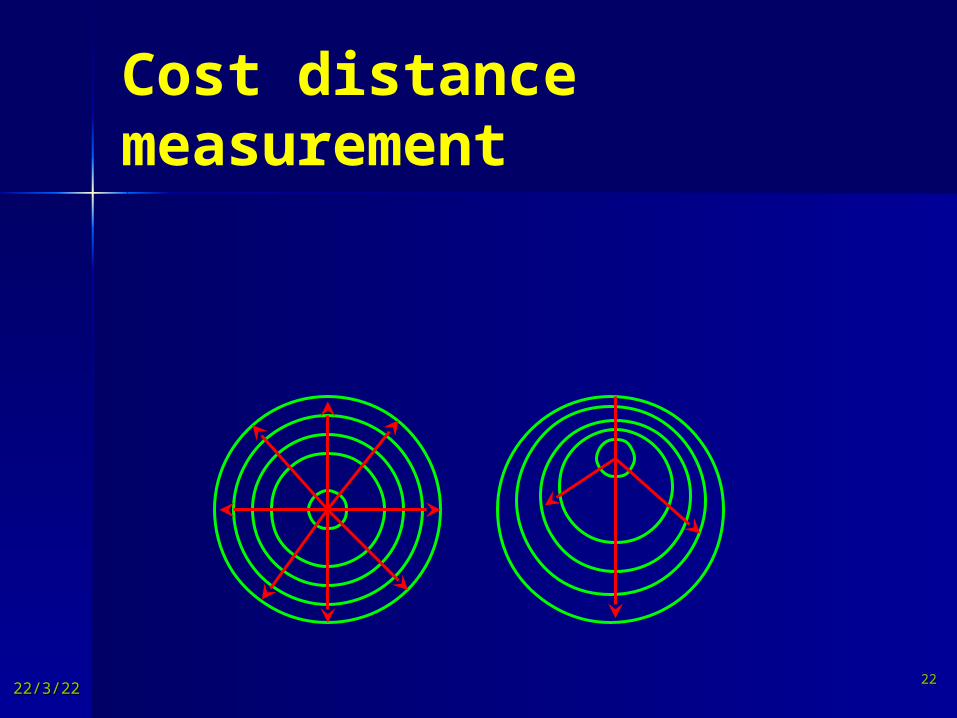
Cost distance measurement

23/4/2023/4/20 2323
Cost distance measurement (Cont.) Source matrix, cost matrix and Source matrix, cost matrix and
link cost matrixlink cost matrix Constitution of cost matrix Constitution of cost matrix
sum of different costssum of different costs Link cost matrix calculationLink cost matrix calculation
horizontal: meanhorizontal: mean diagonal: meanX1.414diagonal: meanX1.414

23/4/2023/4/20 2424
Cost distance measurement (Cont.): link cost matrix calculation
1 2 12
1 4 15
2 3 67
1 3 44
2 12
4 15
3 67
3
365.7
4.5
4.9 3.5 4.2

23/4/2023/4/20 2525
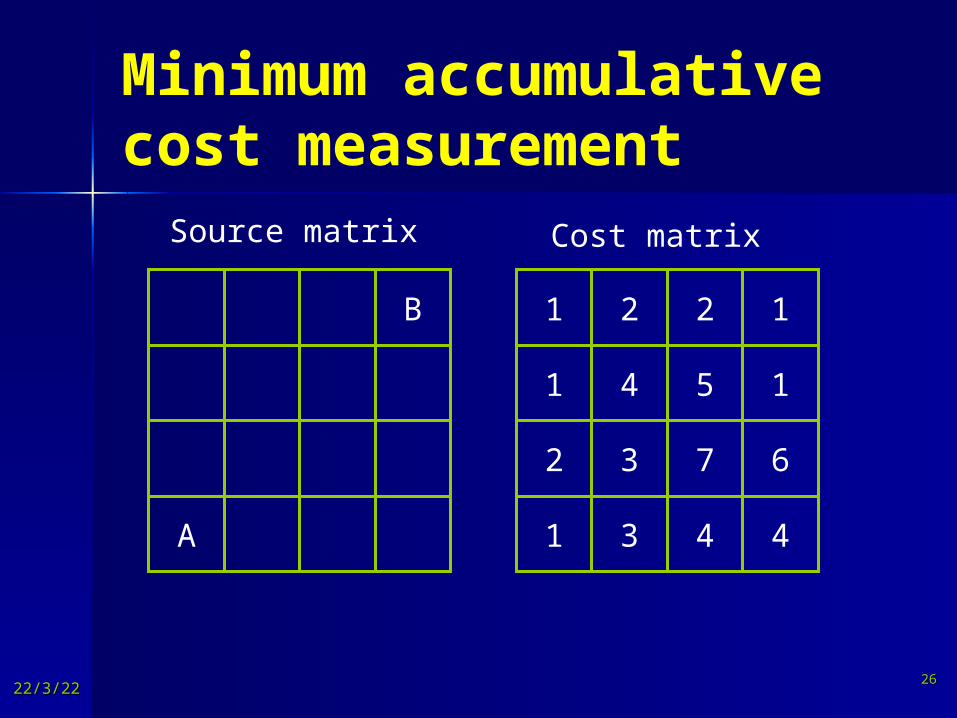
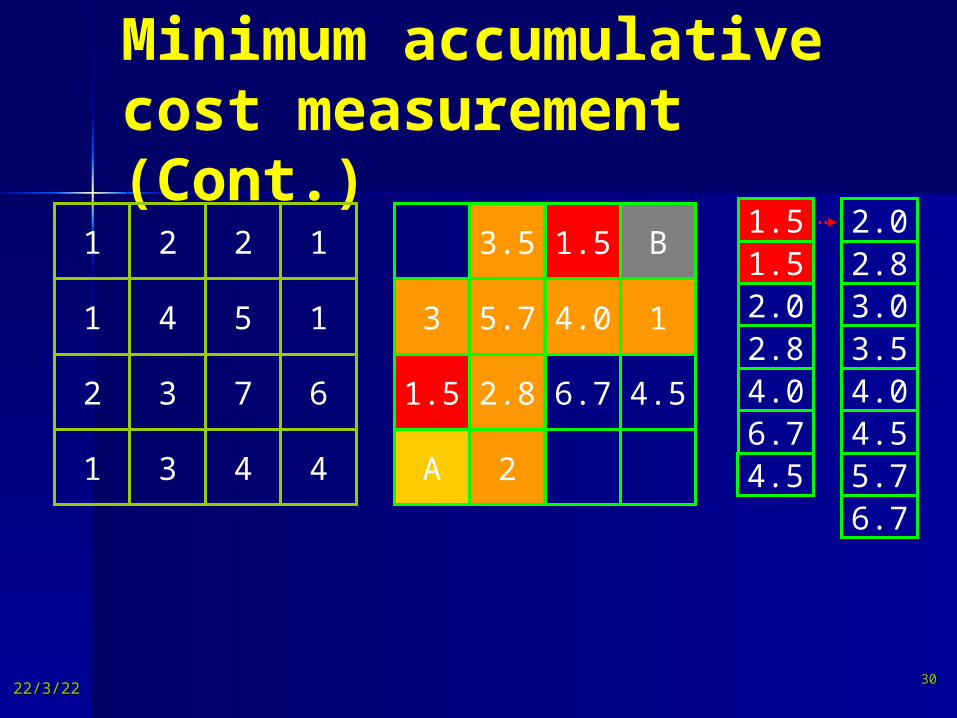
Cost distance measurement (Cont.) Aim: to find minimum accumulative Aim: to find minimum accumulative
cost path cost path Method: loopMethod: loop Example: Example:
Source matrixSource matrix Cost matrixCost matrix Link matrixLink matrix Assign matrixAssign matrix Output matrixOutput matrix
23/4/2023/4/20 2626
Minimum accumulative cost measurement
B
A
1 2 12
1 4 15
2 3 67
1 3 44
Source matrix Cost matrix

23/4/2023/4/20 2727
Minimum accumulative cost measurement (Cont.)
3
1 2 12
1 4 15
2 67
1 3 44
2.8 3 4.9
2.5 5
3.5 5.72.8
Link matrix

23/4/2023/4/20 2828
Minimum accumulative cost measurement (Cont.)
1.5 B
4.2 1
1.5 2.8
A 2
11.51.52.02.84.2
1 2 12
1 4 15
2 3 67
1 3 44

23/4/2023/4/20 2929
Minimum accumulative cost measurement (Cont.)
1.5 B
4.2 1
1.5 2.8 6.7 4.5
A 2
4
11.51.52.02.84.2
1.51.52.02.84.0
6.74.5
1 2 12
1 4 15
2 3 67
1 3 44
23/4/2023/4/20 3030
Minimum accumulative cost measurement (Cont.)
3.5 1.5 B
3 5.7 4.0 1
1.5 2.8 6.7 4.5
A 2
1.51.52.02.84.0
4.56.7
2.02.8
4.0
5.74.5
6.7
3.03.5
1 2 12
1 4 15
2 3 67
1 3 44

23/4/2023/4/20 3131
Minimum accumulative cost measurement (Cont.)
3.5 1.5 B
3 5.7 4.0 1
1.5 2.8 6.7 4.5
A 2 5.5
2.8
4.0
5.7
4.5
6.7
3.03.5
1 2 12
1 4 15
2 3 67
1 3 44
2.02.8
4.0
5.74.5
6.7
3.03.5
5.5
23/4/2023/4/20 3232
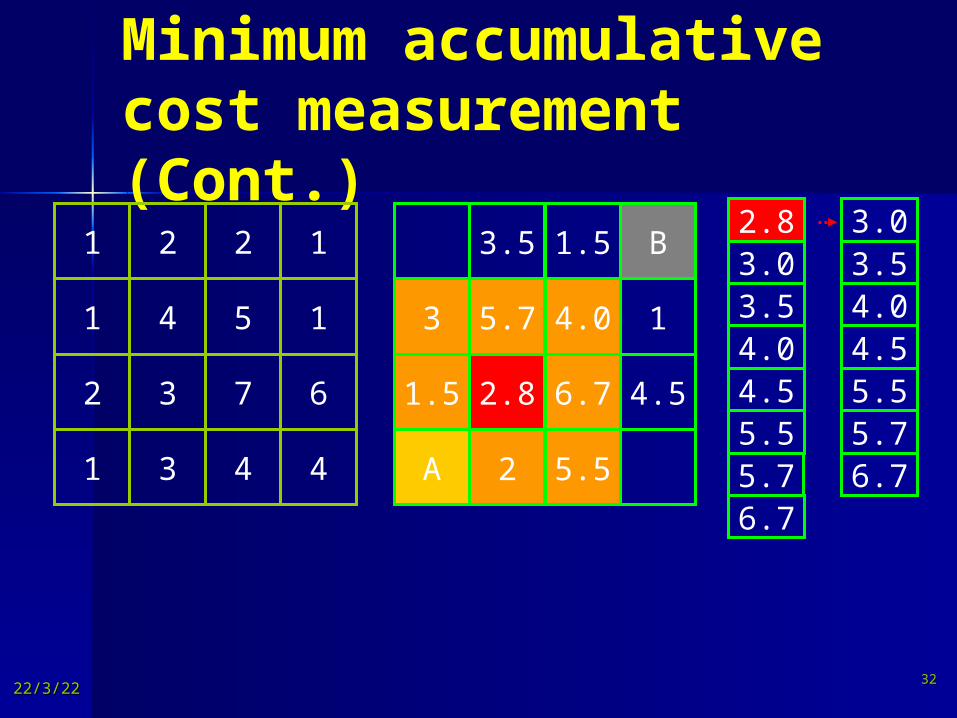
Minimum accumulative cost measurement (Cont.)
3.5 1.5 B
3 5.7 4.0 1
1.5 2.8 6.7 4.5
A 2 5.5
2.8
4.0
5.7
4.5
6.7
3.03.5
1 2 12
1 4 15
2 3 67
1 3 445.5
4.0
5.7
4.5
6.7
3.03.5
5.5

23/4/2023/4/20 3333
Minimum accumulative cost measurement (Cont.)
4 3.5 1.5 B
3 5.7 4.0 1
1.5 2.8 6.7 4.5
A 2 5.5
1 2 12
1 4 15
2 3 67
1 3 44
4.0
5.7
4.5
6.7
3.03.5
5.5
4.0
5.5
4.5
6.7
3.5
5.5
5.5

23/4/2023/4/20 3434
Minimum accumulative cost measurement (Cont.)
4 3.5 1.5 B
3 5.7 4.0 1
1.5 2.8 6.7 4.5
A 2 5.5 9.5
3 1 1 B
3 5 1 7
3 4 8 7
A 5 5 7
1
23
4
5
6 78
Minimum accumulative cost matrix
Cell assign matrix
23/4/2023/4/20 3535
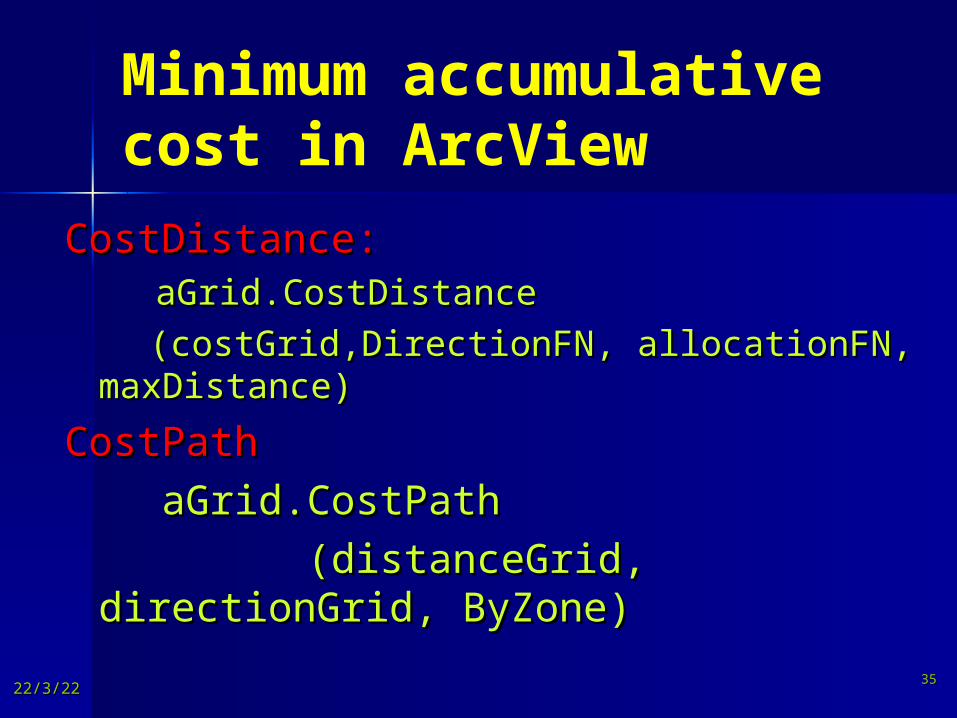
Minimum accumulative cost in ArcView
CostDistance:CostDistance:
aGrid.CostDistanceaGrid.CostDistance
(costGrid,DirectionFN, allocationFN, (costGrid,DirectionFN, allocationFN, maxDistance)maxDistance)
CostPathCostPath
aGrid.CostPathaGrid.CostPath
(distanceGrid, directionGrid, (distanceGrid, directionGrid, ByZone)ByZone)

23/4/2023/4/20 3636
Zonal
Zonal function operats on Zonal function operats on properties of the region (or zone) properties of the region (or zone) to which a give cell beloges to which a give cell beloges
These properties might be These properties might be length area or shapelength area or shape number of location having a certain number of location having a certain
attribute value on one grid that attribute value on one grid that occurs within the area define by a occurs within the area define by a region on another gridregion on another grid

23/4/2023/4/20 3737
Zonal function in ArcView Single gridSingle grid
Map CalculatorMap Calculator aGrid.ZonalGeometry (aGridGeomDescEnum)aGrid.ZonalGeometry (aGridGeomDescEnum)Area of a zone: Area of a zone: #GRID_GEOMDESC_AREA #GRID_GEOMDESC_AREA Perimeter of a zone: #GRID_GEOMDESC_PERIMETER Perimeter of a zone: #GRID_GEOMDESC_PERIMETER Thickness of a zone :Thickness of a zone : #GRID_GEOMDESC_THICKNESS#GRID_GEOMDESC_THICKNESSCharacteristics of an ellipse that is fit to a zone :Characteristics of an ellipse that is fit to a zone : #GRID_GEOMDESC_CENTROID #GRID_GEOMDESC_CENTROID
Only be useful to reclassify raster dataOnly be useful to reclassify raster data Requirement outcome of function is to Requirement outcome of function is to
return a corresponding parameter gridreturn a corresponding parameter grid

23/4/2023/4/20 3838
Zonal function in ArcView (Cont.)

23/4/2023/4/20 3939
Zonal function in ArcView (Cont.) Multilayer Multilayer
Input: statistics of grid data, Input: statistics of grid data, 分带格网分带格网Output: classify table, histogram, area Output: classify table, histogram, area
statisticsstatistics
Steps: Steps:
Summarize Zones Summarize Zones
Histogram by Zone Histogram by Zone
Tabulate Area Tabulate Area

23/4/2023/4/20 4040
Zonal function in ArcView (Cont.)According to drainage area to stat. rainfallAccording to drainage area to stat. rainfall

23/4/2023/4/20 4141
Zonal function in ArcView (Cont.)