Embed Size (px)
Citation preview

Lecture 4: Assessing Diagnostic and
Screening Tests
Reading:Gordis - Chapter 4 Lilienfeld and Stolley - Chapter 6, pp. 117-125
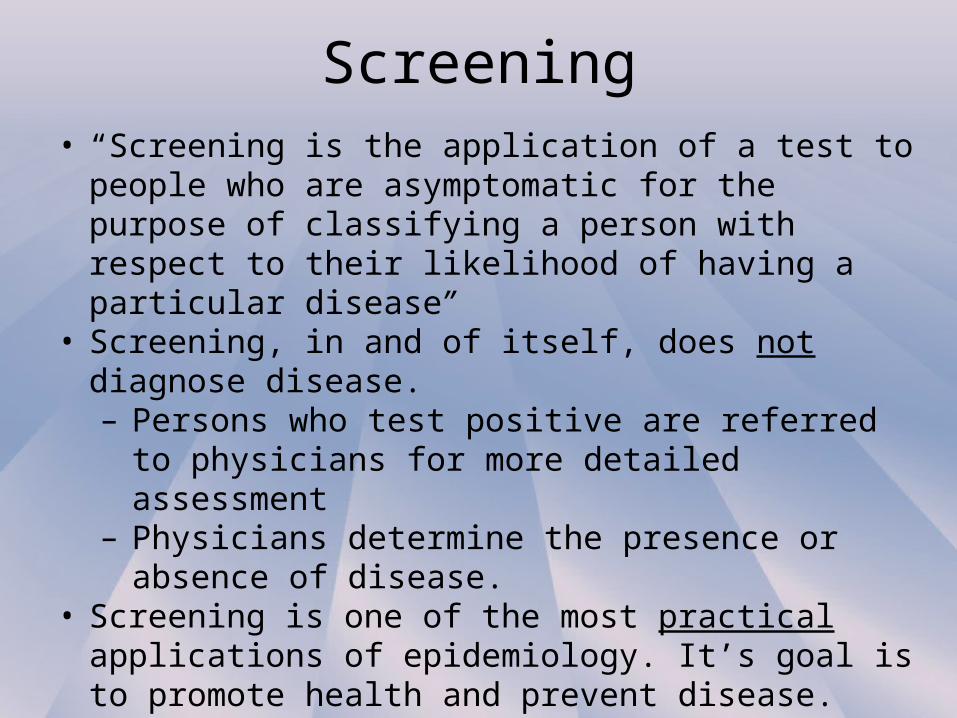
Screening• “Screening is the application of a test to people
who are asymptomatic for the purpose of classifying a person with respect to their likelihood of having a particular disease”
• Screening, in and of itself, does not diagnose disease. – Persons who test positive are referred to
physicians for more detailed assessment – Physicians determine the presence or
absence of disease.• Screening is one of the most practical
applications of epidemiology. It’s goal is to promote health and prevent disease.

Perform screening
test
Recordthe
result
Inform the person
screened
Perform diagnostic
test
Record the
result
Inform the
patient
Start treatment
Revise treatment
and reevaluate
Continue treatment
and reevaluate
Positive result
Positive result
Positive response
Negative result
Negative result
Negative response
ScreeningDecision
Tree
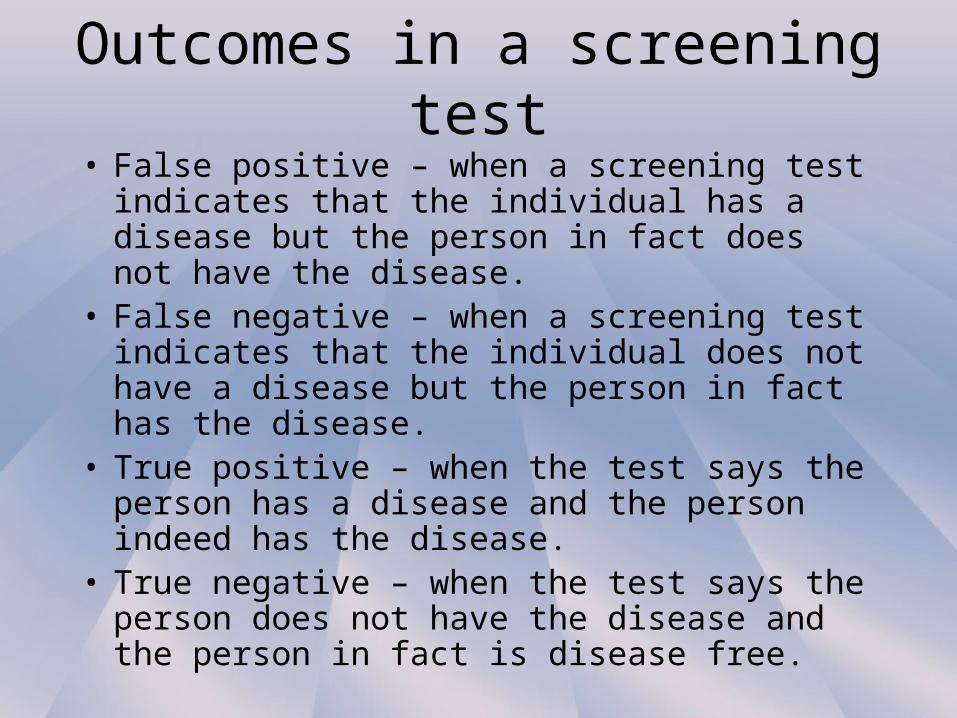
Outcomes in a screening test• False positive – when a screening test
indicates that the individual has a disease but the person in fact does not have the disease.
• False negative – when a screening test indicates that the individual does not have a disease but the person in fact has the disease.
• True positive – when the test says the person has a disease and the person indeed has the disease.
• True negative – when the test says the person does not have the disease and the person in fact is disease free.
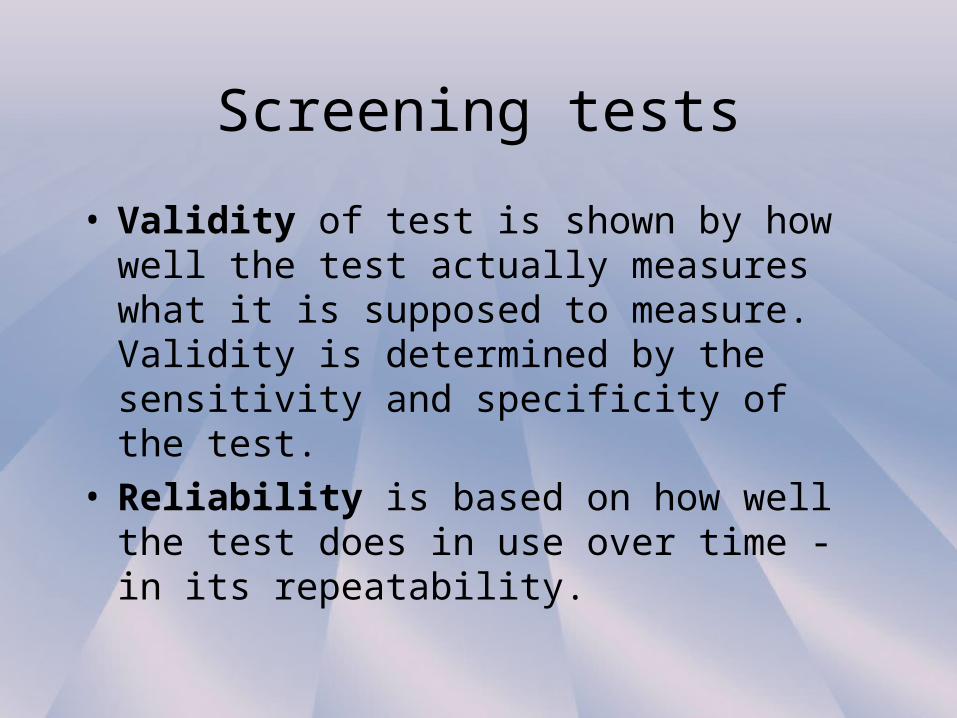
Screening tests
• Validity of test is shown by how well the test actually measures what it is supposed to measure. Validity is determined by the sensitivity and specificity of the test.
• Reliability is based on how well the test does in use over time - in its repeatability.

Sensitivity and specificity: tests of validity
• Sensitivity is the ability of a screening procedure to correctly identify those who have the disease--the percentage of those who have the disease and are proven to have the disease as demonstrated by a diagnostic test.
• Specificity is the ability of a screening procedure to correctly identify the percentage of those who do not have the disease--those who do not have the disease and are proven to not have the disease as demonstrated by a diagnostic test.
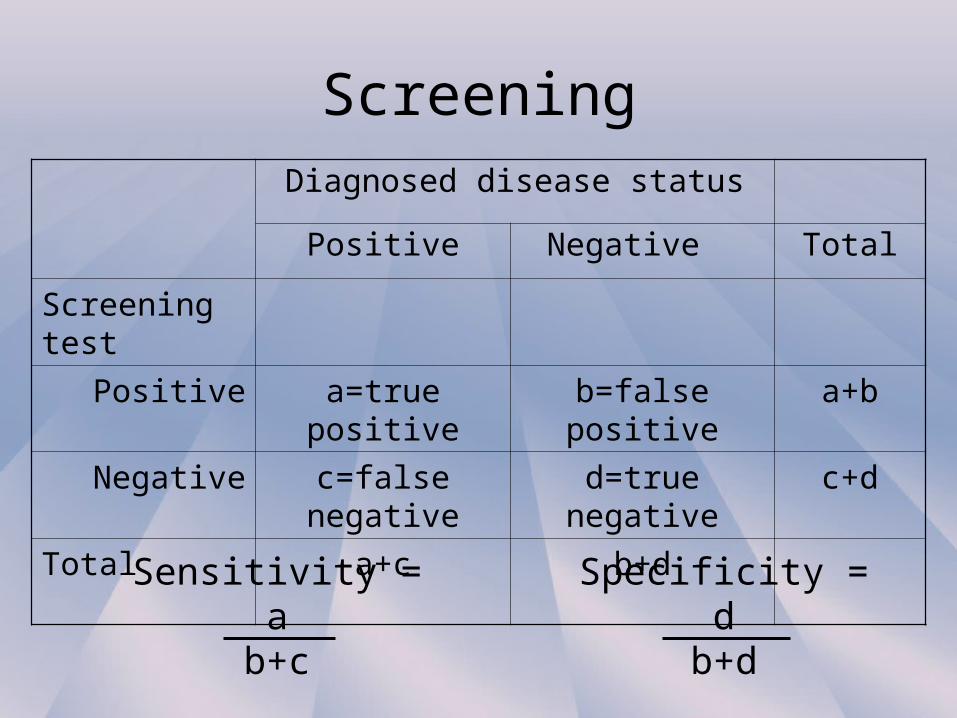
ScreeningDiagnosed disease status
Positive Negative Total
Screening test
Positive a=true positive b=false positive a+b
Negative c=false negative d=true negative c+d
Total a+c b+d
Sensitivity =a
b+c
Specificity =d
b+d
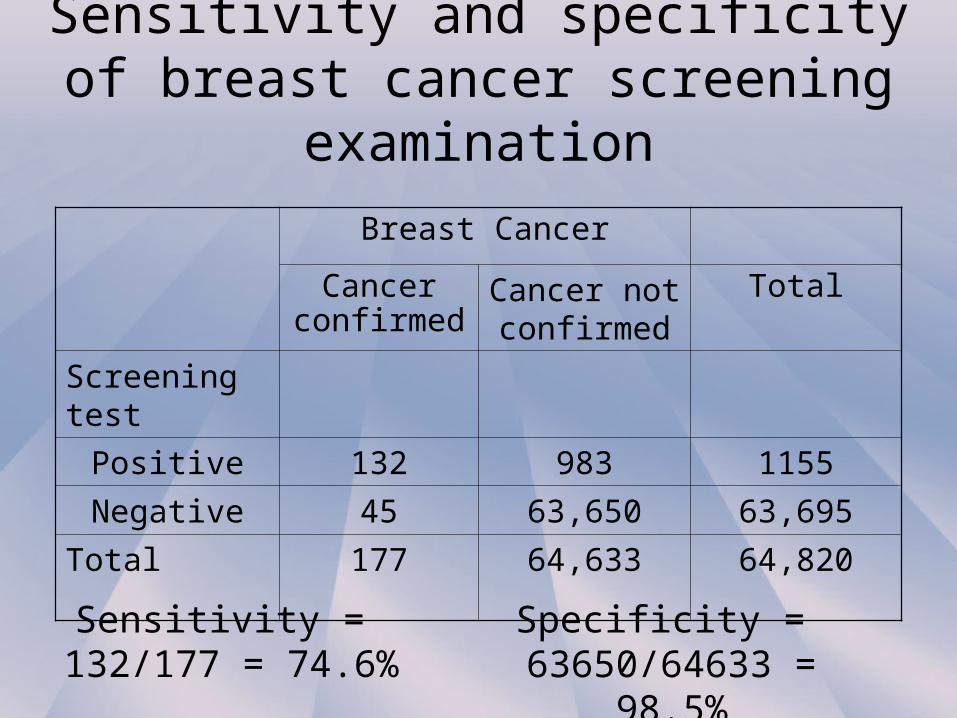
Sensitivity and specificity of breast cancer screening examination
Breast Cancer
Cancer confirmed
Cancer not confirmed
Total
Screening test
Positive 132 983 1155
Negative 45 63,650 63,695
Total 177 64,633 64,820
Sensitivity = 132/177 = 74.6%
Specificity = 63650/64633 = 98.5%
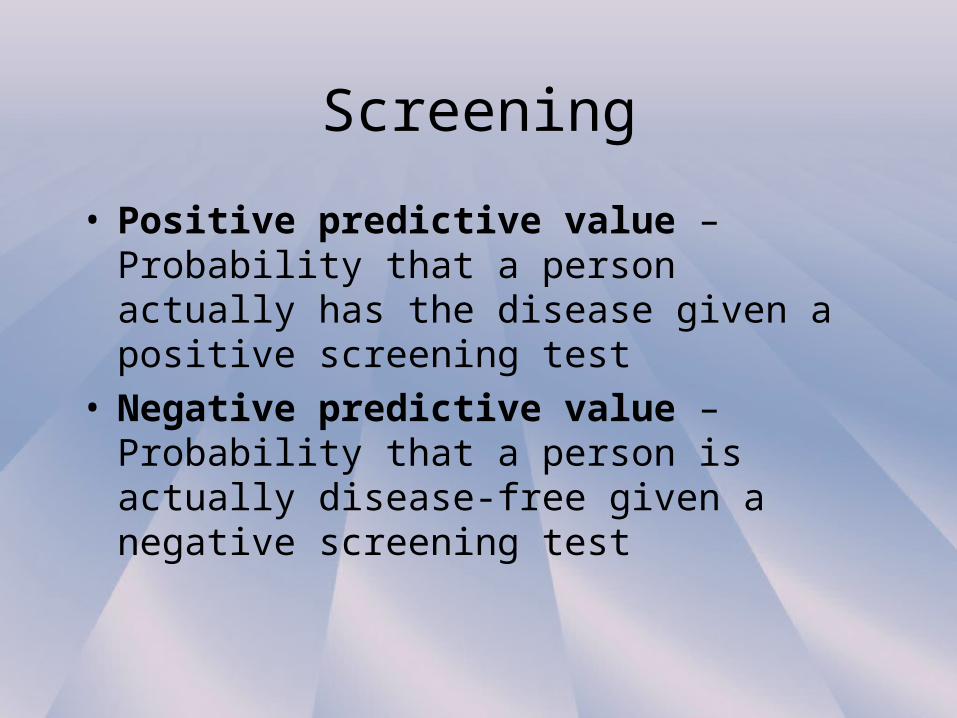
Screening
• Positive predictive value – Probability that a person actually has the disease given a positive screening test
• Negative predictive value – Probability that a person is actually disease-free given a negative screening test
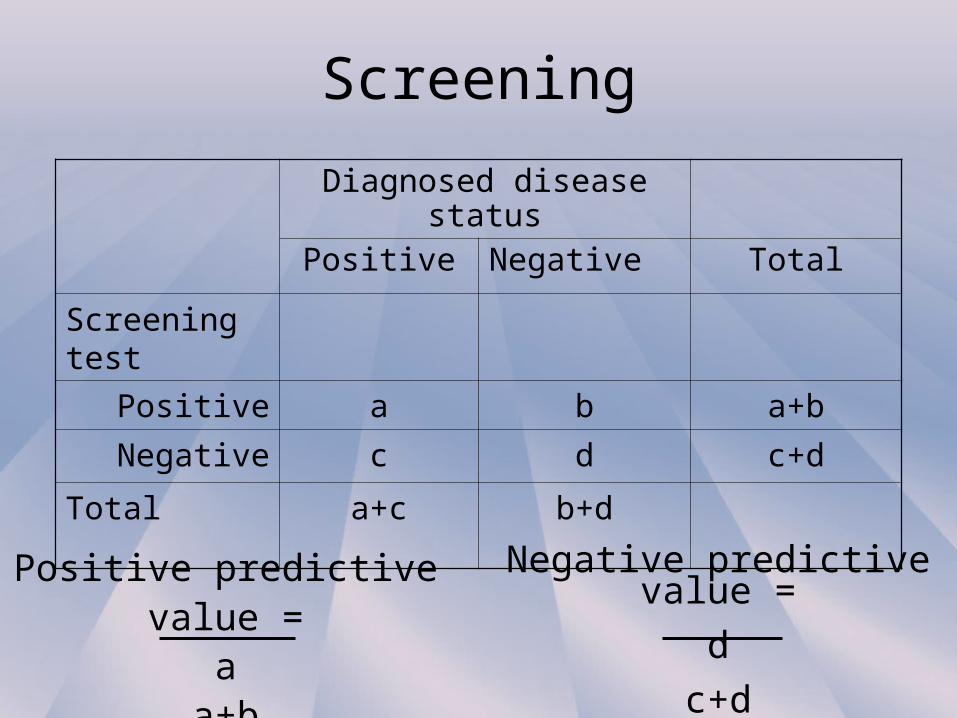
Screening
Diagnosed disease status
Positive Negative Total
Screening test
Positive a b a+b
Negative c d c+d
Total a+c b+d
Positive predictive value =a
a+b
Negative predictive value =
d
c+d
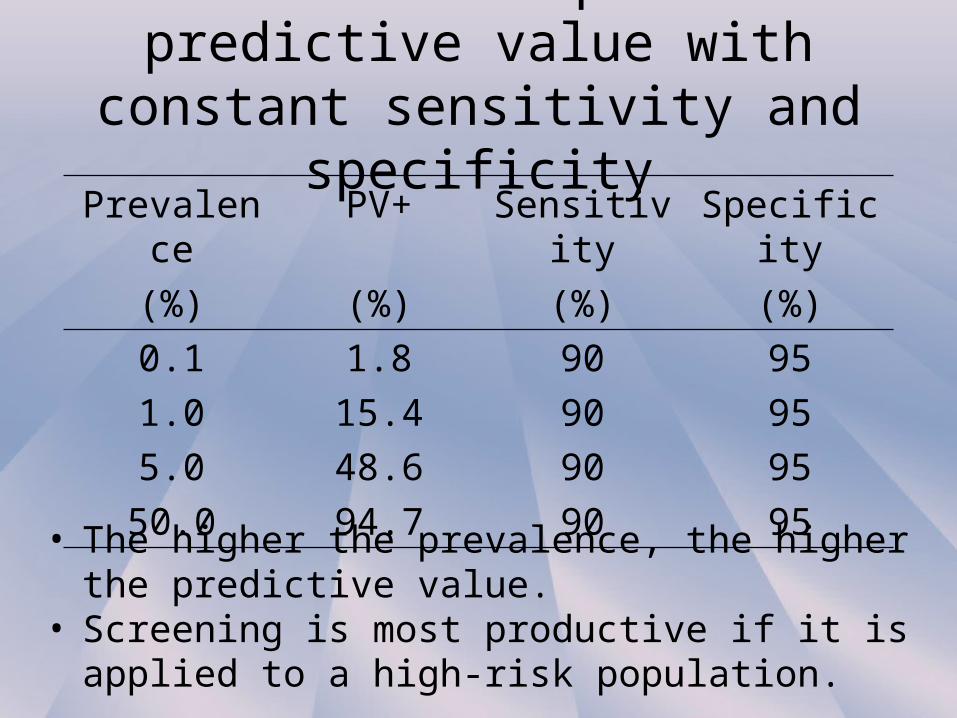
Prevalence on positive predictive value with constant sensitivity and specificity
Prevalence PV+ Sensitivity Specificity
(%) (%) (%) (%)
0.1 1.8 90 95
1.0 15.4 90 95
5.0 48.6 90 95
50.0 94.7 90 95
• The higher the prevalence, the higher the predictive value.
• Screening is most productive if it is applied to a high-risk population.

Cutoff level and validity
• When the test is a continuous variable, we need a cutoff level to decide positive or negative test result.
• If increase the sensitivity by lowering the the cutoff level, we decrease the specificity.
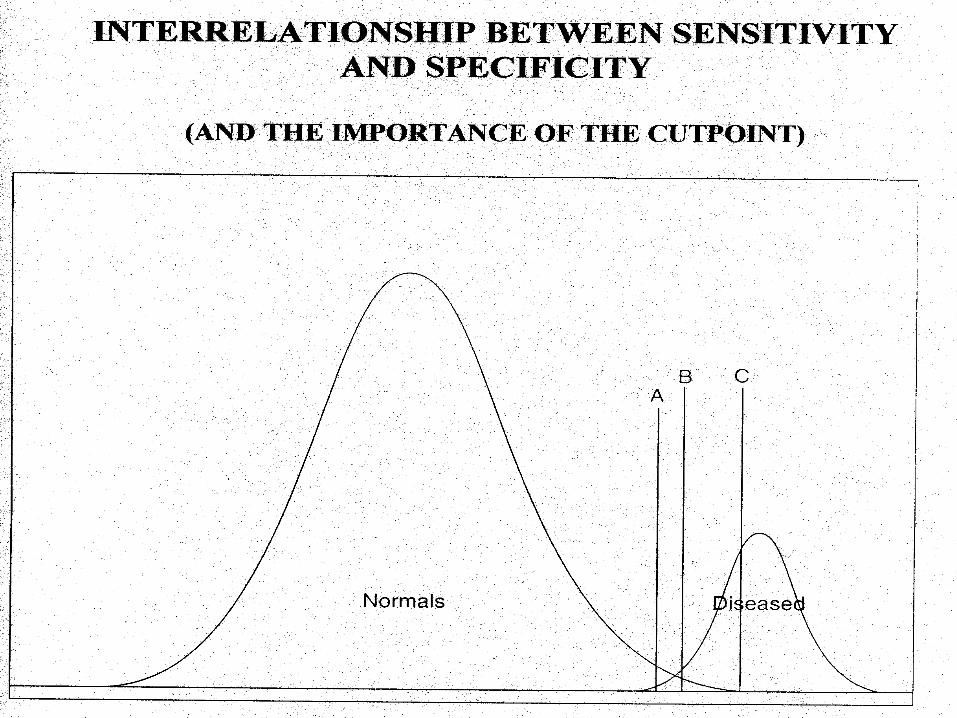
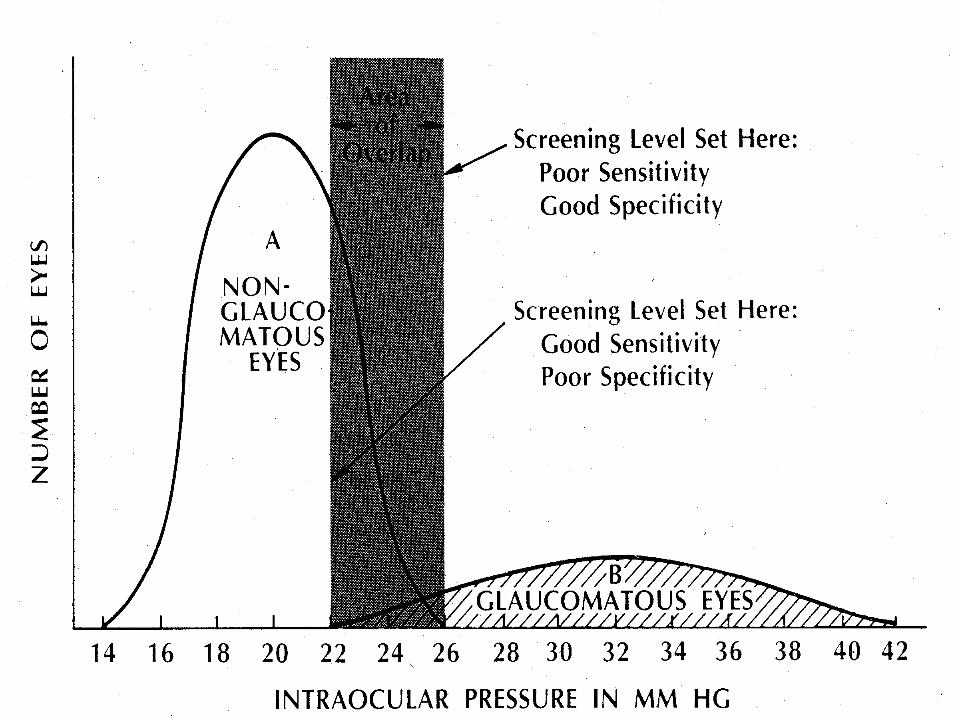
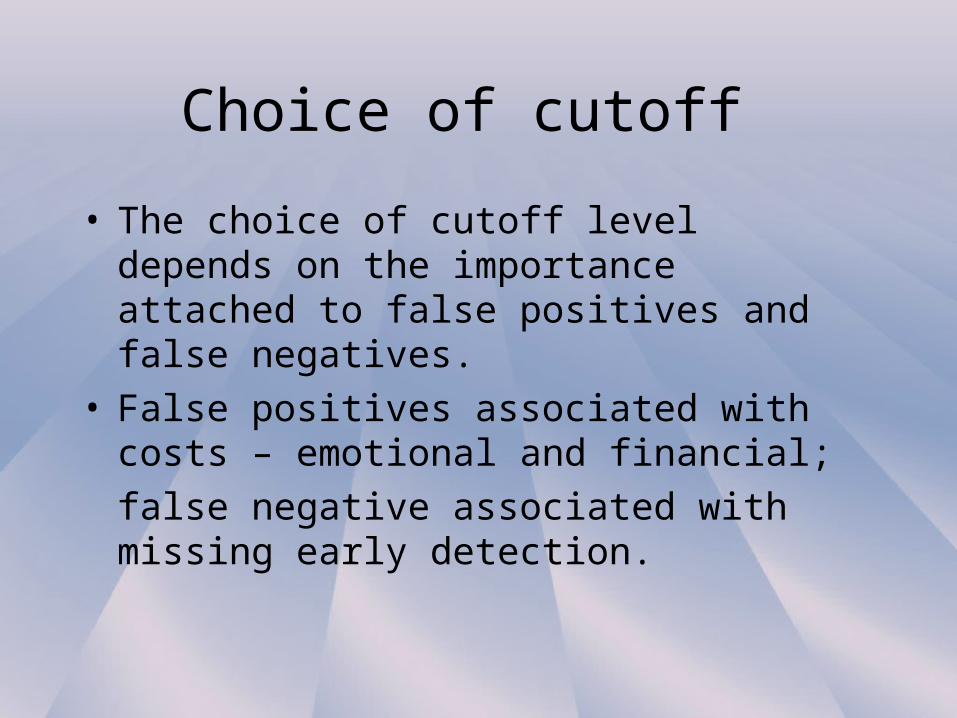
Choice of cutoff
• The choice of cutoff level depends on the importance attached to false positives and false negatives.
• False positives associated with costs – emotional and financial;
false negative associated with missing early detection.
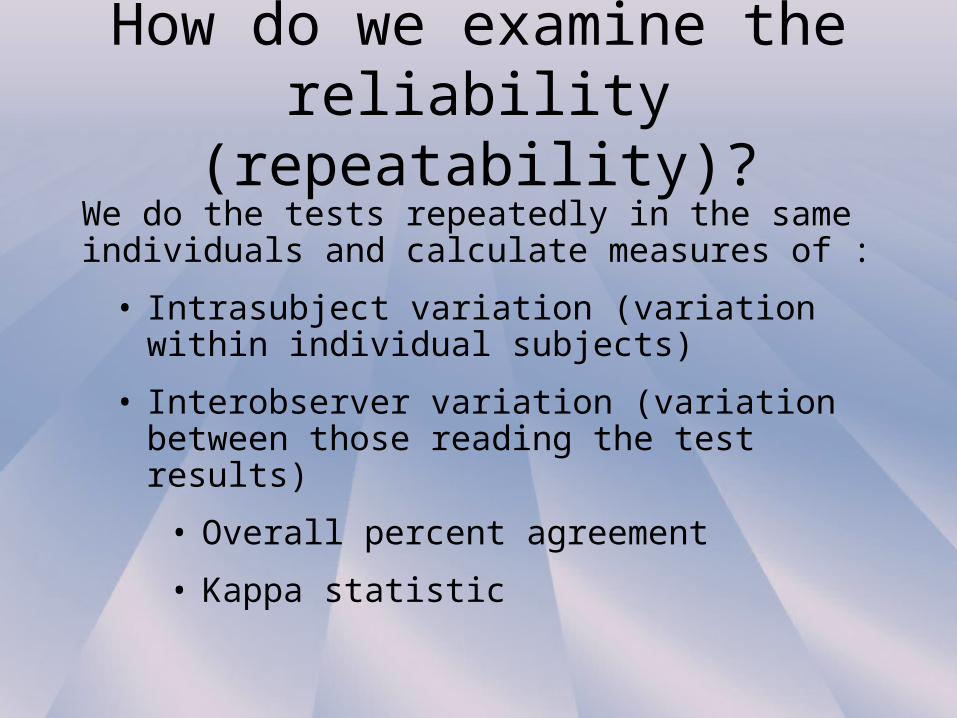
How do we examine the reliability (repeatability)?
We do the tests repeatedly in the same individuals and calculate measures of :
• Intrasubject variation (variation within individual subjects)
• Interobserver variation (variation between those reading the test results)
• Overall percent agreement
• Kappa statistic
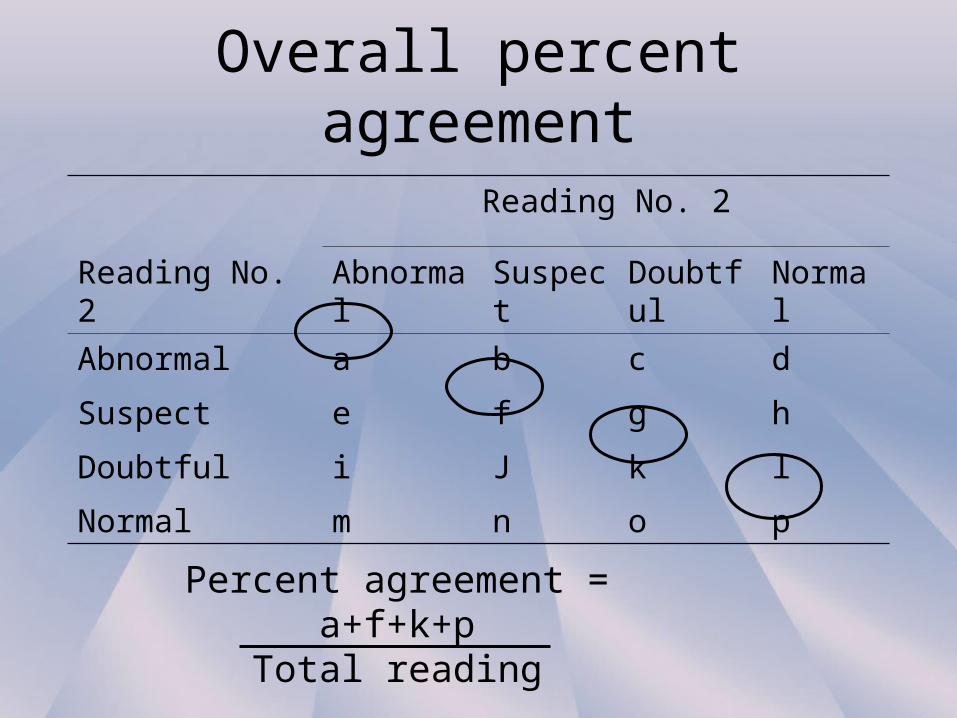
Overall percent agreement
Reading No. 2
Reading No. 2 Abnormal Suspect Doubtful Normal
Abnormal a b c d
Suspect e f g h
Doubtful i J k l
Normal m n o p
Percent agreement =a+f+k+p
Total reading

Kappa statistics
• We would expect agreement purely by chance.• We want to know:
To what extent do readers agree beyond what we would expect by chance alone?
• Answer: calculate Kappa statistics• Kappa = Observed agreement (%) - agreement expected by chance alone (%)
100% - agreement expected by chance alone (%)

Calculate Kappa statistics
Observer 1
+ -
Observer 2
+ 16 2 18
- 16 11 27
32 13 45
Observed agreement = (16+11)/45 = 60%
Observer 1
+ -
Observer 2
+ 12.8 5.2 18
- 19.2 7.8 27
32 13 45
Observed table Expected table
12.8 = 45x(18/45)x(32/45)7.8 = 45x(27/45)x(13/45)Expected agreement =(12.8+7.8)/45 = 45.8%
Kappa = (60% - 45.8%) / (100%-45.8%) = 0.26
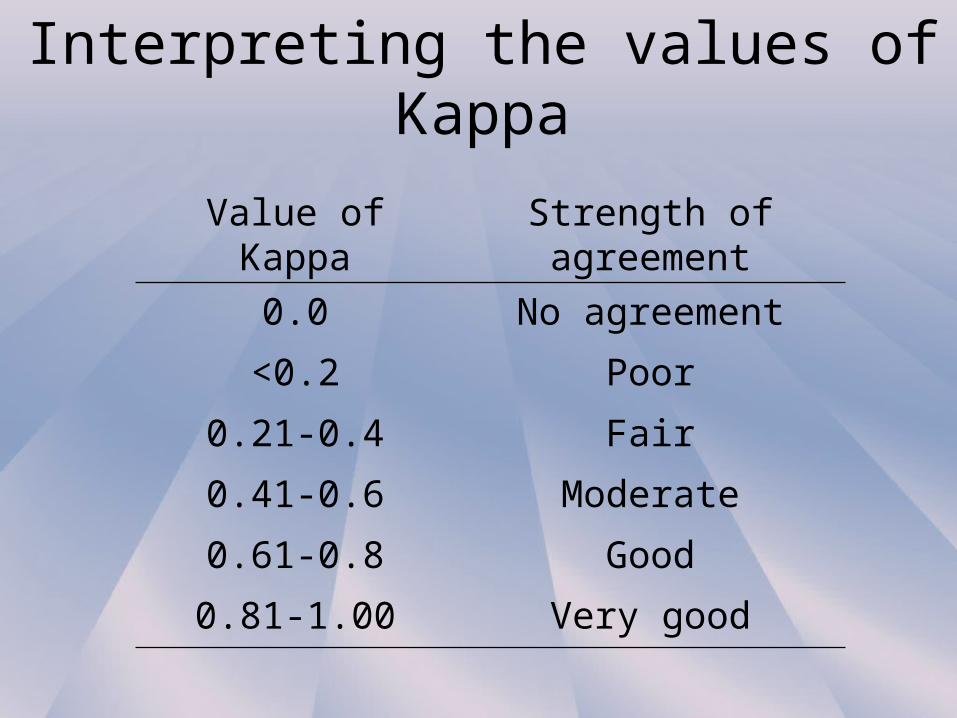
Interpreting the values of Kappa
Value of Kappa Strength of agreement
0.0 No agreement
<0.2 Poor
0.21-0.4 Fair
0.41-0.6 Moderate
0.61-0.8 Good
0.81-1.00 Very good

Validity vs reliability
True value
Test results
Reliable but invalid
Valid but not reliable
Both valid and reliable