Embed Size (px)
Citation preview
Lecture 2b:Lecture 2b:
Performance Metrics Performance Metrics
Performance Metrics
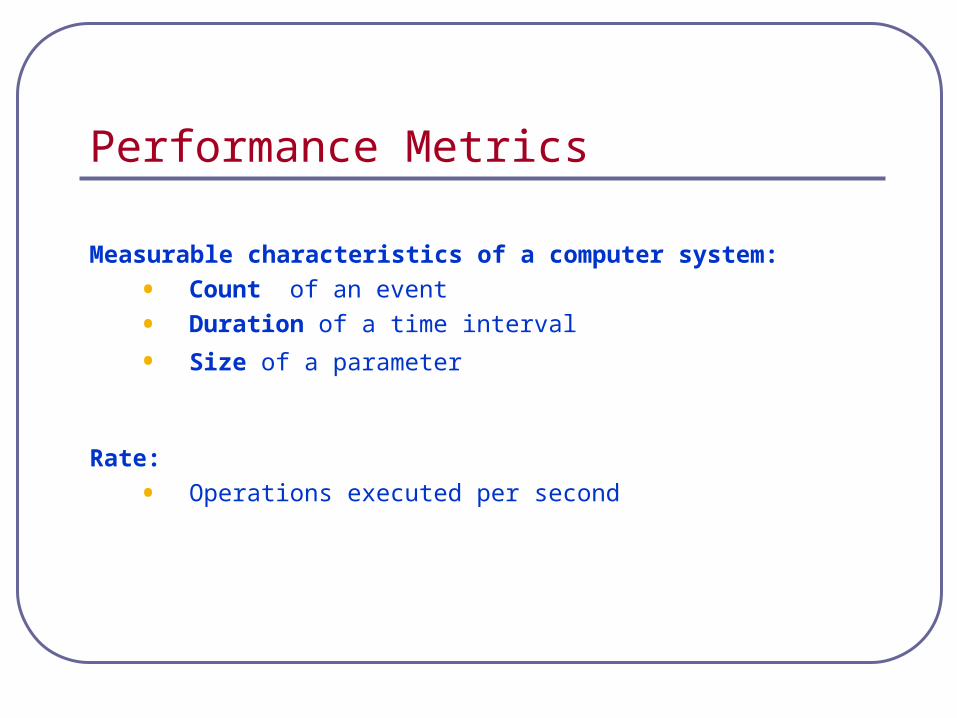
Measurable characteristics of a computer system:
• Count of an event
• Duration of a time interval
• Size of a parameter
Rate:
• Operations executed per second
Performance Mertrics
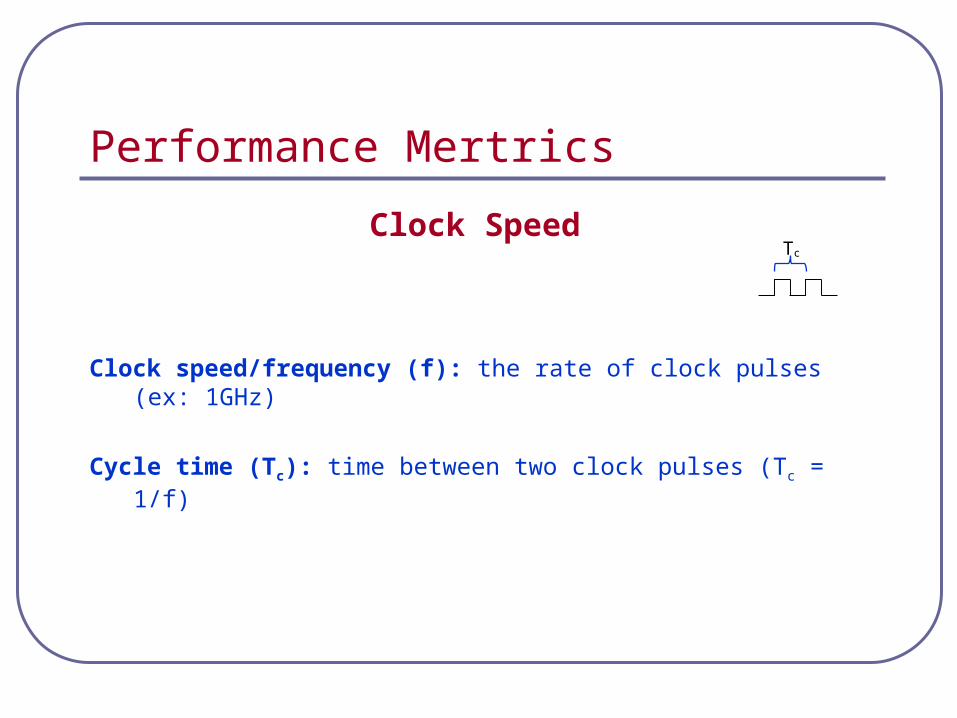
Clock Speed
Clock speed/frequency (f): the rate of clock pulses (ex: 1GHz)
Cycle time (Tc): time between two clock pulses (Tc = 1/f)
Tc
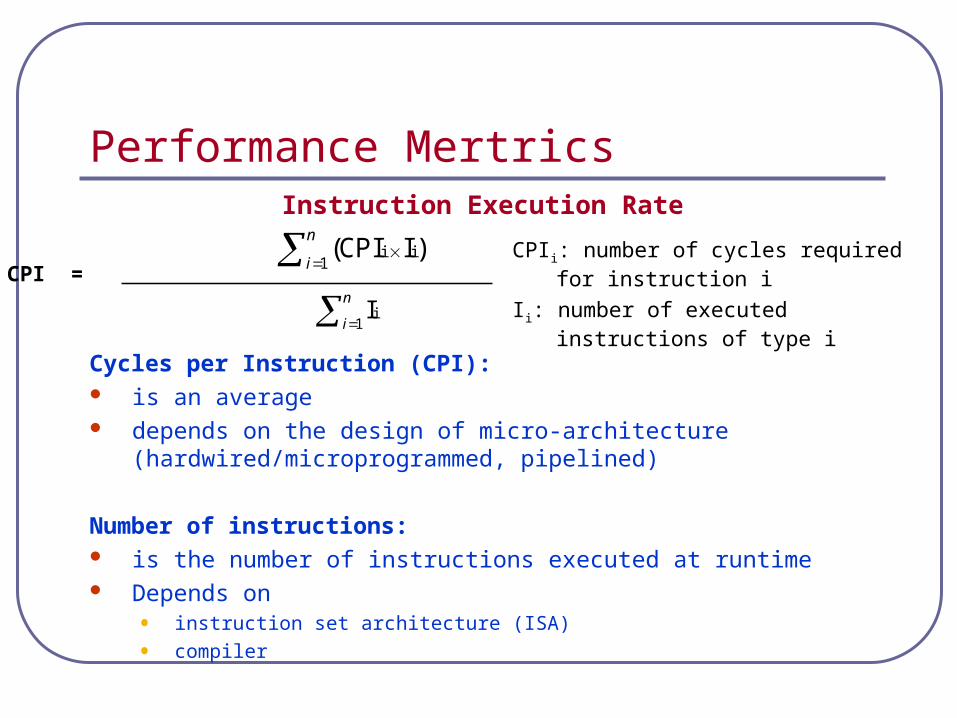
Performance MertricsInstruction Execution Rate
Cycles per Instruction (CPI): is an average depends on the design of micro-architecture
(hardwired/microprogrammed, pipelined)
Number of instructions: is the number of instructions executed at runtime Depends on
• instruction set architecture (ISA)
• compiler
CPI =
n
i 1ii )ICPI(
n
i 1iI
CPIi: number of cycles required for instruction i
Ii: number of executed instructions of type i
Performance Metrics
CPU Performance
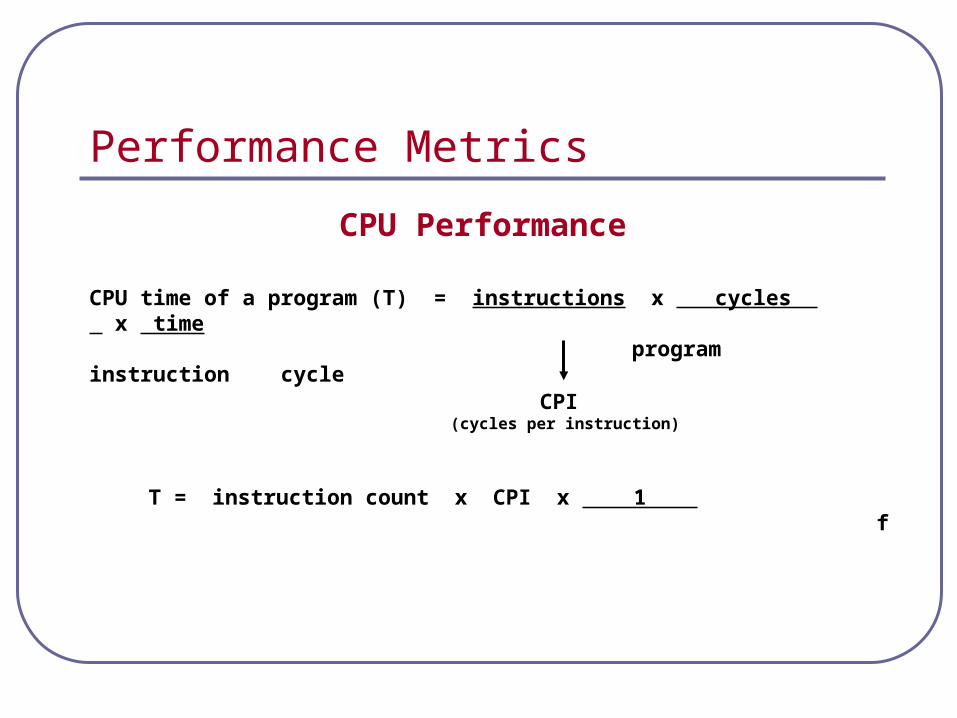
CPU time of a program (T) = instructions x cycles x time program instruction cycle
CPI (cycles per instruction)
T = instruction count x CPI x 1 f
Performance Metrics
CPU Performance
Drawbacks:
In modern computers, no program runs without some operating system running on the hardware
Comparing performance between machines with different operating systems will be unfair
Performance Metrics
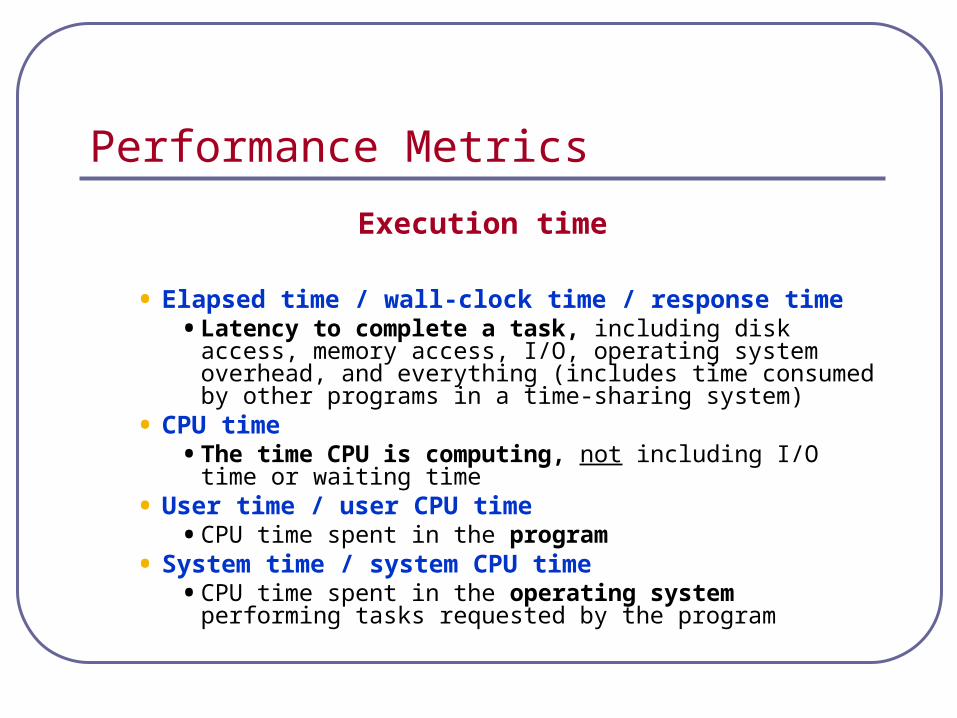
Execution time
• Elapsed time / wall-clock time / response time• Latency to complete a task, including disk access,
memory access, I/O, operating system overhead, and everything (includes time consumed by other programs in a time-sharing system)
• CPU time• The time CPU is computing, not including I/O time or
waiting time• User time / user CPU time
• CPU time spent in the program• System time / system CPU time
• CPU time spent in the operating system performing tasks requested by the program
Performance Metrics
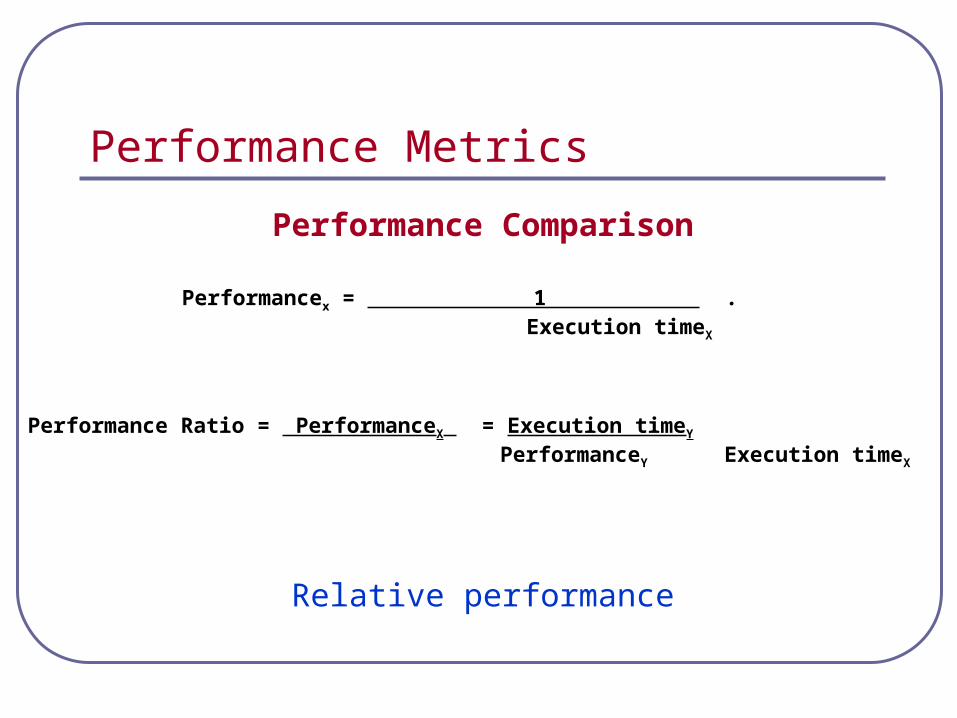
Performance Comparison
Relative performance
Performancex = 1 . Execution timeX
Performance Ratio = PerformanceX = Execution timeY
PerformanceY Execution timeX
Performance Metrics
Relative Performance
• If workload consists of more than one program, total execution time may be used.
• If there are more than one machine to be compared, one of them must be selected as a reference.
Performance Metrics
Throughput
• Total amount of work done in a given time
• Measured in tasks per time unit
• Can be used for
• Operating system performance
• Pipeline performance
• Multiprocessor performance
Performance Metrics
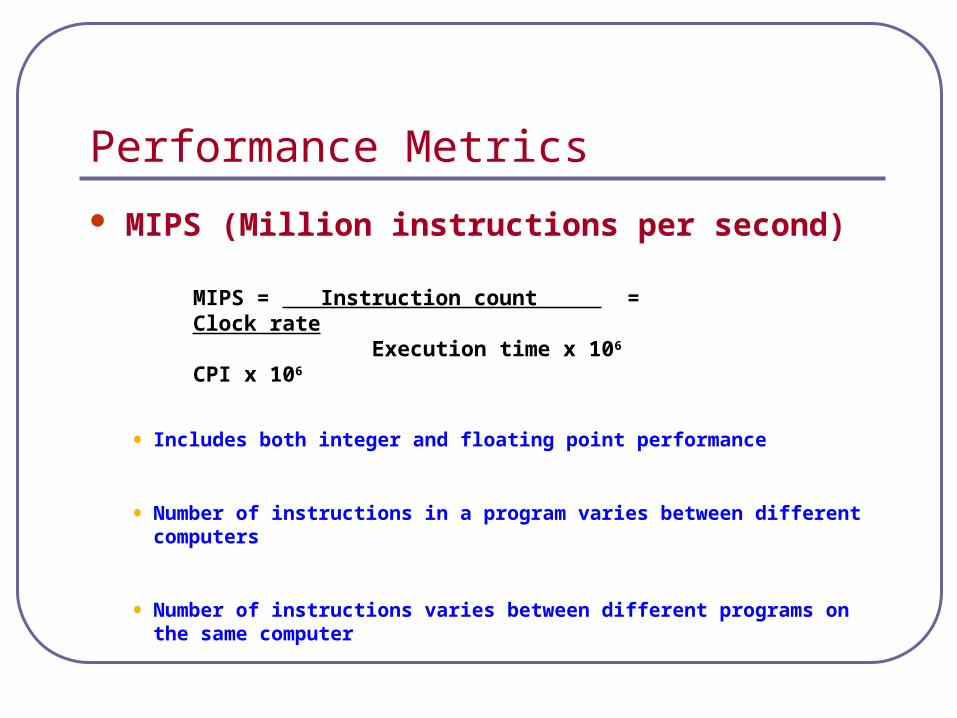
MIPS (Million instructions per second)
• Includes both integer and floating point performance
• Number of instructions in a program varies between different computers
• Number of instructions varies between different programs on the same computer
MIPS = Instruction count = Clock rate Execution time x 106 CPI x 106
Performance Metrics
MFLOPS
(Million floating point operations per second)
• Give performance of only floating-point operations
• Different mixes of integer and floating-point operations may have different execution times:
• Integer and floating-point units work independently
• Instruction and data caches provide instruction and data concurrently
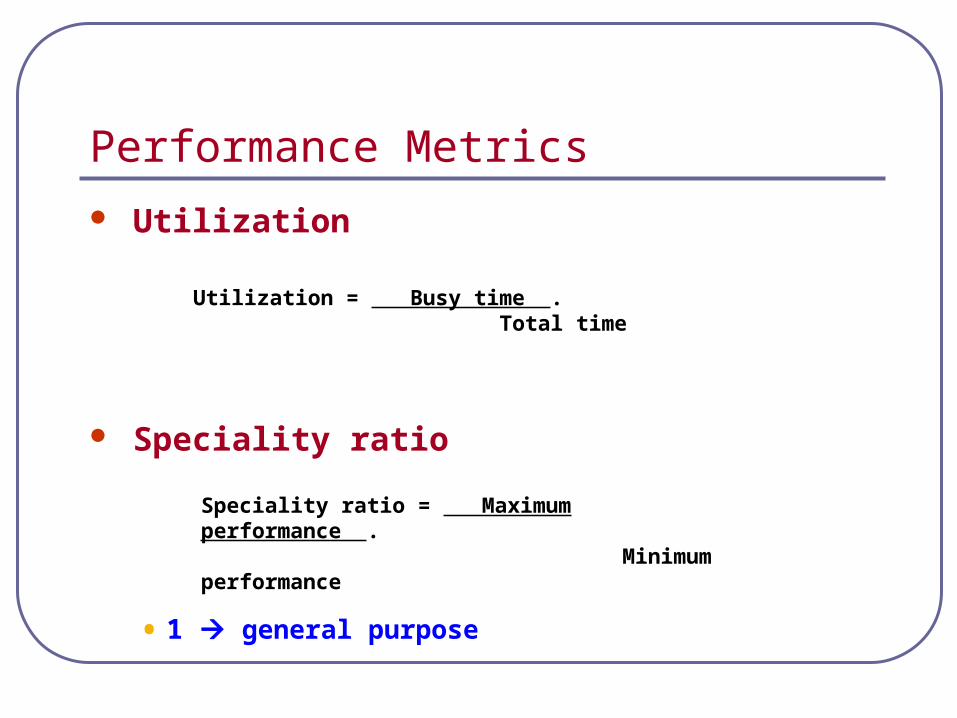
Performance Metrics Utilization
Speciality ratio
• 1 general purpose
Utilization = Busy time . Total time
Speciality ratio = Maximum performance . Minimum performance
Performance Metrics
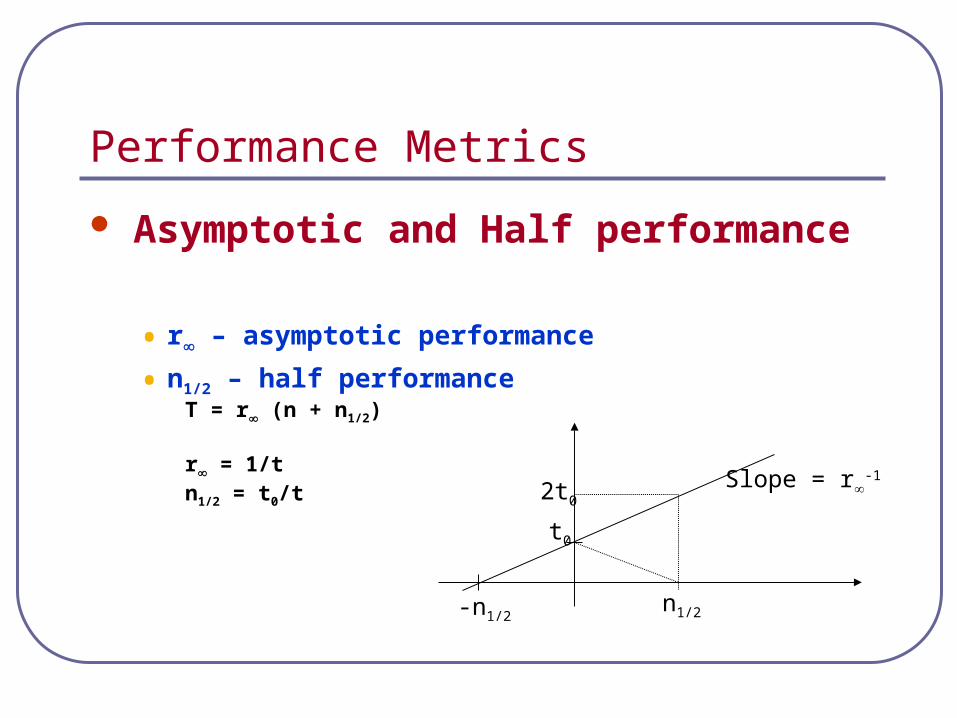
Asymptotic and Half performance
• r – asymptotic performance
• n1/2 – half performance
T = r (n + n1/2)
r = 1/tn1/2 = t0/t
Slope = r-1
t0
-n1/2n1/2
2t0
Performance Metrics
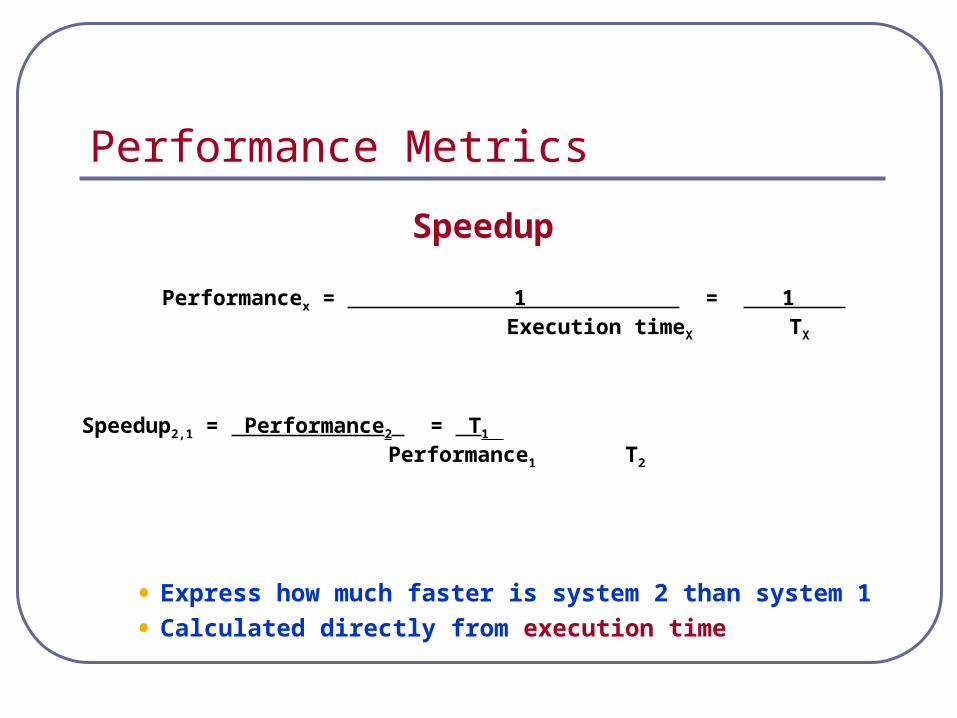
Speedup
• Express how much faster is system 2 than system 1
• Calculated directly from execution time
Performancex = 1 = 1 Execution timeX TX
Speedup2,1 = Performance2 = T1
Performance1 T2
Performance Metrics
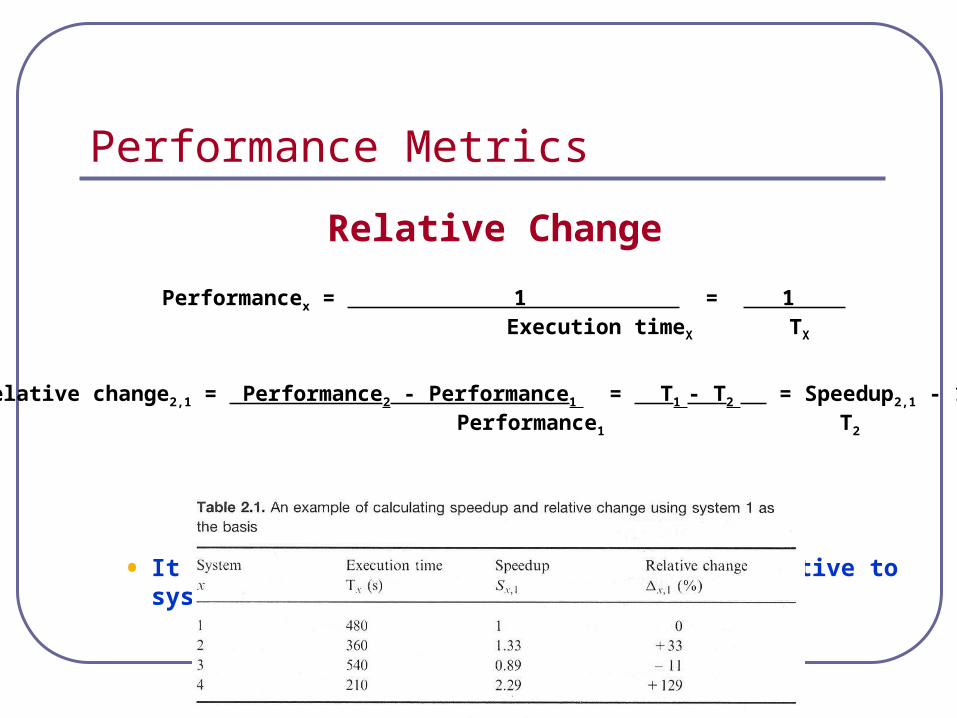
Relative Change
• It expresses the performance of system 2 relative to system 1
Performancex = 1 = 1 Execution timeX TX
Relative change2,1 = Performance2 - Performance1 = T1 - T2 = Speedup2,1 - 1 Performance1 T2
Performance Metrics
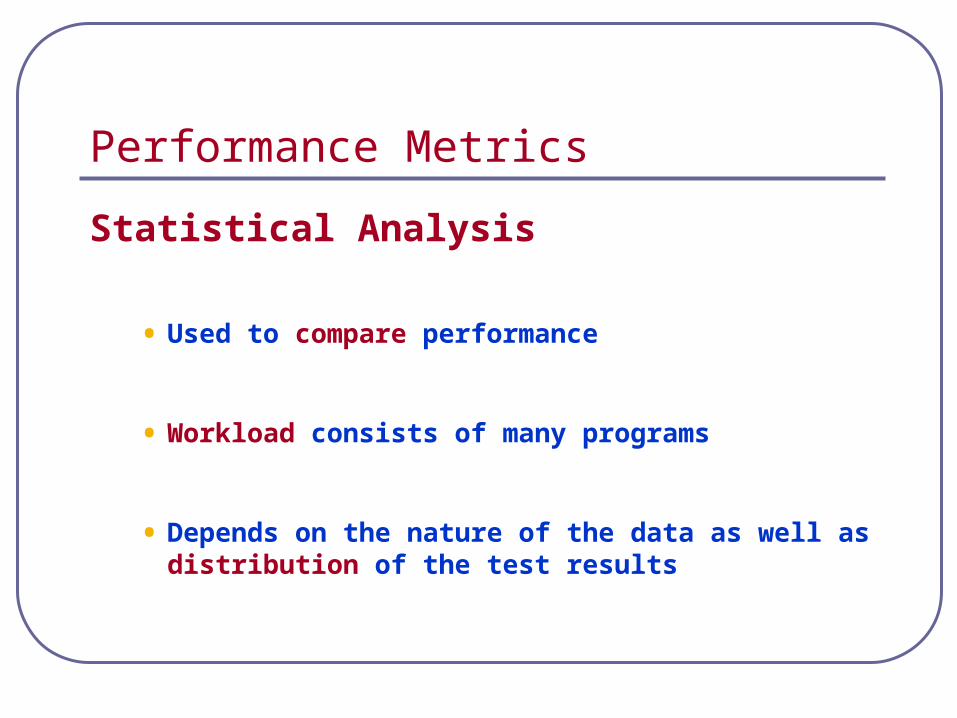
Statistical Analysis
• Used to compare performance
• Workload consists of many programs
• Depends on the nature of the data as well as distribution of the test results
Performance Metrics
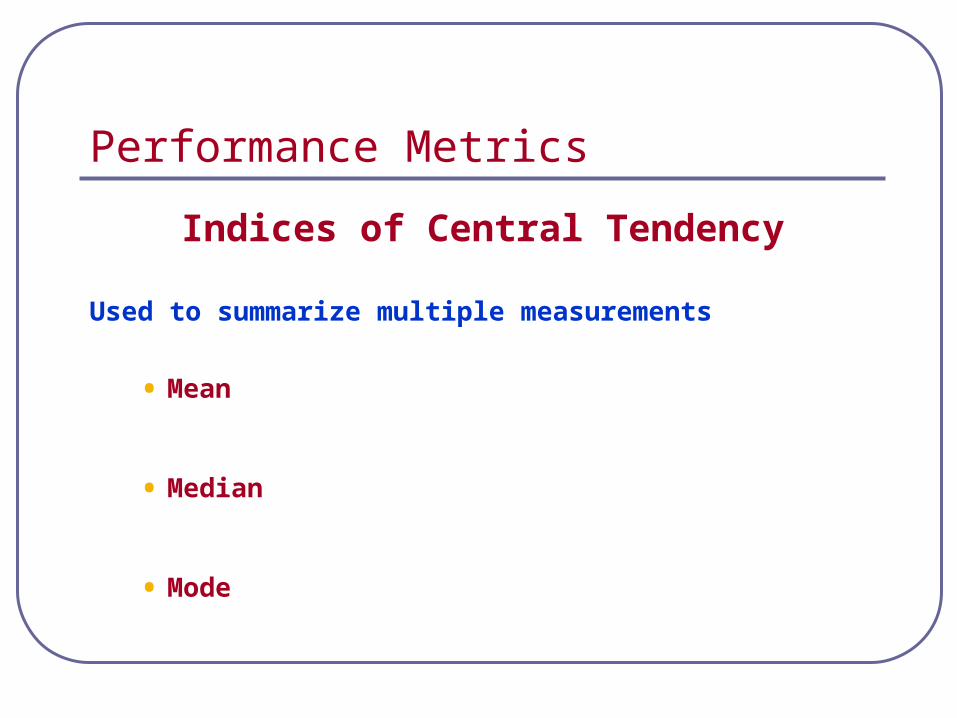
Indices of Central Tendency
Used to summarize multiple measurements
• Mean
• Median
• Mode
Performance Metrics
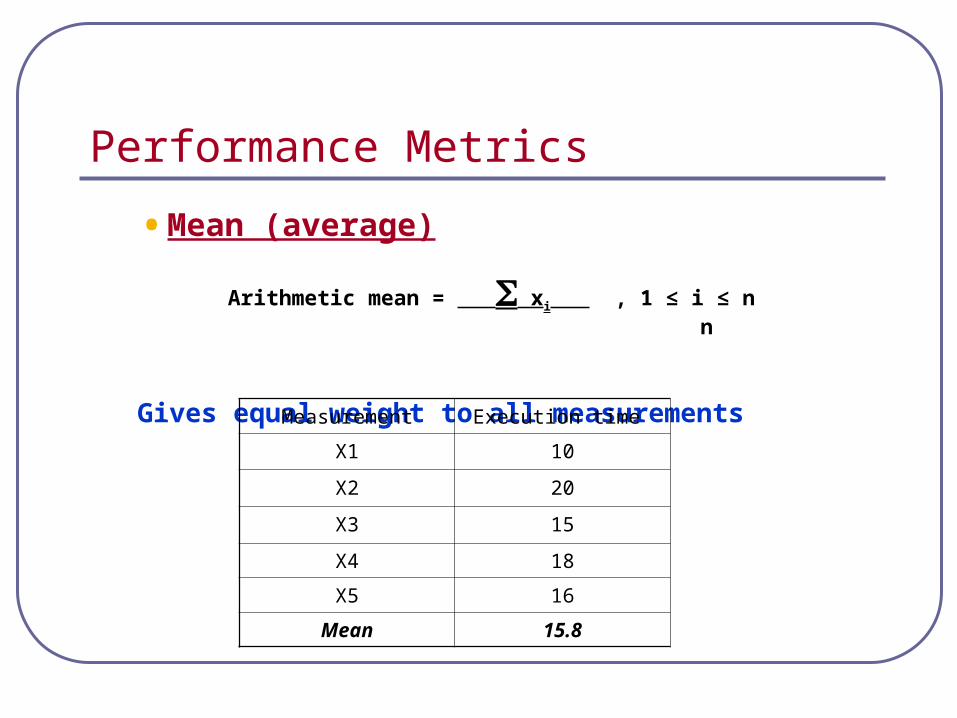
• Mean (average)
Gives equal weight to all measurements
Arithmetic mean = xi , 1 ≤ i ≤ n n
Measurement Execution time
X1 10
X2 20
X3 15
X4 18
X5 16
Mean 15.8
Performance Metrics
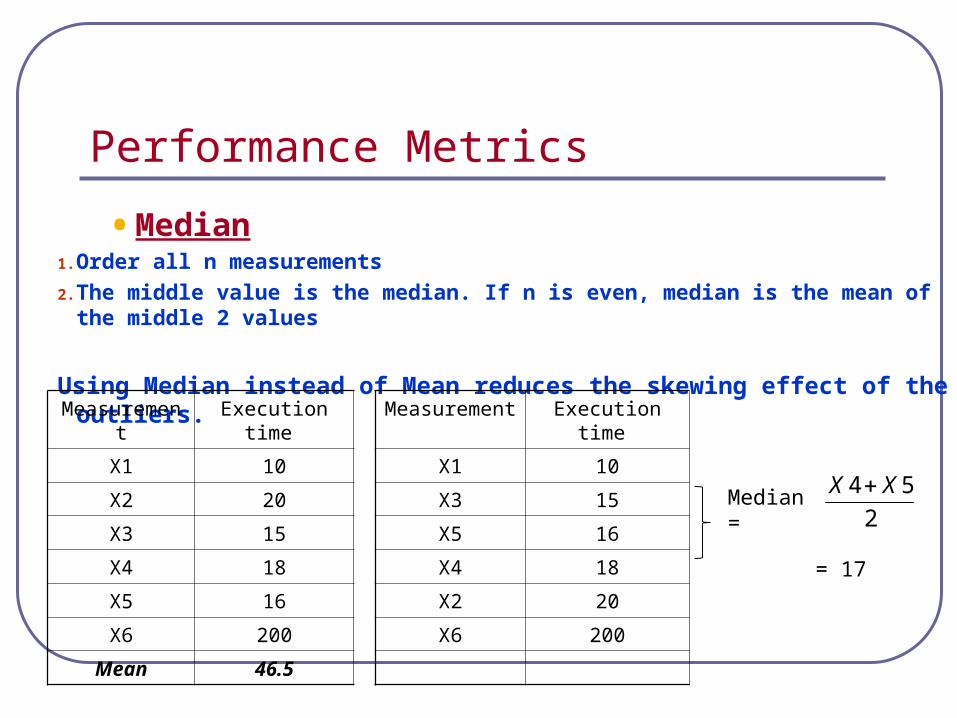
• Median1. Order all n measurements
2. The middle value is the median. If n is even, median is the mean of the middle 2 values
Using Median instead of Mean reduces the skewing effect of the outliers.
Measurement Execution time
X1 10
X2 20
X3 15
X4 18
X5 16
X6 200
Mean 46.5
Measurement Execution time
X1 10
X3 15
X5 16
X4 18
X2 20
X6 200
2
54 XX Median =
= 17
Performance Metrics
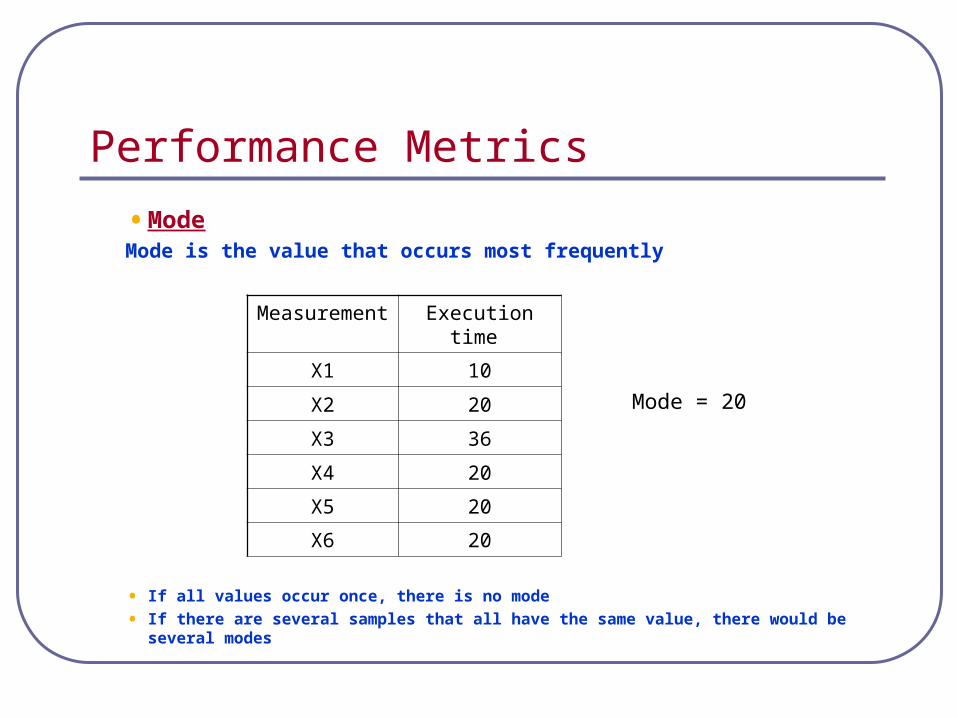
• ModeMode is the value that occurs most frequently
• If all values occur once, there is no mode
• If there are several samples that all have the same value, there would be several modes
Measurement Execution time
X1 10
X2 20
X3 36
X4 20
X5 20
X6 20
Mode = 20

Mean, Median, Mode
Mean Incorporates information from the entire measured values Sensitive to outliers
Median and Mode Less sensitive to outliers Do not effectively use all information
ex
Performance Metrics
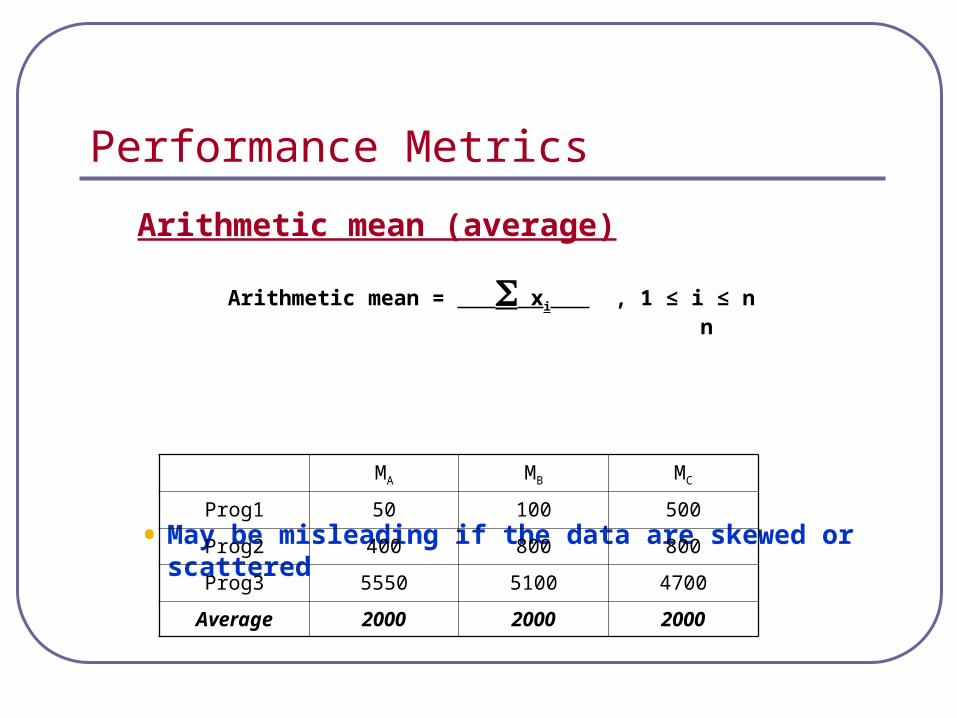
Arithmetic mean (average)
• May be misleading if the data are skewed or scattered
Arithmetic mean = xi , 1 ≤ i ≤ n n
MA MB MC
Prog1 50 100 500
Prog2 400 800 800
Prog3 5550 5100 4700
Average 2000 2000 2000
Performance Metrics
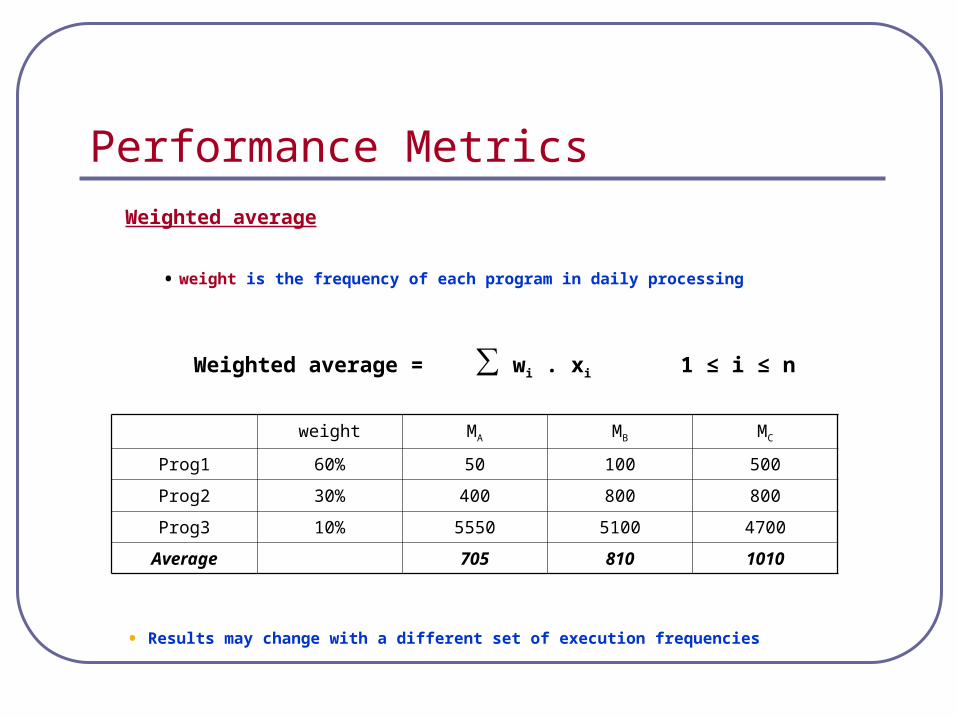
Weighted average
• weight is the frequency of each program in daily processing
• Results may change with a different set of execution frequencies
Weighted average = ∑ wi . xi 1 ≤ i ≤ n
weight MA MB MC
Prog1 60% 50 100 500
Prog2 30% 400 800 800
Prog3 10% 5550 5100 4700
Average 705 810 1010
Performance Metrics
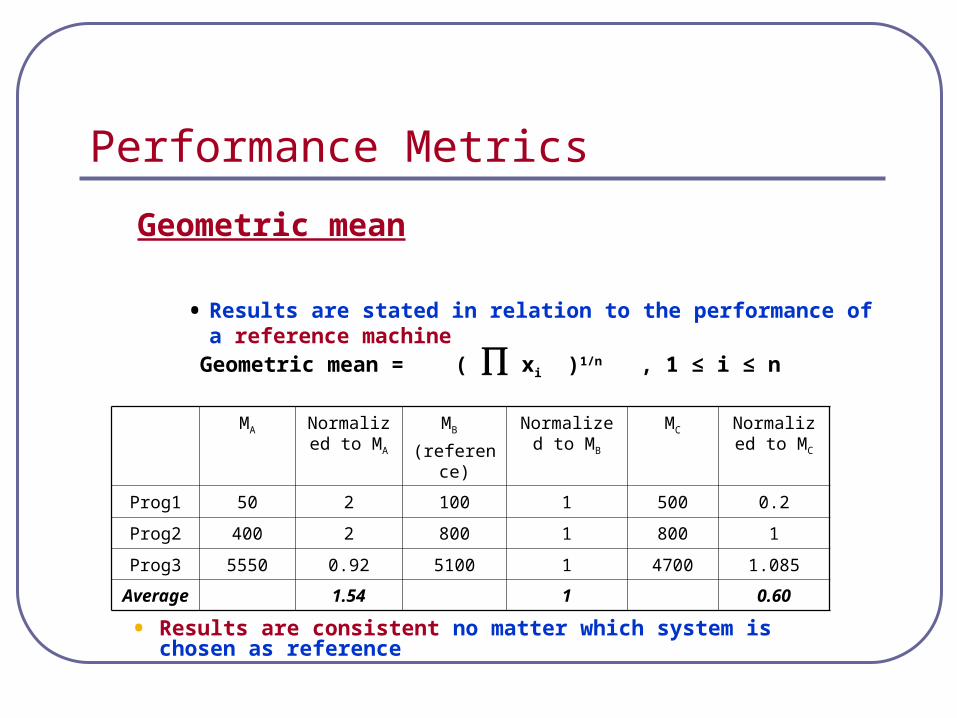
Geometric mean
• Results are stated in relation to the performance of a reference machine
Geometric mean = ( xi )1/n , 1 ≤ i ≤ n
MA Normalized to MA
MB
(reference)
Normalized to MB
MC Normalized to MC
Prog1 50 2 100 1 500 0.2
Prog2 400 2 800 1 800 1
Prog3 5550 0.92 5100 1 4700 1.085
Average 1.54 1 0.60
• Results are consistent no matter which system is chosen as reference
Performance Metrics
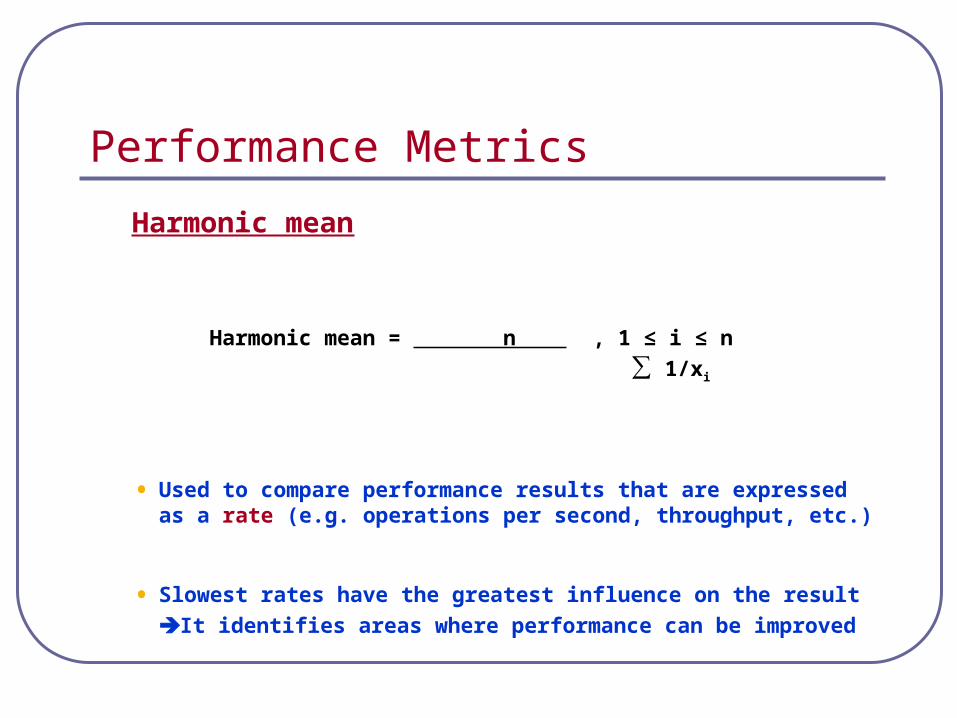
Harmonic mean
• Used to compare performance results that are expressed as a rate (e.g. operations per second, throughput, etc.)
• Slowest rates have the greatest influence on the result
It identifies areas where performance can be improved
Harmonic mean = n , 1 ≤ i ≤ n
∑ 1/xi
Performance Metrics
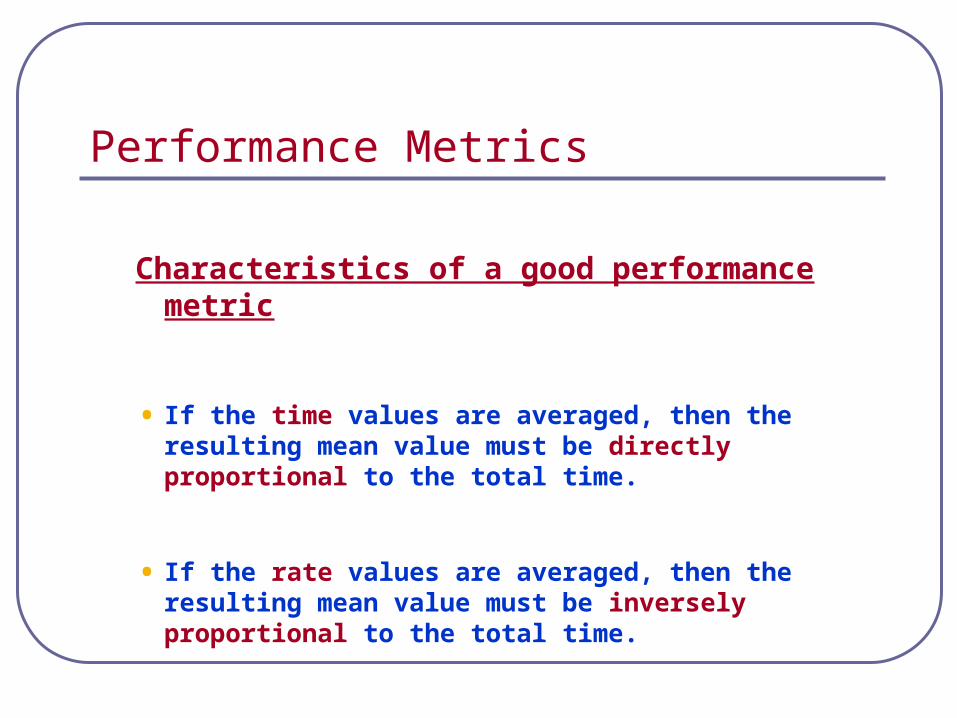
Characteristics of a good performance metric
• If the time values are averaged, then the resulting mean value must be directly proportional to the total time.
• If the rate values are averaged, then the resulting mean value must be inversely proportional to the total time.
Performance Metrics
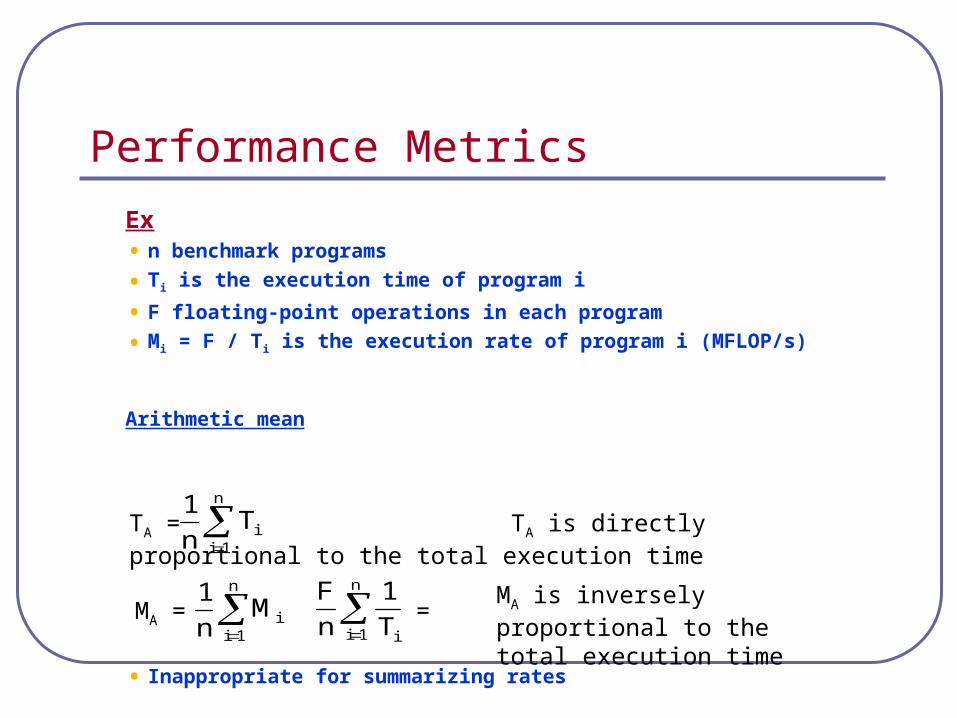
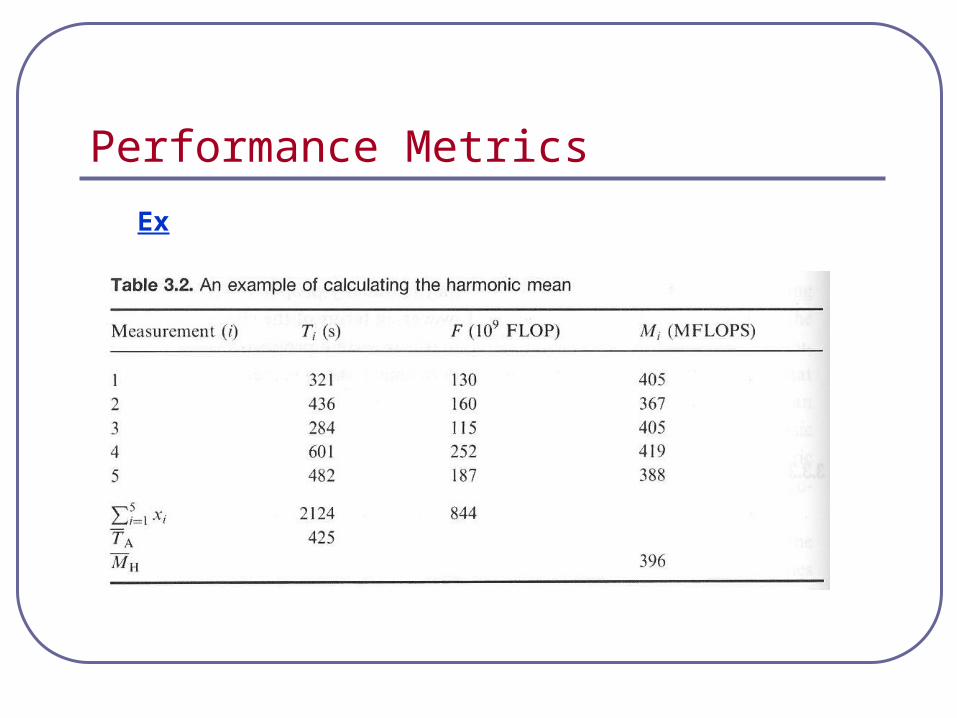
Ex• n benchmark programs
• Ti is the execution time of program i
• F floating-point operations in each program
• Mi = F / Ti is the execution rate of program i (MFLOP/s)
Arithmetic mean
• Inappropriate for summarizing rates
TA = TA is directly proportional to the total execution time
n
1iiT
n
1
MA = =
n
1iiM
n
1
n
1i iT
1
n
F MA is inversely proportional to the total execution time
Performance Metrics
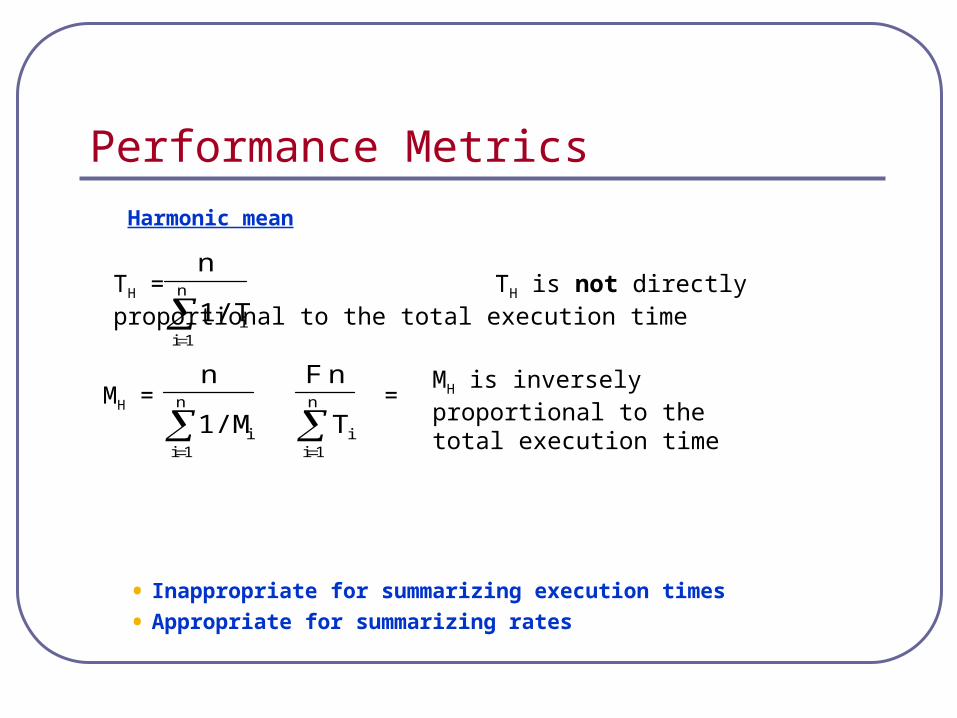
Harmonic mean
• Inappropriate for summarizing execution times
• Appropriate for summarizing rates
TH = TH is not directly proportional to the total execution time
n
1ii1/T
n
MH = =MH is inversely proportional to the total execution time
n
1ii1/M
n
n
1iiT
n F
Performance Metrics
Ex
Performance Metrics
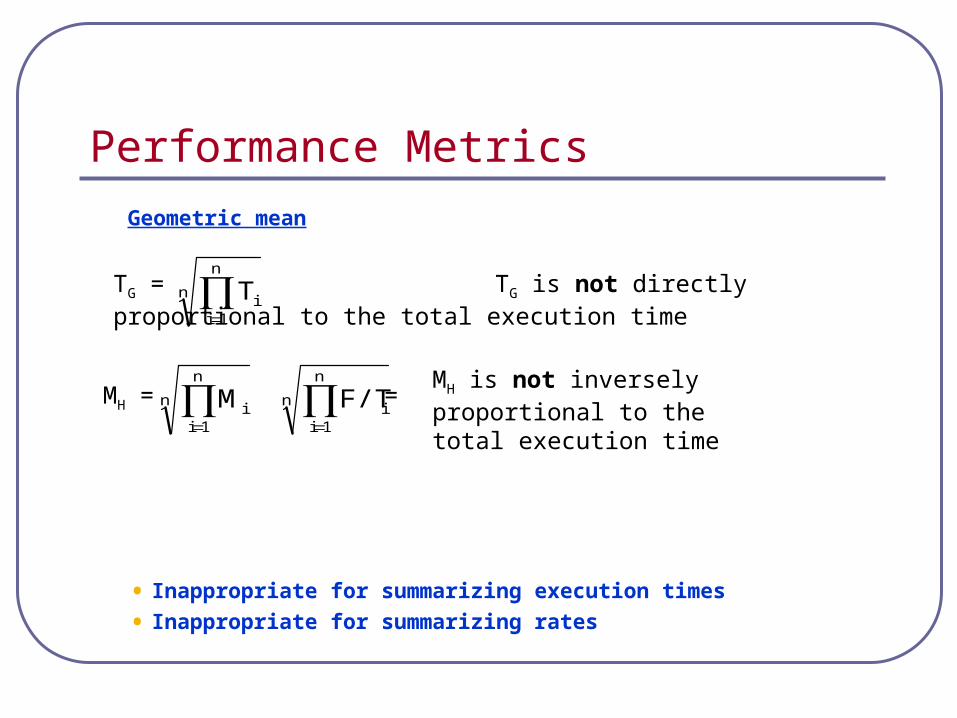
Geometric mean
• Inappropriate for summarizing execution times
• Inappropriate for summarizing rates
TG = TG is not directly proportional to the total execution time
MH = =MH is not inversely proportional to the total execution time
n
n
1iiT
n
n
1iiM
n
n
1iiF/T
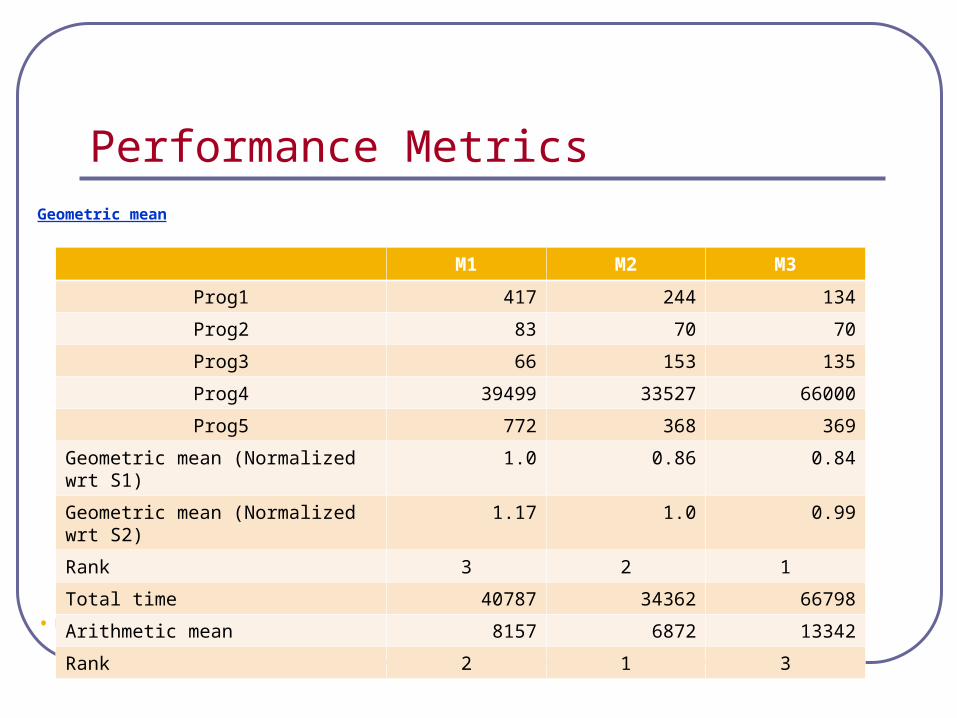
Performance MetricsGeometric mean
• Produces a consistent ordering of the systems but it is the wrong ordering
M1 M2 M3
Prog1 417 244 134
Prog2 83 70 70
Prog3 66 153 135
Prog4 39499 33527 66000
Prog5 772 368 369
Geometric mean (Normalized wrt S1) 1.0 0.86 0.84
Geometric mean (Normalized wrt S2) 1.17 1.0 0.99
Rank 3 2 1
Total time 40787 34362 66798
Arithmetic mean 8157 6872 13342
Rank 2 1 3
Performance Metrics
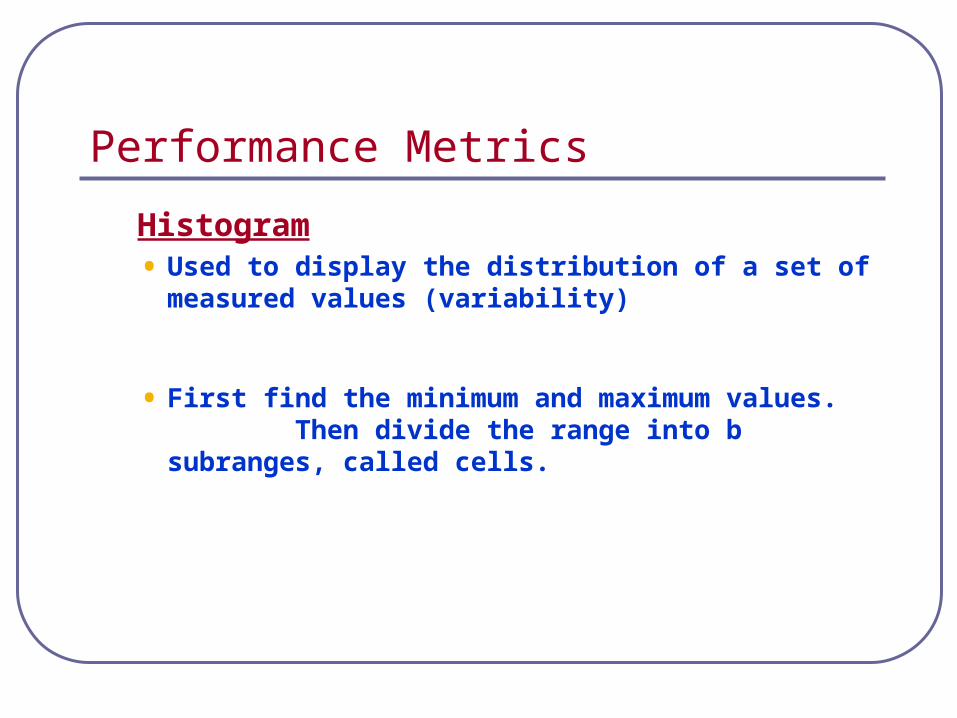
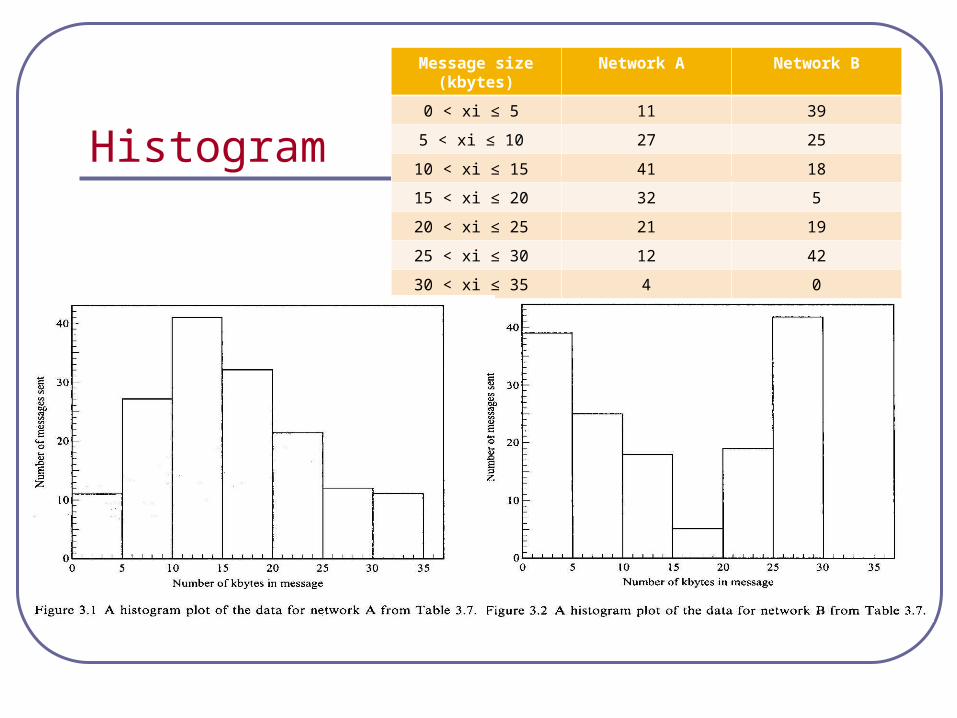
Histogram• Used to display the distribution of a set of measured
values (variability)
• First find the minimum and maximum values. Then divide the range into b subranges, called cells.
Histogram
Message size (kbytes)
Network A Network B
0 < xi ≤ 5 11 39
5 < xi ≤ 10 27 25
10 < xi ≤ 15 41 18
15 < xi ≤ 20 32 5
20 < xi ≤ 25 21 19
25 < xi ≤ 30 12 42
30 < xi ≤ 35 4 0
Performance Metrics
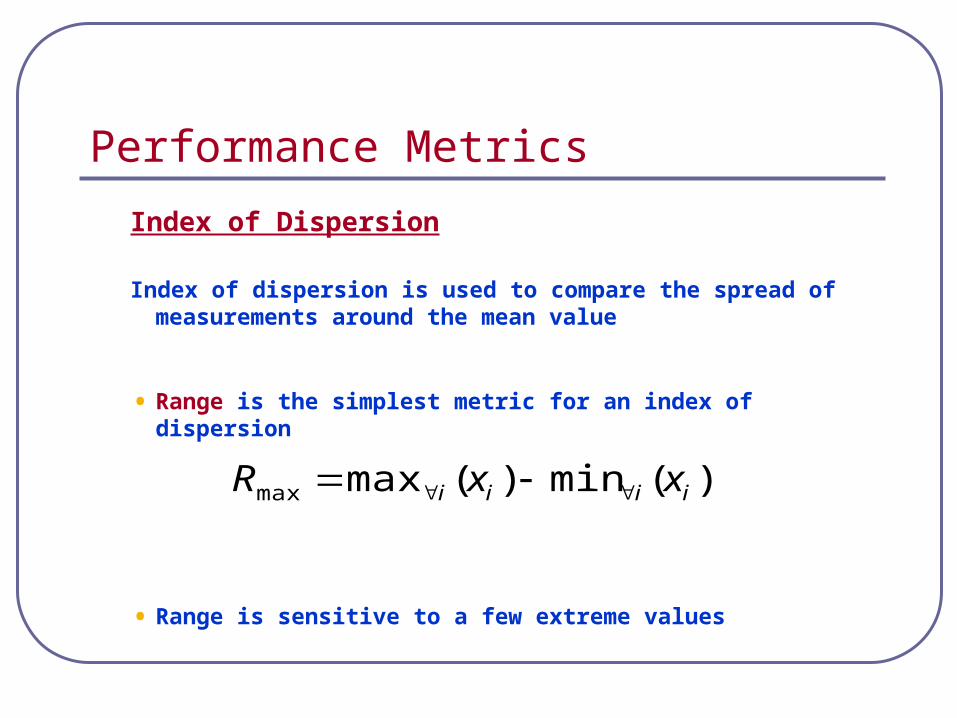
Index of Dispersion
Index of dispersion is used to compare the spread of measurements around the mean value
• Range is the simplest metric for an index of dispersion
• Range is sensitive to a few extreme values
)(min)(maxmax iiii xxR
Performance Metrics
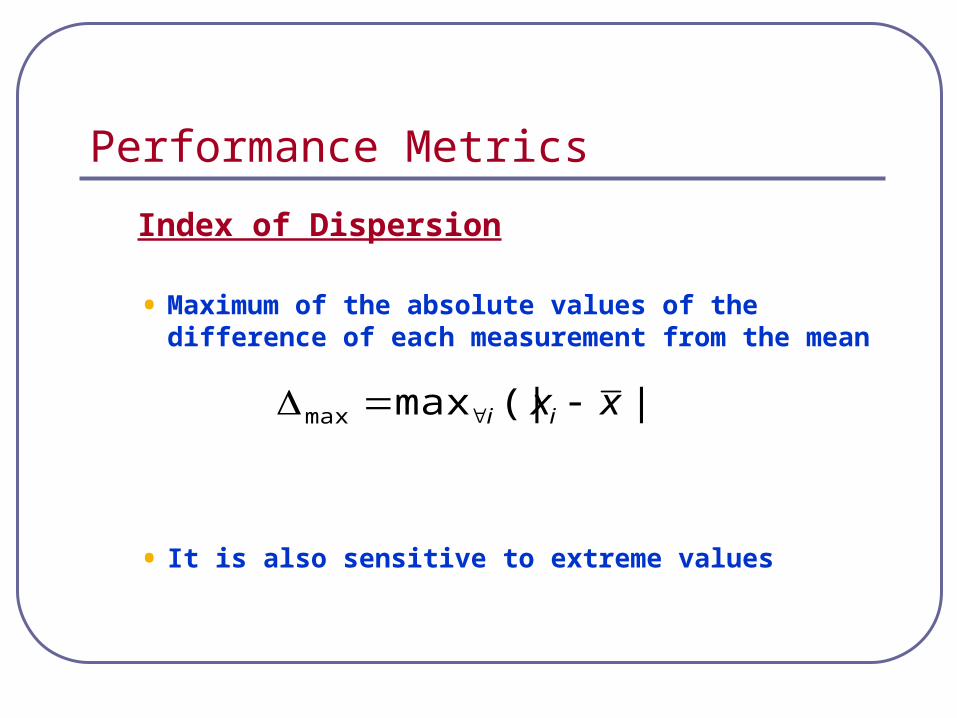
Index of Dispersion
• Maximum of the absolute values of the difference of each measurement from the mean
• It is also sensitive to extreme values
|)(|maxmax xxii
Performance Metrics
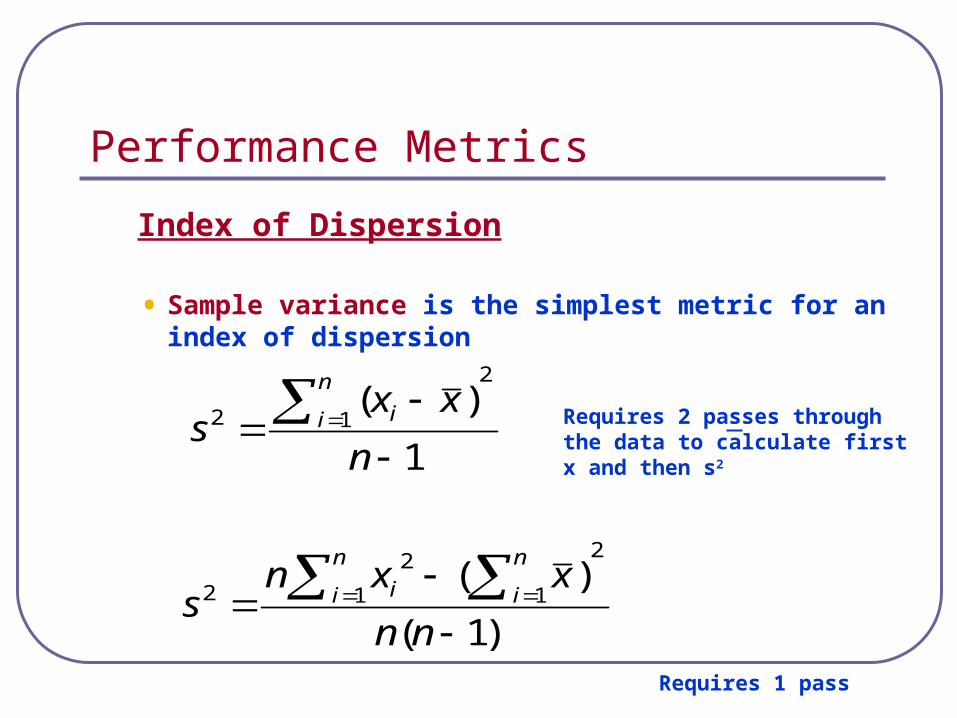
Index of Dispersion
• Sample variance is the simplest metric for an index of dispersion
)1(
)(2
1 1
2
2
nn
xxns
n
i
n
ii
Requires 2 passes through the data to calculate first x and then s2
Requires 1 pass
1
)(2
12
n
xxs
n
i i
Performance Metrics
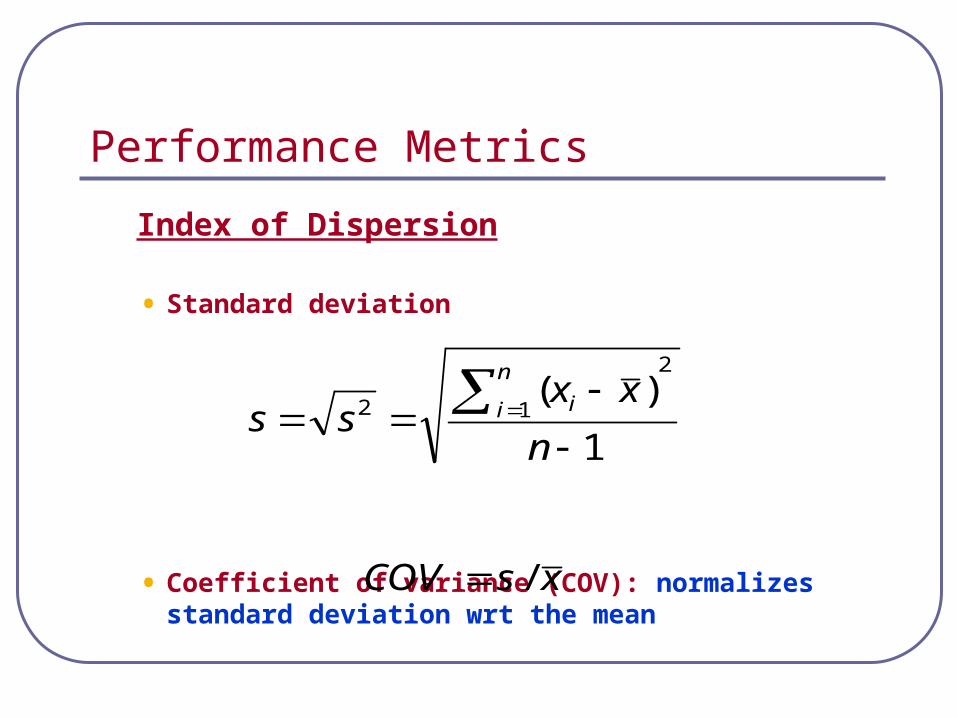
Index of Dispersion
• Standard deviation
• Coefficient of variance (COV): normalizes standard deviation wrt the mean
1
)(2
12
n
xxss
n
i i
xsCOV /