Embed Size (px)
Citation preview

Lecture 2: Measuring Income and Wealth
Se Yan Guanghua School of Management
Peking UniversitySpring 2013
1
National Income Accounting
• Why do we need that?– To measure aggregate economic activity
• Created by Simon Kuznets and Richard Stone
• Core concept: GDP and GNP
• The US started publishing GDP in 1947
2

GDP: Gross Domestic Product
The total market value of all final goods and services produced within a country in a given period of time.
3

Market Value
• GDP is a market value—goods and services are valued at their market prices.
• Non-market activities are not counted as part of GDP!– Household work– Underground economy; illegal economy
4

Final Goods and Services
• A final good (or service), is an item bought by its final user during a specified time period.
• A final good contrasts with an intermediate good, which is an item that is produced by one firm, bought by another firm, and used as a component of a final good or service.
• Excluding intermediate goods and services avoids double counting.
5
Produced within a country
• GDP measures production within a country—domestic production.
• Difference between GDP and GNP– Chinese workers tapping oil in Darfur– Oversea students make money by tutoring
Chinese students English
6
In a given period of time
• GDP measures the value of production that takes place within a specific interval of time, usually a year or a quarter (three months).
• Antiques, used products
• Inventories
7

China’s GDP
8
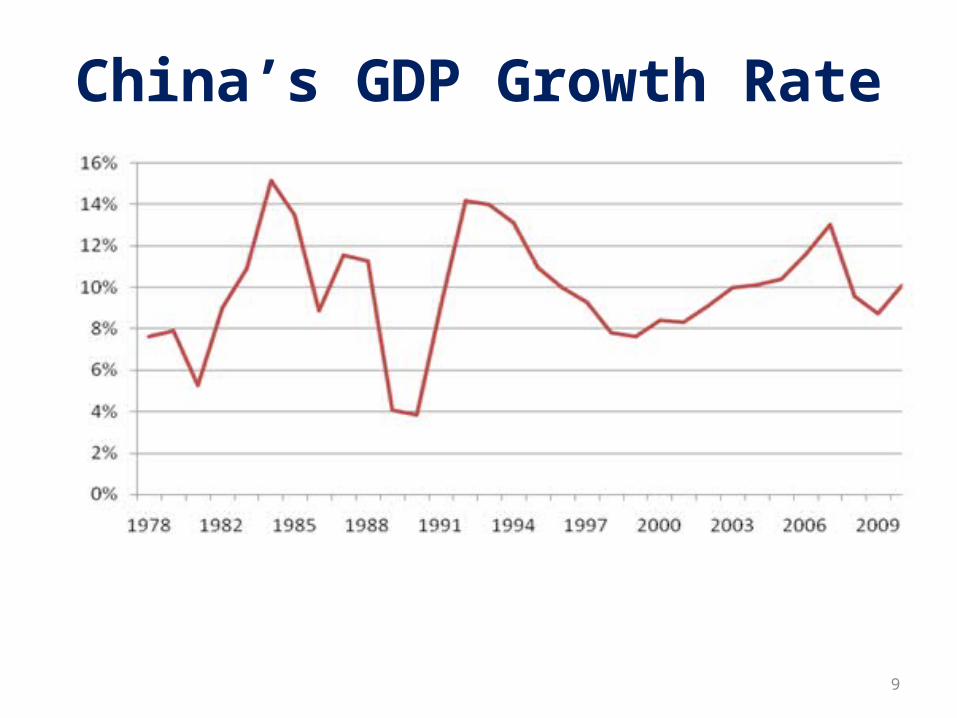
China’s GDP Growth Rate
9

China’s GDP per capita
10

23/4/19 11

Discussions
• How will GDP change if a laid-off worker who lived on government subsidy gets employed?
• What if you marry your tutor and she continues to tutor you after marriage?
12

GDP and the Circular Flow of Expenditure and Income
• GDP measures the value of production, which also equals total expenditure on final goods and total income earned by all factors of production.
• The circular flow diagram illustrates the equality of income, expenditure, and the value of production.
13

The circular flow diagram shows the transactions among households, firms, governments, and the rest of the world
14

These transactions take place in factor markets, goods markets, and financial markets.
15
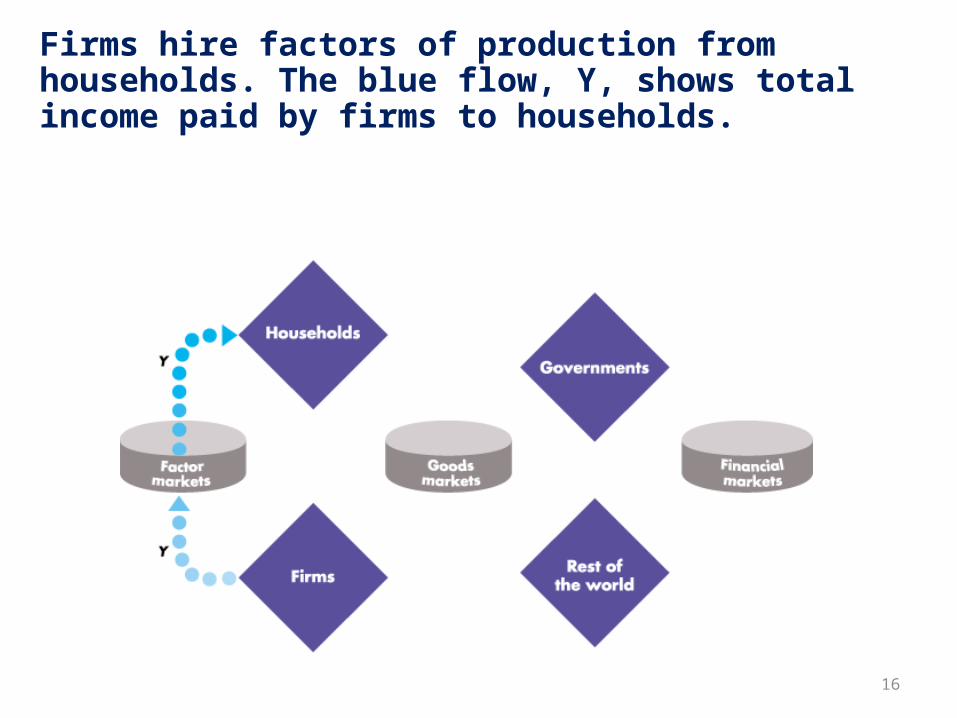
Firms hire factors of production from households. The blue flow, Y, shows total income paid by firms to households.
16
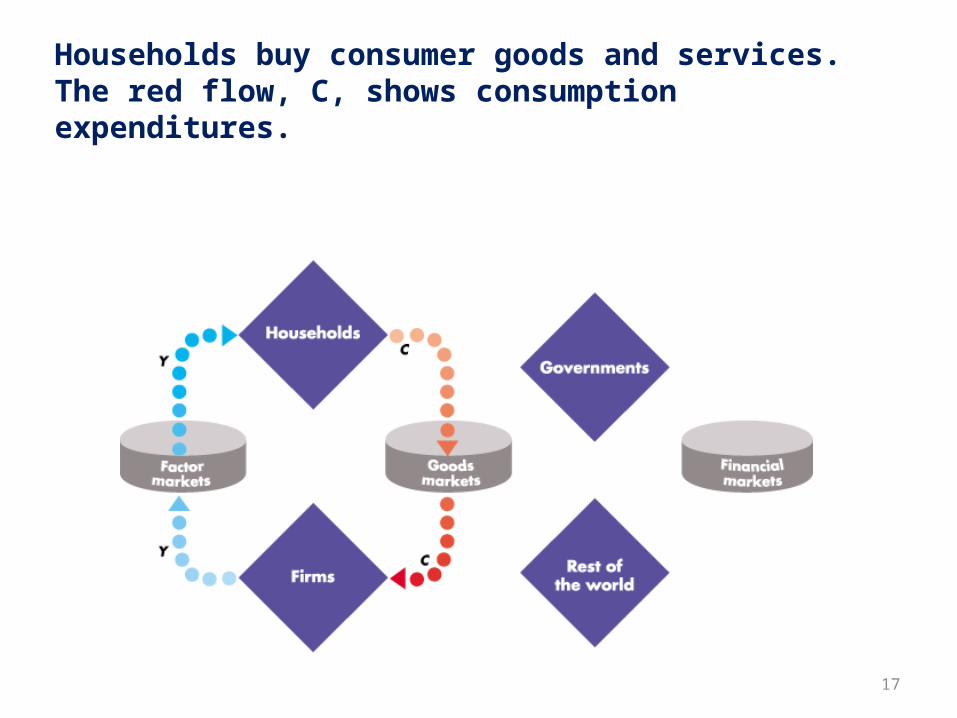
Households buy consumer goods and services. The red flow, C, shows consumption expenditures.
17
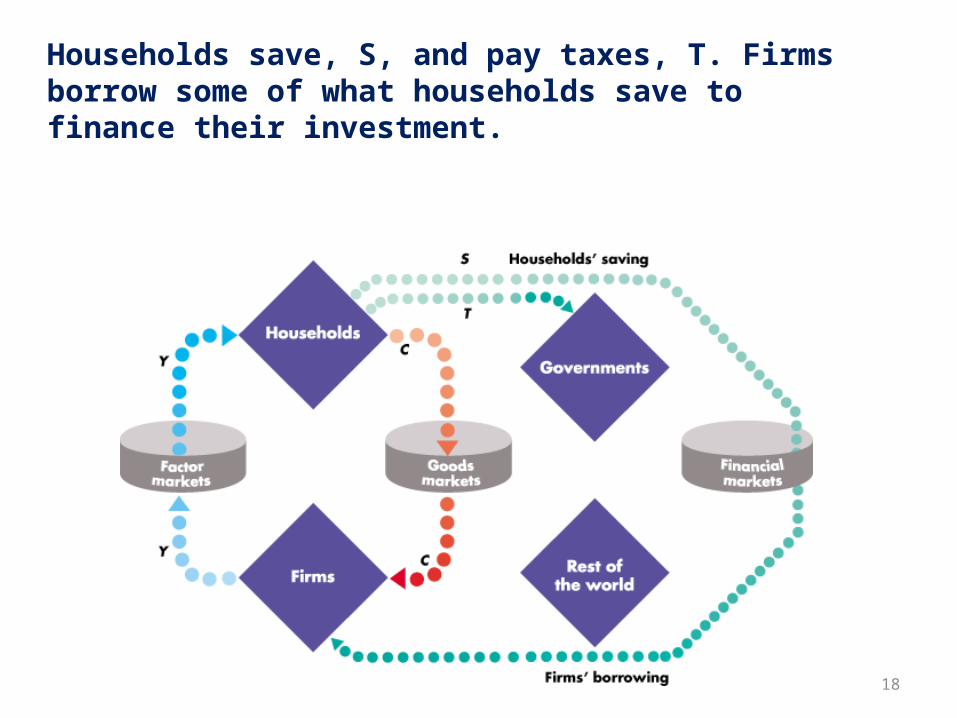
Households save, S, and pay taxes, T. Firms borrow some of what households save to finance their investment.
18

Firms buy capital goods from other firms. The red flow I represents this investment expenditure by firms.
19
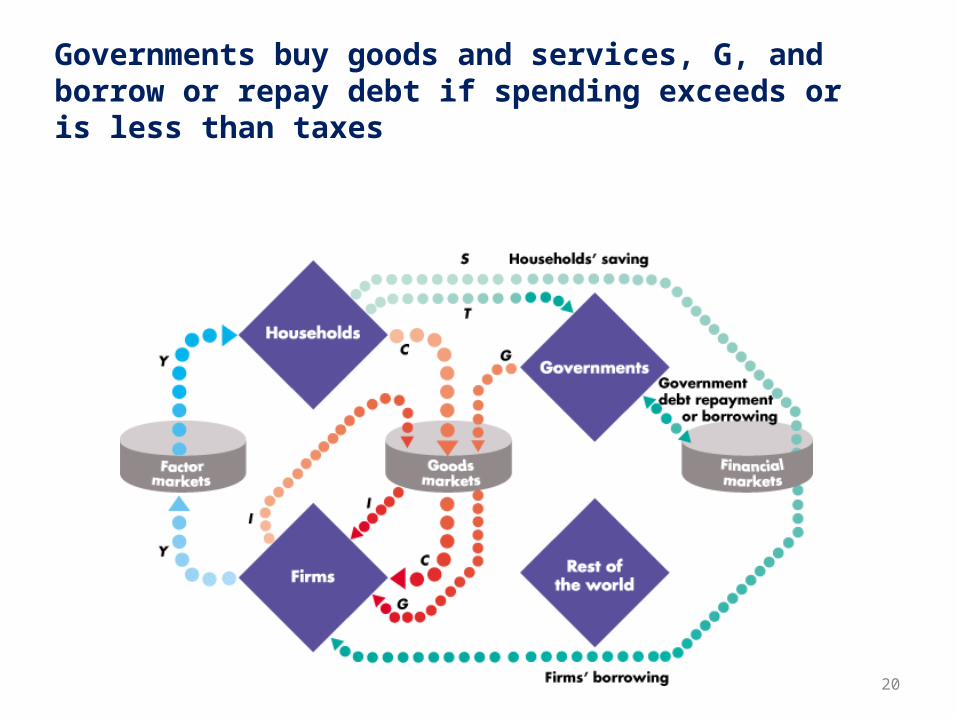
Governments buy goods and services, G, and borrow or repay debt if spending exceeds or is less than taxes
20

The rest of the world buys goods and services from us, X and sells us goods and services, M; net exports are X - M
21
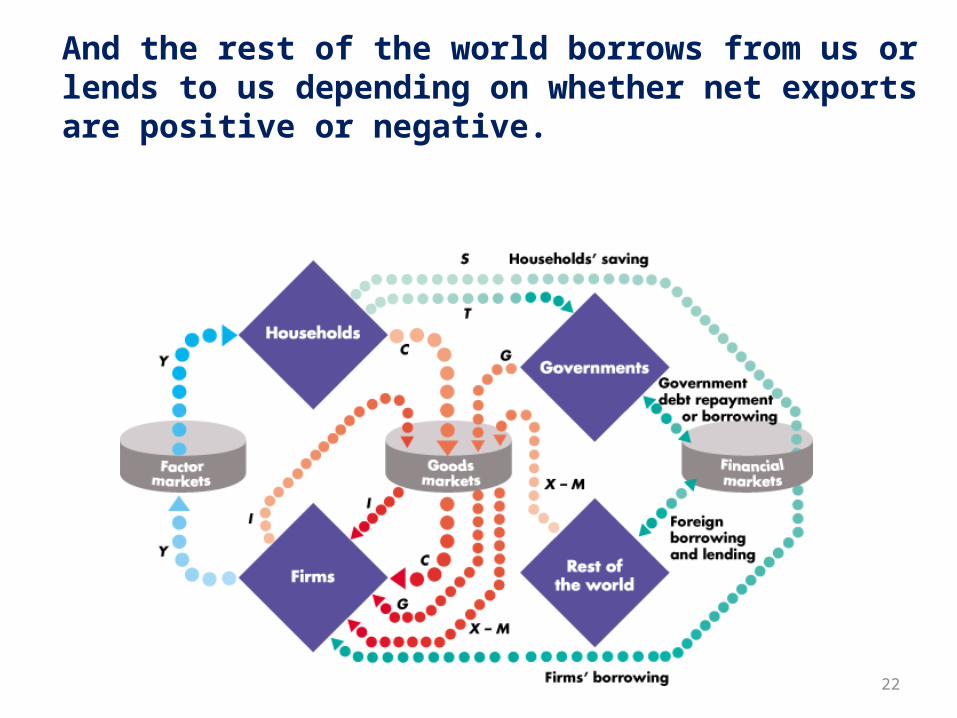
And the rest of the world borrows from us or lends to us depending on whether net exports are positive or negative.
22
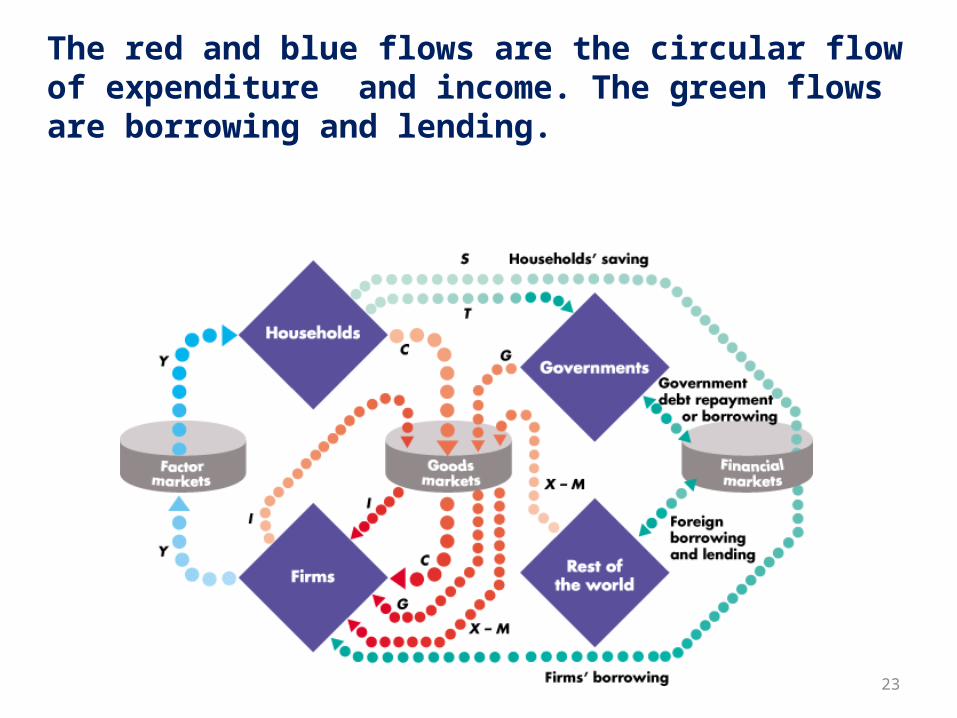
The red and blue flows are the circular flow of expenditure and income. The green flows are borrowing and lending.
23

The sum of the red flows equals the blue flow.
24
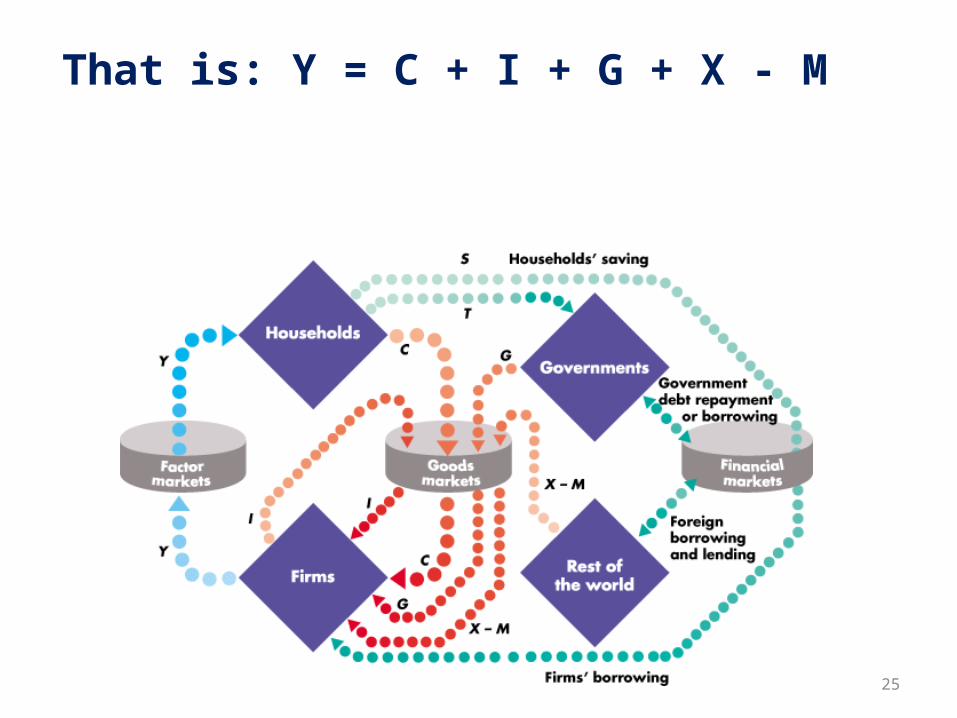
That is: Y = C + I + G + X - M
25
Aggregate expenditure
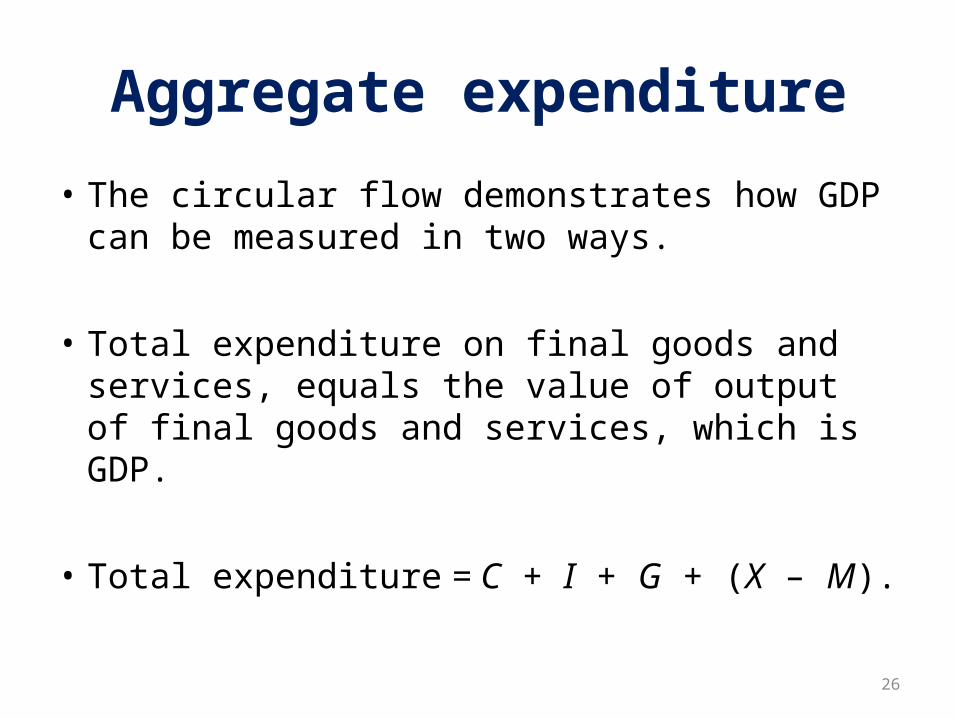
• The circular flow demonstrates how GDP can be measured in two ways.
• Total expenditure on final goods and services, equals the value of output of final goods and services, which is GDP.
• Total expenditure = C + I + G + (X – M).
26
Aggregate Income
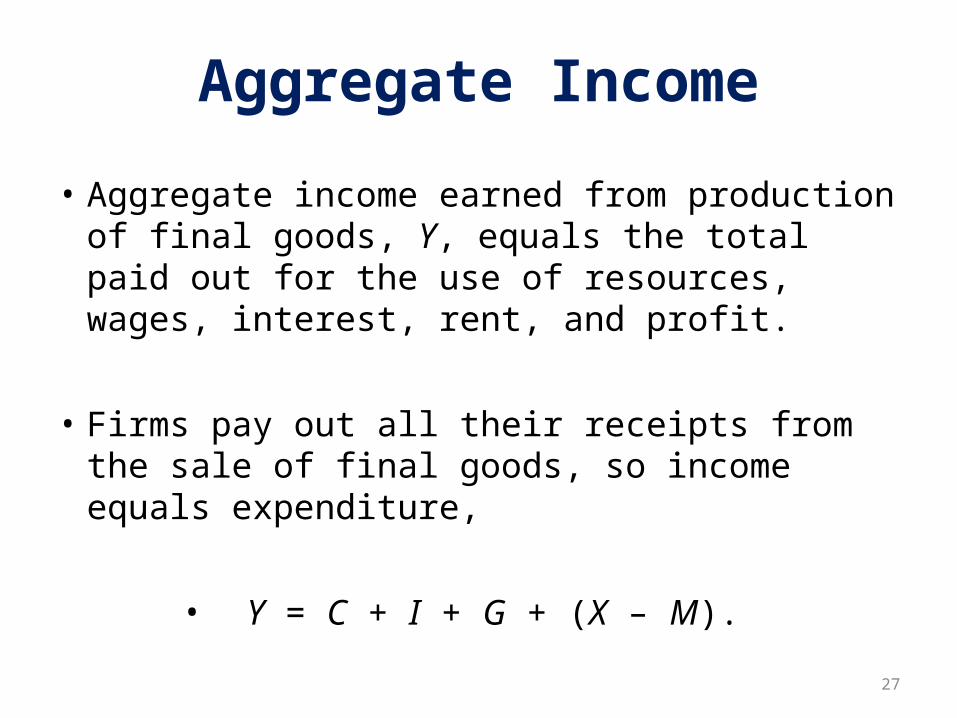
• Aggregate income earned from production of final goods, Y, equals the total paid out for the use of resources, wages, interest, rent, and profit.
• Firms pay out all their receipts from the sale of final goods, so income equals expenditure,
• Y = C + I + G + (X – M).27
Financial Flow
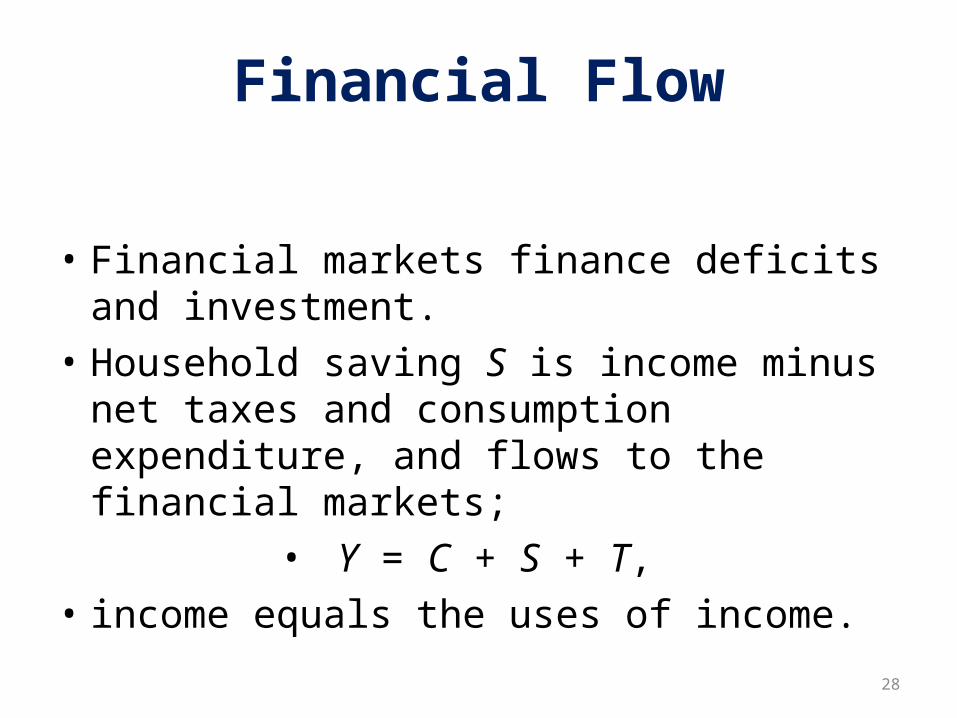
• Financial markets finance deficits and investment.
• Household saving S is income minus net taxes and consumption expenditure, and flows to the financial markets;
• Y = C + S + T,• income equals the uses of income.
28

How is investment financed?
Investment is financed from three sources:
Private saving, S Government budget surplus, (T – G) Borrowing from the rest of the world (M – X).
29
Investment and Saving
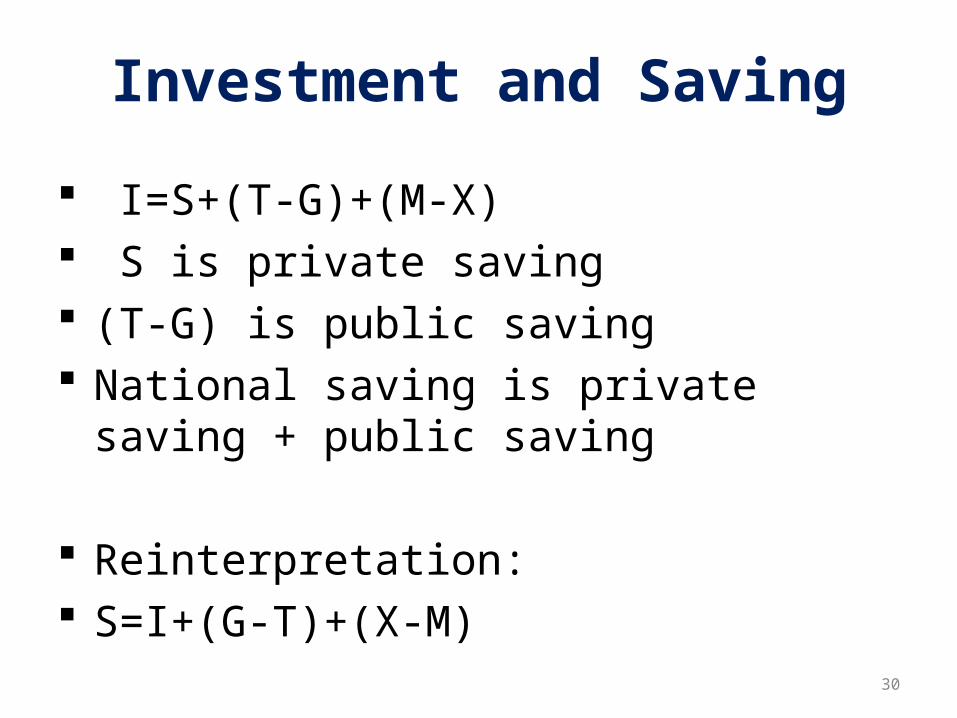
I=S+(T-G)+(M-X) S is private saving (T-G) is public saving National saving is private saving + public
saving
Reinterpretation: S=I+(G-T)+(X-M)
30
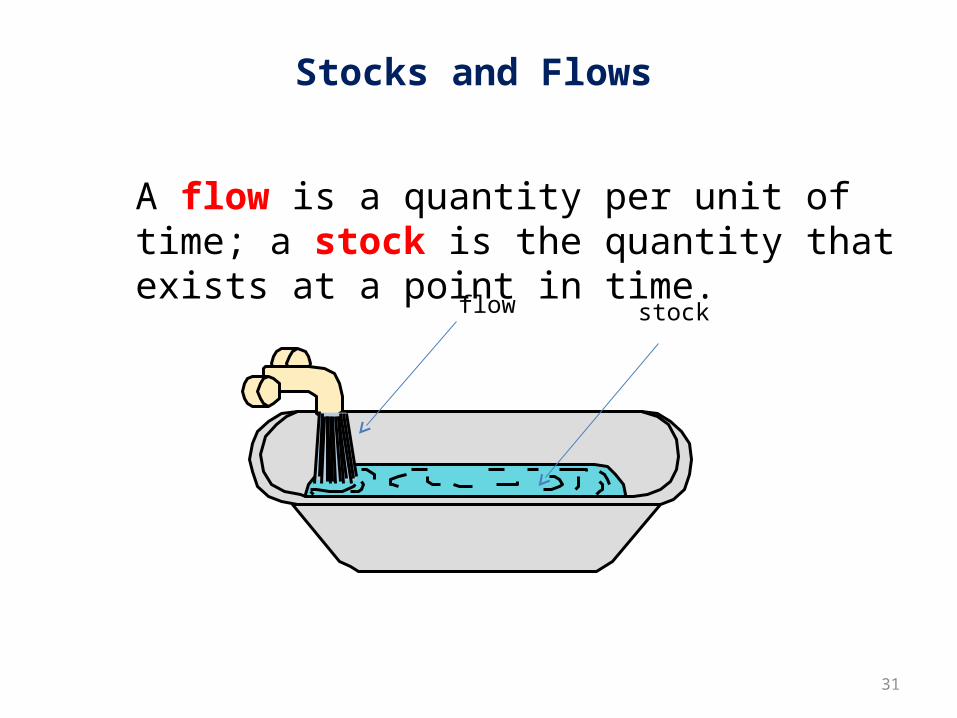
Stocks and Flows
A flow is a quantity per unit of time; a stock is the quantity that exists at a point in time.
31
flow stock
GDP accounting: value added method
GDP is the market value of all final goods produced within a certain interval
Which also equals values added in every step of production
32
GDP accounting: expenditure method
• Y = C + I + G + (X – M).
33
Consumption
The spending by households on goods and services, with the exception of purchases of new housing.
34
Investment
The spending on capital equipment, inventories, and structures, including new housing.
35
Government Expenditure
• The spending on goods and services by local, state, and federal governments.
Does not include transfer payments because they are not made in exchange for currently produced goods or services.
36

China’s GDP components in 2007
37
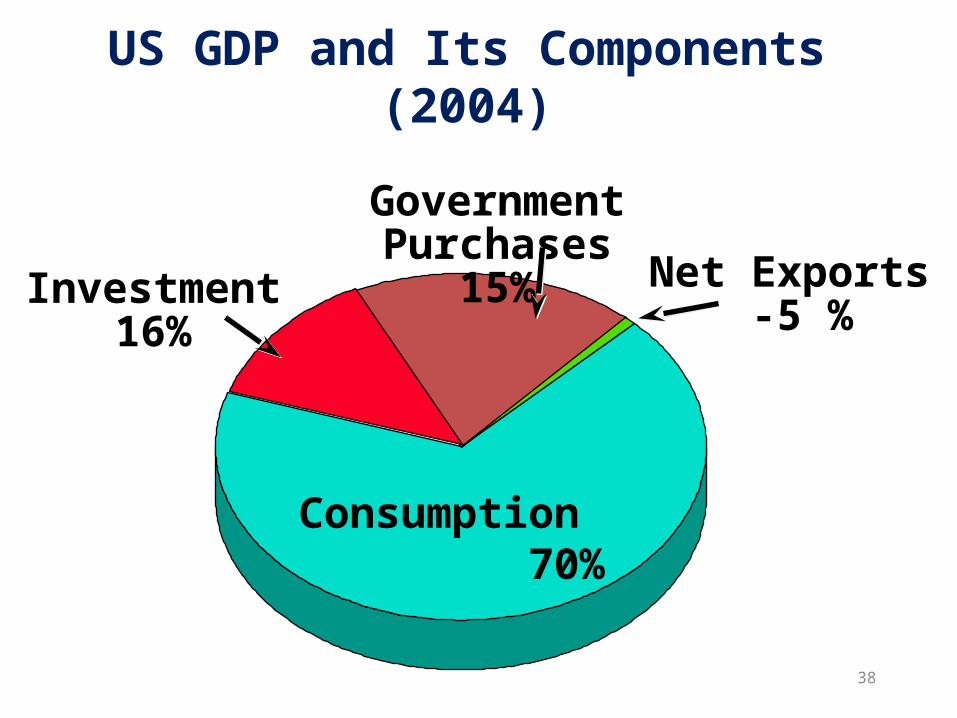
US GDP and Its Components (2004)
38
Consumption 70%
Government Purchases
15% Net Exports -5 %
Investment16%
39
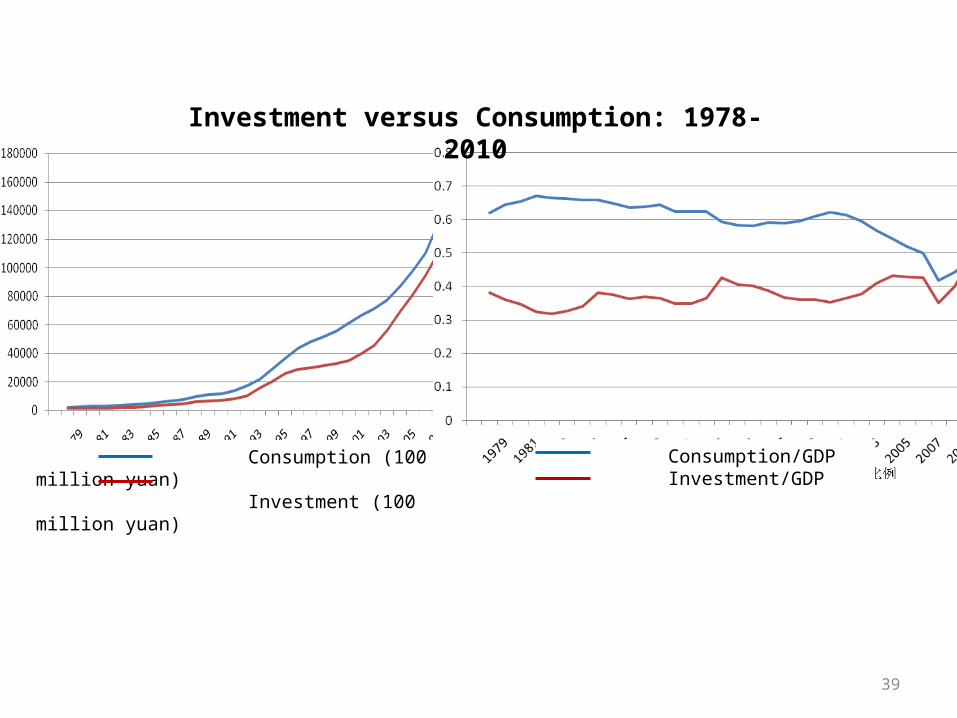
Consumption (100 million yuan) Investment (100 million yuan)
Consumption/GDP Investment/GDP
Investment versus Consumption: 1978-2010
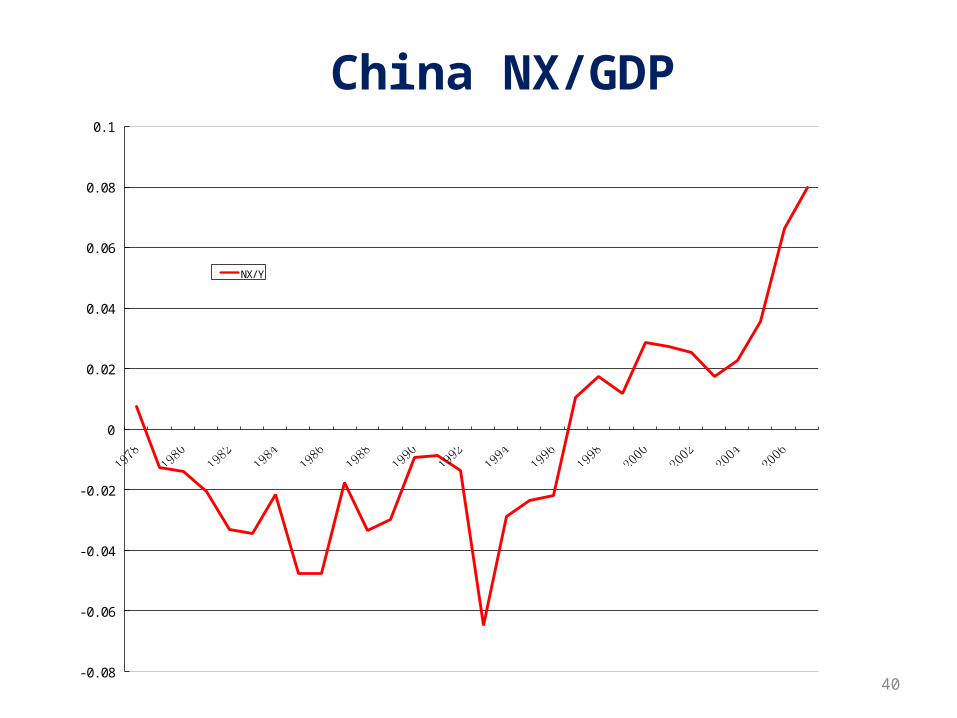
China NX/GDP
40
23/4/19
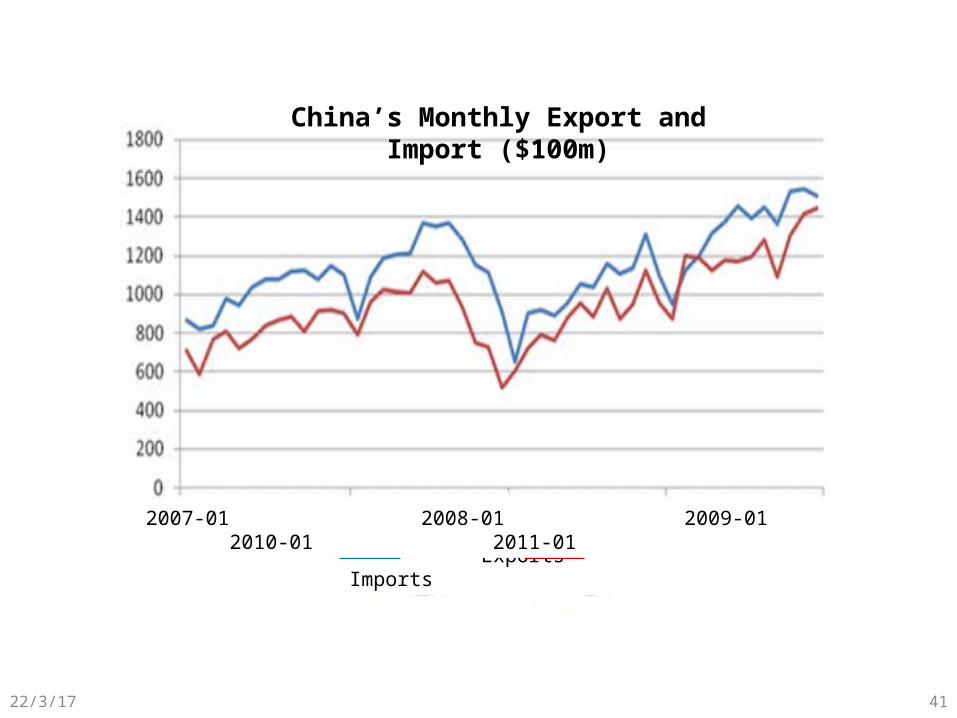
China’s Monthly Export and Import ($100m)
Exports Imports
2007-01 2008-01 2009-01 2010-01 2011-01
41

US NX/GDP
42
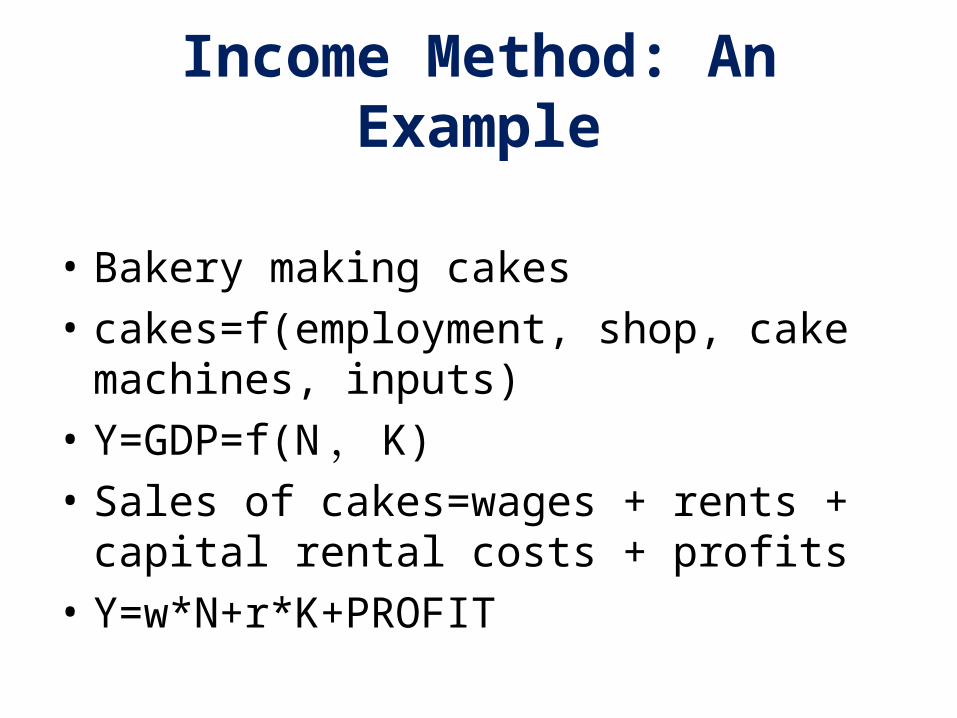
Income Method: An Example
• Bakery making cakes• cakes=f(employment, shop, cake machines,
inputs)• Y=GDP=f(N , K)• Sales of cakes=wages + rents + capital rental
costs + profits• Y=w*N+r*K+PROFIT

Depreciation– Capital, the plant, equipment, and inventories of raw
and semi-finished materials that are used to produce other goods and services is a stock.
– Investment is the flow that changes the stock of capital.
– Depreciation is the decrease in the capital stock that results from wear and tear, and obsolescence.
– Capital consumption is another name for depreciation.
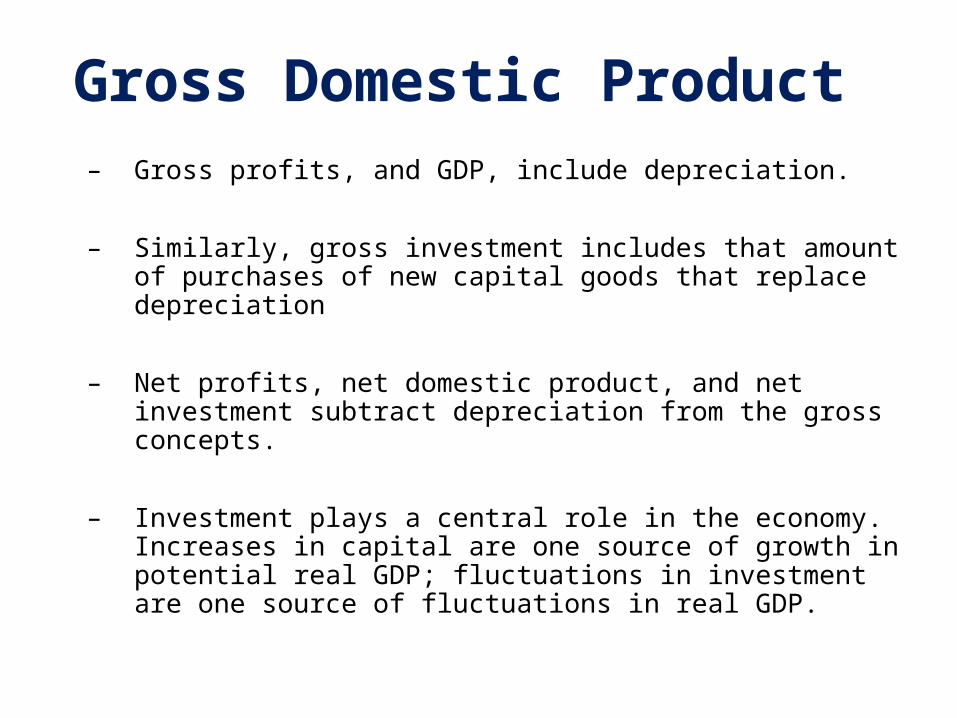
Gross Domestic Product – Gross profits, and GDP, include depreciation.
– Similarly, gross investment includes that amount of purchases of new capital goods that replace depreciation
– Net profits, net domestic product, and net investment subtract depreciation from the gross concepts.
– Investment plays a central role in the economy. Increases in capital are one source of growth in potential real GDP; fluctuations in investment are one source of fluctuations in real GDP.

Decomposition of GNP using Income Method
– GNP – depreciation = NNP
– NNP – statistical discrepancy = National Income
– National Income – indirect business taxes - corporate profits – net interests + dividends + government transfers + personal interest income = Personal Income
– Personal Income – Personal Taxes = Disposable Personal Income

23/4/19
Urban Rural
Urban and Rural Per Capita Disposable Income: 1978-2010 (in Yuan)
47

National Income
The National Income and Product Accounts divide incomes into five categories Compensation of employees Net interest Rental income Corporate profits. Proprietors’ income.
48
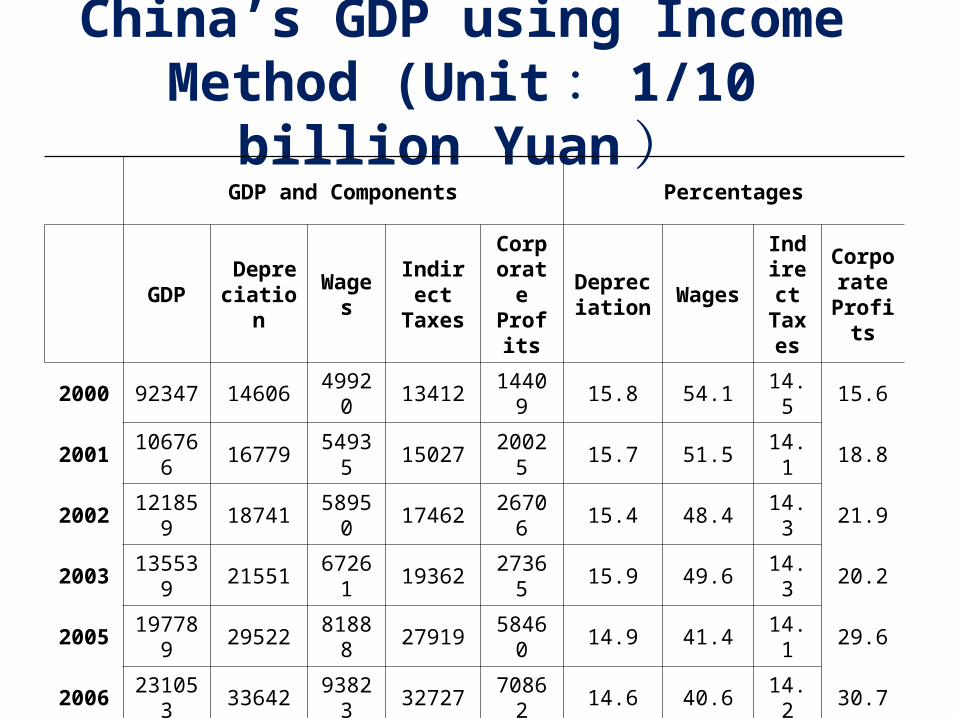
China’s GDP using Income Method (Unit : 1/10 billion Yuan)
GDP and Components Percentages
GDPDepreciation
Wages
Indirect Taxes
Corporate
Profits
Depreciation
Wages
Indirect
Taxes
Corporate
Profits
2000 92347 14606 49920 13412 14409 15.8 54.1 14.5 15.6
2001 106766 16779 54935 15027 20025 15.7 51.5 14.1 18.8
2002 121859 18741 58950 17462 26706 15.4 48.4 14.3 21.9
2003 135539 21551 67261 19362 27365 15.9 49.6 14.3 20.2
2005 197789 29522 81888 27919 58460 14.9 41.4 14.1 29.6
2006 231053 33642 93823 32727 70862 14.6 40.6 14.2 30.7
Debates about China GDP Figure
• Overestimated?– Electricity produced
• Underestimated?– Service sector
50

GDP and Economic Well-Being
• GDP is the best single measure of the economic well-being of a society.
• GDP per person tells us the income and expenditure of the average person in the economy.
• Higher GDP per person indicates a higher standard of living.
• GDP is not a perfect measure of the happiness or quality of life, however.
51

Some things that contribute to well-being are not included in GDP.
• Non-market economic activities, such as family labor
• Grey economy• Leisure• Environment• Quality improvement of commodities
52
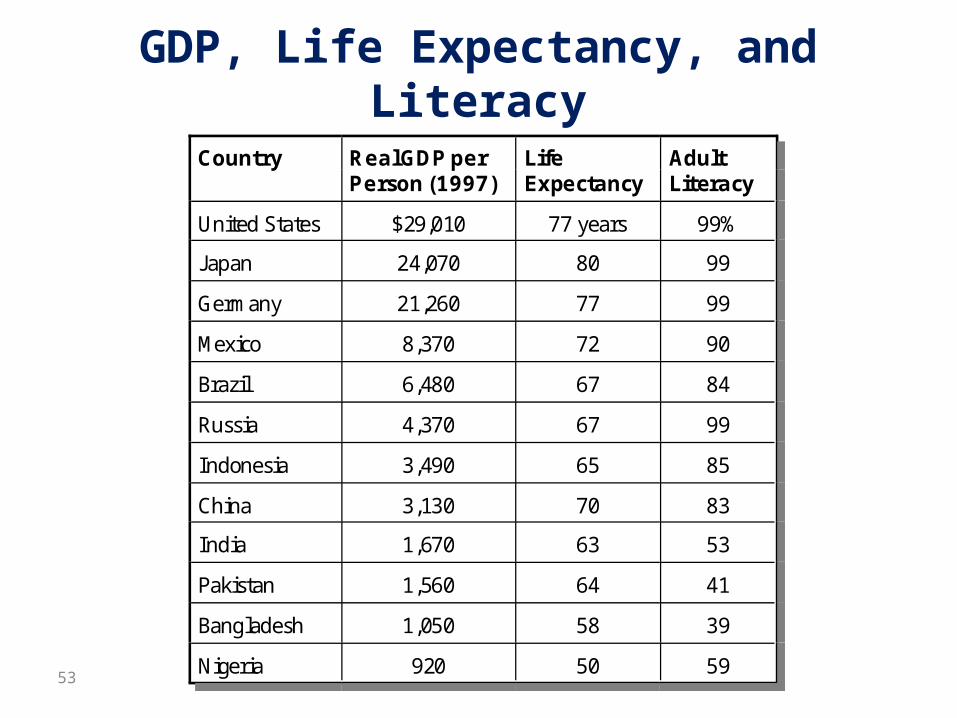
GDP, Life Expectancy, and Literacy
53

HDI instead of GDP?
• Human Development Indicator, HDI– Life expectancy, education, etc.
• But GDP per capita and HDI are highly correlated
– China’s ranking• HDI: No. 104• GDP: No. 102
54

GDP per capita and HDI (2004)
55
International Comparisons
Real GDP is used to compare economic welfare in one country with that in another.
Real GDP of one country must be converted into the same currency units as the real GDP of the other country, so an exchange rate must be used.
The same prices should be used to value the goods and services in the countries being compared, but often are not.
56
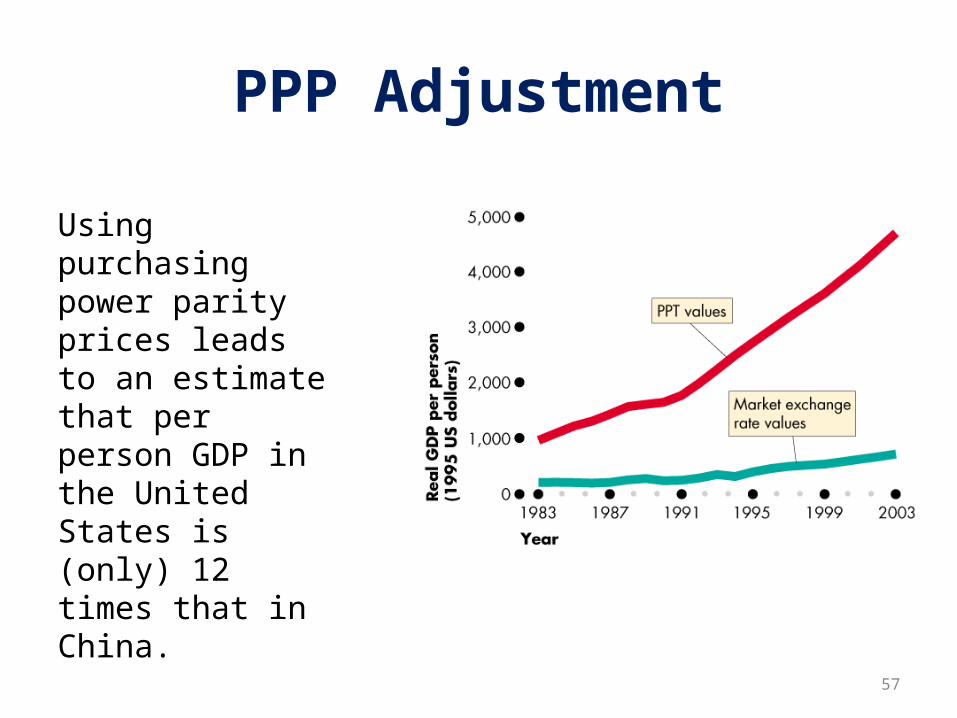
PPP Adjustment
Using purchasing power parity prices leads to an estimate that per person GDP in the United States is (only) 12 times that in China.
57

Real versus Nominal GDP
• Nominal GDP values the production of goods and services at current prices.
• Real GDP values the production of goods and services at constant prices.
• An accurate view of the economy requires adjusting nominal to real GDP with changes the in price level
58

跨期的生活水平比较:真实 GDP

Real GDP and the Price Level
–The table provides data for 2002 and 2003.–In 2002, nominal GDP is:–Expenditure on balls $100–Expenditure on bats $100–Nominal GDP $200
Item Quantity Price
2002
Balls 100 $1.00
Bats 20 $5.00
2003
Balls 160 $0.50
Bats 22 $22.50
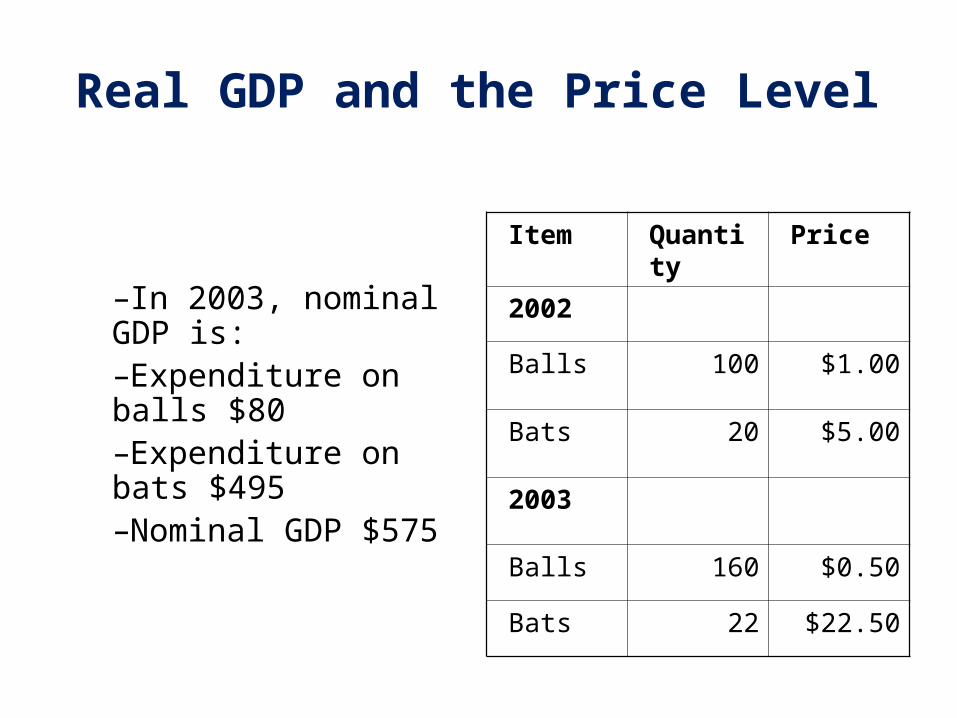
Real GDP and the Price Level
–In 2003, nominal GDP is:–Expenditure on balls $80–Expenditure on bats $495–Nominal GDP $575
Item Quantity Price
2002
Balls 100 $1.00
Bats 20 $5.00
2003
Balls 160 $0.50
Bats 22 $22.50
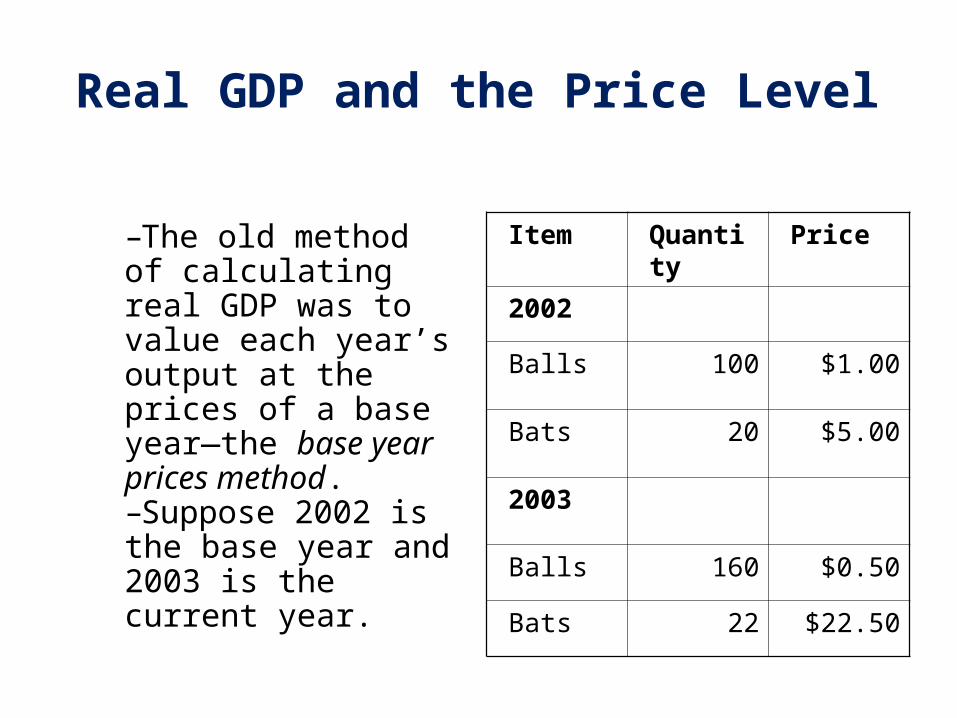
Real GDP and the Price Level
–The old method of calculating real GDP was to value each year’s output at the prices of a base year—the base year prices method.–Suppose 2002 is the base year and 2003 is the current year.
Item Quantity Price
2002
Balls 100 $1.00
Bats 20 $5.00
2003
Balls 160 $0.50
Bats 22 $22.50

Real GDP and the Price Level
–Expenditure on balls in 2003 valued at 2002 prices is $160.–Expenditure on bats in 2003 valued at 2002 prices is $110.–Real GDP in 2003 (base-year prices method) is $270.
Item Quantity Price
2002
Balls 100 $1.00
Bats 20 $5.00
2003
Balls 160 $0.50
Bats 22 $22.50

Real GDP and the Price Level
–The new method of calculating real GDP, which is called the chain-weighted output index method, uses the prices of two adjacent years to calculate the real GDP growth rate.–This calculation has four steps described on the next slide.

Real GDP and the Price Level
–Step 1: Value last year’s production and this year’s production at last year’s prices and then calculate the growth rate of this number from last year to this year.–Step 2: Value last year’s production and this year’s production at this year’s prices and then calculate the growth rate of this number from last year to this year.–Step 3: Calculate the average of the two growth rates. This average growth rate is the growth rate of real GDP from last year to this year.–Step 4: Repeat steps 1, 2, and 3 for each pair of adjacent years to link real GDP back to the base year’s prices.

Real GDP and the Price Level
–We’ve done step 1. –2002 production at 2002 prices (GDP in 2002) is $200. –2003 production at 2002 prices is $270.–The 2003 growth rate in 2002 prices is 35 percent.
Item Quantity Price
2002
Balls 100 $1.00
Bats 20 $5.00
2003
Balls 160 $0.50
Bats 22 $22.50
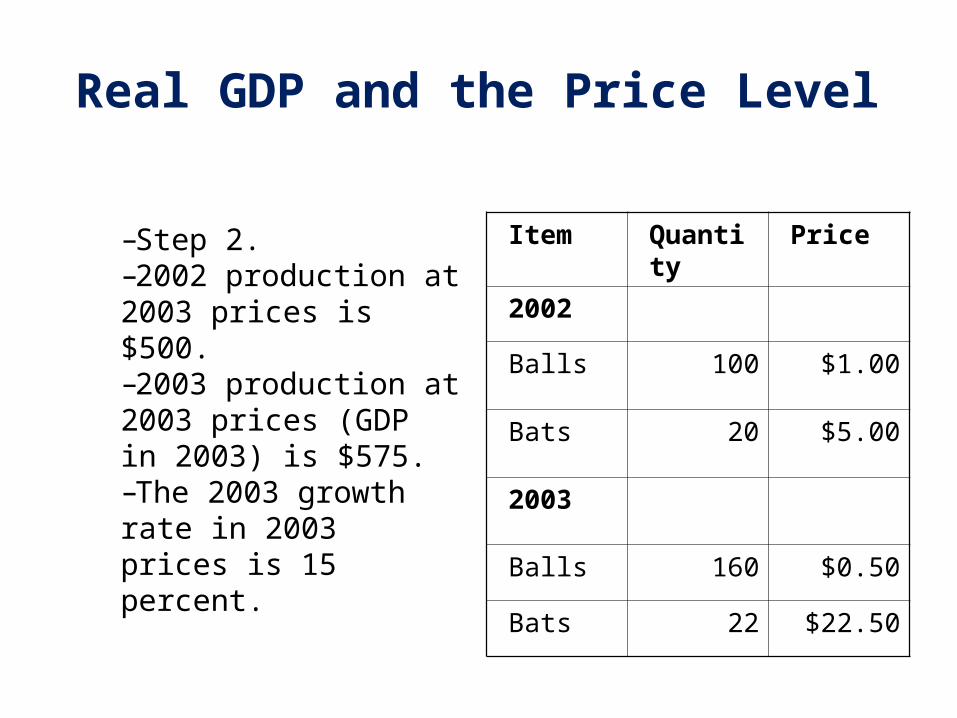
Real GDP and the Price Level
–Step 2. –2002 production at 2003 prices is $500. –2003 production at 2003 prices (GDP in 2003) is $575.–The 2003 growth rate in 2003 prices is 15 percent.
Item Quantity Price
2002
Balls 100 $1.00
Bats 20 $5.00
2003
Balls 160 $0.50
Bats 22 $22.50

Real GDP and the Price Level
–Step 3. –The 2003 growth rate in 2002 prices is 35 percent. –The 2003 growth rate in 2003 prices is 15 percent.–The average of these two growth rates is 25 percent.–Real GDP in 2003 with 2002 as the base year is $250.
Item Quantity Price
2002
Balls 100 $1.00
Bats 20 $5.00
2003
Balls 160 $0.50
Bats 22 $22.50

Real GDP and the Price Level
–Step 4. –Because we’re calculating real GDP in 2003 at 2002 prices, step 4 is completed!–Real GDP in 2002 is $200–Real GDP in 2003 is $250
Item Quantity Price
2002
Balls 100 $1.00
Bats 20 $5.00
2003
Balls 160 $0.50
Bats 22 $22.50

Real GDP and the Price Level
•Calculating the Price Level–The average level of prices is called the price level. –One measure of the price level is the GDP deflator, which is an average of the prices of the goods in GDP in the current year expressed as a percentage of the base year prices.
Calculating the Price Level
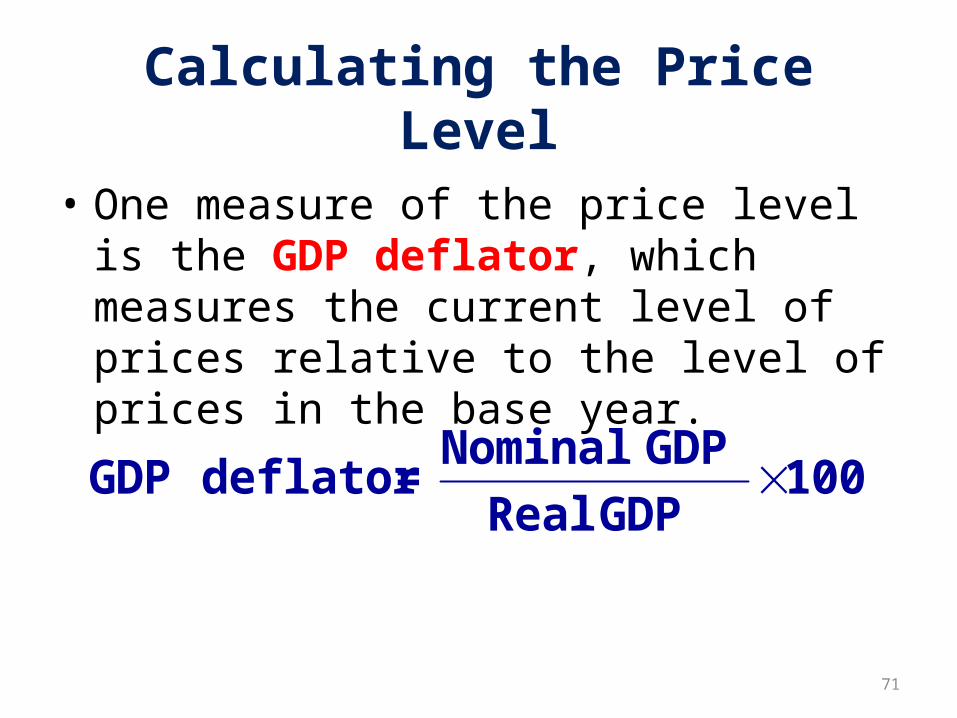
• One measure of the price level is the GDP deflator, which measures the current level of prices relative to the level of prices in the base year.
71

Real GDP and the Price Level–Nominal GDP and real GDP are calculated in the way that you’ve just seen.–GDP Deflator = (Nominal GDP/Real GDP) 100.–In 2002, the GDP deflator is ($200/$200) 100 = 100.–In 2003, the GDP deflator is ($575/$250) 100 = 230.
Year Nominal GDP
Real GDP
GDP deflator
2002 $200 $200 100
2003 $575 $250 230
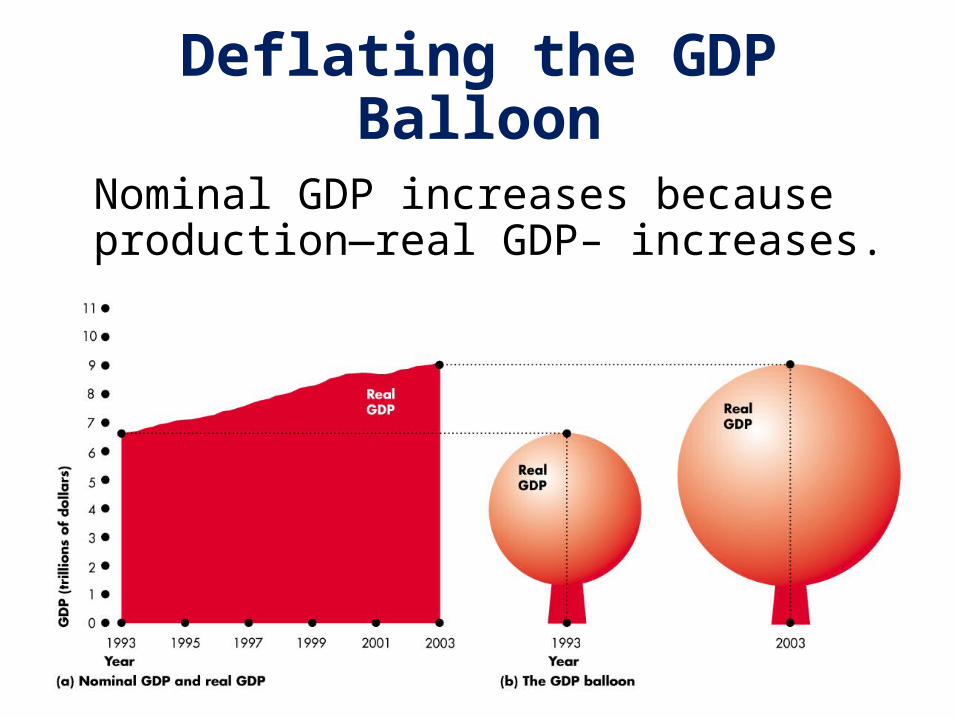
Deflating the GDP Balloon
Nominal GDP increases because production—real GDP– increases.
73
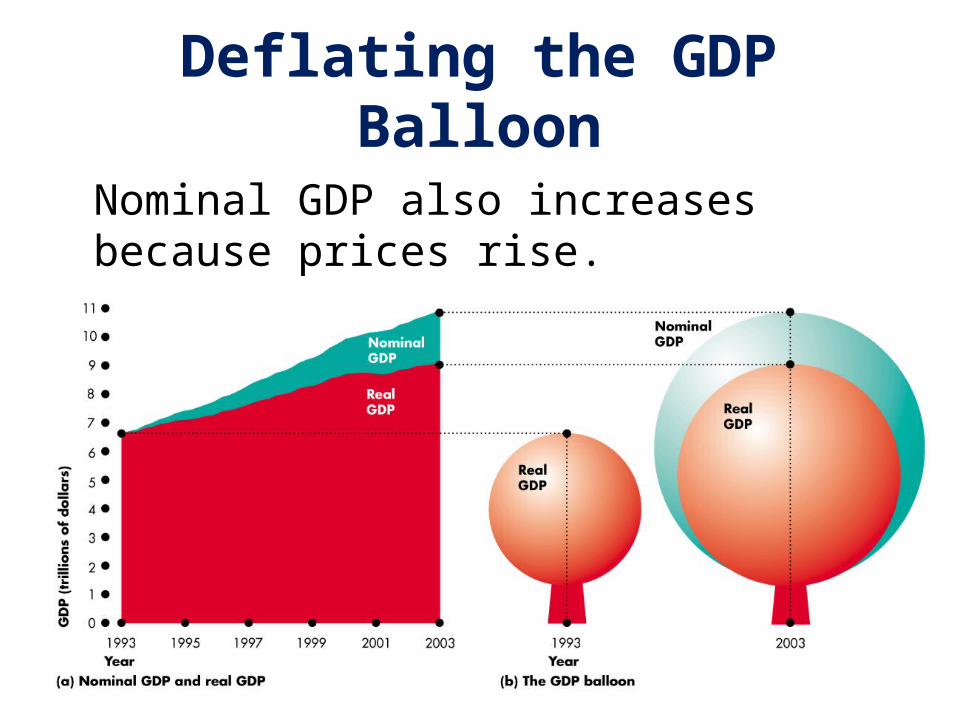
Deflating the GDP Balloon
Nominal GDP also increases because prices rise.
74
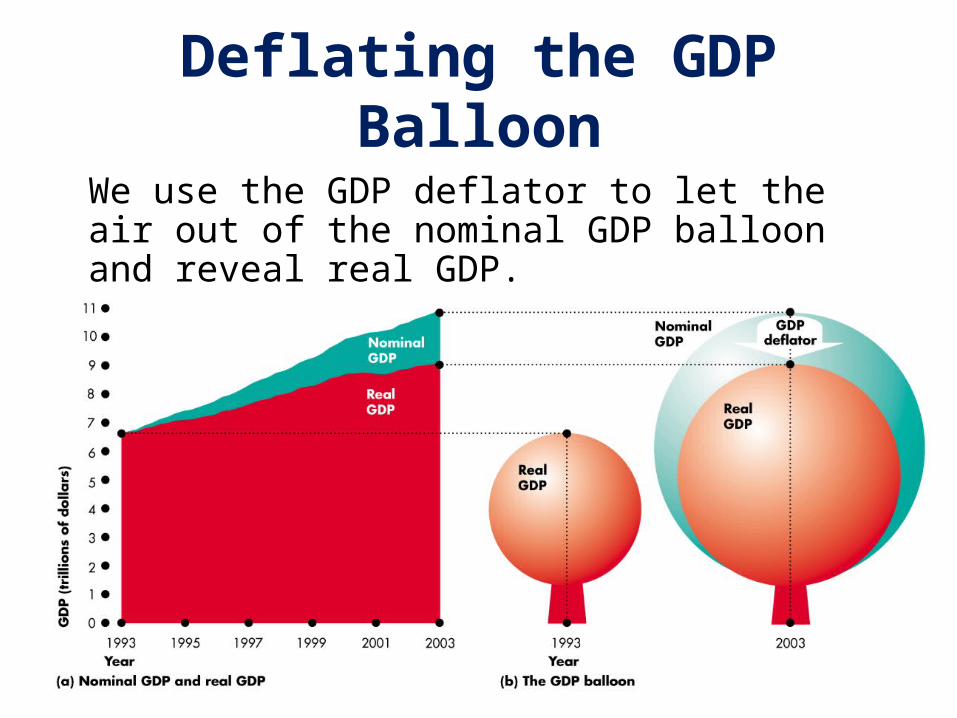
Deflating the GDP Balloon
We use the GDP deflator to let the air out of the nominal GDP balloon and reveal real GDP.
75
The Consumer Price Index
• The consumer price index (CPI) is a measure of the overall cost of the goods and services bought by a typical consumer.
• It is used to monitor changes in the cost of living over time.
• The producer price index, which measures the cost of a basket of goods and services bought by firms rather than consumers.
76
Reading the CPI Numbers
• The CPI is defined to equal 100 for the reference base period.
• The value of the CPI for any other period is calculated by taking the ratio of the current cost of a market basket of goods to the cost of the same market basket of goods in the reference base period and multiplying by 100.
77

Constructing the CPI
Constructing the CPI involves three stages:
• Selecting the CPI basket• Conducting a monthly price survey• Using the prices and the basket to calculate
the CPI
78
The Basket of the CPI in the US
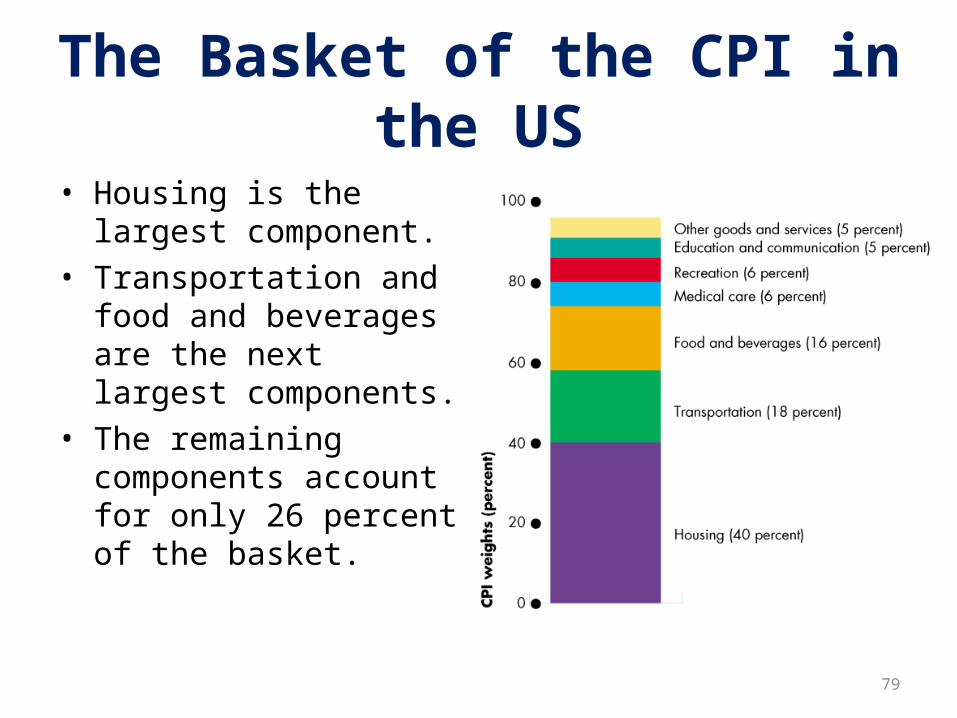
• Housing is the largest component.
• Transportation and food and beverages are the next largest components.
• The remaining components account for only 26 percent of the basket.
79
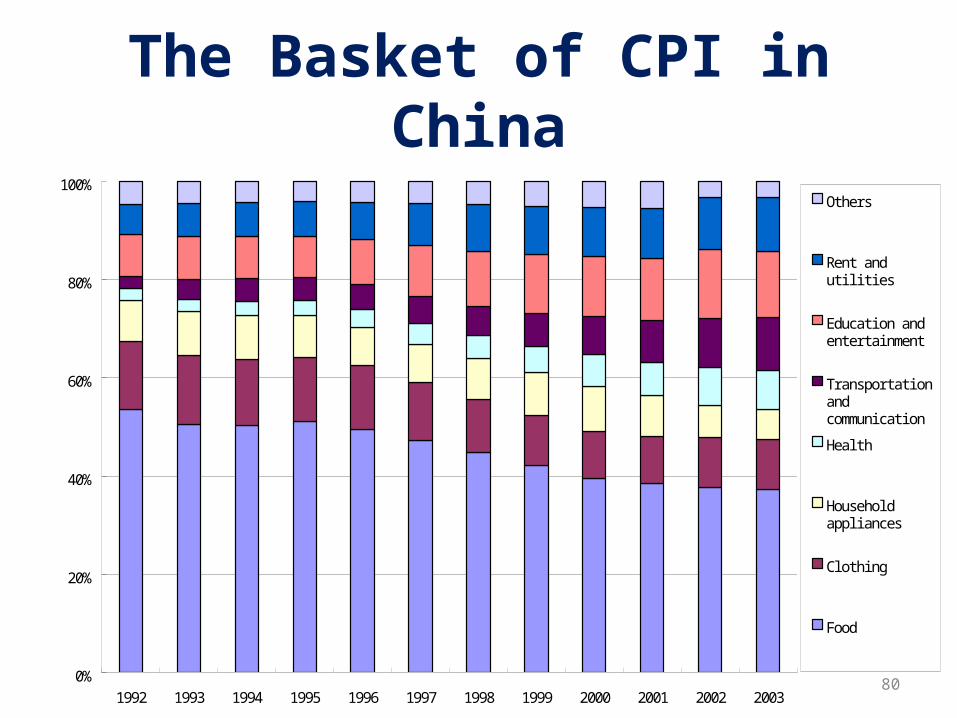
The Basket of CPI in China
80

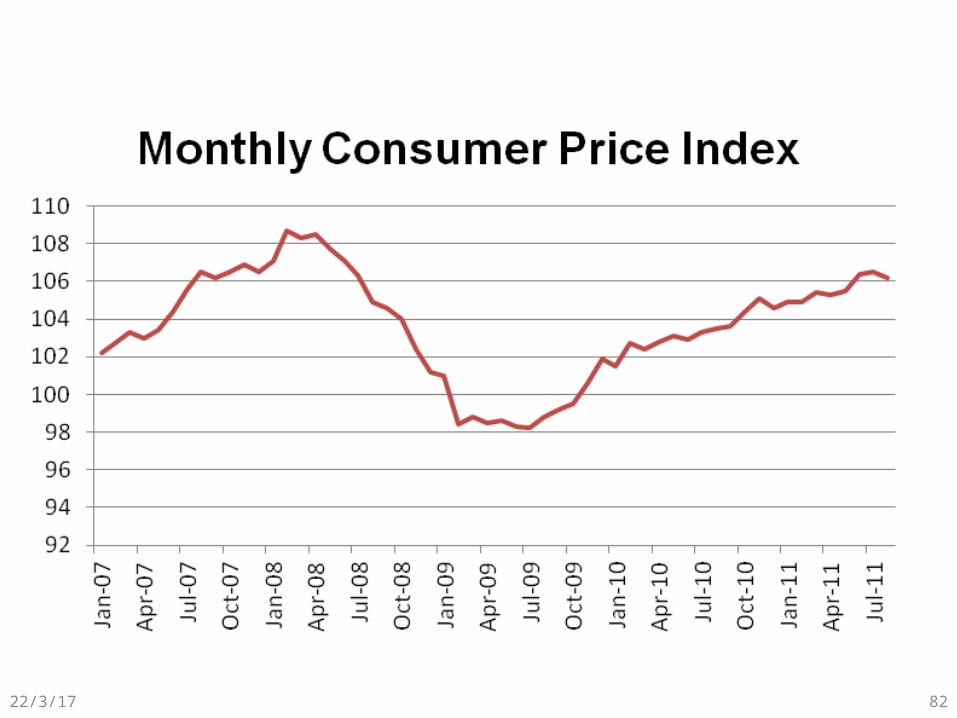
China’s CPI: 1978-2010
23/4/19 81
23/4/19 82
The Consumer Price Index
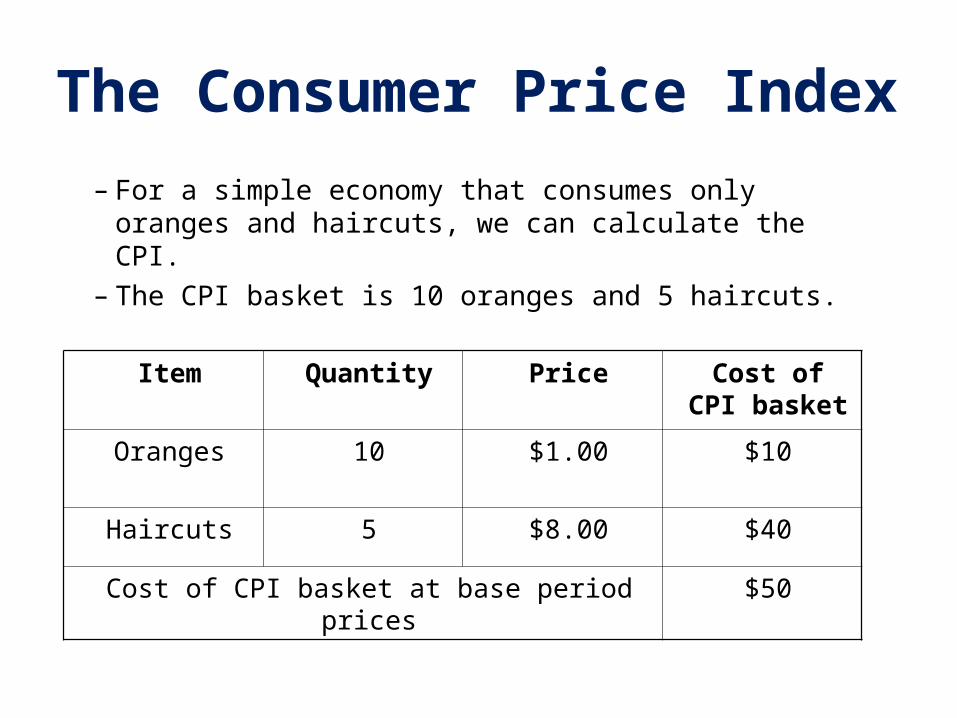
– For a simple economy that consumes only oranges and haircuts, we can calculate the CPI.
– The CPI basket is 10 oranges and 5 haircuts.
Item Quantity Price Cost of CPI basket
Oranges 10 $1.00 $10
Haircuts 5 $8.00 $40
Cost of CPI basket at base period prices $50
The Consumer Price Index
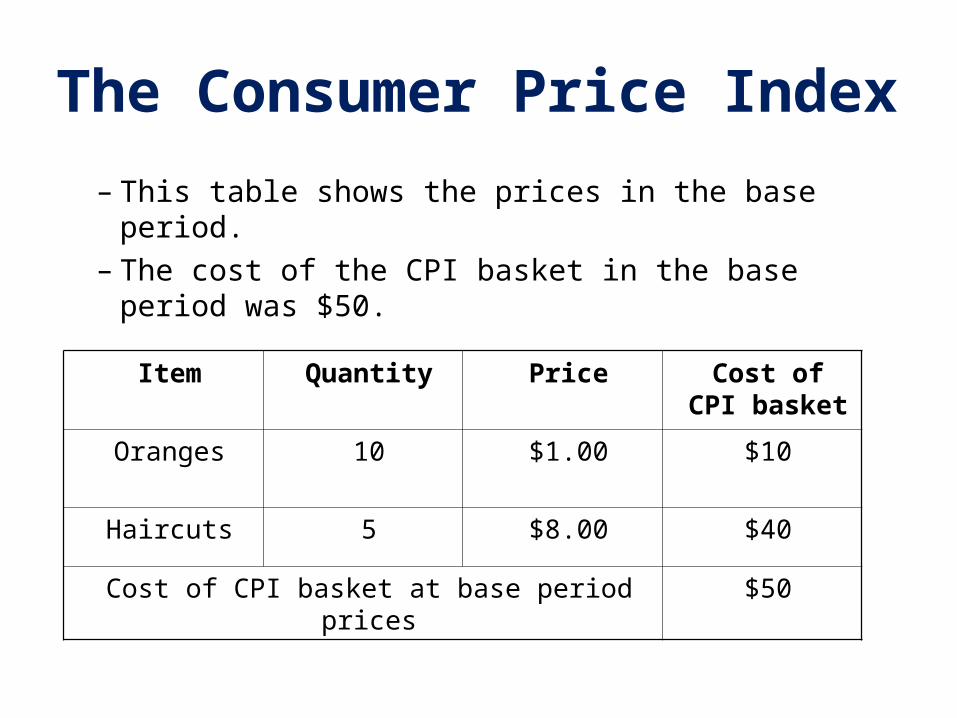
– This table shows the prices in the base period.– The cost of the CPI basket in the base period
was $50.
Item Quantity Price Cost of CPI basket
Oranges 10 $1.00 $10
Haircuts 5 $8.00 $40
Cost of CPI basket at base period prices $50

The Consumer Price Index
– This table shows the prices in the current period.– The cost of the CPI basket in the current period is
$70.
Item Quantity Price Cost of CPI basket
Oranges 10 $2.00 $20
Haircuts 5 $10.00 $50
Cost of CPI basket at base period prices $70
The Consumer Price Index
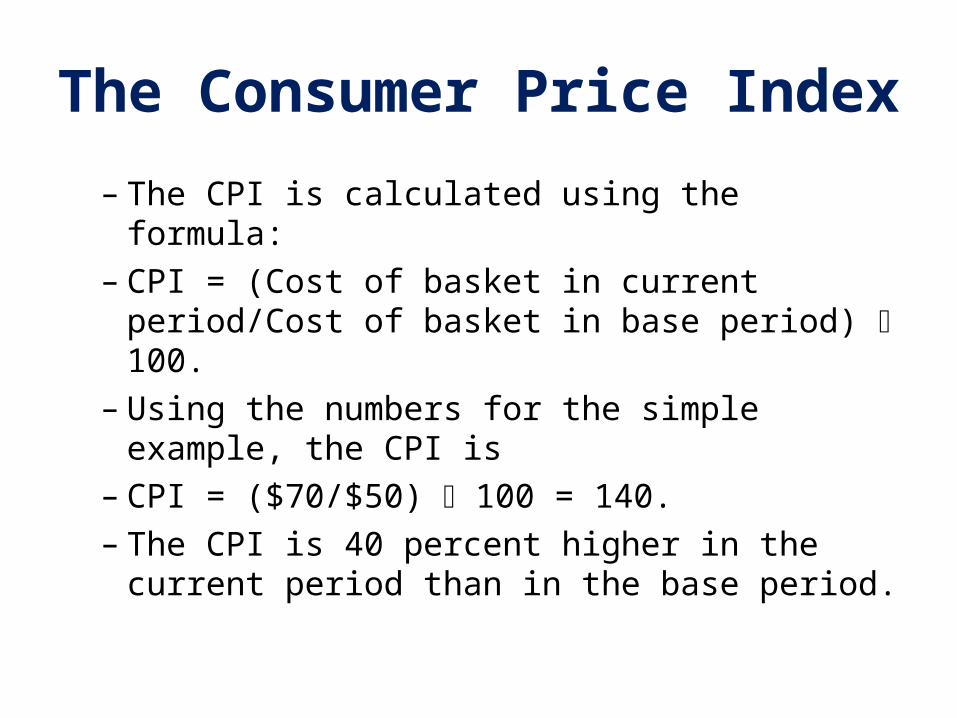
– The CPI is calculated using the formula:– CPI = (Cost of basket in current period/Cost of
basket in base period) 100.– Using the numbers for the simple example, the
CPI is– CPI = ($70/$50) 100 = 140.– The CPI is 40 percent higher in the current period
than in the base period.

Measuring Inflation
• The main purpose of the CPI is to measure inflation.
• The inflation rate is the percentage change in the price level from one year to the next.
• The inflation formula is:• Inflation rate = [(CPI this year – CPI last
year)/CPI last year] 100.
87
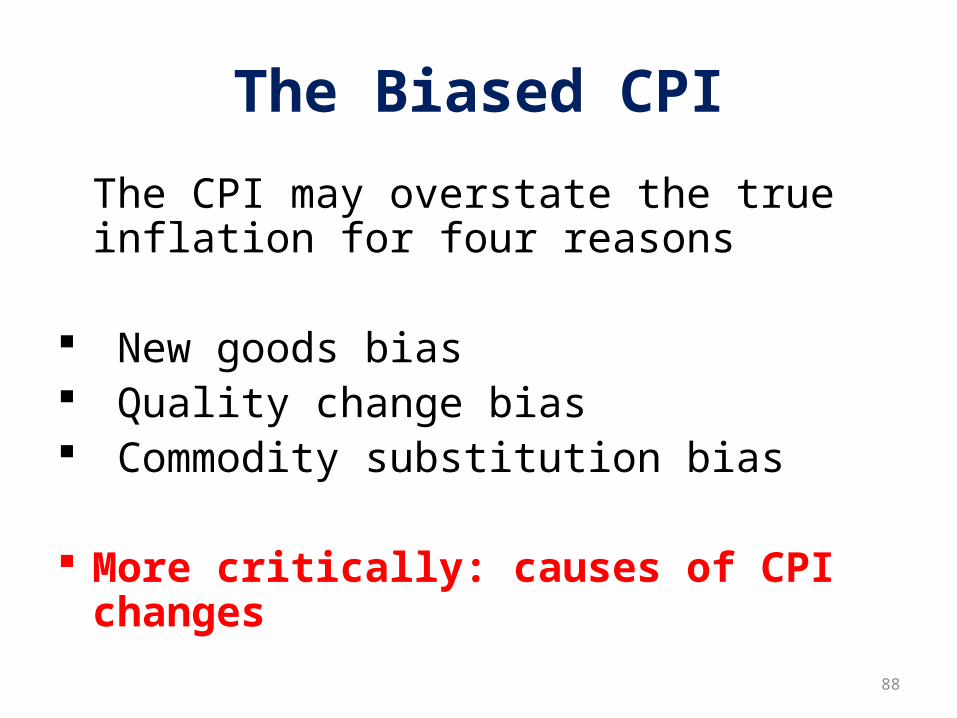
The Biased CPI
The CPI may overstate the true inflation for four reasons
New goods bias Quality change bias Commodity substitution bias
More critically: causes of CPI changes
88
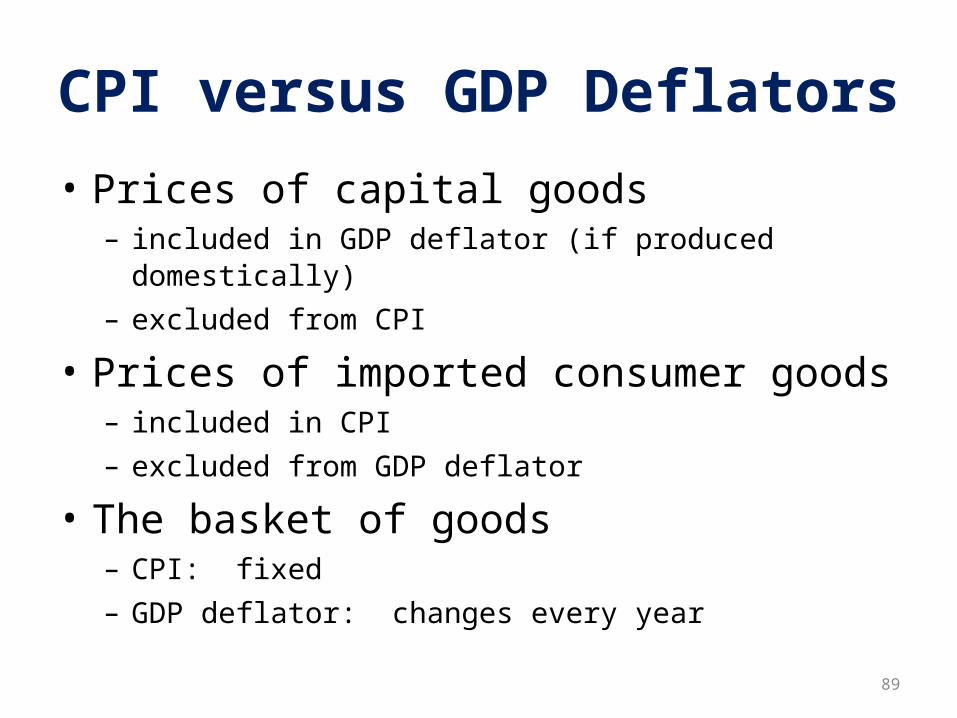
CPI versus GDP Deflators
• Prices of capital goods– included in GDP deflator (if produced domestically)– excluded from CPI
• Prices of imported consumer goods– included in CPI– excluded from GDP deflator
• The basket of goods– CPI: fixed– GDP deflator: changes every year
89
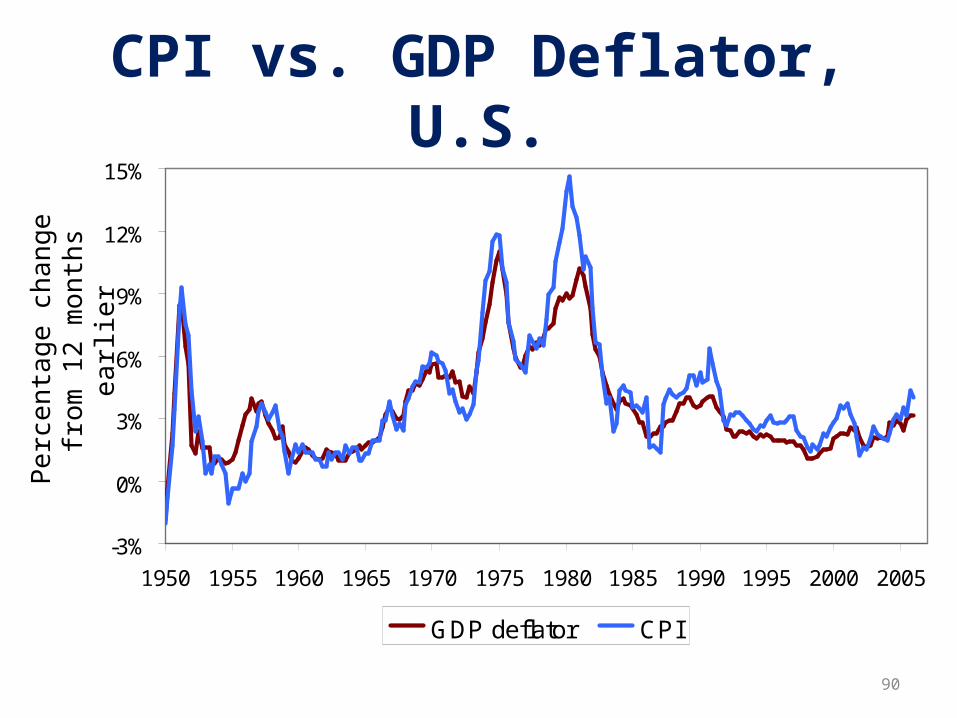
CPI vs. GDP Deflator, U.S.
90
Pe
rce
nta
ge
ch
ang
e fr
om
12
mo
nth
s e
arl
ier
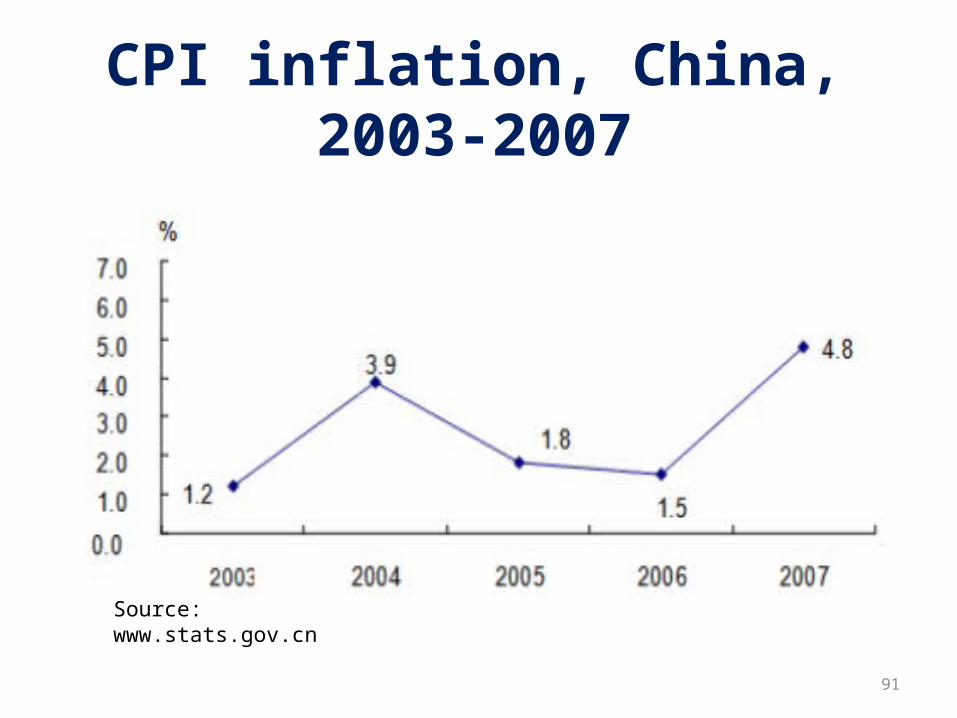
CPI inflation, China, 2003-2007
91
Source: www.stats.gov.cn

Inflation: still a problem?
92
Source: http://www.stats.gov.cn
Indexation
When some dollar amount is automatically corrected for inflation by law or contract the amount is said to be indexed for inflation.
93

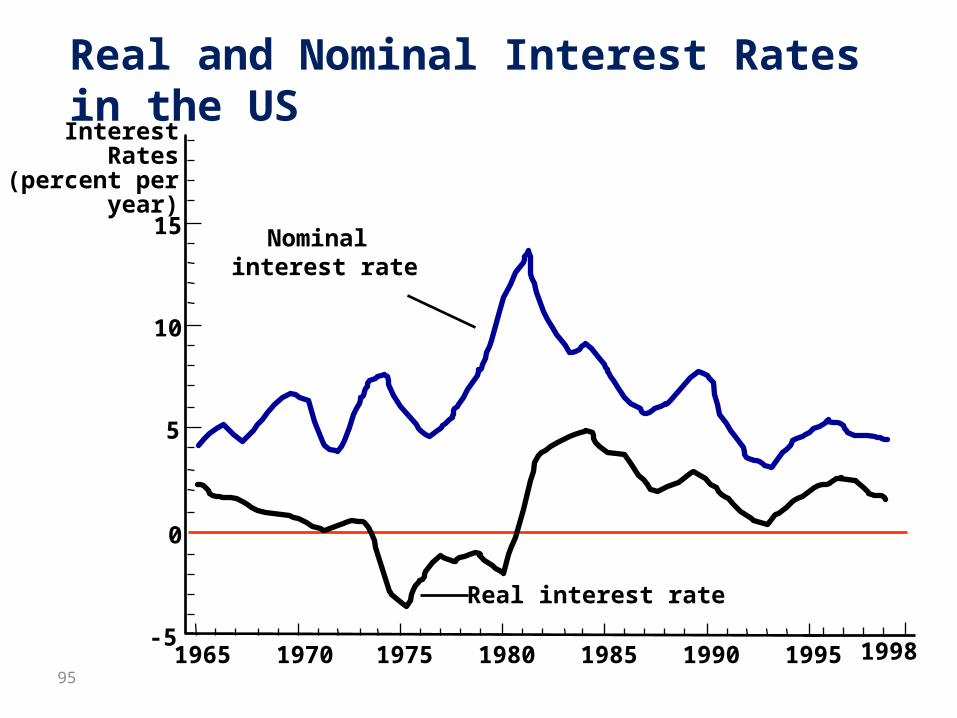
Real and Nominal Interest Rates
• The nominal interest rate is the interest rate not corrected for inflation; It is the interest rate that a bank pays.
• The real interest rate is the nominal interest rate that is corrected for inflation.
• Real interest rate = (Nominal interest rate – Inflation rate)
94
951965
Interest Rates(percent per
year)
15
10
5
0
-51970 1975 1980 1985 1990 1995 1998
Nominal interest rate
Real interest rate
Real and Nominal Interest Rates in the US